

Abstract
There is a significant need for fixed biological tissues with desired structural and material constituents for tissue engineering applications. Here, we introduce the lung ligament as a fixed biological material that may have clinical utility for tissue engineering. To characterize the lung tissue for potential clinical applications, we studied glutaraldehyde-treated porcine pulmonary ligament (n = 11) with multiphoton microscopy (MPM) and conducted biaxial planar experiments to characterize the mechanical property of the tissue. The MPM imaging revealed that there are generally two families of collagen fibers distributed in two distinct layers: The first family largely aligns along the longitudinal direction with a mean angle of θ = 10.7 ± 9.3 deg, while the second one exhibits a random distribution with a mean θ = 36.6 ± 27.4. Elastin fibers appear in some intermediate sublayers with a random orientation distribution with a mean θ = 39.6 ± 23 deg. Based on the microstructural observation, a microstructure-based constitutive law was proposed to model the elastic property of the tissue. The material parameters were identified by fitting the model to the biaxial stress–strain data of specimens, and good fitting quality was achieved. The parameter (which denotes the strain beyond which the collagen can withstand tension) of glutaraldehyde-treated tissues demonstrated low variability implying a relatively consistent collagen undulation in different samples, while the stiffness parameters for elastin and collagen fibers showed relatively greater variability. The fixed tissues presented a smaller than that of fresh specimen, confirming that glutaraldehyde crosslinking increases the mechanical strength of collagen-based biomaterials. The present study sheds light on the biomechanics of glutaraldehyde-treated porcine pulmonary ligament that may be a candidate for tissue engineering.
Keywords: microstructure, pulmonary tissues, mechanical properties, biaxial testing
Introduction
There is a need for biologically derived scaffolds for various tissue engineering applications (e.g., vessel and nerve grafts, prosthetic valves, patches, wound dressings, etc.). It is well known that thin and strong fixed biological tissues with primarily collagen and elastin are attractive for tissue engineering due to excellent biocompatibility and low toxicity [1,2]. The pulmonary ligament contains two serosal layers of pleura that are predominately composed of collagen and elastin fibers. It is a thin planar and elastic tissue that runs continuous with the aorta and medial border of the lungs. It drapes caudally from the lung root and loosely tethers the medial aspect of the lower lobe of the lung to the mediastinum [3,4]. A major function of the pulmonary ligament is to stabilize the lower medial portion of the lung. When the lung is displaced laterally away from the mediastinum, the pulmonary ligament is stretched [5]. The flexible structure, material stability and elasticity make the pulmonary ligament an excellent bioprosthetic candidate for potential clinical applications. The macroscopic mechanical properties and microscopic structure of the pulmonary ligament, however, have not been well established. This necessitates experimental studies on the macroscopic elastic behavior, visualization and quantification of fiber arrangement, and development of constitutive laws to characterize the stress–strain relation.
Biomaterials used as implants are typically crosslinked to reduce the antigenicity and to stabilize the tissue against proteolytic degradation in the host [6,7]. Glutaraldehyde is one of the most common chemical crosslinking reagents for collagen of engineered tissues [8,9] and natural tissues [10,11]. For instance, glutaraldehyde-treated porcine valve is used as bioprosthetic valves for heart valve replacement commercially (i.e., xenograft) [7]. The crosslinking alters the mechanical properties of biological tissue especially those with high collagen content [10,11]. Therefore, mechanical testing of glutaraldehyde-treated tissues is essential for understanding overall mechanical behaviors and clinical potential of pulmonary ligaments.
There have been numerous efforts to relate the macroscopic mechanical properties of tissue to the microstructures by using structure-based mechanical models. Some studies assume the tissue as a collagen fiber reinforced composite, of which the noncollagenous matrix material (including elastin fibers, cells, proteoglycans, glycoproteins, etc.) is a solid-like material that can take up load [12,13]. These models may not accurately predict stress level of individual fibers, however, since they do not account for collagen fiber undulation and elastin fiber distribution. Other models overcome this limitation by assuming the tissue as a composite of both elastin and collagen fibers and involving all microstructure [14–18]. The microstructural model proposed by Lanir [16,19] considered the fibrous tissue as a composite of elastin and collagen fibers embedded in a fluidlike matrix. This model which accounts for fiber volume fraction, the orientation and undulation distributions of elastin and collagen has been widely applied to various biological tissues [20–24]. To our knowledge, however, a microstructural model specific for the pulmonary ligament has not been developed.
A description of microstructure of pulmonary ligaments is also lacking in literature. The development of nonlinear imaging modality (MPM) has enabled noninvasive measurements of elastin and collagen in biological tissues. Two primary types of nonlinear modalities, two-photon excited fluorescence (TPEF) and second-harmonic generation (SHG) are usually combined to visualize tissue microstructure. TPEF is used to depict elastin that contains endogenous fluorophores, whereas the SHG signal originates from collagen type I that contains molecular noncentrosymmetric structures. MPM is well developed and implemented for imaging cells [25,26], biological specimens [27–29], and engineered tissues [30]. Quantitative measurements of coronary artery fiber structural parameters have been performed based on the MPM images [27,31]. The study of Chen et al. [27] obtained fiber geometrical parameters including orientation, dimensions, and undulation by manual processing of coronary specimens, while Schriefl et al. [31] proposed an automated method for the extraction and quantification of fiber orientations. Simultaneous loading-imaging was also developed to track and quantify structural change of elastin and collagen fibers of vascular tissues, which provided the microstructural mechanical responses of individual fibers to enable an in-depth understanding of blood vessel biomechanics [27,28,32–34].
The goal of the present study is to determine the microstructure (using MPM) and material properties (using biaxial testing) of lung ligament to formulate a structure-based model of the tissue for future tissue engineering applications. The MPM imaging was performed to obtain the orientation distributions of elastin and collagen fibers, which were incorporated into a structural model to predict the nonlinear responses of the ligament. The effect of glutaraldehyde fixation was considered by comparison of mechanical behavior of fresh and fixed tissue. The microstructural model identifies the microstructure that determines the overall mechanical properties and accurately predicts the macromechanical biaxial responses of the tissue to mechanical load.
Methods
Material Preparation.
Porcine lungs (n = 11) were obtained from a local abattoir and transported en bloc for processing. Within 2 hrs of explant, pulmonary ligament section was carefully dissected from the caudal third of the lung and a hole was punched at the top and bottom to denote anatomic y-axis (i.e., longitudinal direction of specimens) which was maintained throughout the studies (both mechanical testing and microscopy). A 2.5 × 2.5 cm2 section in the center of marked area was cut off using a custom tissue stamp. Specimens were laid flat and rinsed in 0.9% NaCl saline solution. A square gage section about 1 × 1 cm2 was marked in the middle of the specimen with four ink markers at the corners and a fifth one at the center to track tissue deformation during testing. Six samples (n = 6) were fixed in 0.25% buffered glutaraldehyde solution at 23 °C for a minimum of 24 hrs prior to biaxial studies. Two fresh samples (n = 2) were kept in 4 °C saline solution and tested within 24 hrs postharvest for biaxial strain testing. The other fresh specimens (n = 3) were kept in 4 °C saline solution and used for imaging study within 24 hrs.
Planar Biaxial Experiments.
Planar biaxial test was conducted on a biaxial testing device (ElectroForce TestBench, Bose Corporation, Eden Prairie, MN). Before testing, the tissue thickness was measured with a digital micrometer (Micrometers #06385421, MSC Industrial Supply, Melville, NY) at five locations in an unloaded state, one at the specimen center and the other four at the corners of the specimen. In a testing chamber filled with 37 °C saline, the specimen was secured by metal hooks along each of the four edges, which were, respectively, connected to a self-balancing post via suture threads as shown in Fig. 1. One load cell in each loading direction (denoted as and , respectively) was mounted for force measurement. The specimen was oriented so that the circumferential and longitudinal directions of a porcine lung coincided with and axes, respectively (i.e., is along the marked longitudinal direction). A motion tracking CCD camera was mounted above the specimen for strain measurement within the gage section.
Fig. 1.
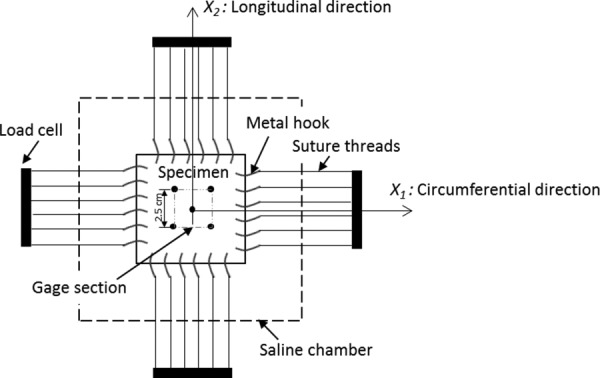
A schematic figure of biaxial testing setup
A strain-controlled mode was employed where the displacement of the edges of the sample was prescribed to create a homogeneous deformation field within the gage section. Multiple testing protocols were conducted as follows: = 1:2, 1.3:2, 2:2, 2:1.3, 2:1. = 2:2 is an equibiaxial loading condition ( denote global strains in the circumferential and longitudinal directions, respectively). The mechanical testing showed that precondition of 10 loading–unloading cycles on specimens can eliminate the viscoelastic response and produce reproducible curves. An additional 10 cycles were done to ensure there was no load cell drift during mechanical testing. For each specimen, an entire test lasted up to 1.5 hrs, and enzymatic degradation was not induced as the tissue was either fixed or tested within 24 hrs. The strains and loads along the two axes were recorded for each protocol. By confirming that the stress–strain curves converge after the loading–unloading cycles (preconditioned), the loading curve of the last cycle was chosen for determination of material parameters.
Multiphoton Microscopy.
Fresh pulmonary ligament specimens (n = 3) were viewed by an FV1000-MPE multiphoton microscope equipped with a Spectra Physics MaiTai Deep See laser tunable from 710 to 990 nm (Olympus America, Center Valley, PA). SHG and TPEF modalities were combined to visualize collagen and elastin fibers simultaneously [27,28,35]. The average excitation power at the sample was approximately 40 mW with an excitation wavelength of 830 nm. The SHG signal from collagen and TPEF signal from elastin were separated from each other and directed toward two photomultiplier tube detectors by a dichroic mirror. SHG image for collagen and TPEF image for elastin were collected at the same time (Fig. 2). Samples were viewed using a 25X water-immersion objective (Olympus America, Center Valley, PA), and each acquired image (with resolution of ∼1.0 μm/pixel) covered an area of 508 × 508 μm2 and was integrated over two frames to improve the signal-to-noise ratio. For each scan site, images were obtained starting from the top surface of the sample toward the bottom of the sample in the Z-direction, i.e., at various depths of the tissue, and the step size between slices was set at 4.0 μm. For all specimens, the position where tissue structure begins to appear in field of view was considered as the initial z position (i.e., z = 0).
Fig. 2.
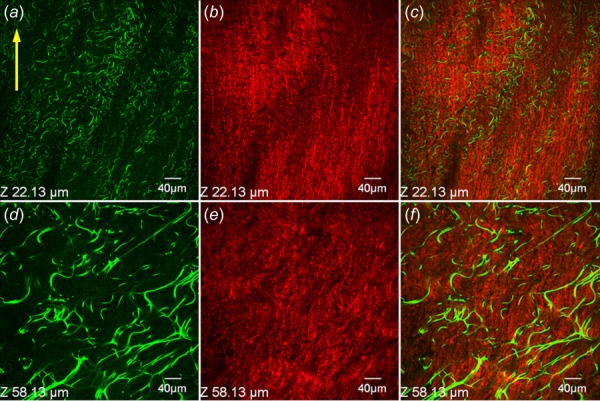
Representative SHG and TPEF images demonstrating collagen and elastin structure at different depths of an unloaded pulmonary ligament specimen. (a, d) TPEF images for elastin, (b, e) SHG images for collagen, and (c, f) merged images. Row-wise: Z = 22.1 and 58.1 μm. columnwise: elastin, collagen, merged.
Since we observed that fibers of undeformed samples were too dense and wavy to render the orientation (Fig. 2), stretched specimens were imaged (Fig. 3). Specimens were placed in a silicone elastomer-bottom dish, equally stretched in both axial directions () and pinned on four edges to maintain a loaded state. An equibiaxial loading protocol preserves the initial fiber arrangement. Specimens were then covered by a coverslip and placed on a microscope stage. For each sample, two locations were selected randomly and scanned within the marked square gage section. The longitudinal direction of specimen was maintained during imaging as marked by an arrow in Figs. 2 and 3. Moreover, the top and bottom surfaces of pulmonary ligament sections were easily distinguished since the top texture was polished and the bottom was coarse, so the specimen was placed in dish with the polished surface facing up during imaging.
Fig. 3.
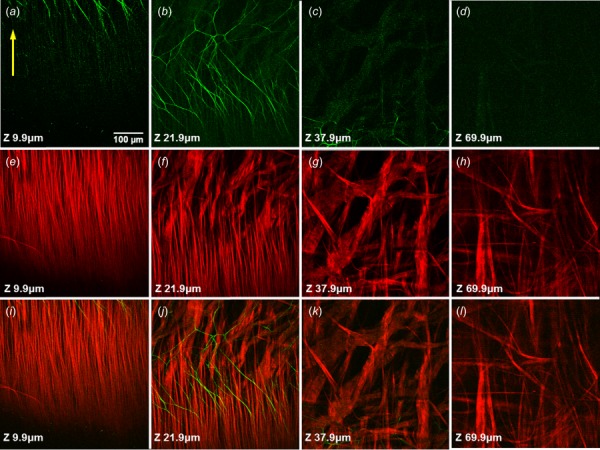
Representative SHG and TPEF images demonstrating fiber arrangement at different depths of a specimen under equibiaxial stretch (). Row-wise: elastin, collagen, merged; columnwise: Z = 9.9, 21.9, 37.9, and 69.9 μm.
Quantitative Measurement of Fiber Orientation.
Measurement of fiber orientation was conducted on MPM images. For each sample, images at ten different depths of the tissue were processed. The centerlines of individual fibers were drawn manually and then smoothed through B-spline interpolation using matlab (The MathWorks, Natick, MA) [14,27]. The orientation angle of a single fiber was determined by the angle between direction of the centerline and longitudinal direction of specimen, while the longitudinal direction of specimen was set as 0 deg and the circumferential direction as 90 deg. The mean angles of fibers at different depths were obtained by averaging over six sites of three specimens.
Microstructure-Based Constitutive Equation.
Under the state of plane-stress (thickness is very small compared with the length and width of the specimens tested), the stress component of ligament tissue, related to the out-of-plane direction , vanish, i.e., . The ligament tissue can be modeled as an incompressible composite with collagen and elastin fibers as the major structural elements that are responsible for the elastic property. All other components are treated as fluid and can only sustain hydrostatic pressure. This assumes that the tissue undergoes affine deformations; i.e., the deformation of the fibers is the same as that of the fluid-type ground substance [15,16]. It follows that the strain energy of the pulmonary ligament can be represented by the volume-weighted summation of that of the individual collagen and elastin fibers; namely [14,15] as
| (1) |
where is the total strain energy which is a function of the Green–Lagrange strain tensor , and are the total strain energies of the elastin and collagen fibers, respectively.
The strain energy function of a microstructural model involves structural features. Previous experimental studies showed the orientation of fibers follows a distribution density function, the volume weighted strain energy of the fibers thus can be written as follows [14,15]:
| (2) |
where is the volume fraction of type i fibers (i = e, c) and is the strain energy of individual fibers as a function of fiber strain . is the orientation distribution density function of i fiber family and is the angle between the fiber orientation and the coordinate axis . satisfies the normalization criterion . The uniaxial fiber strain is determined by the local strain tensor and the reference fiber orientation as: , with . The second Piola–Kirchhoff stress of each type of fiber is derived as
| (3) |
Our MPM imaging studies show that pulmonary ligament is a layered structure with densely packed fiber sheets. Collagen fibers present significant transmural heterogeneity, while elastin only distributes in some intermediate sublayers with a netlike structure as shown in Fig. 3. There are two major families of collagen fibers: the first family of collagen fibers largely aligns along the longitudinal direction in the superficial layers (Figs. 3(e) and 3(f)), while the second family exhibits a random distribution in the deep layers (Figs. 3(g) and 3(h)). Although there are a few radial fiber bundles distributing between sheets, those fibers are not engaged under biaxial loading condition where they are compressed and bear no loads. Based on this information, the fiber orientation of elastin is assumed to follow a uniform distribution, i.e., . The strain energy of elastin fibers can be given as
| (4) |
The superficial layers of collagen fibers align along the longitudinal direction, which is the -axis, thereby having a constant fiber angle, . It follows that the uniaxial stress in the fibers depends on only the strain component in the longitudinal direction; i.e., . Therefore, the strain energy of the first family of collagen fibers is written as follows:
| (5) |
where is the volume fraction of the first family of collagen fibers. The second family of collagen fibers is uniformly distributed. Therefore, similar to elastin fibers, we have
| (6) |
where is the volume fraction of the second layers of collagen fibers. The total strain energy of collagen fiber is . It is noted that the volume fractions of the two collagen fiber families are defined with respect to the collective volume of both elastin and collagen fibers, i.e., .
According to microscopic responses of individual elastin fibers under mechanical loads [27,28], the elastic properties was assumed to be linear
| (7) |
where is the stiffness parameter. Due to the wavy nature of collagen fibers, the following nonlinear constitutive relation is adopted to account for the nonlinear elastic behavior [15], i.e.:
| (8) |
where is the stiffness of collagen fibers, denotes collagen straightening strain where below , the collagen fiber is undulated, while above the collagen becomes straightened to withstand tension is a parameter characterizing the nonlinear stress–strain response of collagen.
Substituting the above constitutive equations for elastin and collagen fibers (Eqs. (7) and (8)) into Eq. (3), we obtain the following form for the second Piola-Kirchhoff stress tensor as:
| (9) |
The Cauchy stress tensor is determined by with is the deformation gradient tensor, is the second-order identity tensor, scalar is hydrostatic pressure that acts as a Lagrange multiplier. The first integral on the right hand side of the above equation has an analytical expression. The second integral generally does not have an analytical expression, however, because is a nonlinear function of the integration variable through and . Therefore, we utilize numerical integration to determine the second integral during the process of curve fitting. To simplify the problem of curve fitting, we further combine the stiffness parameters and the volumetric fraction of each family of fibers (i.e., elastin and the two familiars of collagen) because the stiffness parameters are constant and can be taken out of the integrals, and denote , , and as the effective fiber stiffness parameters. We have determined the five material parameters; i.e., , , , and , which were estimated by fitting Cauchy stress predicated by Eq. (9) to the experimental data. It is noted that all parameters should be positive due to the elliptical form of strain energy function.
For thin membrane tissues, the tension exerted by the strained fiber network on the tissue surface will be small compared with the tension within the tissue surface. In addition, the equilibrium requires the sum of this small tension and the hydrostatic pressure to vanish due to the absence of traction on the surface. Therefore, we may conclude that the hydrostatic pressure is negligible compared with the in-plane tensions exerted by the fiber network [19].
Data Processing and Material Parameter Estimation.
The measurements of the biaxial experiments were the total forces () along the stretching directions measured by the load cells, and the Green–Lagrange strain tensor in the gage section of the specimen. The principal stretches were converted from the normal strain tensor components by , (). The normal Cauchy stress components were then derived from the resultant forces as
| (10) |
where is the side-length of the square specimen in the reference configuration. Since the ligament specimen is very thin, stress components were calculated per unit length to avoid thickness measurement errors. The unit of stress is force per unit length (N/mm), and the corresponding material constants in three-dimensional elasticity (force per unit area; i.e., kPa or MPa) were obtained by dividing by the mean thickness of the specimens (H = 64 ± 13 μm) as listed in Tables 1 and 2.
Table 1.
Estimated material parameters of fresh and glutaraldehyde-treated specimens, respectively, based on equibiaxial testing data (mean value). The values are indicated for the normal stress tensor components and , respectively.
| Specimen | (kPa) | (MPa) | (MPa) | (-) | (-) | ||
|---|---|---|---|---|---|---|---|
| Fresh tissue | 140.6 | 156.3 | 94.2 | 0.27 | 3.92 | 0.86 | 0.98 |
| Fixed tissue | 156.3 | 47.7 | 251.6 | 0.19 | 3.88 | 0.94 | 0.99 |
Table 2.
Estimated parameters and the values for the normal stress tensor components and , respectively, of the individual glutaraldehyde-treated specimens
| Sample | (kPa) | (MPa) | (MPa) | (-) | (-) | ||
|---|---|---|---|---|---|---|---|
| 1 | 89.1 | 148.8 | 125.3 | 0.25 | 3.37 | 0.993 | 0.995 |
| 2 | 148.4 | 79.4 | 232.8 | 0.20 | 2.58 | 0.989 | 0.989 |
| 3 | 54.7 | 109.1 | 148.3 | 0.23 | 3.29 | 0.992 | 0.995 |
| 4 | 193.8 | 148.8 | 74.4 | 0.12 | 2.04 | 0.978 | 0.993 |
| 5 | 368.8 | 96.3 | 457.8 | 0.13 | 2.51 | 0.989 | 0.989 |
| 6 | 209.4 | 78.4 | 309.4 | 0.26 | 2.51 | 0.964 | 0.991 |
| Mean (±SD) | 177.3 (±101.3) | 110.1 (±29.2) | 224.7 (±129.0) | 0.20 (±0.06) | 2.72 (±0.51) |
The stress–strain data were then fitted by the functional form of the normal Cauchy stress tensor components using the least-square method. The material parameters, , , , , and , were identified by minimizing the sum of squares of the errors between the modeled stress components and those of the experiments, i.e.,
| (11) |
where and (j = 1,2) are the modeled stress components and the experimental values, respectively, at the -th data point, and is the total number of data points. The value (i.e., the coefficient of determination or the correlation index) for the normal stress tensor components and was calculated as . All biaxial protocols were used for the analysis of glutaraldehyde-treated tissues (Figs. 6 and 7 and Table 2), and only equibiaxial loading protocol was used for fresh tissues (Fig. 5 and Table 1). The equibiaxial data of fresh and fixed tissues were compared to assess the effect of glutaraldehyde crosslinking treatment.
Fig. 6.
The stress–strain curves of a representative glutaraldehyde-treated sample under three biaxial protocols = 1.3:2, 2:1.3, 2:2. Symbols and solid lines denote experimental data and model predictions, respectively.
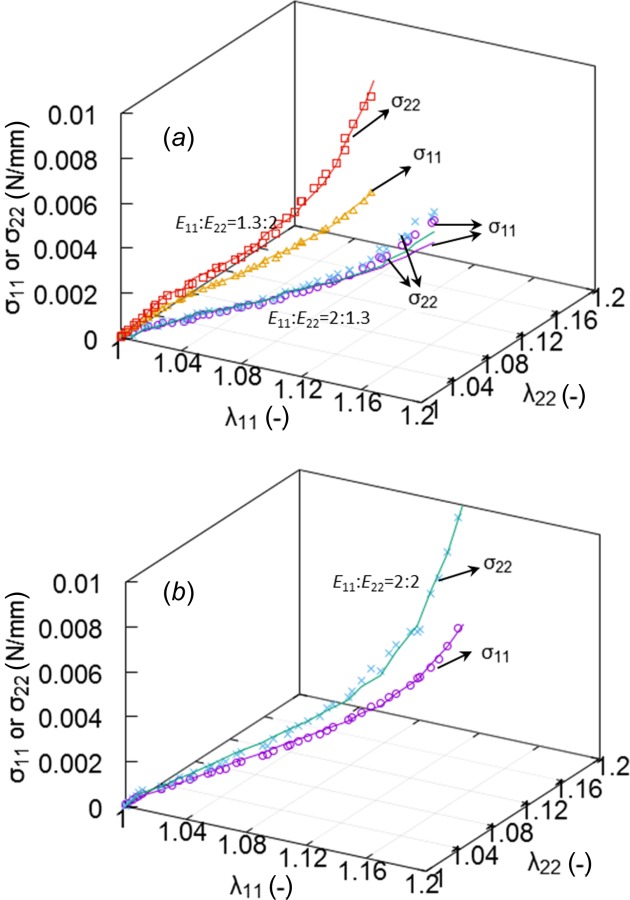
Fig. 7.
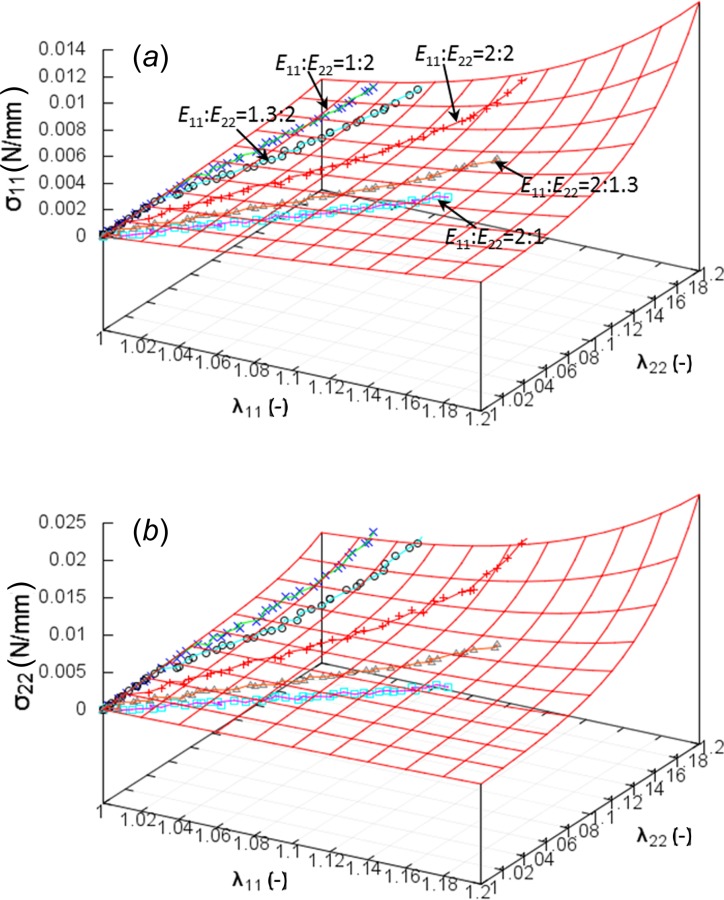
The stress–strain curves of a representative glutaraldehyde-treated sample under all biaxial protocols. Symbols and solid lines denote experimental data and model predictions, respectively.
Fig. 5.
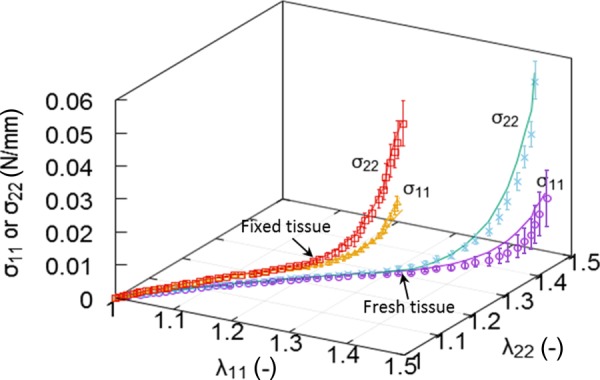
The stress–strain curves of fresh and glutaraldehyde-treated pulmonary ligaments, respectively, based on equibiaxial testing data. Symbols denote experimental mean stress components, and solid lines denote model predicted stresses. Error bar indicates standard error.
Results
Figures 2 and 3 demonstrate the SHG images of collagen and TPEF images of elastin in the unloaded and stretched states, respectively. Figure 2 showed that pulmonary ligament contains abundant elastin fibers in addition to collagen fibers, although it did not render the fiber arrangement due to natural fiber undulation. The fiber alignment is distinctly apparent at equibiaxial loaded state as shown in Fig. 3. The images of the first column were made superficially at depth of Z = 9.9 μm, showing a longitudinal arrangement of the collagen fibers with a few elastin fibers. In penetrating deeper into the tissue at Z = 21.9 μm, an intermediate layer of collagen fibers appears, exhibits fiber arrangement transition: from uniformly longitudinal distribution to relatively random distribution. The dimensions of collagen fiber bundles increase significantly in this transition. Many elastin fibers appear in this layer and present net-like structure. At deeper layers (Z = 37.9 μm and Z = 69.9 μm), large collagen bundles predominate the structure and distribute randomly without a preferred direction while elastin fibers are nearly absent. It is observed that tissue stretching dilutes the fiber concentrations, especially for the elastin fibers that appear less abundant as compared to the unloaded state.
The quantitative measurements of fiber orientation angle on these images are presented in Figs. 4(a) and 4(b). The mean orientation variations of six locations of three specimens were plotted in Fig. 4(c). These data demonstrate that collagen fibers largely align along the longitudinal direction with a mean θ = 10.7 ± 9.3 deg in the superficial layers, and randomly distribute in the deep layers with a mean angle around 40 deg and a large SD, e.g., the mean orientation angle is θ = 36.5 ± 27 deg at Z = 46 μm. Elastin fibers appear in intermediate layers with a mean orientation θ = 39.6 ± 23. Moreover, MPM Imaging studies showed that glutaraldehyde-treatment has negligible effects on transmural arrangement of fibers (This material is available under the “Supplemental Materials” tab for this paper on the ASME Digital Collection).
Fig. 4.
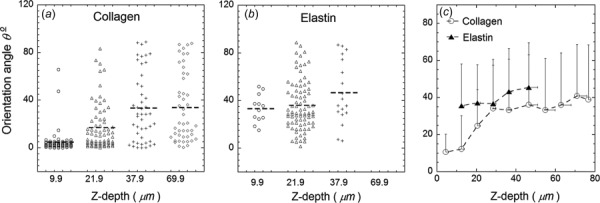
Quantitative measurement of fiber orientation angle based on SHG and TPEF images. (a) and (b) Fiber orientation angle measured based on images in Fig. 3. (c) The mean orientation angle at ten different depths of pulmonary ligament specimens. Error bar indicates standard deviation.
Figure 5 shows the stress–strain curves of fresh and fixed ligaments, respectively, based on equibiaxial testing data. Symbols denote experimental mean stress components, and solid lines denote model predicted stresses. The result indicates that both fresh and glutaraldehyde-treated ligaments present a strong nonlinear response. The longitudinal stress σ22 is higher than circumferential stress σ11 for both tissues consistent with the ligament function of the tissue. The stresses of fixed ligament, however, began to rise at a steep slope prior to that of fresh tissue. The predictions were in good agreement with experimental measurements on the nonlinear and anisotropic responses. Table 1 lists the estimated material parameters, i.e., , , , , and , of the fresh and fixed specimens and the corresponding values for the normal Cauchy stress tensor components, and . The parameters = 0.27 of fresh ligaments were significantly larger than that of glutaraldehyde-treated ligaments = 0.19.
The relationships between the Cauchy stresses () and the stretches in the circumferential () and longitudinal () directions of different experimental protocols of a representative fixed sample were provided in Figs. 6 and 7, where symbols and solid lines denote experimental data and model predictions, respectively. Figure 6 shows the stress–strain curves under three biaxial protocols = 1.3:2, 2:1.3, 2:2. Protocol = 2:1.3 presents an approximately isotropic behavior; i.e., longitudinal stress is nearly identical to circumferential stress, while = 1.3:2 depicts a very strong anisotropic response that longitudinal stress is much higher than circumferential stress as seen in Fig. 6(a). The equibiaxial protocol = 2:2 presents less anisotropic response than that of = 1.3:2 as shown in Fig. 6(b). Stress–strain curves of all biaxial protocols are shown in Fig. 7. The protocols with smaller ratio of ; e.g., = 1:2 and 1.3:2, lead to significant anisotropic behavior, while large ratios = 2:1 and 2:1.3 show nearly isotropic responses. Table 2 lists the five estimated material parameters of the six specimens and the corresponding values for the normal Cauchy stress tensor components, and . The mean and SD of the estimated parameters are also presented. The parameters (0.20 ± 0.06) and (2.7 ± 0.51) demonstrated less specimen-to-specimen variability, while the stiffness parameters for the elastin and the two layers of collagen fibers showed relatively greater variability (: 177.3 ± 101.3 kPa, : 110.0 ± 29.2 MPa, and : 224.7 ± 129.0 MPa). The parameters of Table 2 showed significant differences with those of Table 1, especially for and (110.1 versus 47.7 and 2.72 versus 3.88), which were due to different loading protocols used for the fits.
Discussion
A microstructural strain-energy function was proposed based on MPM measurements of collagen and elastin fiber arrangement in pulmonary ligament. The imaging revealed that there are two families of collagen fibers distributing in distinct sublayers: the first family of collagen fibers aligns along the longitudinal direction in superficial sublayers, while the second family presents random distribution in deeper sublayers. Elastin fibers distribute in intermediate layers resembling a netlike structure. The microstructural material properties and geometrical distributions determine the macroscopic nonlinear and anisotropic mechanical behavior of pulmonary ligament.
The mechanical properties of individual fibers have been broadly studied in various tissues [19,27,28,36–38]. Elastin fibrils have relatively lower stiffness and larger deformability, which mechanically supports the tissue at low load state where collagen fibers are undulated and do not withstand loads. At high pressure, collagen fibers become straightened and engaged to take up most of the load, so the tissue becomes stiff to prevent overstretch and rupture. The undulated nature of the collagen fibers and the gradual recruitment upon tissue deformation result in a nonlinear stress–strain relation of collagen-based biological tissue. The present MPM imaging revealed the fiber arrangement in porcine pulmonary ligament, and led to an accurate prediction of macroscopic mechanical responses when integrated with fiber mechanical properties (i.e., Eqs. (7) and (8)). The longitudinally aligning collagen fibers resulted in larger longitudinal stress than circumferential stress under equibiaxial protocol (Fig. 5) which confirmed the anisotropic property of pulmonary ligament. When further stretching specimens in the circumferential direction (i.e., protocol = 2:1.3), the low rapidly increased as collagen fibers were stretched to carry loads in this direction, showing nearly isotropic behavior, i.e., in Fig. 6(a). On the contrary, larger stretching in the longitudinal direction led to a much higher .
In the microstructural model, elastin stiffness and content are described by the material parameter , when the collagen stiffness, nonlinearity and undulation are described by three parameters (, , ). The low estimate of (Tables 1 and 2) is induced not only by its intrinsic compliance but also by the relatively low content of elastin fibers in ligament. The combination of and describes the mechanical properties of a single collagen fiber, and also accounts for collagen volume fraction in the ligament. The parameter indicates the crimp of collagen fibers, beyond which the recruitment of collagen fibers starts. Compared with other parameters, the estimated value of parameter of glutaraldehyde-treated tissues demonstrates less variability (0.20 ± 0.06) as shown in Table 2, which may manifest a relatively consistent collagen tortuosity in different samples. The proposed model accurately predicted the nonlinear responses of pulmonary ligament as shown in Figs. 5–7 where the tissue becomes stiff at high strains as a result of collagen fibers becoming engaged to withstand loads.
The estimated of glutaraldehyde-treated tissues (either in Table 1 or 2) is smaller than that of fresh tissue = 0.27, in line with the greater fiber engagement of fixed tissue as shown in Fig. 5. It has been reported that glutaraldehyde crosslinking greatly improves the mechanical strength of collagen-based biomaterials [8,9]. Crosslinking treatment forms bonds between collagen molecules, which strengthen collagen fibers by preventing the long rodlike molecules from sliding past each other under stress [8,9,39–41]. As a result, fixed tissues present a short linear regime, i.e., earlier recruitment of collagen fibers than that of fresh tissues. It has also been shown that the stiffness of collagen gel increases with higher glutaraldehyde concentration [9,42]. This feature may be useful for biomaterials design, such as selecting a stiffness range of ligament bioprosthesis for a specific medical application.
The porcine pulmonary ligament may be used as a bioprosthetic material similar to porcine pericardium or small intestinal submucosa (SIS) [43,44]. It was reported that pericardium tissue is nonthrombogenic and naturally resist infection [44], and it has long been used in cardiac and aortic valve repair [45–47]. The relatively thicker (0.2–0.3 mm) pericardial tissue [48,49], however, cannot be used in some medical applications that require thinner tissues (e.g., venous valves). SIS has been used for wound dressing [50–52], pericardial reconstruction, carotid repair, etc. [53,54]. This tissue, however, may have potential immunogenicity issues [44]. The ultrathin pulmonary ligament (∼64 μm thickness) contains abundant elastin fibers that minimize intramural stress and are not affected by fixation [55]. The elastin content and overall compliance are of importance when considering some natural tissues (e.g., venous valve) need deform at low pressures and flows. In addition to mechanical properties, the mesothelial layers on both sides of pulmonary ligament are thrombosis resistant [56,57].
There are some limitations in the present study. First, we assumed the first family of collagen fibers completely aligns toward the longitudinal direction despite the sample-to-sample variability in alignment between the fiber directions and the anatomical directions. This along with the potential animal-to-animal variability may be responsible for significant dispersions observed in some of the microstructural parameters. Second, other geometrical parameters, such as initial fiber dimensions, collagen undulation, and fiber volume fractions could not be determined since the microstructure was measured on stretched specimens. Simultaneous loading–imaging should be performed to reveal microscopic responses of individual fibers of ligament tissue under various mechanical loads in future studies. Finally, we assumed that the pulmonary ligament tissue undergoes quasi-static deformation and utilized a 0.1 Hz loading frequency in the experimental protocols. The effect of strain rate should be taken into consideration if the intended application of the tissue involves dynamic deformation and high strain rate.
Conclusion
Multiphoton microscopic imaging was conducted to determine the microstructure of porcine pulmonary ligament tissue, based on which a microstructure-based constitutive law, namely, a strain-energy function, was proposed. The material parameters of the proposed constitutive law were determined from planar biaxial experimental data. As a thin membrane tissue, pulmonary ligament may find many applications in medical devices and tissue engineering as a biomaterial. The constitutive relation provided here is fundamental to any future applications of pulmonary ligament.
Supplementary Material
Supplementary Figure
Acknowledgment
This research was funded by 3DT Holdings and Cook Medical.
Contributor Information
Huan Chen, California Medical Innovations Institute, San Diego, CA 92121.
Xuefeng Zhao, California Medical Innovations Institute, San Diego, CA 92121.
Zachary C. Berwick, 3DT Holdings, LLC, San Diego, CA 92121
Joshua F. Krieger, Cook Medical, Inc., Bloomington, IN 47402
Sean Chambers, Cook Medical, Inc., Bloomington, IN 47402.
Ghassan S. Kassab, California Medical Innovations Institute, San Diego, CA 92121 e-mail: gkassab@calmi2.org.
References
- [1]. Duan, X. , and Sheardown, H. , 2006, “ Dendrimer Crosslinked Collagen as a Corneal Tissue Engineering Scaffold: Mechanical Properties and Corneal Epithelial Cell Interactions,” Biomaterials, 27(26), pp. 4608–4617. 10.1016/j.biomaterials.2006.04.022 [DOI] [PubMed] [Google Scholar]
- [2]. Geiger, M. , Li, R. H. , and Friess, W. , 2003, “ Collagen Sponges for Bone Regeneration With rhBMP-2,” Adv. Drug Delivery Rev., 55(12), pp. 1613–1629. 10.1016/j.addr.2003.08.010 [DOI] [PubMed] [Google Scholar]
- [3]. Cooper, C. , Moss, A. A. , Buy, J. N. , and Stark, D. D. , 1983, “ CT Appearance of the Normal Inferior Pulmonary Ligament,” Am. J. Roentgenol., 141(2), pp. 237–240. 10.2214/ajr.141.2.237 [DOI] [PubMed] [Google Scholar]
- [4]. Godwin, J. D. , Vock, P. , and Osborne, D. R. , 1983, “ CT of the Pulmonary Ligament,” Am. J. Roentgenol., 141(2), pp. 231–236. 10.2214/ajr.141.2.231 [DOI] [PubMed] [Google Scholar]
- [5]. Rabinowitz, J. G. , and Wolf, B. S. , 1966, “ Roentgen Significance of the Pulmonary Ligament,” Radiology, 87(6), pp. 1013–1020. 10.1148/87.6.1013 [DOI] [PubMed] [Google Scholar]
- [6]. DeLaria, G. A. , Phifer, T. , Roy, J. , Tu, R. , Thyagarajan, K. , and Quijano, R. C. , 1993, “ Hemodynamic Evaluation of a Bioprosthetic Venous Prosthesis,” J. Vasc. Surg., 18(4), pp. 577–584; discussion 584–586. 10.1016/0741-5214(93)90067-V [DOI] [PubMed] [Google Scholar]
- [7]. Vesely, I. , 2005, “ Heart Valve Tissue Engineering,” Circ. Res., 97(8), pp. 743–755. 10.1161/01.RES.0000185326.04010.9f [DOI] [PubMed] [Google Scholar]
- [8]. Haugh, M. G. , Murphy, C. M. , McKiernan, R. C. , Altenbuchner, C. , and O'Brien, F. J. , 2011, “ Crosslinking and Mechanical Properties Significantly Influence Cell Attachment, Proliferation, and Migration Within Collagen Glycosaminoglycan Scaffolds,” Tissue Eng. Part A, 17(9–10), pp. 1201–1208. 10.1089/ten.tea.2010.0590 [DOI] [PubMed] [Google Scholar]
- [9]. Xu, B. , Chow, M.-J. , Zhang, Y. , Xu, B. , Chow, M.-J. , and Zhang, Y. , 2011, “ Experimental and Modeling Study of Collagen Scaffolds With the Effects of Crosslinking and Fiber Alignment,” Int. J. Biomater., 2011, p. 172389. 10.1155/2011/172389 [DOI] [PMC free article] [PubMed] [Google Scholar]
- [10]. Billiar, K. L. , and Sacks, M. S. , 2000, “ Biaxial Mechanical Properties of the Native and Glutaraldehyde-Treated Aortic Valve Cusp: Part II—A Structural Constitutive Model,” ASME J. Biomech. Eng., 122(4), pp. 327–335. 10.1115/1.1287158 [DOI] [PubMed] [Google Scholar]
- [11]. Vesely, I. , and Lozon, A. , 1993, “ Natural Preload of Aortic Valve Leaflet Components During Glutaraldehyde Fixation: Effects on Tissue Mechanics,” J. Biomech., 26(2), pp. 121–131. 10.1016/0021-9290(93)90043-E [DOI] [PubMed] [Google Scholar]
- [12]. Holzapfel, G. A. , Gasser, T. C. , and Ogden, R. W. , 2000, “ A New Constitutive Framework for Arterial Wall Mechanics and a Comparative Study of Material Models,” J. Elasticity Phys. Sci. Solids, 61(1–3), pp. 1–48. 10.1023/A:1010835316564 [DOI] [Google Scholar]
- [13]. Kroon, M. , and Holzapfel, G. A. , 2008, “ A New Constitutive Model for Multi-Layered Collagenous Tissues,” J. Biomech., 41(12), pp. 2766–2771. 10.1016/j.jbiomech.2008.05.033 [DOI] [PubMed] [Google Scholar]
- [14]. Chen, H. , Luo, T. , Zhao, X. , Lu, X. , Huo, Y. , and Kassab, G. S. , 2013, “ Microstructural Constitutive Model of Active Coronary Media,” Biomaterials, 34(31), pp. 7575–7583. 10.1016/j.biomaterials.2013.06.035 [DOI] [PMC free article] [PubMed] [Google Scholar]
- [15]. Hollander, Y. , Durban, D. , Lu, X. , Kassab, G. S. , and Lanir, Y. , 2011, “ Experimentally Validated Micro Structural 3D Constitutive Model of Coronary Arterial Media,” ASME J. Biomech. Eng., 133(3), p. 031007. 10.1115/1.4003324 [DOI] [PMC free article] [PubMed] [Google Scholar]
- [16]. Lanir, Y. , 1983, “ Constitutive Equations for Fibrous Connective Tissues,” J. Biomech., 16(1), pp. 1–12. 10.1016/0021-9290(83)90041-6 [DOI] [PubMed] [Google Scholar]
- [17]. Chen, H. , Liu, Y. , Zhao, X. , Lanir, Y. , and Kassab, G. S. , 2011, “ A Micromechanics Finite-Strain Constitutive Model of Fibrous Tissue,” J. Mech. Phys. Solids, 59(9), pp. 1823–1837. 10.1016/j.jmps.2011.05.012 [DOI] [PMC free article] [PubMed] [Google Scholar]
- [18]. Zulliger, M. A. , Fridez, P. , Hayashi, K. , and Stergiopulos, N. , 2004, “ A Strain Energy Function for Arteries Accounting for Wall Composition and Structure,” J. Biomech., 37(7), pp. 989–1000. 10.1016/j.jbiomech.2003.11.026 [DOI] [PubMed] [Google Scholar]
- [19]. Lanir, Y. , 1979, “ A Structural Theory for the Homogeneous Biaxial Stress-Strain Relationships in Flat Collagenous Tissues,” J. Biomech., 12(6), pp. 423–436. 10.1016/0021-9290(79)90027-7 [DOI] [PubMed] [Google Scholar]
- [20]. Dahl, S. L. M. , Vaughn, M. E. , and Niklason, L. E. , 2007, “ An Ultrastructural Analysis of Collagen in Tissue Engineered Arteries,” Ann. Biomed. Eng., 35(10), pp. 1749–1755. 10.1007/s10439-007-9340-8 [DOI] [PMC free article] [PubMed] [Google Scholar]
- [21]. Einat, R. , and Yoram, L. , 2009, “ Recruitment Viscoelasticity of the Tendon,” ASME J. Biomech. Eng., 131(11), p. 111008. 10.1115/1.3212107 [DOI] [PubMed] [Google Scholar]
- [22]. Farquhar, T. , Dawson, P. R. , and Torzilli, P. A. , 1990, “ A Microstructural Model for the Anisotropic Drained Stiffness of Articular Cartilage,” ASME J. Biomech. Eng., 112(4), pp. 414–425. 10.1115/1.2891205 [DOI] [PubMed] [Google Scholar]
- [23]. Lokshin, O. , and Lanir, Y. , 2009, “ Micro and Macro Rheology of Planar Tissues,” Biomaterials, 30(17), pp. 3118–3127. 10.1016/j.biomaterials.2009.02.039 [DOI] [PubMed] [Google Scholar]
- [24]. Sacks, M. S. , 2003, “ Incorporation of Experimentally-Derived Fiber Orientation Into a Structural Constitutive Model for Planar Collagenous Tissues,” ASME J. Biomech. Eng., 125(2), pp. 280–287. 10.1115/1.1544508 [DOI] [PubMed] [Google Scholar]
- [25]. Campagnola, P. J. , Clark, H. A. , Mohler, W. A. , Lewis, A. , and Loew, L. M. , 2001, “ Second-Harmonic Imaging Microscopy of Living Cells,” J. Biomed. Opt., 6(3), pp. 277–286. 10.1117/1.1383294 [DOI] [PubMed] [Google Scholar]
- [26]. Gauderon, R. , Lukins, P. B. , and Sheppard, C. J. , 2001, “ Optimization of Second-Harmonic Generation Microscopy,” Micron, 32(7), pp. 691–700. 10.1016/S0968-4328(00)00066-4 [DOI] [PubMed] [Google Scholar]
- [27]. Chen, H. , Liu, Y. , Slipchenko, M. N. , Zhao, X. , Cheng, J.-X. , and Kassab, G. S. , 2011, “ The Layered Structure of Coronary Adventitia Under Mechanical Load,” Biophys. J., 101(11), pp. 2555–2562. 10.1016/j.bpj.2011.10.043 [DOI] [PMC free article] [PubMed] [Google Scholar]
- [28]. Chen, H. , Slipchenko, M. N. , Liu, Y. , Zhao, X. , Cheng, J.-X. , Lanir, Y. , and Kassab, G. S. , 2013, “ Biaxial Deformation of Collagen and Elastin Fibers in Coronary Adventitia,” J. Appl. Physiol., 115(11), pp. 1683–1693. 10.1152/japplphysiol.00601.2013 [DOI] [PMC free article] [PubMed] [Google Scholar]
- [29]. Mansfield, J. , Yu, J. , Attenburrow, D. , Moger, J. , Tirlapur, U. , Urban, J. , Cui, Z. , and Winlove, P. , 2009, “ The Elastin Network: Its Relationship With Collagen and Cells in Articular Cartilage as Visualized by Multiphoton Microscopy,” J. Anat., 215(6), pp. 682–691. 10.1111/j.1469-7580.2009.01149.x [DOI] [PMC free article] [PubMed] [Google Scholar]
- [30]. Raub, C. B. , Unruh, J. , Suresh, V. , Krasieva, T. , Lindmo, T. , Gratton, E. , Tromberg, B. J. , and George, S. C. , 2008, “ Image Correlation Spectroscopy of Multiphoton Images Correlates With Collagen Mechanical Properties,” Biophys. J., 94(6), pp. 2361–2373. 10.1529/biophysj.107.120006 [DOI] [PMC free article] [PubMed] [Google Scholar]
- [31]. Schriefl, A. J. , Reinisch, A. J. , Sankaran, S. , Pierce, D. M. , and Holzapfel, G. A. , 2012, “ Quantitative Assessment of Collagen Fibre Orientations From Two-Dimensional Images of Soft Biological Tissues,” J. R. Soc., Interface, 9(76), pp. 3081–3093. 10.1098/rsif.2012.0339 [DOI] [PMC free article] [PubMed] [Google Scholar]
- [32]. Chow, M.-J. , Turcotte, R. , Lin, C. P. , and Zhang, Y. , 2014, “ Arterial Extracellular Matrix: A Mechanobiological Study of the Contributions and Interactions of Elastin and Collagen,” Biophys. J., 106(12), pp. 2684–2692. 10.1016/j.bpj.2014.05.014 [DOI] [PMC free article] [PubMed] [Google Scholar]
- [33]. Fata, B. , Carruthers, C. A. , Gibson, G. , Watkins, S. C. , Gottlieb, D. , Mayer, J. E. , and Sacks, M. S. , 2013, “ Regional Structural and Biomechanical Alterations of the Ovine Main Pulmonary Artery During Postnatal Growth,” ASME J. Biomech. Eng., 135(2), p. 021022. 10.1115/1.4023389 [DOI] [PMC free article] [PubMed] [Google Scholar]
- [34]. Timmins, L. H. , Wu, Q. , Yeh, A. T. , Moore, J. E. , and Greenwald, S. E. , 2010, “ Structural Inhomogeneity and Fiber Orientation in the Inner Arterial Media,” Am. J. Physiol.: Heart Circ. Physiol., 298(5), pp. H1537–H1545. 10.1152/ajpheart.00891.2009 [DOI] [PubMed] [Google Scholar]
- [35]. Zoumi, A. , Lu, X. , Kassab, G. S. , and Tromberg, B. J. , 2004, “ Imaging Coronary Artery Microstructure Using Second-Harmonic and Two-Photon Fluorescence Microscopy,” Biophys. J., 87(4), pp. 2778–2786. 10.1529/biophysj.104.042887 [DOI] [PMC free article] [PubMed] [Google Scholar]
- [36]. Kato, Y. P. , Christiansen, D. L. , Hahn, R. A. , Shieh, S. J. , Goldstein, J. D. , and Silver, F. H. , 1989, “ Mechanical Properties of Collagen Fibres: A Comparison of Reconstituted and Rat Tail Tendon Fibres,” Biomaterials, 10(1), pp. 38–42. 10.1016/0142-9612(89)90007-0 [DOI] [PubMed] [Google Scholar]
- [37]. Minns, R. J. , Soden, P. D. , and Jackson, D. S. , 1973, “ The Role of the Fibrous Components and Ground Substance in the Mechanical Properties of Biological Tissues: A Preliminary Investigation,” J. Biomech., 6(2), pp. 153–165. 10.1016/0021-9290(73)90084-5 [DOI] [PubMed] [Google Scholar]
- [38]. Wolinsky, H. , and Glagov, S. , 1964, “ Structural Basis for the Static Mechanical Properties of the Aortic Media,” Circ. Res., 14(5), pp. 400–413. 10.1161/01.RES.14.5.400 [DOI] [PubMed] [Google Scholar]
- [39]. Bailey, A. J. , Light, N. D. , and Atkins, E. D. T. , 1980, “ Chemical Cross-Linking Restrictions on Models for the Molecular Organization of the Collagen Fibre,” Nature, 288(5789), pp. 408–410. 10.1038/288408a0 [DOI] [PubMed] [Google Scholar]
- [40]. Khor, E. , 1997, “ Methods for the Treatment of Collagenous Tissues for Bioprostheses,” Biomaterials, 18(2), pp. 95–105. 10.1016/S0142-9612(96)00106-8 [DOI] [PubMed] [Google Scholar]
- [41]. Weadock, K. , Olson, R. M. , and Silver, F. H. , 1983, “ Evaluation of Collagen Crosslinking Techniques,” Biomater., Med. Dev., Artif. Organs, 11(4), pp. 293–318. 10.3109/10731198309118815 [DOI] [PubMed] [Google Scholar]
- [42]. Sheu, M.-T. , Huang, J.-C. , Yeh, G.-C. , and Ho, H.-O. , 2001, “ Characterization of Collagen Gel Solutions and Collagen Matrices for Cell Culture,” Biomaterials, 22(13), pp. 1713–1719. 10.1016/S0142-9612(00)00315-X [DOI] [PubMed] [Google Scholar]
- [43]. Gauvin, R. , Marinov, G. , Mehri, Y. , Klein, J. , Li, B. , Larouche, D. , Guzman, R. , Zhang, Z. , Germain, L. , and Guidoin, R. , 2013, “ A Comparative Study of Bovine and Porcine Pericardium to Highlight Their Potential Advantages to Manufacture Percutaneous Cardiovascular Implants,” J. Biomater. Appl., 28(4), pp. 552–565. 10.1177/0885328212465482 [DOI] [PubMed] [Google Scholar]
- [44]. Lam, M. T. , and Wu, J. C. , 2012, “ Biomaterial Applications in Cardiovascular Tissue Repair and Regeneration,” Expert Rev. Cardiovasc. Ther., 10(8), pp. 1039–1049. 10.1586/erc.12.99 [DOI] [PMC free article] [PubMed] [Google Scholar]
- [45]. Aguiari, P. , Fiorese, M. , Iop, L. , Gerosa, G. , and Bagno, A. , 2015, “ Mechanical Testing of Pericardium for Manufacturing Prosthetic Heart Valves,” Interact. Cardiovasc. Thorac. Surg., 22(1), pp. 72–84. 10.1093/icvts/ivv282 [DOI] [PubMed] [Google Scholar]
- [46]. Inoue, H. , Iguro, Y. , Matsumoto, H. , Ueno, M. , Higashi, A. , and Sakata, R. , 2009, “ Right Hemi-Reconstruction of the Left Atrium Using Two Equine Pericardial Patches for Recurrent Malignant Fibrous Histiocytoma: Report of a Case,” Surg. Today, 39(8), pp. 710–712. 10.1007/s00595-008-3920-6 [DOI] [PubMed] [Google Scholar]
- [47]. Shinn, S. H. , Sung, K. , Park, P. W. , Lee, Y. T. , Kim, W. S. , Yang, J.-H. , Jun, T.-G. , Lee, S.-C. , and Park, S. W. , 2009, “ Results of Annular Reconstruction With a Pericardial Patch in Active Infective Endocarditis,” J. Heart Valve Dis., 18(3), pp. 315–320.https://www.icr-heart.com/?cid=2068 [PubMed] [Google Scholar]
- [48]. Delille, J. P. , Hernigou, A. , Sene, V. , Chatellier, G. , Boudeville, J. C. , Challande, P. , and Plainfosse, M. C. , 1999, “ Maximal Thickness of the Normal Human Pericardium Assessed by Electron-Beam Computed Tomography,” Eur. Radiol., 9(6), pp. 1183–1189. 10.1007/s003300050814 [DOI] [PubMed] [Google Scholar]
- [49]. Nam, J. , Choi, S.-Y. , Sung, S.-C. , Lim, H.-G. , Park, S. , Kim, S.-H. , and Kim, Y. J. , 2012, “ Changes of the Structural and Biomechanical Properties of the Bovine Pericardium After the Removal of α-Gal Epitopes by Decellularization and α-Galactosidase Treatment,” Korean J. Thorac. Cardiovasc. Surg., 45(6), pp. 380–389. 10.5090/kjtcs.2012.45.6.380 [DOI] [PMC free article] [PubMed] [Google Scholar]
- [50]. Lu, S.-H. , Sacks, M. S. , Chung, S. Y. , Gloeckner, D. C. , Pruchnic, R. , Huard, J. , de Groat, W. C. , and Chancellor, M. B. , 2005, “ Biaxial Mechanical Properties of Muscle-Derived Cell Seeded Small Intestinal Submucosa for Bladder Wall Reconstitution,” Biomaterials, 26(4), pp. 443–449. 10.1016/j.biomaterials.2004.05.006 [DOI] [PubMed] [Google Scholar]
- [51]. Prevel, C. D. , Eppley, B. L. , Summerlin, D. J. , Sidner, R. , Jackson, J. R. , McCarty, M. , and Badylak, S. F. , 1995, “ Small Intestinal Submucosa: Utilization as a Wound Dressing in Full-Thickness Rodent Wounds,” Ann. Plast. Surg., 35(4), pp. 381–388. 10.1097/00000637-199510000-00009 [DOI] [PubMed] [Google Scholar]
- [52]. Schallberger, S. P. , Stanley, B. J. , Hauptman, J. G. , and Steficek, B. A. , 2008, “ Effect of Porcine Small Intestinal Submucosa on Acute Full-Thickness Wounds in Dogs,” Vet. Surg., 37(6), pp. 515–524. 10.1111/j.1532-950X.2008.00398.x [DOI] [PubMed] [Google Scholar]
- [53]. Boyd, W. D. , Johnson, W. E. , Sultan, P. K. , Deering, T. F. , and Matheny, R. G. , 2010, “ Pericardial Reconstruction Using an Extracellular Matrix Implant Correlates With Reduced Risk of Postoperative Atrial Fibrillation in Coronary Artery Bypass Surgery Patients,” Heart Surg. Forum, 13(5), pp. E311–E316. 10.1532/HSF98.20091184 [DOI] [PubMed] [Google Scholar]
- [54]. Fallon, A. , Goodchild, T. , Wang, R. , and Matheny, R. G. , 2012, “ Remodeling of Extracellular Matrix Patch Used for Carotid Artery Repair,” J. Surg. Res., 175(1), pp. e25–e34. 10.1016/j.jss.2011.11.001 [DOI] [PubMed] [Google Scholar]
- [55]. Choy, J. S. , Mathieu-Costello, O. , and Kassab, G. S. , 2005, “ The Effect of Fixation and Histological Preparation on Coronary Artery Dimensions,” Ann. Biomed. Eng., 33(8), pp. 1027–1033. 10.1007/s10439-005-4854-4 [DOI] [PubMed] [Google Scholar]
- [56]. Kothari, H. , Kaur, G. , Sahoo, S. , Idell, S. , Rao, L. V. M. , and Pendurthi, U. , 2009, “ Plasmin Enhances Cell Surface Tissue Factor Activity in Mesothelial and Endothelial Cells,” J. Thromb. Haemostasis, 7(1), pp. 121–131. 10.1111/j.1538-7836.2008.03218.x [DOI] [PMC free article] [PubMed] [Google Scholar]
- [57]. Louagie, Y. , Legrand-Monsieur, A. , Remacle, C. , Maldague, P. , Lambotte, L. , and Ponlot, R. , 1986, “ Morphology and Fibrinolytic Activity of Canine Autogenous Mesothelium Used as Venous Substitute,” Res. Exp. Med., 186(4), pp. 239–247. 10.1007/BF01852301 [DOI] [PubMed] [Google Scholar]
Associated Data
This section collects any data citations, data availability statements, or supplementary materials included in this article.
Supplementary Materials
Supplementary Figure