

Abstract
Reduced bone mineral density and hip fracture are frequently observed in patients with Alzheimer’s disease (AD). However, mechanisms underlying their association remain poorly understood. Amyloid precursor protein (APP) is a transmembrane protein that is ubiquitously expressed in bone marrow stromal cells (BMSCs), osteoblasts (OBs), macrophages (BMMs), and osteoclasts (OCs). Mutations in the APP gene identified in early-onset AD patients are believed to cause AD. But little is known about APP’s role in bone remodeling. Here, we present evidence for Swedish mutant APP (APPswe) in suppression of OB differentiation and function in culture and in mouse. APP expression in BMSCs increases during aging. Ubiquitous expression of APPswe in young adult Tg2576 transgenic mice (under the control of a prion promoter) recaptured skeletal “aging-like” deficits, including decreased OB genesis and bone formation, increased adipogenesis and bone marrow fat, and enhanced OC genesis and bone resorption. Remarkably, selective expression of APPswe in mature OB-lineage cells in TgAPPswe-Ocn mice (under the control of osteocalcin [Ocn] promoter-driven Cre) also decreased OB genesis and increased OC formation, resulting in a trabecular bone loss. These results thus suggest a cell-autonomous role for APPswe in suppressing OB formation and function, but a nonautonomous effect on OC genesis. Notably, increased adipogenesis and elevated bone marrow fat were detected in young adult Tg2576 mice, but not in TgAPPswe-Ocn mice, implying that APPswe in BMSCs and/or multicell types in bone marrow promotes bone marrow adipogenesis. Intriguingly, the skeletal aging-like deficits in young adult Tg2576 mice were prevented by treatment with N-acetyl-L-cysteine (NAC),an antioxidant, suggesting that reactive oxygen species (ROS) may underlie APPswe-induced osteoporotic deficits. Taken together, these results demonstrate a role for APPswe in suppressing OB differentiation and bone formation, implicate APPswe as a detrimental factor for AD-associated osteoporotic deficit, and reveal a potential clinical value of NAC in the treatment of osteoporotic deficits.
Keywords: APP, NAC, ALZHEIMER’S DISEASE, OSTEOBLAST, OSTEOPOROSIS
Introduction
Alzheimer’s disease (AD) is one of the most dreaded multifactorial neurodegenerative disorders and affects 10% of all people over 65 years of age. It is a slowly progressive disorder, in which neurodegeneration is believed to progress for 20 to 30 years before clinical onset.(1) Pathologically, AD is characterized by β amyloid (Aβ) deposits, neurofibrillary tangles, chronic inflammation, and neuronal loss. Osteoporosis is another multifactorial progressive degenerative disorder that is characterized by low bone mineral density (BMD) and microarchitectural deterioration of bone tissue. Though not referred to as one of the major complications of AD, osteoporosis and hip fracture are commonly observed in patients with AD.(2,3) A positive association of manifest AD with reduced radiographic BMD(4,5) has been found, and an increased bone resorption (by measuring C-terminal collagen fragments) in mild AD, which is at a level comparable to that in patients of osteoporosis,(6) has been reported. Epidemiological studies also support a degree of comorbidity of both AD and osteoporosis. Both are multifactorial, mostly polygenetic diseases, involving susceptibility genes, aging, and environmental factors as pathogenic mechanisms. Both involve chronic inflammatory processes and oxidative stress that play important pathogenic roles. However, very few reports are available in the literature that have addressed molecular mechanisms underlying their association. One hypothesis proposed is that AD patients are generally inactive, thus consequently resulting in the osteoporotic changes due to the disuse. This may explain their association in late-stage AD patients, but it does not account for all the AD-associated bone loss, because reduced BMD is found in early-stage, mild AD patients, who have cognitive deficits (e.g., memory loss) without movement defect.(6) Thus, additional mechanisms may underlie AD association with osteoporosis/hip fracture.
Aβ, a major component of amyloid plaques in the brain of AD patients, is derived from proteolytic processing of amyloid precursor protein (APP) by β- and γ-secretases.(7) It is believed to be a major culprit for the pathogenesis of AD. APP mutations identified in early-onset AD patients promote the generation of Aβ by favoring the proteolytic processing of mutant APP by β- or γ-secretases.(8) Mutations in presenilins (major components of γ -secretase) identified in familial AD patients also enhance the processing of APP to form amyloidogenic Aβ.(9,10) These studies thus provide a genetic framework for an amyloid hypothesis.(9,10) Although plasma Ap is invariably elevated in familial or early-onset AD, it is also increased in patients with late-onset AD.(11) Human genetic analysis has pointed to apolipoprotein E (ApoE) as a major genetic risk factor for the increased Ap in late-onset AD.(12,13) Interestingly, ApoE is also a genetic risk factor for osteoporosis.(14) It is also of interest that in addition to AD, Ap deposits are detected in inclusion body myositis,(15) the most common age-related muscle disease, and in brains of Down syndrome patients,(16) as well as in blood vessels of cerebral amyloid angiopathy.(17,18) Increased APP is also reported in muscles of patients with amyotrophic lateral sclerosis (ALS) and a mouse model of ALS.(19) Thus, APP/Ap appears to be linked with multiple degenerative disorders.
Is APP or Ap a risk factor for aging-associated bone loss or osteoporosis? In another publication20 we demonstrated a role for APP and Ap in regulating osteoclast (OC) differentiation in vitro and in Tg2576, an AD transgenic mouse model that ubiquitously expresses APPswe (Swedish mutant APP) under the control of a prion promoter. The function of APPswe on OC differentiation appears to be age-dependent and biphasic, with a slight increase of OCs in young adult Tg2576 mice (<4 months old), but a decrease of OCs in older mice (>4 months old).(20) The increase of OC formation and activation in the young adult Tg2576 mice appears to be weak, which cannot fully account for the bone deficit observed in Tg2576 mice. We thus further investigated the function of APPswe in osteoblast (OB) differentiation and bone formation. Here, we present evidence for the expression of endogenous APP in bone marrow stromal cells (BMSCs). Exogenous expression of APPswe in BMSCs suppresses OB differentiation in a cell autonomous manner. Although both Tg2576 and TgAPPswe-Ocn (selective expression of APPswe in mature OB-lineage cells under the control of Ocn-Cre) display trabecular bone loss, young adult Tg2576, but not TgAPPswe-Ocn, showed an increase of adipogenesis and elevation of bone marrow fat, resembling to a certain degree skeletal “aging-like” deficit. Remarkably, treatment with N-acetyl-L-cysteine (NAC), an antioxidant, in young adult Tg2576 mice ameliorated the skeletal aging-like phenotypes. These results thus demonstrate a deleterious effect of APPswe on OB differentiation, implicating APP/Ap and oxidative stress as common denominators for skeletal aging and revealing a potential clinical value of NAC in the prevention or therapy of osteoporotic deficit associated with AD patients and/or osteoporosis.
Subjects and Methods
Reagents and animals
APP antibody (rabbit polyclonal) was purchased from Cell Signaling (Danvers, MA, USA), and Ap antibody (monoclonal, 6E10) was purchased from Sigma-Aldrich (St. Louis, MO, USA). Murine macrophage colony-stimulating factor (M-CSF) was obtained from R&D Systems (Minneapolis, MN, USA). Recombinant glutathione S-transferase (GST)-receptor activator of NF-kB ligand (RANKL) proteins were generated and purified as described.(20–22)
We purchased Tg2576 mice (Taconic, Inc., Hudson, NY, USA), which express human APP695 with double mutations at KM670/ 671NL (Swedish mutations, called APPswe) under the control of a hamster prion promoter.(23) The prion promoter drives APPswe’s expression as early as embryonic day 12.5 (E12.5), not only in the brain, but also in nonbrain tissues, including BMSCs and bone marrow macrophages (BMMs).(20,24) We generated the Tg(flox) APPswe mice (conditional transgenic mice expressing APPswe) ourselves. The expression of APPswe in Tg(flox)APPswe was controlled by the cytomegalovirus (CMV) promoter, but blocked by a loxP-stop-loxP sequence (Supplemental Fig. 1A). Thus, APPswe’s protein expression in Tg(flox)APPswe is Cre-dependent. Five founder lines of Tg(flox)APPswe were initially crossed with HSA-Cre (a human skeletal a-actin promoter-driven Cre mouse) to identify the founder line with a high level of APPswe protein expression (Supplemental Fig. 1A–C). The founder line was then crossed with Ocn-Cre (an osteocalcin promoter-driven Cre mouse) (kindly provided by Dr. Tom Clemens, Johns Hopkins Medical School, Baltimore, MD, USA) to obtain TgAPPswe-Ocn mice (Supplemental Fig. 1). Both Tg2576 and Tg(flox)APPswe mice have been crossed into C57BL/6 genetic background for six generations. All experiments used littermates from the breeding of Tg2576 x C57BL/6, or Tg(flox)APPswe x Ocn-Cre in C57BL/6 background. All experimental procedures were approved by the Animal Subjects Committee at the Georgia Regents University, in accordance with U.S. National Institutes of Health guidelines.
In vitro BMSCs, OB, and adipocyte cultures
Whole bone marrow cells were flushed from long bones of 2-month-old to 3-month-old wild-type (WT), Tg2576, and TgAPPswe-Ocn mice and plated on 100-mm tissue culture plates in DMEM containing 10% fetal bovine serum (FBS) and 1% penicillin/streptomycin (P/S). For some experiments, the BMSCs were isolated by negative immunodepletion (using magnetic nanoparticles conjugated to anti-mouse CDIIb, CD45R/B220, and Pan DC monoclonal antibodies) followed by positive immunoselection (using anti-Sca-1 microbeads) as described.(25) BMSCs were plated in densities of 1 × 10⁴/cm2 and 3 × 10⁴/cm2 for OB and adipocyte inductions, respectively. To induce OB genesis, BMSCs were maintained in osteogenic medium (DMEM containing 10% FBS, 1% P/S, 10 mM b-glycerophosphate, and 50 mM L-ascorbic acid-2-phosphate). After 14 days, alkaline phosphatase (ALP) staining and quantification was performed as described.(25) To induce adipogenesis, cells were exposed to adipocyte differentiation media (DMEM containing 10% FBS, 1% P/S, 0.5 mM isobutylmethylxanthine, 10 mg/mL insulin, and 1 × 10~6M dexamethasone) for 3 days, followed by a 9-day incubation in maintenance media (growth medium plus 10 mg/mL insulin) with media replaced every other day. The cells were monitored daily using a microscope for the appearance of lipid droplets, which were revealed by Oil-Red O staining as described.(25) Oil Red O solution was freshly prepared by diluting a stock solution (0.5g of Oil Red O in 100mL of isopropanol) with water (6:4) followed by filtration.
In vitro BMM and OC culture
Mouse BMMs and OCs were generated as described.(20–22)) In brief, the bone marrow was flushed from femurs and tibias of 2-month-old to 3-month-old WT and TgAPPswe-Ocn mice with ice-cold a modified essential medium (a-MEM) and plated on 100-mm tissue culture plates in a-MEM containing 10% FBS and 10ng/mL recombinant macrophage colony-stimulating factor (M-CSF). Cells were incubated at 37°C with 5% CO2 overnight. Nonadherent cells were harvested and subjected to Ficoll-Hypaque gradient centrifugation for purification of BMMs. For osteoclastogenesis, 5 × 10⁴ BMMs were incubated with OC differentiation medium containing 10ng/mL recombinant M-CSF and 100ng/mL recombinant RANKL. Mature OC (multinucleated, large-spread cells) began to form at day 4 to 5 after RANKL treatment. The cells were then subjected to tartrate-resistant acid phosphatase (TRAP) staining to confirm their OC identity.
NAC treatments
Tg2576 mice were divided into two groups. A group of Tg2576 mice (n = 5, male and female) received drinking water, and another group of Tg2576 mice (n = 5, male and female) received drinking water containing NAC (2 mg/kg/d) for a period of 3 months. NAC in water (0.001%, pH adjusted to 7.2 by NaOH) was prepared and given to mice. Water was changed every other day for 3 months. Approximately 4 to 5 mL of water was consumed by each mouse per day, which gives a cumulative dose of ~2 mg/kg per mouse per day (not accounting for spills). This NAC dose was chosen based on previous publications.(26,27) The NAC treatment was started at the age of 1 month. After 3 months of NAC treatment, mice were euthanized. Femur bone samples were collected for histomorphometric and microcomputed tomography (mCT) analyses, and mouse sera were also collected for radioimmunoassay (RIA) analysis of pyridino-line (PYD) and ELISA analysis of osteocalcin and interleukin-6 (IL-6) levels.
Measurement of serum levels of osteocalcin, PYD, and IL-6
Mouse blood was obtained by cardiac puncture. Samples were allowed to clot for at least 30 minutes and then centrifuged for 10 minutes at 3000 rpm or 1200g relative centrifugal force (RCF). Serum was collected and frozen at —20°C until use. Mouse serum levels of osteocalcin were measured using a mouse osteocalcin ELISA kit (Biomedical Technologies, Inc., Stoughton, MA, USA).The serum levels of PYD were determined by using a METRA Serum PYD enzyme immunoassay (EIA) kit (QUIDEL Corporation, San Diego, CA, USA). The serum levels of IL-6 were determined by Mouse IL-6 ELISA kit (BD Biosciences, San Jose, CA, USA). All the assays were carried out perthe manufacturer’s instructions. All the optical densities (ODs) measured after reactions were converted to osteocalcin/PYD/IL-6 concentration using their standard curves. All the samples were measured in duplicate, and values were subjected to statistical analysis.
μCT
Microarchitecture of the distal trabecular bone and midshaft cortical bone of the femur was measured by Scanco mCT 40 (Scanco Medical AG, Bruttisellen, Switzerland) as described.(20,21) The 3D reconstruction of the trabecular bone was performed using all of the outlined slices. No cortical bone was included in this analysis. Data was obtained on bone volume (BV), total volume (TV), BV/TV, bone density, trabecular number, and connectivity. The scan of the cortical bone was performed at the midshaft of the femur and consisted of 25 slices (each slice was 12 mm thick). Scans were reconstructed as for the trabecular scans and the region of interest was drawn on all 25 slices. There was no trabecular bone in these images at the midshaft. Data was obtained on BV, TV, BV/TV, bone density, and cortical thickness.
Bone histomorphometric analysis
Bone histomorphometric analyses were carried out as described.(21,22,28) In brief, mouse tibias and femurs were fixed overnight in 10% buffered formalin, decalcified in 14% EDTA, embedded in paraffin, sectioned, and subjected to hematoxylin and eosin (H&E) and Goldner’s trichrome stain analyses, which were counterstained by fast green. Bone histomorphometric perimeters were determined by measuring the areas situated at least 0.5 mm from the growth plate, excluding the primary spongiosa and trabeculae connected to the cortical bone.
Bone dynamic histomorphometric analysis
To obtain the bone formation rate (BFR), postnatal day (P16) mice were injected with the fluorochrome labels calcein green (10 mg/ kg; Sigma-Aldrich) intraperitoneally, followed by another injection 12 days later. Mice were euthanized 2 days after the second injection (at P30). Mouse tibia and femurs were fixed overnight in 70% ethanol. Images were obtained using a 25x objective (LSM510; Carl Zeiss).
Statistical analysis
All data are expressed as mean ± SD. The significance level was set at p < 0.05. Student’s t test was used for statistical analysis.
Results
Skeletal aging-like osteoporotic deficits in young adult Tg2576 mice
To investigate the potential role of APP in skeletal aging, we first examined APP expression in BMSCs derived from differently-aged WT mice (C57BL/6). These cells were purified by negative immunodepletion (using magnetic nanoparticles conjugated to anti-mouse CDIIb, CD45R/B220, and Pan DC monoclonal antibodies) followed by positive immunoselection (using anti-Sca-1 microbeads) according to a previous publication.(25) The purified BMSCs contained ~90% BMSC-like cells based on their morphological characteristics and were also negative for RANK (a receptor activator of NF-kB that is selectively expressed in BMMs and OCs) (Supplemental Fig. 2A–C), reconfirming the immune-depletion of BMMs. APP was detected in these purified BMSCs, exhibiting an age-dependent increase (Fig. 1A, B; Supplemental Fig. 2B). We then examined the distribution of APP/Aß in both WT and Tg2576 mice, an AD mouse model that expresses APPswe under the control of a prion promoter.(28–30) Immunohistochemical staining analysis using 6E10 monoclonal antibody that mainly recognizes Aß showed a positive signal largely restricted to bone marrow cells in 1 -year-old WT femurs and tibias (C57BL/6) (Fig. 1C, D). In contrast, the signal (for Aß) in OCs embedded in the cortical bone matrix was weakly detected in the 1-year-old WT, but was markedly increased in Tg2576 femurs and tibias (Fig. 1C, D). Also increased in Tg2576 cortical bone matrix was Congo red staining signal, which recognizes Aß deposits (Fig. 1E). These results suggest that endogenous APP/Aß is expressed in aged bone marrow cells, including BMSCs, and Tg2576 appears to be a good animal model to address APPswe/Ab’s function in bone remodeling.
Fig. 1.
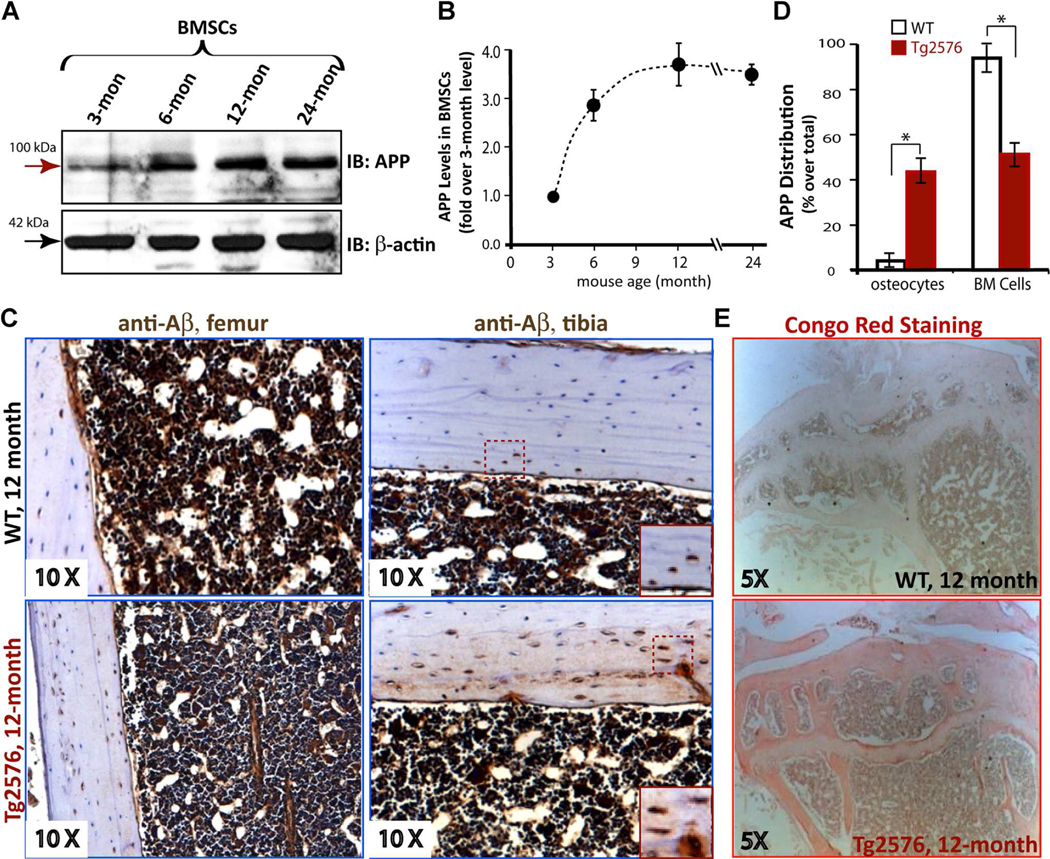
Age-dependent increase of endogenous APP protein levels in BMSCs. (A, B) Western blot analysis of endogenous APP levels in differently-aged purified BMSCs. The BMSCs were isolated from indicated aged WT mice and purified as described in Subjects and Methods. The data were quantified by NIH ImageJ software, normalized by that in 3-month-old BMSCs, and presented in B (mean±SD, n=3). (C, D) Immunohistochemical staining analysis of Aβ (by 6E10 antibody) in femur and tibia sections from 1-year-old WT and Tg2576 mice. The representative images are shown in C. Inserts are amplified images indicated in the dotted square. The 6E10 staining signals in osteocytes and bone marrow cells were quantified (positive cells/total cells in a selective region; e.g., BMcells, %) and presented in D (mean±SD, n=5 femur samples per genotype). *pμ0.05, significant difference from the WT control. (E) Representative images of Congo Red staining analysis of Aβ in femur sections from 1-year-old WT and Tg2576 mice.
We next examined OB-mediated bone formation, a critical process for maintaining bone mass, in neonatal Tg2576 mice. Bone formation was first determined by dynamic measurements of nondecalcified femur and tibia sections, which were doublelabeled by two injections of fluorescent calcein (at a 12-day interval). Significant reductions in both endocortical mineral apposition rate (Ec.MAR) and endocortical BFR (Ec.BFR) were detected in 1-month-old Tg2576 mice, as compared with the same-aged controls (Fig. 2A, B), suggesting a negative role for APPswe in bone formation. This result was further confirmed by Goldner’s trichrome staining analysis and immunostaining analysis using anti-osteocalcin antibodies (a marker for bone formation) (Fig. 2C–E). A decrease in osteoid numbers per unit bone surface and a reduction of osteocalcin staining signal were detected in young adult (2 to 4 months old) Tg2576 femurs (Fig. 2C–E). The serum levels of osteocalcin were also reduced in young adult Tg2576 mice (Fig. 2F). These results, in line with previous mCT analysis,(20–31) demonstrate a negative role for APPswe in mouse bone formation.
Fig. 2.
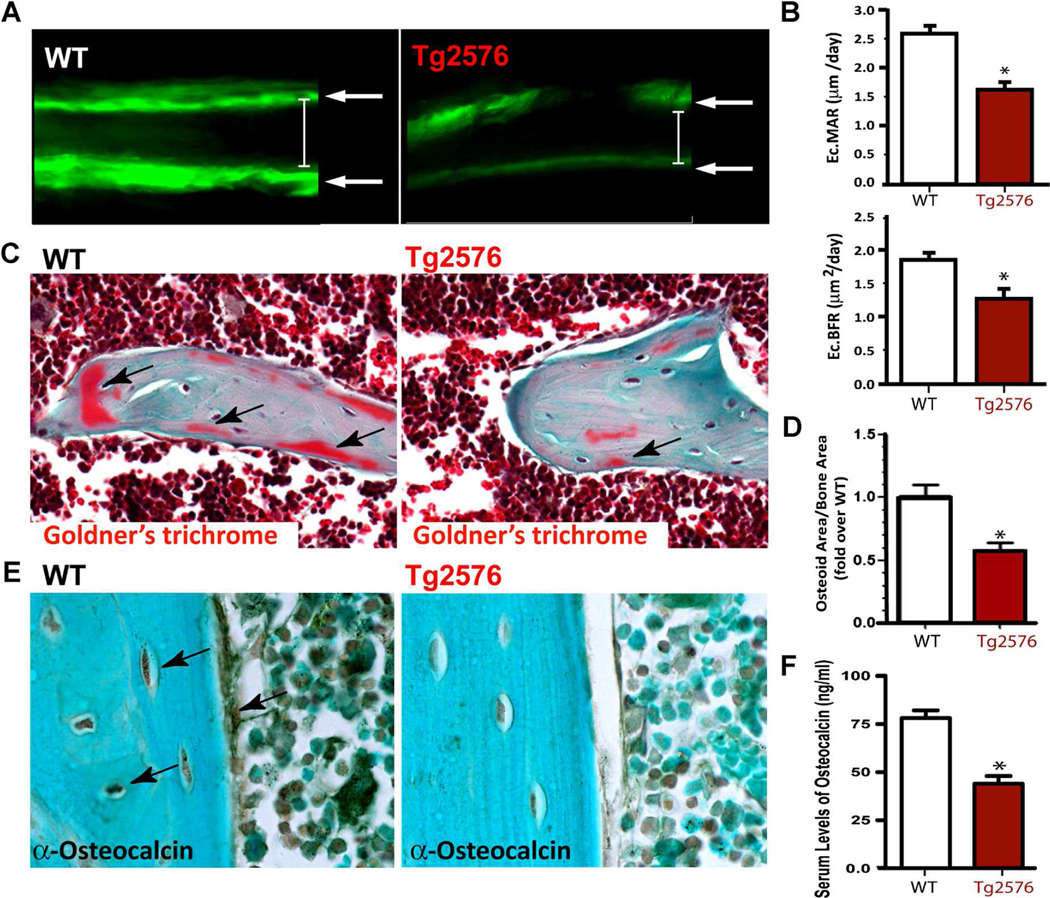
Decrease of bone formation in neonatal Tg2576 mice. (A, B) Reduced bone formation in 1-month-old Tg2576 mice was detected by dynamic histomorphometric measurements of double-fluorescent-labeled femurs. WT and Tg2576 mice at P16 were injected (intraperitoneal) with fluorochromelabeled calcein green (10 mg/kg; Sigma-Aldrich), and 12 days after (P28), they were reinjected to label active bone-forming surfaces. At P30, mice were euthanized and the left femur was fixed in 70% EtOH, sectioned at 20μm, and viewed by fluorescence microscope, as shown in A. The endocortical mineral apposition rate (Ec.MAR) calculated in micrometers per day (μm/d) and the bone formation rate (Ec.BFR=MAR×mineralization surface/bone surface) from fluorochrome double-labels at the endocortical surfaces are illustrated in B. (C, D) Decreased osteoid numbers of trabecular bones in 4-month-old Tg2576 femurs were viewed by Goldner’s trichrome staining analysis. Images are shown in C, and quantification analysis of osteoid numbers per unit of bone surface is presented in D. (E) Reduced immunostaining signals of osteocalcin in 4-month-old Tg2576 femur sections, as compared with that in WT femurs, is shown. (F) Decreased serum levels of osteocalcin, measured by ELISA assays, in 4-month-old Tg2576 mice are presented. In B, D, and F, the values of mean±SD from 5 different animals per genotype are shown. *p<0.05, significantly different from the WT control.
In addition to the decrease of bone formation, aging skeletons frequently display elevated bone marrow fat/lipid.(32–34) We thus examined this event in young adult WT and Tg2576 femurs. As shown in Fig. 3A, H&E staining analysis of WT femurs at 4 months of age showed few fat-like cells, but many large oval-shaped vacuoles, likely to be marrow adipocytes, were detected in the 4-month-old Tg2576 femurs. To confirm whether these oval-shaped vacuoles were lipid-containing cells, Oil Red O staining analysis was carried out using freshly isolated and frozen femur sections. Indeed, the number of Oil RedOstained cells was much higher in Tg2576 femurs than in WT controls (Fig. 3B). We also examined bone marrow fat in differently-aged WT and Tg2576 mice by both H&E and Oil Red O staining analyses. The increase of bone marrow fat-containing cells was more evident in young adult age (1 to 8 months old), but not aged Tg2576 mice (>8 months old) (Fig. 3C). Taken together, the phenotypes observed in young adult Tg2576 femurs (e.g., decreases in bone mass and bone formation and increase in bone marrow fat accumulation) resemble, to a certain degree, that of aged skeleton, supporting the view for increased APP/Aß as a risk factor for skeletal aging.
Fig. 3.

Increase of bone marrow fat in young adult Tg2576 mice. H&E (A) and Oil Red O (B) staining analyses show increases in bone marrow fat-containing cells in Tg2576 mice at 4 months old. (C) Quantification analysis of bone marrow fat cells over total bone marrow cells in femur mid-diaphysis is presented. Mice at indicated age groups (5 mice per age group per genotype, males and females) were examined. Increases in bone marrow fat were only detected in young (1–6 months old) Tg2576 mice (as compared with WT controls of the same age).
Decreased osteoblastogenesis and increased adipogenesis in Tg2576-BMSC culture
To understand how APPswe negatively regulates bone formation, we examined in vitro OB differentiation by culturing BMSCs derived from 2-month-old WT and Tg2576 mice. Indeed, OB differentiation, viewed by ALP enzymatic activity staining and by real-time quantitative PCR (QPCR) analysis of osteocalcin expression, was reduced in cultures of BMSCs from Tg2576 mice compared to those from WT controls (Fig. 4A–C). Also decreased was calcified bone matrix stained by von Kossa in Tg2576-OB cultures (Fig.4D, E). These results thus provide additional support for a negative role of APPswe in OB differentiation, implicating a cell autonomous effect of APPswe on this event.
Fig. 4.

Reduced vitro OB formation and function in Tg2576-BMSC culture. BMSCs from 2-month-old WT and Tg2576 femurs were induced for OB differentiation (see Subjects and Methods). ALP staining images at day 7 and 14 cultures are shown (A), and ALP activity (ALP positive area/over total area, normalized by day 3 WT culture) is also presented (B).(C) Real-time PCR analysis of osteocalcin expression in un-induced (N) andOB-induced (I-OB) cultures (day 14). At day 28 of culture, cells were von Kossa-stained (D), and the von Kossa staining data was quantified and is illustrated (E). In B, C,and E, the values of mean ± SD (n = 3 different cultures) are presented. *p < 0.01, significant decrease compared to the WT control.
Because reduced OB differentiation is frequently associated with increased adipogenesis during skeletal aging,(32–34) we thus examined adipocyte formation by BMSC culture. Indeed, adipocyte differentiation, viewed by Oil Red O staining, was significantly increased in cultures of either whole bone marrow cells or BMSCs from Tg2576 mice, as compared to those from WT controls (Fig. 5A–D). These results, in line with the in vivo observations, suggest a negative correlation between osteoblastogenesis and adipogenesis in Tg2576-BMSC culture, supporting the view for bone marrow adipocytes formed at the expense of OBs.
Fig. 5.

Elevation of in vitro adipogenesis in Tg2576-whole bone marrow and Tg2576-BMSC cultures. (A, B) Whole bone marrow cells from femurs of WT and Tg2576 mice (4 months old) were induced for adipocyte differentiation for 2 weeks (see Subjects and Methods). Cells were stained with Oil Red O (A), and the data were quantified (B). (C, D) Isolated BMSCs from WT and Tg2576 mice (4 months old) were induced for adipocyte differentiation as in A. The data was quantified and is shown in D. In B and D, the values of mean ± SD (n = 3 different experiments) are shown. **p < 0.01, significant difference from the WT control.
Reduced bone mass and decreased osteogenesis in a new transgenic mouse line that selectively expresses APPswe in mature OB-lineage cells
To further address whether APPswe regulates OB genesis and bone formation in a cell-autonomous manner, we generated a new conditional transgenic mouse line, TgAPPswe-Ocn, which expresses APPswe selectively in mature OB-lineage cells. TgAPPswe-Ocn was generated by crossing a floxed transgenic APPswe mouse, Tg(flox)APPswe, with an Ocn-Cre mouse (Supplemental Fig. 1) (see Subjects and Methods). In the presence of Cre, the stop signal was floxed out, thus APPswe was expressed in cells in which Cre is expressed (Supplemental Figs. 1B–C and 2C). TgAPPswe-Ocn mice showed a relatively normal body size, with a slight reduction in body weight (Supplemental Fig. 1D–E). We then examined whether TgAPPswe-Ocn mice show similar osteoporotic deficits to that of Tg2576 mice, which express APPswe ubiquitously.(20) The |mCT and H&E analyses of femur bone mass and structure of 5-month-old TgAPPswe-Ocn mice displayed a marked decrease of trabecular bone volumes as compared with the littermate control mice (Fig. 6A–D). The trabecular number (Th.N), trabecular thickness (Tb.Th), trabecular separation (Tb.Sp), and trabecular connectivity density (CD) were all deficient in TgAPPswe-Ocn femurs versus control littermates (Fig. 6A, B; and data not shown. The cortical BV/TV was relatively normal in TgAPPswe-Ocn femurs (Fig. 6A, B); however, the total cortical bone surface appeared to be smaller in TgAPPswe-Ocn femurs (Fig. 6A). These results suggest a bone-loss phenotype in TgAPPswe-Ocn similar to that of Tg2576 mice.(20)
Fig. 6.

Loss of trabecular bone mass in TgAPPswe-Ocn femurs and decrease of in vitro OB genesis in TgAPPswe-Ocn-BMSC culture. (A, B) The μCT analysis of femurs from 5-month-old TgAPPswe-Ocn and control littermates (Tg[flox]APPswe). Five different mice of each genotype (males and females) were examined blindly. Representative 3D images are shown in A. Quantification analyses (mean ± SD, n = 5) are presented in B. * p < 0.05, significant difference from control littermates. Note that the trabecular bone (tb) volumes over total volumes (BV/TV), the trabecular bone numbers (Th.N), trabecular separation (Tb.Sp), and the connectivity density (CD) were all deficient in TgAPPswe-Ocn femurs as compared with the WT control. The cortical bone volumes over total volumes in TgAPPswe-Ocn appeared to be normal. (C, D) H&E staining analysis of femurs from 5-month-old control and TgAPPswe-Ocn mice. Representative images are shown in C.Bar= 10 μm. Quantification analyses (mean ± SD, n = 5) are presented in D. *p < 0.05, significant difference. (E, F) In vitro osteoblastogenesis showed decreased ALP+ cells derived from TgAPPswe-Ocn-BMSC culture. Representative images of ALP staining are shown in E, and the quantification analysis of the average ALP activities (mean ± SD from 3 different cultures) is presented in F. *p < 0.01, significant difference. Bar = 20 μm.
In addition, we analyzed OB differentiation of BMSCs derived from TgAPPswe-Ocn mice at 3 months old. In agreement with the results from Tg2576-BMSC culture, a reduction of OB differentiation, revealed by ALP staining, was also observed in TgAPPswe-Ocn-BMSC culture (Fig. 6E, F). These results thus provide further support for APPswe inhibition of osteoblasto-genesis in a cell-autonomous manner.
We also examined OC differentiation of BMMs from these mice. Interestingly, the TRAP-positive multi-nuclei-containing cells were slightly increased in TgAPPswe-Ocn-BMM culture (Fig. 7A, B). TRAP staining analysis in TgAPPswe-Ocn mice (at 5 months old) also showed a small increase as compared with the control, but no statistical significance was detected (Fig. 7C, D). These results suggest that expression of APPswe in OBs may have a cell-nonautonomous effect on osteoclasto-genesis. Further studies are necessary to verify this issue.
Fig. 7.

OC genesis in vitro and TRAP staining analysis in TgAPPswe-Ocn mice. (A, B) In vitro OC genesis of BMMs derived from control and TgAPPswe-Ocn mice (3 months old). OCs were generated from purified BMMs (5×10⁴) cultured in the presence of RANKL (100 ng/mL) and M-CSF (1%) for 6 days. Representative images of TRAP staining are shown in A. Quantitative analyses of the average TRAP-positive multinuclei cell (MNC) density (count TRAP + MNCs [>3 nuclei per cell] per unit area) are presented in B. The values of mean±SD from 3 separate cultures are shown. *p<0.05, significant difference from control. (C, D) TRAP staining analysis of femur sections from 5-month-old WT and TgAPPswe-Ocn mice. Representative images of TRAP staining are shown in C. Images marked with black squares were amplified and are shown in the bottom panels. The quantitative analysis of TRAP+ cells per unit bone surface (BS) was carried out in trabecular bones of femurs and is shown in D. The values of mean±SD from 3 different animals are shown.
Also of interest is that whereas both Tg2576 and TgAPPswe-Ocn mouse models exhibited reduced OB genesis, increased OC genesis, and decreased trabecular bone mass, the bone marrow fat-like cells (e.g., large oval-shaped vacuoles) were elevated only in Tg2576 femurs, not in TgAPPswe-Ocn femurs (Figs. 3,6C, D). These results thus suggest that APPswe expression in mature OB-lineage cells appeared to be sufficient to suppress OB genesis, but insufficient to increase bone marrow fat or induce adipogenesis.
NAC amelioration of APPswe-induced suppression of OB differentiation in culture and skeletal aging-like osteoporotic deficits in young adult Tg2576 mice
Increased oxidative stress is believed to be critical for brain aging and AD pathogenesis.(35) We thus asked if the skeletal aging-like phenotype in young adult Tg2576 mice could be ameliorated by treatments with antioxidant(s). Several antioxidants were first tested in culture, including chloro[[2,2’-[1,2-ethanediylbis [(nitrilo-kN)methylidyne]]bis[6-methoxyphenolato-kO]]]-manganese (EUK134; a manganese-salen derivative that acts as a scavenger of superoxide, hydrogen peroxide, nitric oxide [NO], and peroxynitrite),(36) diphenylene iodonium (DPI; an inhibitor of NADPH oxidase), and NAC (a glutathione [GSH] precursor that acts as an antioxidant by increasing GSH levels and by directly interacting with free radicals)(37) (Fig. 8A). In addition, N-[N-(3,5-difluorophenacetyl)-l-alanyl]-S-phenylglycine t-butyl ester (DAPT), an inhibitor of g-secretase that blocks Ap production, was also examined(38) (Fig. 8A). Both EUK134 and DAPT reduced OB differentiation of BMSCs derived from WT mice (Fig. 8B, D, G). Little rescue effect by DAPT and EUK134 was detected on OB formation in Tg2576-BMSC cultures (Fig. 8B, D). Interestingly, NAC treatment resulted in a marked increase of OB formation in Tg2576-BMSC cultures, as well as a slight increase of OBs in WT-BMSC cultures (Fig. 8C, D). We then examined NAC’s effect on adipocyte formation in Tg2576-BMSC culture. The increased adipogenesis in Tg2576-whole bone marrow culture was suppressed by NAC, as compared with vehicle treatment (Fig. 8E, F). These results thus suggest that NAC prevents not only APPswe-suppression of osteoblastogenesis, but also APPswe-induction of adipogenesis in culture.
Fig. 8.

NAC rescue of APPswe-suppression of OB differentiation and APPswe-induction of adipogenesis in culture. (A) A schematic illustration of different antioxidants and DAPT’s effects on APP metabolism and oxidative stress. (B–D) Effects of EUK134, DAPT, and NAC on OB differentiation (viewed by ALP staining) of BMSCs derived from WT and Tg2576 mice. Representative images of ALP staining are shown in B and C, and the quantification analysis of the average ALP activities (normalized by WT control) is presented in D. (E, F) Effect of NAC on adipogenesis (viewed by Oil Red O staining) of BMSCs derived from WT and Tg2576 mice. Representative images of Oil Red O staining are shown in E, and the data were quantified and are shown in F. In D and F, the values of mean±SD from 3 different cultures are presented. *p<0.01, significant difference. (G) The table summarizes the effects of EUK134, DPI, and NAC on OB and OC genesis.
We further tested if osteoporotic deficit in young adult Tg2576 mice could be ameliorated by NAC treatment. Tg2576 mice (at 1 month old) were given drinking water containing vehicle or NAC (2 mg/kg/d) for 3 months and their femur bone samples and sera were then collected for phenotypic analysis. As shown in Fig. 9A, B, bone volume, particular trabecular bone volume, was markedly increased in NAC-treated Tg2576 femurs, as compared with that of vehicle treatment, based on mCT analysis. Bone formation, viewed by Goldner’s trichrome staining of osteoid density and by measurement of serum levels of osteocalcin, was also elevated in NAC-treated Tg2576 mice (Fig. 9C–E). These results thus demonstrate an efficient amelioration of APPswe-induced osteoporotic deficit by NAC treatment, suggesting a clinical value of NAC for treating AD-associated bone-loss disorders.
Fig. 9.

NAC amelioration of skeletal aging-like osteoporotic deficit in young adult Tg2576 mice. Tg2576 mice (at 1 month old, 5 per group, male and females) were fed drinking water containing with vehicle (Veh.) or NAC (2 mg/kg/d) for 3 months, and their femur bone samples and sera were collected for phenotypic analysis. (A, B) The μCT analysis displayed an increased trabecular bone volumes of NAC-treated Tg2576 femurs. In addition, the trabecular bone thickness (Tb.Th) and trabecular separation (Tb.Sp) were all ameliorated or improved by NAC treatment. The cortical bone volumes were unaffected by NAC. (C, D) Goldner’s trichrome staining analysis showed an increased osteoid numbers of trabecular bones in NAC-treated Tg2576 femurs. Representative images are shown in C, and the data were quantified (osteoid area/bone area, normalized by WT) and are shown in D. (E) Increased serum levels of osteocalcin in NAC-treated Tg2576 mice were detected by ELISA assays. In B, D, and E, the values of mean±SD from 5 different animals per genotype are shown. *p<0.05, significant difference.
In addition to NAC’s effect on bone formation, we examined its role in bone resorption in WT and Tg2576 mice and in vitro OC genesis from BMM culture. Bone resorption, indicated by serum levels of PYD, was reduced by NAC treatment inTg2576 mice, but not in WT mice (Fig. 10A). Also reduced by NAC treatment were serum levels of IL-6 (a proinflammatory cytokine frequently associated with increased bone resorption) in Tg2576 mice, but not in WT mice (Fig. 10B). Furthermore, in BMM culture, NAC treatment showed a significant reduction of OC genesis, but this effect appeared to be moderate as compared to that of DPI (an inhibitor of NADPH oxidase) (Fig. 10C, D). Taken together, these results suggest that NAC’s amelioration of the osteoporotic deficit in Tg2576 mice may be due to its antioxidant effects on both OB-lineage and OC-lineage cells.
Fig. 10.

NAC inhibition of bone resorption in Tg2576 mice and OC genesis in vitro. Measurements of serum levels of PYD (A) and IL-6 (B) in 4-month-old WT and Tg2576 mice treated with vehicle (Veh.) or NAC by RIA and ELISA analyses, respectively. Five mice per genotype (males and females) were measured. *p<0.05, significant difference from control. (C, D) Effects of NAC, EUK134, and DPI on in vitro OC genesis from BMMs. Representative images of TRAP staining are shown in C. Quantitative analyses of the average TRAP-positive multinuclei cell (MNC) density (count TRAPþMNCs [>3 nuclei per cell] per unit area) are presented in D. The values of mean±SD from 3 separate cultures are shown. *p<0.05, significant difference from control.
Discussion
This study provides evidence for APPswe in suppression of osteoblastogenesis and bone formation. Such a function appears to be cell autonomous, because selective expression of APPswe in mature OB-lineage cells results in a decrease of osteoblasto-genesis and loss of trabecular bone mass. The decreased OB differentiation in young adult Tg2576 mice was accompanied by increased adipogenesis and elevated bone marrow fat, displaying a skeletal aging-like osteoporotic deficit. Although decreased OB differentiation was noted in the TgAPPswe-Ocn mice, changes in marrow fat were not noted. Remarkably, these osteoporotic deficits were ameliorated by treatment with NAC, an antioxidant. These results thus demonstrate a function of APPswe in accelerating skeletal aging, suggest an underlying mechanism for the increased bone fracture rate in AD patients, and reveal the importance of NAC in the increase of antioxidant levels; e.g., GSH.
The decreased bone formation in Tg2576 mice may reflect the reduced differentiation of BMSCs into OBs, because decreased OB genesis in APPswe-expressing BMSCs is observed by an in vitro osteogenic assay. However, it is necessary to further examine this issue by additional experiments, such as in vivo transplantation of the BMSCs. Because normal osteocytes express little APP/Aß, we cannot rule out the contribution to the phenotype of ectopic expression of APPswe in Tg2576 or TgAPPswe-Ocn mice by osteocytes. It also remains to be determined if decreased BMSC proliferation and/or increased OB apoptosis contribute to the decreased bone mass. Whereas these results suggest a cell-autonomous function of APPswe in suppression of OB differentiation, causing bone loss, it does not exclude a possible contribution of increased OC to the osteoporotic deficit in young adult Tg2576 and TgAPPswe-Ocn mice.(20)
It is interesting to note that young adult Tg2576 mice showed an increase in bone marrow fat, but a decrease in bone mass. Such a negative correlation between bone mass and fat deposition in bone marrow in Tg2576 mice supports the view that bone marrow fat may be driven at the expense of new bone formation.(39,40) However, this negative correlation was not detected in TgAPPswe-Ocn mice, which only showed reduced bone mass without obvious increase of bone marrow fat. In addition, the trabecular bone loss and increased bone marrow fat in femurs was only detected in young adult, but not aged (>8 months old), Tg2576 mice (Fig. 3). The aged (>8 months old) TgAPPswe-Ocn femurs displayed trabecular bone loss (Fig. 6; data not shown). These phenotypic differences between Tg2576 and TgAPPswe-Ocn mice may reflect the age-associated different expression patterns of APPswe. APPswe expression in Tg2576 mice is under the control of a prion promoter; thus, APPswe is expressed as early as E12.5 at higher levels in younger ages and is ubiquitously expressed in multiple types of cells, including OB-lineage and OC-lineage cells.(20,24) By contrast, APPswe expression in TgAPPswe-Ocn mice is under the control of the osteocalcin promoter, which drives APPswe expression selectively in mature OB-lineage cells in mice >2 months old.(41) The higher level expression of APPswe in young, but not aged, Tg2576 mice may be an underlying reason for osteoporotic deficits mainly detected in young adults. The OB-selective APPswe expression in TgAPPswe-Ocn mice may be too late to promote BMSC differentiation into adipocytes. Alternatively, APPswe expression in BMM/OC-lineage cells in Tg2576 mice, but not in TgAPPswe-Ocn mice, may also be critical for promoting adiposity of BMSCs by increasing inflammation. These possibilities remain to be further investigated.
Although the mechanisms underlying increased bone marrow fat remain unclear, it is postulated that reactive oxygen species (ROS) may regulate the “switch signals” in BMSCs and divert BMSCs into the adipocyte lineage at the expense of OBs. This is supported by the observation that depletion of the Forkhead box class O (FoxO) family of redox-sensitive transcription factors leads to an increase of adipogenesis and a decrease of osteogenesis.(42,43) In addition, mounting evidence has indicated that age-related increases of ROS are fundamental mechanisms in the decline of bone mass and strength. Accumulation of ROS results in a decrease of OB lifespan, bone formation, and bone mass in culture and in sex steroid-sufficient female or male mice.(39,40) Deletion of FoxO transcription factors, an important defense mechanism against ROS in young adult mice, recapitulates the adverse effects of aging in bone, including increases in ROS, apoptosis of OBs and osteocytes, and osteoporosis.(42,43) Overexpression of FoxO3 in OBs, on the other hand, increases bone mass.(43) ROS also diverts mesenchymal stem cells into the adipocyte lineage at the expense of OBs, and the lipids oxidized by ROS can serve as peroxisome proliferator-activated receptor gamma (PPARg) ligands, promoting adipogenesis.(44,45)
NAC has been shown to be an effective precursor to GSH production by providing cysteine, the rate-limiting substrate in GSH synthesis.(37) Thus, NAC acts as an antioxidant by increasing GSH levels and by directly interacting with free radicals, which may be crucial for preventing APPswe-induced oxidative stress and deleterious effect. Indeed, treatment with NAC ameliorates the osteoporotic deficit in young adult Tg2576 mice, including increased bone formation, decreased bone resorption, and elevated bone mass. In APPswe-BMSC culture, NAC treatment increased OB differentiation and decreased adipogenesis. NAC treatment in BMM culture also reduced OC differentiation. These results support the view that ROS contribute to the skeletal aging-like deficit in Tg2576 mice, and suggest that NAC may be an effective drug in amelioration of APPswe-induced bone deficit. This latter view is also in line with previous observations that pretreatment with NAC in AD animal models, including Tg2576 mice, has reduced Ap levels, decreased lipid peroxidation, and improved cognition.(37)
Supplementary Material
Acknowledgements
We thank Dr. Tom Clemens (Johns Hopkins Medical School) for providing Ocn-Cre mice. We also thank members of the Xiong and Mei laboratories for helpful discussions. This study was supported in part by grants from the National Institutes of Health (to WCX and LM) and the U.S. Veteran’s Administration (WCX).
Footnotes
Additional Supporting Information may be found in the online version of this article.
Disclosures
All authors state that they have no conflicts of interest.
References
- 1.Davies L, Wolska B, Hilbich C, Multhaup G, Martins R, Simms G, Beyreuther K, Masters CL. A4 amyloid protein deposition and the diagnosis of Alzheimer’s disease: prevalence in aged brains determined by immunocytochemistry compared with conventional neuropathologic techniques. Neurology. 1988;38:1688–93. [DOI] [PubMed] [Google Scholar]
- 2.Tysiewicz-Dudek M, Pietraszkiewicz F, Drozdzowska B. Alzheimer’s disease and osteoporosis: common risk factors or one condition predisposing to the other?. Ortop Traumatol Rehabil. 2008;10: 315–23. [PubMed] [Google Scholar]
- 3.Melton LJ 3rd, Beard CM, Kokmen E, Atkinson EJ, O’Fallon WM. Fracture risk in patients with Alzheimer’s disease. J Am Geriatr Soc. 1994;42:614–9. [DOI] [PubMed] [Google Scholar]
- 4.Tan ZS, Seshadri S, Beiser A, Zhang Y, Felson D, Hannan MT, Au R, Wolf PA, Kiel DP. Bone mineral density and the risk of Alzheimer disease. Arch Neurol. 2005;62:107–11. [DOI] [PubMed] [Google Scholar]
- 5.Sato Y, Asoh T, Oizumi K. High prevalence of vitamin D deficiency and reduced bone mass in elderly women with Alzheimer’s disease. Bone. 1998;23:555–7. [DOI] [PubMed] [Google Scholar]
- 6.Luckhaus C, Mahabadi B, Grass-Kapanke B, Janner M, Willenberg H, Jager M, Supprian T, Fehsel K. Blood biomarkers of osteoporosis in mild cognitive impairment and Alzheimer’s disease. J Neural Transm. 2009;116:905–11. [DOI] [PubMed] [Google Scholar]
- 7.Masters CL, Beyreuther K. Molecular neuropathology of Alzheimer’s disease. Arzneimittelforschung. 1995;45:410–2. [PubMed] [Google Scholar]
- 8.Esler WP, Wolfe MS. A portrait of Alzheimer secretases—new features and familiar faces. Science. 2001;293:1449–54. [DOI] [PubMed] [Google Scholar]
- 9.Hardy J A hundred years of Alzheimer’s disease research. Neuron. 2006;52:3–13. [DOI] [PubMed] [Google Scholar]
- 10.Hardy J Alzheimer’s disease: the amyloid cascade hypothesis: an update and reappraisal. J Alzheimers Dis. 2006;9:151–3. [DOI] [PubMed] [Google Scholar]
- 11.Ertekin-Taner N, Graff-Radford N, Younkin LH, Eckman C, Baker M, Adamson J, Ronald J, Blangero J, Hutton M, Younkin SG. Linkage of plasma Abeta42 to a quantitative locus on chromosome 10 in late-onset Alzheimer’s disease pedigrees. Science. 2000;290:2303–4. [DOI] [PubMed] [Google Scholar]
- 12.Stefani M, Liguri G. Cholesterol in Alzheimer’s disease: unresolved questions. Curr Alzheimer Res. 2009;6:15–29. [DOI] [PubMed] [Google Scholar]
- 13.Poirier J Apolipoprotein E and Alzheimer’s disease. A role in amyloid catabolism. Ann N Y Acad Sci. 2000;924:81–90. [DOI] [PubMed] [Google Scholar]
- 14.Kaneki M [Genomic approaches to bone and joint diseases. New insights into molecular mechanisms underlying protective effects of vitamin K on bone health]. Clin Calcium. 2008;18:224–32. [PubMed] [Google Scholar]
- 15.Sugarman MC, Kitazawa M, Baker M, Caiozzo VJ, Querfurth HW, LaFerla FM. Pathogenic accumulation of APP in fast twitch muscle of IBM patients and a transgenic model. Neurobiol Aging. 2006; 27:423–32. [DOI] [PubMed] [Google Scholar]
- 16.Beyreuther K, Dyrks T, Hilbich C, Monning U, Konig G, Multhaup G, Pollwein P, Masters CL. Amyloid precursor protein (APP) and beta A4 amyloid in Alzheimer’s disease and Down syndrome. Prog Clin Biol Res. 1992;379:159–82. [PubMed] [Google Scholar]
- 17.Weller RO, Boche D, Nicoll JAR. Microvasculature changes and cerebral amyloid angiopathy in Alzheimer’s disease and their potential impact on therapy. Acta Neuropathol. 2009;118:87–102. [DOI] [PubMed] [Google Scholar]
- 18.Weller RO, Preston SD, Subash M, Carare RO. Cerebral amyloid angiopathy in the aetiology and immunotherapy of Alzheimer disease. Alzheimers Res Ther. 2009;1:6. [DOI] [PMC free article] [PubMed] [Google Scholar]
- 19.Koistinen H, Prinjha R, Soden P, Harper A, Banner SJ, Pradat P-F, Loeffler J-P, Dingwall C. Elevated levels of amyloid precursor protein in muscle of patients with amyotrophic lateral sclerosis and a mouse model of the disease. Muscle Nerve. 2006;34:444–50. [DOI] [PubMed] [Google Scholar]
- 20.Cui S, Xiong F, Hong Y, Jung JU, Li XS, Liu JZ, Yan R, Mei L, Feng X, Xiong WC. APPswe/Abeta regulation of osteoclast activation and RAGE expression in an age-dependent manner. J Bone Miner Res. 2011;26:1084–98. [DOI] [PMC free article] [PubMed] [Google Scholar]
- 21.Zhou Z, Immel D, Xi CX, Bierhaus A, Feng X, Mei L, Nawroth P, Stern DM, Xiong WC. Regulation of osteoclast function and bone mass by RAGE. J Exp Med. 2006;203:1067–80. [DOI] [PMC free article] [PubMed] [Google Scholar]
- 22.Zhou Z, Han JY, Xi CX, Xie JX, Feng X, Wang CY, Mei L, Xiong WC. HMGB1 regulates RANKL-induced osteoclastogenesis in a manner dependent on RAGE. J Bone Miner Res. 2008;23:1084–96. [DOI] [PMC free article] [PubMed] [Google Scholar]
- 23.Hsiao K, Chapman P, Nilsen S, Eckman C, Harigaya Y, Younkin S, Yang F, Cole G. Correlative memory deficits, Abeta elevation, and amyloid plaques in transgenic mice. Science. 1996;274:99–102. [DOI] [PubMed] [Google Scholar]
- 24.Asante EA, Gowland I, Linehan JM, Mahal SP, Collinge J. Expression pattern of a mini human PrP gene promoter in transgenic mice. Neurobiol Dis. 2002;10:1–7. [DOI] [PubMed] [Google Scholar]
- 25.Zhang W, Yang N, Shi X-M. Regulation of mesenchymal stem cell osteogenic differentiation by glucocorticoid-induced leucine zipper (GILZ). J Biol Chem. 2008;283:4723–9. [DOI] [PubMed] [Google Scholar]
- 26.Huang Q, Aluise CD, Joshi G, Sultana R, St Clair DK, Markesbery WR, Butterfield DA. Potential in vivo amelioration by N-acetyl-L-cysteine of oxidative stress in brain in human double mutant APP/PS-1 knock-in mice: toward therapeutic modulation of mild cognitive impairment. J Neurosci Res. 2010;88:2618–29. [DOI] [PubMed] [Google Scholar]
- 27.Andreassen OA, Dedeoglu A, Klivenyi P, Beal MF, Bush AI. N-acetyl-L-cysteine improves survival and preserves motor performance in an animal model of familial amyotrophic lateral sclerosis. Neuroreport. 2000;11:2491–3. [DOI] [PubMed] [Google Scholar]
- 28.Wen L, Tang FL, Hong Y, Luo SW, Wang CL, He W, Shen CY, Xiong F, Jung JU, Lee DH, Zhang QG, Brann D, Kim TW, Yan R, Mei L, Xiong WC. Vps35 haploinsufficiency increases Alzheimer’s disease neuropathology. J. Cell Biol. 2011;195:765–79. [DOI] [PMC free article] [PubMed] [Google Scholar]
- 29.Ashe KH. Learning and memory in transgenic mice modeling Alzheimer’s disease. Learn Mem. 2001;8:301–8. [DOI] [PubMed] [Google Scholar]
- 30.German DC, Eisch AJ. Mouse models of Alzheimer’s disease: insight into treatment. Rev Neurosci. 2004;15:353–69. [DOI] [PubMed] [Google Scholar]
- 31.McLeod J, Curtis N, Lewis HD, Good MA, Fagan MJ, Genever PG. Gamma-secretase-dependent cleavage of amyloid precursor protein regulates osteoblast behavior. FASEB J. 2009;23:2942–55. [DOI] [PubMed] [Google Scholar]
- 32.Verma S, Rajaratnam JH, Denton J, Hoyland JA, Byers RJ. Adipocytic proportion of bone marrow is inversely related to bone formation in osteoporosis. J Clin Pathol. 2002;55:693–8. [DOI] [PMC free article] [PubMed] [Google Scholar]
- 33.Justesen J, Stenderup K, Ebbesen EN, Mosekilde L, Steiniche T, Kassem M. Adipocyte tissue volume in bone marrow is increased with aging and in patients with osteoporosis. Biogerontology. 2001; 2:165–71. [DOI] [PubMed] [Google Scholar]
- 34.Meunier P, Aaron J, Edouard C, Vignon G. Osteoporosis and the replacement of cell populations of the marrow by adipose tissue. A quantitative study of 84 iliac bone biopsies. Clin Orthop Relat Res. 1971;80:147–54. [DOI] [PubMed] [Google Scholar]
- 35.Sultana R, Butterfield DA. Oxidative modification of brain proteins in Alzheimer’s disease: perspective on future studies based on results of redox proteomics studies. J Alzheimers Dis. 2013;33(Suppl 1): S243–51. [DOI] [PubMed] [Google Scholar]
- 36.Ni X, Yang Z-J, Carter EL, Martin LJ, Koehler RC. Striatal neuroprotection from neonatal hypoxia-ischemia in piglets by antioxidant treatment with EUK-134 or edaravone. Dev Neurosci. 2011;33:299–311. [DOI] [PMC free article] [PubMed] [Google Scholar]
- 37.Pocernich CB, Butterfield DA. Elevation of glutathione as a therapeutic strategy in Alzheimer disease. Biochim Biophys Acta. 2012;1822:625–30. [DOI] [PMC free article] [PubMed] [Google Scholar]
- 38.Imbimbo BP, Giardina GAM. g-Secretase inhibitors and modulators for the treatment of Alzheimer’s disease: disappointments and hopes. Curr Top Med Chem. 2011;11:1555–70. [DOI] [PubMed] [Google Scholar]
- 39.Almeida M, Han L, Martin-Millan M, Plotkin LI, Stewart SA, Roberson PK, Kousteni S, O’Brien CA, Bellido T, Parfitt AM, Weinstein RS, Jilka RL, Manolagas SC. Skeletal involution by age-associated oxidative stress and its acceleration by loss of sex steroids. J Biol Chem. 2007; 282:27285–97. [DOI] [PMC free article] [PubMed] [Google Scholar]
- 40.Manolagas SC, Parfitt AM. What old means to bone. Trends Endocrinol Metab. 2010;21:369–74. [DOI] [PMC free article] [PubMed] [Google Scholar]
- 41.Zhao G, Monier-Faugere MC, Langub MC, Geng Z, Nakayama T, Pike JW, Chernausek SD, Rosen CJ, Donahue LR, Malluche HH, Fagin JA, Clemens TL. Targeted overexpression of insulin-like growth factor I to osteoblasts of transgenic mice: increased trabecular bone volume without increased osteoblast proliferation. Endocrinology. 2000;141:2674–82. [DOI] [PubMed] [Google Scholar]
- 42.Rached MT, Kode A, Xu L, Yoshikawa Y, Paik JH, Depinho RA, Kousteni S. FoxO1 is a positive regulator of bone formation by favoring protein synthesis and resistance to oxidative stress in osteoblasts. Cell Metab. 2010;11:147–60. [DOI] [PMC free article] [PubMed] [Google Scholar]
- 43.Ambrogini E, Almeida M, Martin-Millan M, Paik JH, Depinho RA, Han L, Goellner J, Weinstein RS, Jilka RL, O’Brien CA, Manolagas SC. FoxO-mediated defense against oxidative stress in osteoblasts is indispensable for skeletal homeostasis in mice. Cell Metab. 2010; 11:136–46. [DOI] [PMC free article] [PubMed] [Google Scholar]
- 44.Almeida M, Ambrogini E, Han L, Manolagas SC, Jilka RL. Increased lipid oxidation causes oxidative stress, increased peroxisome proliferator-activated receptor-gamma expression, and diminished pro-osteogenic Wnt signaling in the skeleton. J Biol Chem. 2009; 284:27438–48. [DOI] [PMC free article] [PubMed] [Google Scholar]
- 45.Almeida M, Han L, Martin-Millan M, O’Brien CA, Manolagas SC. Oxidative stress antagonizes Wnt signaling in osteoblast precursors by diverting beta-catenin from T cell factor- to forkhead box O-mediated transcription. J Biol Chem. 2007;282:27298–305. [DOI] [PubMed] [Google Scholar]
Associated Data
This section collects any data citations, data availability statements, or supplementary materials included in this article.