

Summary:
Development of effective targeted cancer therapies is fundamentally limited by our molecular understanding of disease pathogenesis. Diffuse intrinsic pontine glioma (DIPG) is a fatal malignancy of the childhood pons characterized by a unique substitution to methionine in histone-3 at lysine 27 (H3K27M) that results in globally altered epigenetic marks and oncogenic transcription. Through primary DIPG tumor characterization and isogenic oncohistone expression, we show that the same H3K27M mutation displays distinct modes of oncogenic reprogramming and establishes distinct enhancer architecture depending upon both the variant of histone-3 and the cell-context in which the mutation occurs. By comparison to non-malignant pediatric pontine tissue, we identify and functionally validate both shared and variant-specific pathophysiology. Together, we provide a powerful resource of epigenomic data in 25 primary DIPG samples and 5 rare normal pediatric pontine tissue samples, revealing clinically relevant functional distinctions previously unidentified in DIPG.
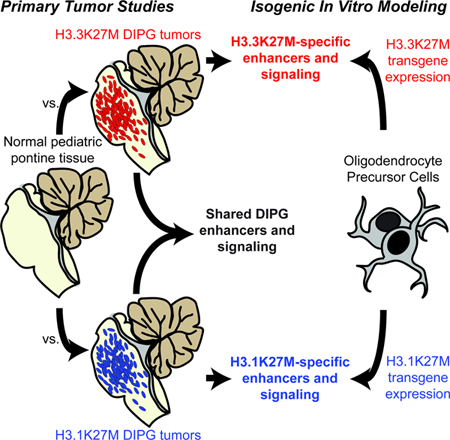
Graphical Abstract
eTOC Blurb:
Diffuse intrinsic pontine glioma is a lethal pediatric brain cancer characterized by the H3K27M histone mutation. Nagaraja et al. characterize a large cohort of rare primary tumors and normal pontine tissue to reveal active regulatory element heterogeneity dependent on the histone variant and cell context in which the mutation occurs.
Introduction
Diffuse intrinsic pontine glioma (DIPG) is a devastating malignancy of the pediatric pons with a median survival of ~10 months (Mackay et al., 2017). With resistance to conventional chemotherapies and a lack of surgical options, developing effective targeted therapeutic strategies for DIPG requires a deeper understanding of the molecular underpinnings of its malignant state. The hallmark of midline pediatric gliomas is a mutation in histone-3 affecting lysine 27 (H3K27M), present in ~ 80% of DIPG cases (Khuong-Quang et al., 2012; Schwartzentruber et al., 2012; Wu et al., 2012; Aihara et al., 2014; Gessi et al., 2015; Mackay et al., 2017). Clonal evolution models indicate that H3K27M is likely the first mutation to occur in DIPG tumorigenesis and present in essentially all subclonal populations (Nikbakht et al., 2016; Vinci et al., 2018). While this mutation occurs in only one of many histone genes, representing just 5–10% of the total histone pool, H3K27M causes oncogenic gene expression through global depletion of the repressive histone modification, lysine 27 trimethylation (H3K27me3) (Bender et al., 2013; Chan et al., 2013; Lewis et al., 2013).
Recent studies have demonstrated that the H3K27M mutant histone induces a dose-dependent inhibition of the H3K27me3 methyltransferase complex, Polycomb repressive complex 2 (PRC2), and that H3.3K27M colocalizes with active chromatin and transcription throughout the genome (Piunti et al., 2017). Furthermore, single molecule imaging in live cells demonstrated that H3.3K27M causes an increased search time for PRC2 to bind its targets (Tatavosian et al., 2018). Given that thousands of loci retain H3K27me3 in the presence of H3K27M (Bender et al., 2013; Chan et al., 2013; Piunti et al., 2017; Stafford et al., 2018), with the strongest PRC2 targets being the least affected (Mohammad et al., 2017; Harutyunyan et al., 2019), it appears that the oncohistone disrupts the ability of PRC2 to recognize its binding sites and results in preferential H3K27me3 retention at high affinity targets.
The subsequent effects of H3K27M on other chromatin marks remain a focus of study. Multiple studies have demonstrated the formation of heterotypic H3.3K27M/H3.3WT nucleosomes that are enriched for lysine 27 acetylation (H3K27Ac) (Lewis et al., 2013; Piunti et al., 2017). Recent studies have revealed that H3K27M also globally increases levels of other activating histone marks, such as H4 acetylation and H3K36 methylation (Stafford et al., 2018), indicating that the effects of H3K27me3 loss extend beyond the H3K27 residue. Deciphering the details of how the H3K27M mutation dysregulates chromatin activation will be paramount for understanding its role in driving DIPG oncogenesis.
Interestingly, while the H3K27M mutation most frequently occurs in the H3F3A locus of histone variant H3.3, in ~20% of DIPG cases it occurs in H3.1/2 variants, usually in the HIST1H3B gene (Buczkowicz et al., 2014; Fontebasso et al., 2014; Taylor et al., 2014; Wu et al., 2014; Mackay et al., 2017). Each variant of H3K27M DIPG tends to acquire distinct secondary mutations, as H3.3K27M co-occurs with mutations in the TP53 pathway and H3.1K27M with mutations in ACVR1 and PI3K pathway genes (Buczkowicz et al., 2014; Fontebasso et al., 2014; Taylor et al., 2014; Wu et al., 2014; Mackay et al., 2017). Broad differences in clinical phenotype and DNA methylation have been observed between H3.1K27M and H3.3K27M DIPG (Sturm et al., 2012; Castel et al., 2015, 2018). However, given that the effects of H3K27M appear to depend upon both the local chromatin environment and the abundance of the oncohistone in chromatin, we sought to better understand if molecular distinctions exist between the H3.3K27M and H3.1K27M oncohistones in chromatin dysregulation and tumorigenesis.
Results
Active enhancers reveal variant-specific chromatin states in H3K27M DIPG
We first asked whether each H3K27M variant establishes a distinct histone mark profile by examining the active enhancer and promoter landscape of primary DIPG tumors and normal pediatric human pons tissue. We performed H3K27Ac chromatin immunoprecipitation followed by sequencing (ChIP-seq) in 25 post-mortem H3K27M DIPG tumor specimens (16 H3.3K27M, 9 H3.1K27M DIPGs) and five non-malignant pediatric pons specimens (Table S1). Unsupervised clustering revealed five states of enhancer and promoter activation (Figure 1A, S1A,B), with most samples separating into three groups consisting of normal pons, H3.1K27M DIPG and H3.3K27M DIPG (H3.3K27M Group A; Figure 1B).
Figure 1. Variant-specific active enhancer landscapes in primary H3K27M DIPG.

A) Clustering of the primary DIPG and normal pontine enhancer landscape. Data shown as principal component analysis (PCA) of H3K27Ac signal at active enhancers. Colors indicate clusters (n = 30 primary human tissue samples; 25 DIPG, 5 non-malignant pediatric pons).
B) H3K27Ac signal in H3.3K27M Group A (n = 11), H3.1K27M (n = 9), and normal pons (n = 3) primary samples at variant enhancers.
C) GREAT analysis of differential enhancers active in both H3.3K27M Group A and H3.1K27M clusters over normal pons.
D) Enrichment map analysis of all genes with mean SE rank in DIPG at least 300 higher than normal pons. Size of circle indicates number of genes and darkness of circle indicates lower p value.
E) SE-associated TFs in DIPG. Y-axis shows mean rank of SE in primary DIPG, ordered on x-axis by increasing mean rank in the DIPG cluster. All genes showing SE mean rank difference of at least 300 were plotted. Circles indicate selected genes shown and green text indicates oligodendroglial lineage genes.
F) Whole tissue RNA-seq of select SE-associated genes, shown as natural log transformed expression relative to average expression in normal pons (H3.3K27M, n = 5; H3.1K27M, n = 6; normal pons, n = 2).
G) GREAT analysis of active enhancers with differential H3K27Ac signal between H3.3K27M Group A and H3.1K27M DIPG.
The separation of these clusters was not due to differences in treatment, age, or ChIP-seq quality (Figure S1C–E). Considering that the H3.3K27M and H3.1K27M mutations tend to co-occur with distinct secondary mutations (Mackay et al., 2017), we analyzed the association of each active chromatin cluster with mutational status (Figure S1F). The most significant association with each cluster was the variant of H3K27M (H3.1K27M cluster adjusted p-value = 1.3 x 10⁻⁵). We found a statistically significant association of ACVR1 mutation with the H3.1K27M cluster (adjusted p-value = 0.03), consistent with its known coaggregation with the H3.1K27M variant (Buczkowicz et al., 2014; Fontebasso et al., 2014; Taylor et al., 2014; Wu et al., 2014; Mackay et al., 2017). However, as ACVR1 mutation was absent in a large portion of H3.1K27M DIPG samples (n = 3/9) and this mutation alone has minimal effects in the absence of H3.1K27M (Hoeman et al., 2019), it is likely that the distinct chromatin states of DIPG are driven by the variant of H3K27M present. Together, these findings indicate that the H3.3K27M and H3.1K27M mutations establish globally distinct active enhancer and promoter states in DIPG.
A small number of samples (n = 4/16) clustered apart from the majority of H3.3K27M cases. We found that the enhancer profile of H3.3K27M Group B samples enriched for immune cell activation and inflammatory response (Figure S2A,B). This signal appeared to be specific to immune cells and demonstrated low lymphocytic infiltrate and chemokine production (Figure S2C,D), consistent with the generally non-inflammatory microenvironment of DIPG (Lin et al., 2018). Taken together, this signature likely arises from an atypically high number of immune cells present in these samples. Similarly, one sample (CNMC7) clustered alone and demonstrated a super-enhancer (SE) profile (Hnisz et al., 2013; Lovén et al., 2013; Whyte et al., 2013) enriched for neuron-specific genes (Figure S2E–G), likely indicating a substantial presence of neurons, perhaps reflecting sampling of a neuron-rich pontine nucleus. We thus focused our subsequent analyses on the majority of samples in the H3.3K27M Group A (n = 11/16).
In order to define the pathways central to DIPG, we identified differentially activated enhancers in each of the H3.1K27M and H3.3K27M Group A clusters over normal pons and functionally annotated those elements shared between the two clusters (Figure 1C, S2H). We also identified core oncogenic pathways preferentially associated with SEs in DIPG over normal pons (Figure 1D). Both groups of DIPG showed an enrichment for genes involved in receptor tyrosine kinase signaling, proteoglycan synthesis, cation transport and canonical WNT signaling. RNA sequencing (RNA-seq) demonstrated that these H3K27Ac differences correlated with increased gene expression (Figure 1F) and many of these pathways have known roles in DIPG and other gliomas (Yadavilli et al., 2016; Nagaraja et al., 2017). As WNT/β-catenin signaling is critical in glioblastoma (GBM) cancer stem cell maintenance (Rheinbay et al., 2013), we asked whether this pathway is also active in DIPG. Using a fluorescent reporter of WNT signaling, we find that both H3.3K27M and H3.1K27M patient-derived DIPG cells demonstrate active WNT/β-catenin signaling when orthotopically xenografted into the juvenile murine pons (Figure S2I–L), suggesting it may be an important pathological dependency of both DIPG subgroups.
We additionally identified transcription factors (TFs) preferentially associated with SEs in DIPG over normal pons (Figure 1E). Both canonical WNT effectors (TCF7L1, TCF7L2) and chromatin remodeling complex subunits (BRD4, CBX family) were strongly enriched in DIPG tumors. Additionally, the TF PRRX1 was preferentially marked with SEs in both H3.3K27M and H3.1K27M glioma. This TF has been shown to mark GBM stem cells and is required for tumor initiation and growth (Li et al., 2017), potentially playing a similar role in DIPG. SEs were also enriched at core oligodendrocyte lineage TFs (OLIG1/2, SOX10, MYRF), as well as genes involved in oligodendroglial differentiation. We did not find SEs marking astrocytic lineage genes (Figure S2M; Zhang et al. 2014). This builds upon our recent studies showing that DIPG resembles the molecular profile of oligodendroglial precursors and may arise from a cell in this lineage (Monje et al., 2011; Nagaraja et al., 2017; Filbin et al., 2018).
We next asked how the differences in enhancer architecture between H3.3K27M and H3.1K27M DIPG translates to oncogenic signaling. Enhancers associated with PI3K signaling and p38 MAPK signaling were differentially activated in H3.1K27M DIPG tumors (Figure 1G). As PI3K mutations co-occur with H3.1K27M (Mackay et al., 2017) but are only present in a subset of our samples (n = 4/9), this epigenetic activation further suggests that the PI3K pathway is central to H3.1K27M DIPG pathobiology. By contrast, differentially activated enhancers in H3.3K27M Group A demonstrated an enrichment for genes involved in Rho GTPase activity, cytoskeletal remodeling and early neural development (Figure 1G). As Rho signaling is integral to DIPG invasion (Qin et al., 2017), these findings are consistent with primary H3.3K27M DIPG tumors displaying a less differentiated, more invasive and more aggressive phenotype (Castel et al., 2015).
Variant-specific chromatin accessibility, TF networks, and H3K27M localization
Consistent with the differences in covalent histone modification, the chromatin accessibility profiles of H3.3K27M and H3.1K27M DIPGs clustered separately and apart from normal pediatric pons (Figure 2A, S3A–C), further reinforcing the variant-specific active chromatin states of DIPG. Furthermore, many signaling pathways with differences in H3K27Ac enhancer signal also exhibit differences in chromatin accessibility (Figure 2B,C), highlighting multiple levels of differential pathway regulation between subgroups. To examine whether these differences were associated with distinct profiles of TF binding, we quantified motif variation in accessible regions within SEs and found that H3.3K27M and H3.1K27M DIPG clustered separately by motif signal as well (Figure S3D). Motifs for the SE-associated TFs PRRX1, NFIC and NFIX were enriched in both H3K27M subgroups over normal pons (Figure 2D). This indicates that not only are these genes preferentially marked for activation in DIPG tumors, but the TFs are also likely bound at SEs genome-wide.
Figure 2. H3.3K27M and H3.1K27M DIPG show discrete profiles of accessibility and oncohistone localization.

A) Clustering of accessibility at enhancer elements in primary DIPG samples and normal pediatric pons. Data shown as PCA of Omni-ATAC signal. Colors indicate clusters (n = 9 primary human tissue samples; 7 DIPG, 2 non-malignant pediatric pons).
B) GREAT analysis of differentially accessible enhancer elements between H3.3K27M Group A (n = 3) and H3.1K27M DIPG (n = 2).
C) Representative Omni-ATAC track. X-axis represents genomic location and y-axis represents reads per million (RPM). Black bars indicate differential distal peaks.
D) Top shared motifs enriched over normal pons (H3.3K27M Group A, n = 3; H3.1K27M, n = 2; normal pons, n = 2). Ordered by average differential enrichment over normal pons.
E) Motifs with different signal between H3.3K27M and H3.1K27M DIPG.
F) Enrichment plots of WT H3.3 or H3K27M signal at H3K27Ac peaks in H3.3K27M (left) or H3.1K27M (right) patient-derived cultures. Y-axis shows reads per million (RPM) (n = 2).
G) Scatter plots of mean H3.3 or H3K27M enrichment at all H3.3 peaks in H3.3K27M (left) or H3.1K27M (right) patient-derived cultures (n = 2).
H) Representative genome tracks showing H3K27Ac, H3K27M, and H3.3 localization in SU-DIPG cultures. X-axis represents genomic location and y-axis represents RPM.
See Figure S3.
We then examined motifs that vary between DIPG subgroups and found that H3.3K27M DIPG enriched for TFs involved in early neural development (Figure 2E, S3E). This included the RFX family, which plays a crucial role in midline brain structure formation (Sedykh et al., 2018). By contrast, H3.1K27M DIPG enriched for motifs involving MAFK-NFE signaling, including NFE2L3, which is known to mediate cancer cell resistance to therapy (Rojo de la Vega, Chapman and Zhang, 2018). Together, these findings indicate that the TF networks controlling the cell state of H3.3K27M and H3.1K27M DIPG are likely distinct as well.
To test if the differences in transcriptional state between H3.3K27M and H3.1K27M DIPG may be driven by distinct oncohistone localization, we performed H3K27M ChIP-seq in both H3.3K27M and H3.1K27M patient-derived DIPG cultures. We found that the H3.3K27M mutant histone is enriched at active regulatory elements and demonstrated high correlation with WT H3.3 (Figure 2F,G), suggesting identical trafficking for the oncohistone. By contrast, we found that H3.1K27M did not localize with WT H3.3 and was uniformly distributed across the genome, consistent with the distribution of WT H3.1 (Szenker, Ray-Gallet and Almouzni, 2011). Importantly, this is not due to differential antibody affinity for each H3K27M variant (Figure S3F,G). Together, these findings indicate that the localization of the H3.3K27M and H3.1K27M variants is largely distinct and closely parallels that of their WT counterparts. While previous reports (Piunti et al., 2017) demonstrate that the H3.3K27M oncohistone colocalizes with active chromatin, we show that H3.1K27M is distributed across the genome (Figure 2H). This distinction may guide the variant-specific differences in histone modification, chromatin accessibility, and TF binding observed between DIPG subgroups.
Noncanonical WNT signaling drives formation of a gap junction-mediated network in H3.3K27M DIPG.
We asked whether these distinctions in enhancer profiles revealed different oncogenic signaling networks. As H3.3K27M Group A preferentially activated enhancers associated with noncanonical WNT signaling and cytoskeletal remodeling (Figure 1G, 2B), we hypothesized that H3.3K27M DIPG may display increased WNT planar cell polarity (WNT/PCP) signaling (Humphries and Mlodzik, 2018). Concordantly, we found that WNT/PCP pathway components were expressed in primary H3K27M glioma cells (Figure S4A) and preferentially activated in H3.3K27M tumor tissue over H3.1K27M tissue (Figure 3A,B).
Figure 3. Noncanonical WNT/PCP signaling creates an interconnected network in H3.3K27M DIPG cells.

A) Differential H3K27Ac signal at cytoskeletal remodeling gene ARHGEF16. X-axis represents genomic location and y-axis represents RPM. Red bars indicate differential enhancers and promoters activated in H3.3K27M Group A over H3.1K27M DIPG.
B) Primary DIPG whole tissue expression levels of select genes associated with differential enhancers (H3.3K27M, n = 5; H3.1K27M, n = 6).
C) Representative images of patient-derived DIPG cultures treated with WNT5A or vehicle for 24 h. Red arrows indicate neurite-like processes. Scale bars 200 μm.
D) Distribution of neurite length in patient-derived DIPG cultures. Y-axis shows number of neurites normalized to total number of cells, binned by length (n = 3).
E) Quantification of neurites > 50 μm in patient-derived DIPG cultures. Y-axis shows number of neurites normalized to total number of cells (n = 3).
F) Lucifer yellow (LY) ionotophoresis of connected cells. Time indicated measures seconds from pipette placement. Blue arrow indicates cell directly filled with LY, black arrow indicates LY filled patch pipette, and red arrow indicates neighboring cell. Scale bars 40 μm.
G) Representative confocal images of primary DIPG tissue for H3K27M (red) and nestin (NES; white). Scale bars 10 μm.
H) Quantification of primary DIPG cells with neurites. Y-axis shows percent of H3K27M+ cells in primary tissue with at least one NES+ neurite.
All pooled data shown as mean +/− s.d.; * adjusted p value < 0.1, ** adjusted p value < 0.01.
See Figure S4.
In order to study the role of this pathway, we first identified the patient-derived DIPG cell cultures (Grasso et al., 2015; Nagaraja et al., 2017; Qin et al., 2017) most faithful to primary tumors (Figure S4B). When exposed to WNT5A, a classical activator of WNT/PCP signaling, H3.3K27M DIPG cells underwent a rapid extension of cytoskeleton-containing neurite-like processes that correlated with RhoA activation (Figure 3C,D, S4C–F). Many of these neurites were greater than 50 μm in length and this effect did not occur in H3.1K27M cells (Figure 3E). We hypothesized that these structures may be analogous to gap junction-coupled “tumor microtubes” previously described in adult glioma (Osswald et al., 2015) and similarly constitute an interconnected network of DIPG cells. We accordingly found that upon whole cell patch clamping, the gap junction permeable dye lucifer yellow passed from the patched cell into neighboring cells connected by such processes (Figure 3F).
We additionally identified neurite-like, cytoskeleton-containing structures in primary DIPG tissue (Figure 3G). As predicted by the active enhancer profile and subtype-specific in vitro response, H3.3K27M DIPG tissue contained a greater number of tumor cells extending neurite-like processes when compared to H3.1K27M tumors (Figure 3H). Together, these data indicate that WNT5A-induced cytoskeletal remodeling contributes to an interconnected network in H3.3K27M DIPG, which in itself may promote cell viability (Figure S4G). Additionally, as gap junction-connected networks of tumor cells drive therapeutic resistance in adult high-grade glioma and represent exciting opportunities for therapeutic development (Osswald et al., 2015; Jung et al., 2017; Weil et al., 2017), similar vulnerabilities may exist in H3.3K27M DIPG.
H3.1K27M DIPG demonstrates differential sensitivity to p38 MAPK inhibition.
In addition to the PI3K pathway, H3.1K27M DIPG tumors exhibit differentially activated enhancers associated with genes in the p38 MAPK pathway (Figure 1G, 4A). As this pathway has been shown to promote cell survival in other malignancies (Qi et al., 2015; Roy et al., 2018), we hypothesized that p38 MAPK signaling supports cell growth in DIPG. Once placed in a growth factor (GF) sensitive state (Figure 4B), both H3.3K27M and H3.1K27M cultures demonstrated p38 MAPK activation in response to GF stimulation (Figure 4C). However, when GFs were reintroduced in the presence of p38 MAPK-selective inhibitor SB202190, only H3.1K27M DIPG cell growth was sensitive to loss of this pathway (Figure 4D, Two-way ANOVA p value < 0.0001). These findings further validate the functional relevance of the enhancer differences between DIPG subgroups and highlight the distinct oncogenic signaling established by each H3K27M variant.
Figure 4. p38 MAPK signaling facilitates cell growth in H3.1K27M DIPG.

A) Differential H3K27Ac signal at p38 MAPK pathway gene MAPKAPK2. X-axis represents genomic location and y-axis represents RPM. Blue bars indicate differential enhancers and promoters activated in H3.1K27M over H3.3K27M Group A DIPG.
B) Experimental paradigm for GF sensitization of DIPG cultures and subsequent studies shown in (C) and (D).
C) Western blot in patient-derived DIPG cultures following treatment with B27 alone (−) or with GFs (+). PPIB shown as loading control.
D) Cell viability of patient-derived DIPG cultures following GF treatment with or without p38 MAPK inhibition (SB202190). Values for each culture are normalized to B27 only + DMSO treated cells (n = 3).
All pooled data shown as mean +/− s.d.; * adjusted p value < 0.1, ** adjusted p value < 0.01, *** adjusted p value < 0.001, **** adjusted p value < 0.0001.
OPCs recapitulate the active chromatin state of DIPG better than NPCs
We next investigated the mechanisms by which the H3.3K27M and H3.1K27M oncohistones establish distinct disease states. The findings above utilize fully transformed glioma tissue and cultures, which does not allow investigation of the early events of H3K27M chromatin remodeling. Thus, we created a stage-specific inducible H3K27M model in isogneic human precursor cells to study H3K27M chromatin reprogramming during development (Figure S5A). Dual transgene systems were established with either H3.3K27M/H3.1WT or H3.3WT/H3.1K27M constructs (further referenced respectively as “H3.3K27M” or “H3.1K27M”) to control for any variant-specific effects of WT histone expression.
We first attempted to determine the cellular state most closely resembling DIPG in which to study the effects of H3K27M. As both neural stem cells and oligodendrocyte precursor cells (OPCs) have been suggested as possible cells-of-transformation (Monje et al., 2011; Lewis et al., 2013; Funato et al., 2014; Nagaraja et al., 2017; Pathania et al., 2017; Filbin et al., 2018; Larson et al., 2018), we differentiated human pluripotent stem cells along the oligodendroglial lineage and quantified enhancer activation at three stages: multipotent neural precursors (NPCs), pre-OPCs, and early OPCs (eOPCs) (Figure 5A, S5B,C). By comparing the molecular states of uninduced precursor cells to primary DIPG, we found that further oligodendroglial lineage differentiation resulted in enhancer profiles that more closely resembled both H3.3K27M and H3.1K27M primary DIPG tumors (Figure 5B). Additionally, oligodendroglial stages recapitulated the active chromatin state of primary DIPG at key lineage markers better than the NPC stage (Figure 5C).
Figure 5. Stage-specific induction of H3K27M indicates an oligodendrocyte-lineage cell of transformation.

A) Schematic for differentiation from human pluripotent stem cells (hPSC) to multipotent NPC, pre-OPC, and eOPC stages.
B) Comparison of H3K27Ac enrichment at all enhancers at each differentiation stage without H3K27M induction. Y-axis shows primary DIPG log2(mean H3K27Ac enrichment) and x-axis shows NPC, pre-OPC, or eOPC log2(mean H3K27Ac enrichment) (n = 2).
C) H3K27Ac genome tracks at oligodendroglial lineage markers OLIG1/2 and NKX2.2. Samples from each primary DIPG group are shown overlaid as a single track. X-axis represents genomic location and y-axis represents RPM.
See Figure S5.
While H3.1K27M primary tumors showed increased correlation with further oligodendroglial maturation, these tumors demonstrated lower correlation than H3.3K27M primary tumors and appeared to be more differentiated than our eOPC model system (Figure 5B, S5D,E). As previous studies have suggested an astrocytic identity for H3.1K27M DIPG (Castel et al., 2015), we examined the set of astrocyte-specific genes found to be upregulated in H3.1K27M DIPG whole tissue. Primary DIPG single cell RNA-seq revealed that H3.3K27M and H3.1K27M primary DIPG cells expressed these genes at very similar levels to one another (Figure S5F), suggesting these differences observed in bulk transcriptomic studies (Castel et al., 2015) are due to microenvironmental cells. Taken together with our finding that H3.3K27M and H3.1K27M primary DIPG samples exhibit SEs at oligodendroglial lineage TFs (Figure 1E,), these findings show that the epigenetic states of both DIPG subgroups most resemble oligodendrocyte precursors, suggesting a cell-of-transformation from this lineage.
Previous studies have found H3K27M expression to drive oncogenic transformation in NPCs (Lewis et al., 2013; Funato et al., 2014; Larson et al., 2018). We find that H3K27M induction while maintaining the NPC state results in activation of primitive neuroectodermal programs that do not accurately describe DIPG (Figure S5G–J), which may explain the medulloblastoma tumorigenesis observed following in vivo NPC expression of H3.3K27M in murine models (Larson et al., 2018). As these models exhibit DIPG tumor formation as well, this suggests an interesting possibility that the H3K27M mutation could in some cases be acquired at a quiescent NPC state and DIPG transformation occurs following differentiation into an early oligodendroglial lineage precursor cell. Such a NPC cell-of-mutation and OPC cell-of-origin has been described in a mouse model of adult GBM (Liu et al., 2011).
H3.3K27M and H3.1K27M each preferentially disrupt distinct PRC2 targets.
In order to determine whether the differences in H3.3K27M and H3.1K27M glioma could be explained by variant-specific mechanisms of PRC2 dysregulation, we directly compared the effects of each oncohistone during the earliest stages of transformation. As the effects of H3K27M have been shown to depend on cell division (Chan et al., 2013), we first induced each oncohistone in eOPCs for approximately one cell cycle (14 days; Figure S6A,B). We performed ChIP-seq with exogenous reference spike-in controls to account for global histone mark change (Orlando et al., 2014) and found similar overall levels of H3K27me3 loss by each oncohistone variant (Figure S6C,D). However, when examining individual H3K27me3 loci, we found that each H3K27M variant displayed a distinct profile of H3K27me3 loss at this early timepoint (Figure 6A, S6E).
Figure 6. Variant-specific H3K27me3 loss during early H3K27M expression.

A) PCA of H3K27me3 signal at all peaks in eOPCs following 14 days of H3K27M induction.
B) H3K27me3 change at CGIs in eOPCs following H3K27M induction for 14 days. X-axis represents mean log2(H3K27me3 enrichment) in control eOPCs (n = 3) and y-axis represents mean log2(H3K27me3 enrichment change) (n = 2 per H3K27M variant). Black dots represent CGIs with log2(H3K27me3 enrichment) > 1 in all control samples.
C) Correlation between mean H3.3 enrichment and H3K27me3 change at H3K27me3+ CGIs. X-axis represents mean log2(H3.3 enrichment) in control eOPCs and y-axis represents mean log2(H3K27me3 enrichment change).
D) Enrichment plots of ChIP-seq signal at high H3.3 (left) and low H3.3 (right) H3K27me3+ CGIs. Y-axis shows average ChIP-seq signal with H3.3 and EED shown as RPM (top) and H3K27me3 as reference-adjusted RPM (RRPM; bottom).
E) Comparison of mean ChIP-seq singal at H3K27me3+ CGIs in control eOPCs. Color scale indicates level of log2(H3.3 enrichment), x-axis shows log2(H3K27me3 enrichment), and y-axis shows log2(EED enrichment).
F) GREAT analysis on high H3.3 and low H3.3 H3K27me3+ CGIs.
See Figure S6.
We next quantified signal at CpG islands (CGIs), given their canonical ability to recruit PRC2 (Deaton and Bird, 2011), and also observed global H3K27me3 loss following H3K27M induction (Figure 6B). Given that the H3.3K27M variant colocalizes with WT H3.3 (Figure 2G) and PRC2 inhibition increases with H3K27M dosage, we hypothesized that H3.3K27M may preferentially disrupt H3.3-labeled CGIs. Strikingly, we found that H3.3 enrichment directly correlated with the degree of H3K27me3 loss at CGIs in H3.3K27M eOPCs (r = –0.48; Figure 6C, S6F,G) but not H3.1K27M eOPCs (r = −0.05), likely due to the diffuse genomic distribution of the H3.1 oncohistone. Thus, we show here that the specific profiles of disruption during the initial H3K27M chromatin remodeling parallel the distinct genomic localization of each oncohistone variant.
To better understand what role H3.3 may play at CGIs, we defined H3.3 high and H3.3 low CGIs as the top and bottom 1000 H3K27me3+ CGIs by H3.3 enrichment levels, respectively. In addition to occurring more at promoter elements (Figure S6H), H3.3 high CGIs were paradoxically characterized by higher levels of PRC2 core subunit EED and lower H3K27me3 signal (Figure 6D,E), likely representing less stably repressed regions with active PRC2 recruitment (Banaszynski et al., 2013). Intriguingly, H3.3 high CGIs were also associated with less differentiated gene programs, such as early brain development and patterning (Figure 6F), closely resembling the active enhancer profile differentially enriched in primary H3.3K27M DIPG (Figure 1G, 2B). Taken together, the variant-specific reprogramming patterns during early H3K27M remodeling disrupt PRC2 targets with different functional properties that may drive divergence of DIPG subgroups.
Expression of H3.3K27M or H3.1K27M is sufficient to establish distinct active enhancer and promoter profiles
We found that H3K27M expression for one cell cycle (14 days) resulted in enhancer remodeling with variant-specific correlation, but these changes were relatively subtle (Figure S7A). However, expression for approximately one additional division (25 days) drove greater changes in the active enhancer profile (Figure S7B). We selected for the strongest changes in active regulatory elements, filtering for those showing at least two-fold difference in H3K27Ac enrichment following oncohistone induction. We found both oncohistones activated pathways involved in neural communication and spinal cord development and deactivated cell adhesion and cell differentiation (Figure S7C). When examining the variant specific changes, we find that H3.3K27M expression in eOPCs drives activation of Rho GTPase signaling, neurite extension, and early neural development, while H3.1K27M activates p38 MAPK signaling (Figure 7A, S7D). This closely parallels the variant-specific enhancers activated in primary DIPG (Figure 1G), indicating that these early changes in the active enhancer and promoter landscape persist through full DIPG tumor transformation.
Figure 7. Each H3K27M variant is sufficient to establish distinct profiles of active chromatin that parallel primary DIPG.

A) Top H3K27Ac changes following 25 days of H3K27M expression in eOPCs. Upper heatmap shows enhancers and promoters activated by H3.3K27M only and bottom heatmap activated by H3.1K27M only, ordered by average difference in enrichment. GREAT analysis of each set of regions shown to right.
B) Comparison of transcriptional change for each H3K27M subclone after 25 days of expression. Each axis shows RNA-seq log2(fold-change over control eOPCs) for the doxycycline treated eOPC subclone indicated.
C) Primary DIPG sample scores for H3.3K27M eOPC vs. H3.1K27M eOPC signatures. Plotted value is difference between H3.3K27M and H3.1K27M active chromatin scores for each primary sample.
D) Primary DIPG sample scores for H3.3K27M NPC vs. H3.1K27M NPC signatures. Plotted value is difference between H3.3K27M and H3.1K27M active chromatin scores for each primary sample.
E) Distribution of H3K27me3 loss and H3K27Ac gain. Contact domains represent locally associated regions of chromatin contact. Top CGIs represent top ~2500 for each oncohistone. H3K27M activated regions represent variant-specific regions shown in panel (A). All RefSeq annotated genes are shown in gray.
F) Boxplot showing number of H3K27me3+ CGIs with high H3K27me3 loss associated with the same contact domain as each H3K27Ac peak set. Activated peaks are shown in (A) and controls are a signal-matched peak set. P-value from Mann-Whitney nonparametric test.
G) Representative genome tracks showing H3K27me3 loss and H3K27Ac gain. Red bars show regions with H3K27Ac activation from panel A (top). Y-axis shows RRPM for H3K27me3 and RPM for all other ChIP-seq tracks.
See Figure S7.
Overall, we found relatively subtle gene expression change following H3K27M expression for two cell-cycles (Figure S7E), consistent with previous studies showing that H3K27me3 depletion only translates to large-scale transcriptional change following shift in cellular state (Riising et al., 2014). Nonetheless, even at this early time point, we found that transcriptional change differed between oncohistone variants (Figure 7B). Altogether, these findings demonstrate distinct profiles of chromatin and gene activation by each oncohistone variant during early H3K27M-mediated transformation.
We next sought to determine if each oncohistone variant alone could drive the distinctions between primary DIPG subgroups. We quantified activation of the H3.3K27M-specific or H3.1K27M-specific enhancers and promoters (Figure 7A) in our primary DIPG samples and scored each tumor on its activation of each signature. The result was a striking separation of primary DIPG samples by their H3K27M variant (Figure 7C), with the H3K27Ac changes specific to H3.3K27M eOPCs preferentially activated in primary H3.3K27M DIPG samples. Notably, the enhancer and promoter changes driven by H3K27M expression in NPCs did not discriminate between H3.3K27M and H3.1K27M DIPG (Figure 7D). Isogenic expression of each oncohistone variant is sufficient to discriminate the active chromatin profiles of primary DIPG and establish distinct epigenetic states. Furthermore, the effects of H3K27M expression are highly dependent on cell type, with H3K27M remodeling in eOPCs rather than NPCs creating active enhancer and promoter changes that closely parallel primary DIPG.
Finally, we asked how the discrete profiles of H3K27me3 loss influenced the subsequent changes in the H3K27Ac landscape. H3.3K27M has been shown to create heterotypic nucleosomes enriched for H3K27Ac on the WT histone. If the H3.1K27M activated regions were due to heterotypic H3.1K27M-containing nucleosomes, we would expect depletion of H3.3 signal at these sites. However, we found little difference in H3.3 levels at these activated enhancers and promoters when compared to all active H3K27Ac peaks (Figure S7F).
Interestingly, active enhancers and promoters were located far from CGIs losing H3K27me3 (Figure S7G). Given that long-range chromatin looping often results in regulatory domains spanning hundreds of kilobases or megabases, we hypothesized that H3K27me3 loss and dysregulation of chromatin repression may result in subsequent activation of topologically associated enhancers and promoters. Using previously published highly conserved regulatory domains (Rao et al., 2014), we assigned each H3K27me3+ CGI and variant-specific active enhancer or promoter to a chromatin contact domain in order to approximate regions associated in three-dimensional space. Consistently, H3K27Ac gain at enhancers and promoters was associated with the CGIs demonstrating the highest H3K72me3 loss (Figure 7E–G). This suggests that the different profiles of H3K27me3 loss during early H3K27M transformation may explain the subsequent distinctions in H3K27Ac gain.
Overall, these findings build upon growing evidence that the effect of H3K27M on PRC2 activity has extended consequences, with H3K27me3 loss driving a fundamental shift in chromatin regulation (Stafford et al., 2018; Krug et al., 2019). Our data suggest a model where H3.3K27M and H3.1K27M DIPG tumors diverge due to their distinct patterns of oncohistone localization and the subsequent effect on chromatin remodeling within a regulatory domain. Distinct patterns of H3K27me3 loss during the initial stages of tumorigenesis drive topologically associated enhancers and promoters to become persistently activated, resulting in differences in malignant signaling pathways that steer the divergence of H3.3K27M and H3.1K27M DIPG.
Discussion
Through active chromatin profiling in 25 primary tumor samples and 5 non-malignant pediatric pontine tissue samples, as well as isogenic H3K27M expression in eOPCs, we show here that H3K27M DIPG exists as two disease states fundamentally driven by distinct profiles of active regulatory elements. These distinctions in transcriptional regulation and cell signaling suggest that H3.3K27M and H3.1K27M DIPG should be stratified as functionally distinct subgroups in both preclinical and clinical considerations, as each cell state appears to exhibit unique targetable vulnerabilities.
By using slow cycling cells, which likely represent the cell-of-origin for DIPG and more accurately resemble in vivo human OPC proliferation (Yeung et al., 2014), we find that variant-specific profiles of H3K27me3 loss are topologically associated with distinct changes in enhancer and promoter landscape. Importantly, we find that expression of each oncohistone variant alone in OPCs, but not NPCs, is sufficient to activate pathways that remain differentially active in terminal DIPG tumors. When interpreted with recent findings that deletion of the H3K27M mutant in fully transformed DIPG cultures results in very few enhancer changes (Krug et al., 2019), it appears that these chromatin changes are relatively fixed once transformation is complete.
Our findings of discrete profiles of derepression by each oncohistone variant during initial H3K27me3 loss may be explained by the finding that H3K27M inhibition of PRC2 is dependent upon on the amount of H3K27M present (Stafford et al., 2018). Considering that the H3.3 variant displays a restricted genomic distribution, generally limited to active chromatin and gene bodies, it is possible that H3.3-rich domains of chromatin experience a higher effective dose of the H3.3K27M oncohistone. This would result in higher local inhibition of PRC2 and greater loss of the H3K27me3 mark at these sites. By contrast, as H3.1 histones are diffusely distributed throughout the genome, the H3.1K27M histone relies predominantly upon the trans inhibition of PRC2 for H3K27me3 loss, agnostic of which H3 variant is present at a given site.
It is unclear if these different profiles of early H3K27me3 loss persist through full tumor transformation as our in vitro OPC model can only assess effects of the H3K27M mutation over the first few cell cycles. It is possible that these distinctions are lost through exponential H3K27me3 dilution from cell division in the setting of an inhibited PRC2 complex. However, as we observe variant-specific changes in active regulatory elements that remain differential in primary tumors, it will be important to study stepwise chromatin changes by each H3K27M variant, from mutation acquisition to terminal transformation, when such an in vivo model is developed.
Taken together, our study identifies both divergent and shared oncogenic signaling pathways between H3.3K27M and H3.1K27M DIPG, providing a resource for subsequent preclinical development of targeted therapy. While both subgroups of H3K27M DIPG share vulnerabilities as described above and previously demonstrated (Grasso et al., 2015; Nagaraja et al., 2017; Mount et al., 2018), other therapeutic opportunities are subtype-specific. A nuanced understanding of the pathobiology of DIPG will enable development of effective, stratified therapeutic strategies for this devastating disease.
STAR Methods
LEAD CONTACT AND MATERIALS AVAILABILITY
Please contact M.M. (mmonje@stanford.edu) for reagents and resources generated by this study.
EXPERIMENTAL MODEL AND SUBJECT DETAILS
Sample acquisition
All human samples were acquired by informed consent and in compliance with Institutional Review Board (IRB)-approved protocols at Stanford University (SU-DIPG samples), Children’s National Medical Center (CNMC samples), and University of California, San Francisco (SF5609). For primary DIPG tissue chromatin and WES studies, post-mortem whole brainstem tumor tissue was dissected into ~ 1 cm3 pieces that were either snap-frozen at the time of autopsy or shipped in Hibernate-A in ice and frozen upon receipt. Tissue pieces were randomly selected to avoid any systematic bias.
Patient-derived DIPG cultures
DIPG cultures were derived and maintained as neurospheres in Tumor Stem Media (TSM) consisting of a 1:1 mixture of DMEM/F12 (Invitrogen) and Neurobasal(-A) (Invitrogen), with addition of B27(-A) (Invitrogen), human-bFGF (20 ng/ml) (Shenandoah Biotech), human-EGF (20 ng/ml) (Shenandoah), human PDGF-AB (20ng/ml) (Shenandoah) and heparin (10 ng/ml).
hPSC culture and cell line establishment
The healthy control induced pluripotent stem cell (iPSC) line 2242–1 (Sloan et al., 2017) was used in this study. Cells were cultured in mTESR1 (STEMCELL Tech 85870) on Matrigel (Corning 354277) and passaged using Accutase (STEMCELL Tech 07920) with ROCK inhibitor Y27632 (Reprocell 04–0012-02).
For inducible H3 constructs, WT or K27M cDNA for H3F3A or HIST1H3B were cloned into a piggyBac vector by Gibson assembly under a Tet regulatory element (TRE) with a 3xFLAG or 3xHA tag and P2A-eGFP or P2A-NLS-dTomato. Vectors contained a second constitutive selectable promoter of either UBC-NeoR (HIST1H3B) or UBC-BlastR (H3F3A). iPSCs were transfected at ~90% confluency in antibiotic free mTESR1 + 2.5 μM ROCK inhibitor with 5 μg of pB constructs (2.5 μg of each HIST1H3B or H3F3A) and 1 μg of pB transposase using FuGene HD with a 6:1 ratio of FuGene HD:DNA. A half media change was performed 4 to 6 hours after transfection. iPSCs were allowed to grow for 48 hours before splitting 1:4 and were then selected with blasticidin (Thermo R21001, 4 μg/mL) and G418 (Thermo 10131035, 50 μg/mL) for 4 days. Following selection, 3000 iPSCs were plated in a six-well plate and colonies originating from a single cell were picked and expanded as subclonal cell lines.
METHOD DETAILS
ChIP and library preparation
DIPG cultures were cross-linked in 1% formaldehyde for 10 min at RT and then quenched with 0.125 M glycine for 10 min at RT. Following two HBSS washes, pellets were frozen and stored at −80°C. Pellets were thawe d and membrane lysis was performed in 5 mL LB1 (50 mM HEPES pH 8.0, 140 mM NaCl, 1 mM EDTA, 10% glycerol, 0.5% NP-40, 0.25% Triton X-100, 1 mM PMSF, Roche protease inhibitors 11836170001) for 10 min at 4°C. Nuclei were pellete d at 1350xg for 5 minutes at 4°C and lysed in 5 mL LB2 (10 mM Tris-Cl pH 8.0, 5 M, 200 mM NaCl, 1 mM EDTA, 0.5 mM EGTA, 1 mM PMSF, Roche protease inhibitors) for 10 min at RT. Chromatin was pelleted at 1350xg for 5 minutes at 4°C and resuspe nded in 1 mL of TE Buffer + 0.1% SDS before sonication on a Covaris E220. Samples were clarified by spinning at 16,000xg for 10 min at 4°C. Supernatant was transfe rred to a new tube and diluted with 1 volume of IP Dilution Buffer (10 mM Tris pH 8.0, 1 mM EDTA, 200 mM NaCl, 1 mM EGTA. 0.2% Na-DOC, 1% Na-Laurylsarcosine, 2% Triton X-100). Sheared chromatin input controls (25 to 50 μL) were then collected and ChIP was performed overnight with 5 μg of antibody per IP: H3K27Ac (Active Motif #39133), H3.3 (Millipore #09–838), H3K27M (Millipore ABE419).
Antibody bound chromatin was captured on Protein G Dynabeads, washed 5x with RIPA Wash Buffer (50 mM HEPES pH 8.0, 500 mM LiCl, 1 mM EDTA, 1% NP-40, 0.7% Na-Deoxycholate) and 1x with 1 mL TE Buffer (10 mM Tris-Cl pH 8.0, 1 mM EDTA) with 500 mM NaCl. Washed beads were resuspended in 200 μL ChIP Elution Buffer (50 mM Tris-Cl pH 8.0, 10 mM EDTA, 1% SDS) and chromatin was eluted following incubation at 65°C for 15 minutes. Supernatant and input chrom atin were removed to fresh tubes and reverse cross-linked at 65°C overnight. Samples were diluted with 200 μL TE Buffer, treated with 0.2 mg/mL RNase A (Qiagen 19101) for 1.5–2 hours at 37°C, then 0.2 mg/mL Proteinase K (Life Technologies EO0491) for 30 minutes at 55°C. DNA was PCI extracted and DNA was ethanol precipitated. DNA was resuspended in 5 mM Tris pH 8.0.
ChIP DNA libraries were end-repaired with T4 polymerase (NEB M0203L), Klenow fragment (NEB M0210L), and T4 polynucleotide kinase (NEB M0201L) and 3’ A-tailed with Exo-Klenow fragment (NEB M0212L). NEBNext Illumina Multiplex Oligo Adaptors (NEB E7335S) were ligated and excess adapters were removed with Ampure XP bead purification (Beckman Coulter A63881). Ligated DNA was PCR amplified using NEBNext Multiplex Primers and purified using AMPure XP beads. Libraries were pooled and sequenced on a NextSeq 500 by Stanford Functional Genomics Facility. H3K27Ac ChIP-seq data for SU-DIPG6, SU-DIPG13, SU-DIPG17 Medulla, and SU-DIPG4 used from Nagaraja et al 2017.
For whole tissue ChIP in DIPG and normal pediatric pons, 100 to 300 mg of post-mortem fresh frozen tissue was minced with a razor blade in 10 cm dish on dry-ice while still frozen until fine enough to pass through a P1000 pipette. Samples were then removed from dry-ice, quickly resuspended in 500 μL ice-cold HBSS supplemented with Complete Protease Inhibitors (Roche) and 2 mM PMSF, transferred to a 1.5 mL tube on ice and triturated with a P1000 and P200 until able to pass through tip easily. Dissociated tissue was then mixed with 500 μL of 2% formaldehyde/HBSS supplemented with Complete Protease Inhibitors and 2 mM PMSF and rotated at RT for 10 min. Fixation was quenched with 0.125 M glycine for 10 min at RT and tissue was washed twice with HBSS. Lysis was performed as described above. Samples were sonicated for 8 minutes and then removed to ice, where 25 μL was removed, clarified, and partially reverse cross-linked with 1 μL Proteinase K (Life Tech EO0491) at 62°C for 1 h. DNA was purified and run on a gel to ensure a size distribution of 150 to 500 bp. Samples were sonicated further if necessary. IP, washes, reverse cross-linking, DNA purification, library preparation, and sequencing were performed as described above.
Whole exome and genome sequencing
For SU-DIPG samples and SF5609, genomic DNA was extracted from primary tissue using DNEasy Blood & Tissue kit (Qiagen #69504). Whole exome enrichment and library preparation was performed using 200 ng of genomic DNA and SureSelectXT Reagent Kit (Agilent #G9611A) with SureSelectXT Human All Exon v6 (Agilent #5190–8863) capture library. Libraries were sequenced on a NextSeq 500 by Stanford Functional Genomics Facility. All tumor-normal pairs were prepared and sequenced together. For CNMC samples, genomic DNA was extracted from frozen tissue using the Gentra Puregene DNA extraction kit according to the manufacturer’s instructions (Qiagen # 158667). For WES samples, Nextera Rapid Capture Exome kit (Illumina # 20020616) was used to prepare the paired-end libraries according to the manufacturer’s instructions using an average 36 ng of total starting genomic DNA. Sequencing was performed on Illumina HiSeq 2000 using rapid-run mode with 100 bp paired-end reads. WGS was performed using HiSeq X at 150bp read length.
Whole Tissue RNA sequencing
For new sample data, RNA was extracted from ~50 mg primary tissue that was either frozen at the time autopsy or preserved in RNALater (Qiagen #76106) using the RNEasy Mini Plus kit (Qiagen #74134) according to kit protocol. Samples were assayed on a Agilent Bioanalyzer 2100 and those with a RIN score < 6.5 were excluded.
For each sample, 0.5 to 2.5 µg of total RNA was incubated 65°C. Per kit protocol, Ambion oligo(dT) beads (Life Technologies 61006) were washed twice with Binding Buffer, incubated with total RNA at RT, and washed twice with Washing Buffer B. PolyA+ RNA was then eluted in 10 mM Tris-Cl pH 7.5 at 80°C and purified once more with oligo(dT) beads, as described above. Final polyA+ RNA was eluted in 10 µL 10 mM Tris-Cl pH 7.5, fragmented using Fragmentation Buffer (Ambion, #AM8740) to 150–400 bp and ethanol precipitated. Fragmented polyA+ RNA was resuspended in water and cDNA was synthesized using Random Hexamer Primers (Invitrogen, #48190–011) and SuperScript II (Invitrogen, #18064–014), per SSII protocol. Second strand synthesis was performed using DNA Pol I (Invitrogen #18010–025) and RNaseH (Invitrogen #18021–014) before MinElute PCR Purification (Qiagen, #28004).
Libraries preparation and sequencing was performed as described for ChIP-seq. Additional raw RNA-seq data was obtained from Grasso et al 2015. Following adaptor trimming with cutadapt v1.11, reads were aligned to the hg19 reference sequence using tophat2 (Kim et al., 2013) version 2.1.1, using a RefSeq annotated GTF as a known transcript file. Mapped reads were assigned to RefSeq genes using Rsubread (Liao, Smyth and Shi, 2014) featureCounts. Transcript per million (TPM) for each gene was determined as 1,000,000 * (reads per kilobase of transcript)/(total sum of reads per kilobase of all transcripts). Fragments per kilobase per million bp sequenced (FPKM) for each gene was calculated as 1,000,000 * (reads per kilobase of transcript)/(total reads sequenced).
To control for RNA quality, coverage of all transcripts was calculated using HOMER (Heinz et al., 2010) makeMetaGeneProfile.pl and 3’ bias was calculated as (mean coverage of 3’ quartile of transcript) / (mean coverage of 5’ quartile of transcript). New samples or previously published samples from Grasso et al 2015 (dbGaP phs000900.v1.p1) were excluded if less than 60% of reads aligned to the genome, less than 4000 genes were detected with FPKM > 5, or 3’ bias was greater than 5.5. For heatmaps, TPM values were median normalized across genes with ln(TPM+1) > 1 and then normalized to average normal pons expression. Values plotted were ln((normalized sample TPM+1) / (average normalized pons TPM + 1)).
Omni-ATAC
A slightly modified Omni-ATAC protocol (Corces et al., 2017) was used. Briefly, ~50 mg of fresh frozen tissue was placed into a 2 mL Dounce homogenizer containing 450 μL Homogenization Buffer (320 mM sucrose, 0.1 mM EDTA, 0.1% NP40, 5 mM CaCl2, 3 mM Mg(Ac)2, 10 mM Tris pH 7.5, Rochie cOmplete protease inhibitors, and 167 μM β-mercaptoethanol). Tissue was dissociated with nuclei with 10 strokes of A pestle then 20 strokes of B pestle. Debris was pelleted at 100xg for 1 min and supernatant was transferred to a 2 mL Lo-bind tube and mixed with an equal volume of 50% iodixanol solution, Underneath the sample, 600 μL of a 29% iodixanol solution was layered, and then 600 μL of 35% iodixanol solution beneath that. Samples were spun in a hanging-bucket centrifuge for 30 min at 3000xg at 4°C. The nuclei band was collected and counted using Trypan blue staining, Two technical replicates of 25,000 to 50,000 nuclei were each transferred to a tube of 1 mL ATAC-RSB with 0.1% Tween-20. Nuclei were pelleted at 500xg for 10 min at 4°C and supernatant was removed.
Omni-ATAC transposition mix was prepared at 50 μL per 50,000 nuclei (scaling linearly for lower numbers): 25 μL 2X TD buffer, 16.5 μL PBS, 0.25 μL 2% digitonin, 0.5 μL 10% Tween-20, 5.25 μL water, 2.5 μL DNA Tagment Enzyme (Illumina FC-121–1030). Samples were incubated at 37°C for 30 min and trans posed DNA was purified using MinElute columns. Following library preparation, amplified DNA was purified using 1.8X Ampure XP and fragment size was assessed using Agilent Bioanalyzer 2100 HS DNA. Samples showing high non-nucleosomal DNA (<200 bp fragment size) were excluded.
ChIP-seq processing, peak-calling, and QC
Sequencing adaptors were trimmed using cutadapt and aligned to the hg19 reference genome using bowtie2 version 2.2.4 (Langmead and Salzberg, 2012) with the --very-sensitive flag. Aligned reads with quality less than 10 removed and remaining reads were sorted using samtools version 1.2 (Li et al., 2009). PCR duplicates were removed using picardtools version 1.128 MarkDuplicates. For track visualization, each bam file was normalized to one million reads (rpm) using bedtools version 2.19.1 (Quinlan and Hall, 2010) genomecov -bg -split and then converting to bigwig format with bedGraphToBigWig (Kent et al., 2010). Tracks were displayed using the UCSC genome browser.
Peaks were called using macs2 version 2.1.1.20160309 (Zhang et al., 2008) callpeak over input controls. Broad peak calling was used for H3K27me3 and EED. Peak enrichment quality control was performed by downsampling bam files to 20 million reads using picardtools DownsampleSam and calling peaks again. ChIP and input coverage at these peaks was calculated using HOMER annotatePeaks.pl in 1 bp bins for 5 kb flanking each peak center. Enrichment at each base pair was calculated as (ChIP coverage/input coverage) and overall peak enrichment was defined as the maximum enrichment in the 500 bp flanking the peak center. H3K27Ac ChIP samples with peak enrichment of less than 7 were excluded.
Primary DIPG and culture H3K27Ac analysis
For primary sample H3K27Ac analysis, all overlapping peaks were merged with bedtools. Enhancers were identified as peaks greater than 2 kb from a RefSeq annotated TSS and promoters as those within 2 kb. Peaks were then filtered for high input signal, where each set of input library counts were scaled to a depth of 20 M reads using factor (20 million)/(number of unique mapped reads) and peaks that did not meet the following thresholds were excluded:
ChIP enrichment was then calculated as:
where, for each ChIP-input pair, counts of the library with greater depth were linearly scaled such that the final depth of both libraries were equivalent. A pseudocount (pscnt) of 5 was added to all libraries to account for low count peaks. Peaks were then filtered for enrichment and read counts, where peaks that did not meet the following thresholds in at least one sample were removed:
Max ChIP counts were defined as the maximum number of ChIP reads within a peak in any sample. The remaining set of 69,770 enhancers and 15,698 promoters were used for subsequent analysis. ChIP enrichment was log2 transformed and then median normalized to account for small variation in quality and principal component analysis was performed on normalized log2(enrichment). When the number of components was plotted against cumulative variance explained, an inflection point of 6 components was observed for both enhancers and promoters. The top-weighted 15,179 enhancers and 6,456 promoters in these six components were defined as variant regions and used for K-means clustering and heatmap generation. Clustering was performed k = 1 to k = 30 using R function kmeans() and within-cluster sum of squares was plotted for each k. Inflection points were seen at k = 5 for both enhancers and promoters. Heatmap was generated using R package pheatmap with scale=‘row’.
Only the filtered set of enhancers and promoters were used for differential analysis. Counts were median normalized before performing an ANOVA at each region. Regions with a p value less than 0.1 were further subjected to pairwise differential testing between each cluster using DESeq2 with the previously determined median normalization factors on all samples. Differential regions were determined as those with a BH-adjusted p value less than 0.1. Shared enhancers were defined as those showing statistically significant increase over normal pons samples in both H3.3K27M Group A and H3.1K27M. Subtype-specific enhancers were defined as those showing statistically significant increases between H3.3K27M Group A and H3.1K27M. GREAT analysis (McLean et al., 2010) was performed on each set of differential regions.
For correlation comparisons between patient-derived DIPG cultures and primary ChIP-seq data, as well as between hPSC differentiations and primary DIPG, all overlapping peaks in each culture-primary pair were merged. ChIP-input count adjustment, enrichment calculations, and enhancers filtering were all performed as previously described. Enrichment was log2 transformed and average log2(enrichment) was calculated across all samples within each cluster of primary DIPG samples. Log2(enrichment) for each patient-derived or iPSC-differentiated culture at all enhancers passing filters was correlated against the primary sample group average. Heatmaps were made with R package pheatmap.
Super-enhancer analysis
For each primary DIPG sample or normal pontine sample, active enhancers were defined as H3K27Ac peaks called in the sample greater than 2 kb from a RefSeq annotated TSS. Super-enhancer (SE) calls for each sample were determined using Rank Ordering of Super-Enhancers (ROSE) with the sample’s active enhancer set and full depth deduplicated bam files. SE-associated genes were determined by finding the nearest RefSeq TSS to each SE called with HOMER annotatePeaks.pl and a custom RefSeq GTF file without miRNA or snoRNA. All SE-associated genes were then compared between clusters. For each sample, the rank of each gene was determined as the rank of its SE. For genes associated with more than one SE, the highest rank was used. If a gene was not associated with a SE, it was assigned a rank of the number of SEs called in the sample + 1. All genes with mean rank at least 300 ranks higher in each DIPG cluster than normal pediatric pons were plotted and used for pathway analysis. Genes were first analyzed with gProfiler Ensembl 93, Ensembl Genomes 40 (Reimand et al., 2016) using only GO Biological Process and Reactome terms, without electronic GO annotations and limiting to terms with a set size between 2 and 500 genes and a minimum of query-term intersection of 3 genes. P-values were computed with BH-adjustment and the resulting data was then displayed with Cytoscape Enrichment Map (Merico et al., 2010), using a node cutoff of Q-value = 0.1 and overlap of 0.5.
To examine astrocytic lineage identity, the top genes enriched in astrocytes over all other brain types were identified using: https://web.stanford.edu/group/barres_lab/brain_rnaseq.html (Zhang et al. 2014).
The top SE ranks for the top 24 genes in this dataset weren plotted using ggplot2.
H3.3 and H3K27M ChIP-seq analysis
For enrichment at H3K27Ac peaks, H3.3 and H3K27M ChIP-seq biological replicates for each culture ChIP-seq were combined using HOMER makeTagDirectory. Reads were counted using HOMER annotatePeaks.pl in 5 bp bins for 5 kb flanking each peak center with normalization to one million total reads. Plots were generated using R.
H3.3 and H3K27M peak calling was performed as described for H3K27Ac. Reads for each biological replicate were counted in the combined set of all H3.3 and H3K27M peaks in all replicates of each DIPG culture. Enrichment was calculated for each sample as described above and average enrichment was calculated as mean enrichment of biological replicates for each culture. Log2(enrichment) was plotted using R at the combined set of peaks for each culture.
WES/WGS QC and variant calling
Adaptors were trimmed using cutadapt and reads were aligned to the hg19 reference sequence using bwa (Li and Durbin, 2009) mem v0.7.15. PCR duplicates were removed using picardtools MarkDuplicates. Target coverage was calculated using GATK (McKenna et al., 2010) v3.7–0 DepthOfCoverage at all RefSeq annotated genes.
Reads were then processed using GATK best practices, including indel realignment and base recalibration. For matched samples, pairwise indel realignment was performed and variants were called using GATK Mutect2. All “PASS” variants were then annotated using FATHMM-MKL (Shihab et al., 2015) and those with score < 0.5 were removed. Remaining variants were assigned to genes using Variant Effect Predictor v87 and filtered for genes identified in Mackay et al 2017 (approximately 300 genes). For unmatched samples, variants were called using GATK UnifiedGenotyper with-stand_call_conf = 30.0 and filtered using VariantFiltration for expression “MQ0 >= 4 && ((MQ0 / (1.0 * DP)) > 0.1)”, and quality less than 10. Variants with fewer than 5 reads were removed. Remaining variants were annotated with FATHMM and VEP and filtered for genes as described above. When possible, sequencing batch specific variants found in normal samples processed together to control for technical artifact.
H3K27M mutations were further confirmed by PCR and Sanger sequencing, using the following primers:
H3F3A:
Forward – AGGTGATTGATACTGCTAAC
Reverse – GTGGATACATACAAGAGAGAC
HIST1H3B:
Forward – TGGGTCCAATAGTTGGTGGT
Reverse – CACAGCTTCTCTCCAAATAGCA
HIST1H3C:
Forward – GCTGCAGATAACTGAAACGAAA
Reverse – TGCTAAAAAGACCCCTAGGAA
Indels were called using VarScan (Koboldt et al., 2012) v2.4.3 pileup2indel using indel realigned bam files. Variants were annotated with VEP and genes were filtered for genes as described.
Copy number variants were called using R package ExomeDepth (Plagnol et al., 2012) on input control files from ChIP-seq experiments. Reads were counted in RefSeq annotated exons and non-malignant pons samples were used as reference controls. CNVs were called with a transition probability of 10E-4, annotated with VEP, and filtered for genes as described.
Treatment and mutational association analysis
For each treatment received, the number of samples in each cluster was counted and a Fisher’s Exact test was performed for each cluster relative to all other clusters combined. Drugs with the same mechanism of action were grouped together. P-values were BH-adjusted. Relative risk for each cluster-treatment pair was computed as (# in cluster receiving treatment / total # receiving treatment in all clusters) / (# in cluster not receiving treatment / total # not receiving treatment in all clusters). For recurrent mutations, the number of samples with a variant in the indicated gene or family in each cluster was counted, and p values and relative risks were calculated as described for treatments. Data was plotted using pheatmap, adjusting infinite and log2(0) relative risks to the maximum and minimum values otherwise computed.
Single cell RNA sequencing
Sequencing data was obtained from Filbin et al 2018, generating transcript per million (TPM) values using RSEM and RefSeq gene annotations. Expression was transformed by ln(TPM+1) and violin plots were made using ggplot2 in R. For astrocytic gene expression analysis, we examined the top 40 genes in the set used by Castel et al. 2015 to define the H3.1K27M astrocytic signature (originally from Cahoy et al. 2008). Heatmap of ln(TPM+1) values was plotted using pheatmap() in R.
Chromatin accessibility and TF analysis
Adaptors were trimmed using cutadapt and reads were aligned to the hg19 reference sequenced with bowtie2. Reads with a quality lower than 10 were removed and PCR duplicates were removed using picardtools. Bam files were normalized to reads per million using bedtools genomecov and bigwigs were generated with bedGraphToBigWig to visualize on the UCSC genome browser. For each technical replicate, HOMER annotatePeaks.pl was used to calculate coverage 2 kb up and downstream of all Refseq TSS in single bp bins and enrichment at each bin was normalized to mean coverage of −2000 to −1801 bp. TSS enrichment was then calculated as the median enrichment between −200 and 200 bp. Samples with a TSS enrichment of less than 5 were excluded.
Peaks were individually called in each technical replicate using macs2 callpeak using a q value of 0.01 and no shifting model. To check for technical variation, overlapping peaks were merged and reads for each replicate were counted in each bin with bedtools multicov. Correlation between technical replicates was calculated between log10(counts+1) for each replicate at each peak. All samples demonstrated a correlation value of at least r = 0.8. Technical replicate bam files were then merged with samtools merge and both TSS enrichment and peak calls we performed once more on the merged replicate file.
All overlapping peaks were merged and enhancers were identified as ATAC peaks greater than 2 kb from a RefSeq TSS. A pseudocount of 5 was added to all values and counts were then median normalized and log2 transformed before performing PCA. The top 22,947 variant regions in components 1 through 5 were used for K-means clustering.
For motif variation, chromVAR analysis (Schep et al., 2017) was performed on the set of all Omni-ATAC peaks. Peaks were first resized to 500 bp while maintaining peak center. Using the ChromVAR R package, reads were counted in resized peaks with getCounts() and then GC normalized across all Omni-ATAC samples with addGCBias(). Motif deivation was then calculated using getDeviations() on the set of human_pwms_v1. Principal component analysis was used to identify variation between samples and and K-means clustering were performed on the top 501 variant motifs. For H3.3K27M Group A differential motifs, all motifs were first filtered for those with minimum deviation in the H3.3K27M Group A cluster greater than zero. The difference in mean signal between H3.3K27M Group A and H3.1K27M was then calculated and the top 50 motifs were chosen. The same was performed for H3.1K27M differential motifs and both sets were displayed with R package pheatmap. For shared motifs, all motifs were filtered such that minimum motif deviation in H3.3K27M Group A and H3.1K27M was greater than zero. The mean H3.3K27M Group A and H3.1K27M deviation was then calculated and sorted by the difference between this value and mean normal pons deviation. The top 40 motifs were plotted with pheatmap.
Growth factor treatment and cell viability
For growth-factor sensitization, normally cultured DIPG cells were plated in TSM Base with B27 only for four days. Following this starvation, cells were plated either in TSM Base with B27 only or normal growth media with EGF, FGF, and PDGF as previously described. For phospho-protein studies, cells were cultured with or without growth factors for 2 hours before collection. For growth studies, cells were cultured for 3 days as described and cell viability was measured using CellTiter-Glo (Promega G9243). p38 MAPK inhibitor SB202190 (SelleckChem S1077) was included at 10 μM in a final concentration of 0.1% DMSO.
Canonical WNT reporter assay
The GFP 7xTCF/LEF 7TG (Brugmann et al., 2007) was a gift from Roel Nusse (Addgene plasmid # 24314). The 7xTCF/LEF enhancers and eGFP were cloned into a dual piggyBac vector with a second UBC promoter driving neomycin resistance. Twenty-four hours prior to transfection, 400,000 DIPG cells were plated on poly-D-lysine/laminin coated wells. Media was changed to normal growth media without antibiotics and cells were transfected with 4 μg pB-7TG-UBC-Neo, 0.8 μg piggyBac transposase, and 20 μL of FuGene HD (Promega E2311). A half media change was performed after 6–8 hours and cells were lifted back into suspension in normal growth media the next day. Transfected cells were allowed to expand for 2–3 weeks to exclude transiently transfected cells and then selected with G418 (Thermo 10131035, 250 μg/mL) for 1 week.
For in vitro WNT reporter assays, WNT3A (R&D Systems 5036-WN-010) was reconstituted in 0.1% BSA/HBSS at 200 μg/mL. Cells were treated with either WNT3A or equal volume of vehicle for 24 h and imaged on an EVOS microscope. GFP+ cells and total number of cells were counted, and percent of GFP+ were reported for each of three biological replicates. For in vivo assays, approximately 75,000–100,000 pB-7TG-UBC-Neo DIPG cells in 1.5–2 μL were injected into the pons of P1–3 aged mice as described in Grasso et al 2015. Mice were sacrificed at P21 or P36 and immunofluorescence for H3K27M and GFP was performed as described below. Cells were counted using CellProfiler (McQuin et al., 2018) version 3.1.8 where total DIPG cells were quantified using the H3K27M channel and GFP+ cells were identified as secondary objects. Percent of GFP+ were reported for each of three biological replicates.
WNT5A treatment and neurite quantification
Recombinant human WNT5A (R&D Systems 645-WN-010) was reconstituted in 0.1% BSA / HBSS at 100 μg/mL. For neurite formation images, 10,000 cells were plated per well in a 96 well plate for 24 h with either 500 ng/mL WNT5A or equal volume of 0.1% BSA vehicle. Imaging was performed using transmitted light and 10x magnification on an EVOS microscope. For in vitro quantifications, neurite lengths were measured using ImageJ and total number of cells were quantified. For each of three biological replicates, the number of neurites in each size bin were divided by the total number of cells quantified and normalized to neurites per 100 cells. For in vivo neurite quantifications, at least two primary tissue sections were stained as described below with H3K27M and NES and both total number of H3K27M+ cells and H3K27M+ cells with NES+ neurites were quantified. At least 180 H3K27M+ cells were imaged for each primary sample and the percent of H3K27M+ cells with neurite extensions was reported.
For cytoskeletal imaging, cells were treated with SiR-actin (Cytoskeleton, cy-SC001) at 1 μM final concentration for 30 min and imaged using a Cy5 channel. For mitochondria imaging, cells were treated with MitoTracker Red CMXRos (Thermo M7512) at 100 nM for 15 min, washed, and plated for 24 h with WNT5A. Imaging was performed using an RFP channel. Both sets of imaging were performed on an EVOS microscope under 20X magnification.
RhoA studies were performed on three biological replicates of 400,000 SU-DIPG6 cells treated with 500 ng/mL WNT5A for 20 min or equal volume vehicle. Activation was assayed using RhoA G-LISA Activation Assay Kit (Cytoskeleton BK124) according to kit protocol. Treated cells were lysed in Lysis buffer and snap-frozen on dry-ice until assayed. RhoA activation signal was measured by subtracting the buffer only negative control absorbance signal from all wells.
Dye-filling assay
Cells were visualized on an upright microscope (Olympus BX 50WI) equipped with a fluorescence light source in addition to bright field illumination, using a 40X objective and DIC for contrast enhancement. The images were recorded using a Hamamatsu CCD camera (Model C7500–50) mounted to the microscope. The pipettes were pulled from borosilicate glass (Warner instruments, OD 1,5mm, ID 1,17 ID) using a upright pipette puller (Narishige Model PC-10) with a resistance of 3–5 MΩ. The pipettes were filled with an 8% Lucifer Yellow CH lithium salt (Thermo L453) solution in water.
After approaching the tumor cell membrane, the pipette was advanced a little further to get access to the intracellular space, no suction was applied to the pipette. A −100 mV hyperpolarizing rectangular pulse (25% duty on a 1000 ms interval, 1 Hz) was applied using a Multiclamp 700B amplifier (Molecular Devices) and AxoGraph software (www.axograph.com, Version 1.5.5.) and the travel of the dye visualized by switching to fluorescent illumination.
Western blotting and dot blot
Cells were lysed in RIPA buffer supplemented with Complete Protease Inhibitors, 2 mM PMSF, and Halt Phosphatase Inhibitors (Thermo 78428). Protein concentration was measured by BCA and equal protein amounts were boiled in 1x Laemmli buffer + 10% beta-mercaptoethanol. Electrophoresis was performed in 4–15% Mini-Protean TGX gels (BioRad #4561086). Samples were transferred onto PVDF membranes and blocked with 3% BSA in TBS + 0.05% Tween-20 (TBST). Primary antibodies were incubated overnight in 1% BSA/TBST overnight at the following concentrations: PPIB (Abcam ab178397, 1:2000), total p38 MAPK (CST 9212S, 1:1000), phospho-p38 MAPK (CST 9211S, 1:1000). After being washed with TBST, membranes were incubated with HRP-conjugated anti-rabbit IgG (CST 7074S, 1:5000), washed with TBST, and developed using Clarity ECL (BioRad 170–5061).
For dot blot analysis, WT or K27M H3F3A or HIST1H3B were cloned into a pCMV3 expression vector with a 3xHA tag. HEK293 cells were transfected with 15 μg vector using 3:1 Lipofectamine 2000 (Invitrogen 11668027). A fully confluent 10 cm plate was scraped 48 h after transfection and snap-frozen in dry-ice ethanol. Cell pellets were lysed in 800 μL Pierce IP Buffer (25 mM Tris-HCl pH 7.4, 150 mM NaCl, 1 mM EDTA, 1% NP-40, 5% glycerol) and recombinant protein was purified using Pierce HA-tag IP Kit (Thermo #26180). After purified histones were serially diluted, equal volumes were spotted on a nitrocellulose membrane and allowed to fully dry before blocking as described above. Blotting was performed as described above with primary antibodies as follows: anti-HA (Abcam ab9110, 1:5000), anti-H3 (Abcam ab1791, 1:2000), anti-H3K27M (Millipore ABE419, 1:5000).
hPSC differentiation and FACS isolation
OPC differentiations were performed using a modified version of the Douvaras et al 2015 protocol. Approximately 150K to 175K hPSCs were plated for four days, reaching 90 to 95% confluency. On Day 0, media was changed to Neural Induction Media: DMEM/F12, insulin (25 μg/mL, Sigma, I9278), Anti-anti (1X), SB431542 (10 μM, Stemgent, 04–0010), LDN193189 (250 nM, Stemgent, 04–0074), RA (100 nM, Sigma-Aldrich, R2625). Media was changed daily through Day 7. On, Day 8, media was changed to N2 Media: Basal Media (DMEM/F12, NEAA 1X, GlutaMax 1X, Anti-anti 1X, beta-mercaptoethanol 1X), N2 supplement (1X, Life Tech, 17502–048), RA (100 nM), SAG (1 μM, Millipore, 566660). Media was changed daily through Day 11. On Day 12, cells were lifted into low adherence plates in N2B27 media: Basal media, N2 supplement (1X), B27 Supplement without A (1X), insulin (25 μg/mL), RA (100 nM), SAG (1 μM). Two-thirds media changes were performed every other day for the rest of the protocol. On Day 20, media was changed to PDGF Media: Basal media, N2 supplement (1X), B27 Supplement without A (1X), insulin (25 μg/mL), PDGF-AA (10 ng/mL, R&D, 221-AA-050), IGF-1 (10 ng/mL, R&D, 291-G1–200), HGF (5 ng/mL, R&D, 294-HG-025), NT-3 (10 ng/mL, Millipore, GF031), T3 (60 ng/mL, Sigma-Aldrich, T2877), biotin (100 ng/mL, Sigma-Aldrich, 4639), cAMP (1 μM, Sigma-Aldrich, D0260),
For NPC studies, media on Day 08 was changed to N2 media without SAG. Cells were maintained in this media for 6 days with or without 1 μg/mL doxycycline. For pre-OPC studies, cells were maintained starting on Day 20 in N2B27 media for 6 days. For eOPC studies, cells were maintained after Day 30 in PDGF media with or without 1 μg/mL doxycycline for 14 days ot 25 days.
For FACS isolation or H3K27M single-cell immunofluorescence studies, aggregates were treated with Accutase at 37°C for approximatel y a half hour and gently triturated with a P1000 then P200 pipette, 5 to 8 times each. Undissociated aggregates were allowed to settle and dissociated cells in suspension were removed. Additional Accutase was added and process was repeated until aggregates were fully dissociated. For IF and EdU studies, cells were plated on poly-L-ornithine/laminin coated chamber slides. For ChIP-seq studies, dissociated cells were immediately fixed in 1% formaldehyde/HBSS at ~1 mL per 10 million cells for 10 min at RT and then quenched with 0.125 M glycine for 10 min at RT. Following two HBSS washes, control untreated cells were frozen and doxycycline treated cells were stained with DAPI (1 μg/mL) in 1% BSA/HBSS supplemented with PMSF and Roche Complete Protease Inhibitors to label nucleated events. Cells were sorted BD FACSAria II for DAPI+dTom+ (H3.3K27M) or DAPI+eGFP+ (H3.1K27M) cells to remove debris and cells that had silenced the TRE construct, with a yield of 0.1 to 1 million cells per sample. Cell pellets were stored at-80°C until ChIP was performed.
Low input ChIP-seq an ChIP-Rx
Low input NPC, pre-OPC, and eOPC ChIP-seq, cell membrane and nuclear lysis was performed as described for regular ChIP, adjusting lysis volumes to 1 mL to reduce loss. Samples were sonicated and monitored as described for whole tissue ChIP. Following clarification, chromatin was quantified using Qubit dsDNA HS or BR and equal amounts of chromatin was used for each untreated control and doxycycline-induced pair ChIP. Drosophila spike-in chromatin (Active Motif #53083) was added to H3K27me3 ChIP at a ratio of 2 ng spike-in per μg of sample chromatin and spike-in antibody (Active Motif #61686) was added at a ratio of 1.5 μg spike-in antibody per 5 μg of H3K27me3 antibody. The following (μg chromatin):(μg antibody) ratios were used:
| H3K27Ac | 0.175 |
| H3K27me3 (Active Motif #39155) | 0.35 |
| EED (Active Motif #61203) | 10.5 |
| H3.3 | 5.25 |
ChIP washes and reverse cross-linking were performed as described above. Following RNase and Proteinase K treatment, DNA was purified using 2.0X Ampure XP beads (Beckman Coulter A63881) and eluted in 30 μL of 5 mM Tris pH 8.0. Library preparation was performed using NEBNext Ultra II DNA Library Prep Kit (E7645S) and NEBNext Multiplex Primers (NEB #E7335S and E7500S) with 0.5 to 2 ng of DNA and sequenced on a NextSeq 500.
Read processing and mapping was performed identically to DIPG primary and culture samples except that for H3K27me3 ChIP-Rx, reads were first aligned to the hg19 genome and unmapped reads were mapped again to the dm6 Drosophila genome. Drosophila spike-in reads were filtered and deduplicated using the same parameters as described above. Sample H3K27me3 ChIP-seq was then normalized to reference-adjusted reads per million (RRPM), with normalization factor Nd = 1,000,000/(number of unique Drosophila reads) used to make bigwig files for visualization. All other samples were processed as described above.
hPSC differentiation RNA-seq
For NPC and eOPC RNA-seq, 3,000 to 150,000 cells were isolated. RNA was purified using Qiagen RNEasy Micro Kit and quantified using Agilent Bioanalyzer 2100 RNA Pico. RNA sequencing was performed using a modified version of the Smart-seq2 protocol (Picelli et al., 2014). Between 800 pg and 10 ng of total RNA in 3 to 5 uL of H2O was mixed with 1 μL dNTPs (10 mM), 0.1 μL RNase inhibitor (ClonTech, 2313A), and 0.1 μL Oligo-dT30 VN (100 μM). Samples were incubated at 72 C for 3 min and then placed on ice. cDNA reaction was prepared by adding 2 μL SSII First Strand Buffer, 0.5 μL SuperScript II, 0.25 μL RNase inhibitor, 0.5 μL DTT (100 mM), 2 μL betaine (5 M), and 0.2 μL TSO. Samples were incubated at 42 C for 90 min, 10 cycles of 50 C for 2 min then 42 C for 2 min, then 70 C for 15 min. Amplification reaction was prepared by adding 12.5 μL KAPA HotStart PCR Master Mix (Kapa Biosystems, KK2601), 0.25 μL ISPCR primers (10 μM), and 2.25 μL water. Samples were incubated at 98 C for 3 min then amplified for 8 to 14 cycles of 98 C for 20 s, 67 C for 15 s, then 72 C for 3 min, and then incubated at 72 C for 5 min. Amplified cDNA was purified using 1.8x Ampure XP and quantified with Bioanalyzer 2100 HS DNA. A total of 500 pg to 1 ng of cDNA was prepared for sequencing with Nextera XT kit (Illumina, FC-131–1024), pooled in equimolar ratios, and sequenced on a NextSeq 500.
Stage correlation and differential analysis
For differentiation stage correlation with primary DIPG, peak calls were performed using MACS2 as described previously and separated into enhancers and promoters. All peaks called in hPSC and DIPG samples were first separated into enhancers and promoters as described and overlapping regions were merged. Enrichment was calculated and peaks were filtered using same parameters as DIPG data. Enrichment for hPSC differentiation and primary DIPG samples were median normalized separately. Correlation was then performed using log2(average normalized H3K27Ac enrichment) between control untreated subclones carrying either TRE-H3.1K27M or TRE-H3.3K27M and the corresponding primary DIPG samples. Correlation within day 44 samples was similarly performed with only samples from this timepoint.
Differential analysis for TRE-H3.3K27M NPCs and eOPCs was performed using DESeq2 with two subclones per condition, separating enhancers and promoters. For H3.3K27M NPC enrichment plots, regions with FDR-adjusted p value < 0.1 were used and log2(fold-change) was obtained from DESeq2. Differential promoter and enhancer lists were merged where stated.
eOPC CGI analysis
Genomics regions for CGIs were obtained from UCSC Genome Browser. Reads were counted in all CGIs using bedtools multicov and enrichment for H3.3 and EED ChIP-seq were computed as described above for H3K27Ac.
For H3K27me3 ChIP-Rx, reference-adjusted library size was calculated by multiplying the total number of unique human reads by Nd, as calculated above. Reference-adjusted counts at each CGI were calculated by multiplying the raw counts at each CGI by Nd. Enrichment was then calculated as described above using input library size and raw counts at each CGI and reference-adjusted library size and counts for H3K27me3. Mean log2(enrichment) was calculated for each control, H3.3K27me3 +dox, and H3.1K27me3 +dox sample. Log2(dox/control enrichment) was calculated as mean log2(dox) – mean log2(control) and used for correlation.
H3K27me3+ CGIs were defined as those showing a log2(H3K27me3 enrichment) > 1 in all control samples. For enrichment plots, H3K27me3+ CGIs were subsetted to the top 1,000 (high H3.3 PRC2 targets, log2(H3.3) > 1.83) and bottom 1,000 (low H3.3 PRC2 targets; log2(H3.3) < 0.18) by mean control H3.3 enrichment. Replicates for H3.3 and EED ChIP libraries were each pooled using HOMER makeTagDirectory.pl and reads were counted using annotatePeaks.pl in 5 bp bins for 5 kb up and downstream of center for each CGI, normalizing to 1 million reads per ChIP. For H3K27me3 ChIP-Rx, reads were counted for each individual library without depth normalization, multiplied by Nd, and then averaged across each condition. Plots were made using R. Genomic feature distribution was identified using HOMER annotatePeaks.pl.
hPSC RNA-seq analysis
Reads were processed and transcripts were quantified as described above for primary DIPG sample RNA-seq. TRE-H3.3K27M samples were treated with doxycycline for 6 days (Day 14) were compared to their corresponding untreated controls. TPM values were median normalized across genes with ln(TPM+1) > 1. For comparison to Funato et al 2014 microarray data, CEL files were downloaded from GEO (GSE55541) and processed using R package affy with ReadAffy() and rma(). Probe expression was converted to gene expression using package hgu133plus2.db to convert to gene symbols and limma avereps() to find average expression per gene.
For each eOPC subclone, fold change at each gene was defined as (subclone TPM)/(average control TPM). Correlation was measured across genes with mean ln(TPM+1) across all samples of at least 1.
Active chromatin signature analysis
For definition of eOPC H3.3K27M and H3.1K27M-activated regions, the set of all H3K27Ac peaks across all day 44 and day 55 samples were separated into enhancers and promoters before merging overlapping regions as described. For NPC H3.3K27M and H3.1K27M-activated regions, the set of all peaks across all day 14 samples was used. Enrichment and filtering was performed as previously described and median enrichment was normalized across all samples. H3.3K27M and H3.1K27M-activated regions were defined as those enhancers and promoters with average log2(subclone enrichment) – log2(average control enrichment) > 1. All such regions were then separated into shared activated regions (present in both H3.3K27M-activated and H3.1K27M-activated), H3.3K27M only activated regions, H3.1K27M only activated regions. Shared deactivated regions were those with average log2(mean control enrichment) – log2(subclone enrichment) < −1 in each of H3.3K27M and H3.1K27M. Heatmaps of these regions for day 55 were made using pheatmap without clustering, ordered by average log2(average subclone enrichment) – log2(average control enrichment). For H3.3 enrichment at these regions, replicates for day 44 H3.3 ChIP in control eOPCs were pooled using HOMER makeTagDirectory.pl and reads were counted using annotatePeaks.pl in 5 bp bins for 5 kb up and downstream of center for each regions, normalizing to 1 million reads per ChIP.
The H3.3K27M only and H3.1K27M only activated regions at each time point were used for signature analysis. A signal matched control set was created for each. First, reads were counted for each primary DIPG sample in each region, enrichment was calculated as described, and median normalization was performed using scaling factors derived across all H3K27Ac peaks called in primary samples as described above. Mean enrichment was calculated across all primary samples for all active enhancers and promoters (~46,000 eOPC; ~31,000 NPC) and these regions were divided into 25 equal sized bins by average enrichment. For each region in the H3.3K27M activated and H3.1K27M activated sets at each time point, 10 regions were selected from the same bin and added to each control set before removing duplicate regions. Hence, the final control set for each H3.3K27M only and H3.1K27M only set at each time point was an enrichment-matched set approximately ten times the size of each activated region set. Each primary sample was then scored on its H3.3K27M only and H3.1K27M only activated signature as mean log2(activated set normalized enrichment) – mean log2(control set normalized enrichment). Samples were then plotted by (H3.3K27M score) – (H3.1K27M score) at the NPC and eOPC stages separately.
Contact domain analysis
Contact domain data was downloaded from Rao et al 2014 for HMEC cells. For H3.3K27M only and H3.1K27M only activated peaks, each was analyzed with its corresponding control set (as described above) and either day 44 H3.3K27M or H3.1K27M H3K27me3 loss, respectively. H3K27Ac peaks on chrY were removed to account for sex difference between HMEC and 2242 hPSCs. Each CGI and H3K27Ac peak were assigned to one contact domain using bedtools closest -d -t. For each H3K27Ac peak in the activated and control sets, the number of CGIs with high day 44 H3K27me3 loss associated with the same contact domain were counted. The thresholds used for high loss were selected to create ~2500 CGIs for each oncohistone: log2(average doxycycline enrichment) – log2(average control enrichment) < −1 for H3.3K27M (2353 CGIs) and < −0.5 for H3.1K27M (2819 CGIs). Boxplots for the number of CGIs with high H3K27me3 loss were generated using R boxplot() and Mann-Whitney tests were performed using wilcox.test().
Immunofluorescence
Primary DIPG tissue samples were fixed in 4% PFA/HBSS and dehydrated in 30% sucrose/HBSS. Cryopreserved tissue was then embedded in 2:1 30% sucrose:OCT and stored at −80°C until sectioned on a cryostat at 16 −20 μm thickness. For murine orthotopic xenografts, mice were perfused with 4% PFA/HBSS and brains were removed into 4% PFA/HBSS for overnight fixation. Brains were then cryoprotected in 30% sucrose/HBSS, embedded in OCT, and stored at −20°C until sectioning on cryostat at 20 μm. For hPSC differentiations, cells were fixed for 15 min at RT in 4% PFA/HBSS and washed 3x with TBS before storing at 4°C.
Blocking and permeabilization was performed with 3% normal donkey serum in 0.5% Triton X-100 / TBS for 1 hour at RT. Primary antibodies were diluted in 1% NDS in 0.3% Tx-100/TBS overnight as follows: H3K27M (Abcam ab190631, 1:1000), NES (Abcam ab6320, 1:500), GFP (Abcam ab13970, 1:500), OLIG2 (Millipore AB9610, 1:500), SOX10 (R&D AF2864, 1:100), CSPG4 (Millipore AB5320, 1:200), H3K27me3 (Active Motif 39155, 1:500). After washing out primary antibody with TBS, samples were incubated with secondary antibodies in 1% NDS in 0.3% Tx-100/TBS for 1–4 hours at RT: donkey anti-mouse 594 (Jackson 711–545-152, 1:500), donkey anti-rabbit 647 (Jackson 711–605-152, 1:500), donkey anti-rabbit 488 (Jackson 715–585-150, 1:500), donkey anti-rabbit 594 (Thermo A-21207, 1:500). Samples were washed twice with TBS, counter-staining with DAPI, and mounted in Prolong Gold. Imaging was performed on a Zeiss LSM800 or LSM700 at 40x or 63x magnification.
EdU proliferation assays
EdU was added to culture media at 10 μM final concentration for 24 h. Following cell fixation, EdU was labeled using Click-iT EdU Alexa Fluor 647 Imaging Kit (Thermo Fisher C10340). Cells were imaged on a Zeiss LSM700 at 20X and images were analyzed using CellProfiler. Data shown represents six subclones.
RT-qPCR
RNA was extracted from Trizol-lysed aggregates and equal amounts of total RNA were used to make cDNA with Maxima First Strand cDNA Synthesis Kit (Thermo K1671), including dsDNase treatment. qPCR was performed using Maxima SYBR Green/ROX qPCR Master Mix (Thermo K0222) and the following primers:
SOX2:
Forward – GCCGAGTGGAAACTTTTGTCG
Reverse – GGCAGCGTGTACTTATCCTTCT
NES:
Forward – AGTGATGCCCCTTCACCTTG
Reverse – GCTCGCTCTCTACTTTCCCC
OLIG2:
Forward – CCAGAGCCCGATGACCTTTTT
Reverse – CACTGCCTCCTAGCTTGTCC
SOX10:
Forward – CCTCACAGATCGCCTACACC
Reverse – CATATAGGAGAAGGCCGAGTAGA
CSPG4:
Forward – CCTGTCCTCACCAATGTCCTCCT
Reverse – GCTGGCACTGTTGAGACTCTTGAC
PDGFRA:
Forward – ATGAAGCAGGCTGATACTACAC
Reverse – TGAGGCTGGACGATCATAGA
ACTB:
Forward – CATCGAGCACGGCATCGTCA
Reverse – TAGCACAGCCTGGATAGCAAC
dCt was calculated to ACTB for each sample then ddCt to dCt(Day 08). Fold change was calculated as 2^-ddCt.
QUANTIFICATION AND STATISTICAL ANALYSIS
ChIP-seq, RNA-seq, and Omni-ATAC analyses were performed in R (Figures 1, 2, 5, 6, 7, S1, S2, S3, S4, S5, S6, and S7). For GREAT pathway annotations, binomial FDR adjusted p values were shown. Differential peaks were called using DESeq2 with default parameters. For association tests (Figure S1), Fisher’s exact test was performed using Benjamini-Hochberg multiple hypothesis adjustment (FDR = 0.1). Correlation values shown are Pearson’s r values, calculated in R.
Manual image quantification (Figures 3, S2) was performed blinded. Significance was determined using Graphpad Prism by two-sided Student’s t-test with Benjamini-Hochberg multiple hypothesis adjustment (FDR = 0.1), unless indicated otherwise in figure legend. Specific p value thresholds can be found in figure legends. Sample sizes are indicated in figure legends, indicating primary samples from different patients, independent biological replicates or distinct hPSC subclonal cell lines. For bar graphs, pooled data is shown as mean +/− s.d., generated in Graphpad Prism. For boxplots, pooled data is shown as median with IQR, generated in R.
DATA AND CODE AVAILABILITY
All sequencing data is available on Gene Expression Omnibus (GEO) at GSE126319.
Supplementary Material
KEY RESOURCES TABLE
| REAGENT or RESOURCE | SOURCE | IDENTIFIER |
|---|---|---|
| Antibodies | ||
| Rabbit polyclonal anti-H3K27Ac | Active Motif | Cat# 39133, RRID:AB_2561016 |
| Rabbit polyclonal anti-H3.3 | Millipore | Cat# 09-838, RRID:AB_10845793 |
| Rabbit polyclonal ant-H3K27M (ChIP-seq, dot blot) | Millipore | Cat# ABE419, RRID:AB_2728728 |
| Rabbit monoclonal anti-PPIB | Abcam | Cat# ab178397 |
| Rabbit polyclonal anti-p38 MAPK | CST | Cat# 9212S |
| Rabbit polyclonal anti-phospho-p38 MAPK | CST | Cat# 9211S |
| Rabbit polyclonal anti-H3 | Abcam | Cat# ab1791 |
| Rabbit polyclonal anti-H3K27me3 | Active Motif | Cat# 39155, RRID:AB_2561020 |
| Mouse monoclonal anti-EED | Active Motif | Cat# 61203, RRID:AB_2615071 |
| Rabbit monoclonal anti-H3K27M (Immunofluorescence) | Abcam | Cat# ab190631 |
| Mouse monoclonal anti-nestin | Abcam | Cat# ab6320, RRID:AB_308832 |
| Chicken polyclonal anti-GFP | Abcam | Cat# ab13970, RRID:AB_300798 |
| Rabbit polyclonal anti-Olig2 | Millipore | Cat# AB9610, RRID:AB_570666 |
| Goat polyclonal anti-Sox10 | R&D | Cat# AF2864 |
| Rabbit polyclonal anti-Cspg4 | Millipore | Cat# AB5320, RRID:AB_11213678 |
| Bacterial and Virus Strains | ||
| Biological Samples | ||
| Chemicals, Peptides, and Recombinant Proteins | ||
| SB202190 | SelleckChem | Cat# S1077 |
| Human WNT3A | R&D Systems | Cat# 5036-WN-010 |
| Human WNT5A | R&D Systems | Cat# 645-WN-010 |
| SiR-actin | Cytoskeleton | Cat# cy-SC001 |
| MitoTracker Red CMXRos | Thermo | Cat# M7512 |
| Lucifer Yellow CH lithium salt | Thermo | Cat# L453 |
| SB431542 | Stemgent | Cat# 04-0010 |
| LDN193189 | Stemgent | Cat# 04-0074 |
| Retinoic acid | Sigma | Cat# R2625 |
| Smoothened agonist | Millipore | Cat# 566660 |
| Human PDGF-AA | R&D | Cat# 221-AA-050 |
| Human IGF-1 | R&D | Cat# 291-G1-200 |
| Human HGF | R&D | Cat# 294-HG-025 |
| Human NT-3 | Millipore | Cat# GF031 |
| Human T3 | Sigma-Aldrich | Cat# T2877 |
| Biotin | Sigma-Aldrich | Cat# 4639 |
| cAMP | Sigma-Aldrich | Cat# D0260 |
| Drosophila Spike-In Chromatin | Active Motif | Cat# 53083 |
| Critical Commercial Assays | ||
| SureSelectXT Human All Exon v6 | Agilent | Cat# 5190-8863 |
| Nextera Rapid Capture Exome | Illumina | Cat# 20020616 |
| NEBNext Multiplex Oligos for Illumina (Index Primers 1-12) | NEB | Cat# E7335S |
| NEBNext Multiplex Oligos for Illumina (Index Primer Set 2) | NEB | Cat# E7500Ss |
| Nextera DNA Library Prep Kit | Illumina | Cat# FC-121-1030 |
| CellTiter-Glo | Promega | Cat# G9243 |
| RhoA G-LISA Activation Assay Kit | Cytoskeleton | Cat# BK124 |
| NEBNext Ultra II DNA Library Prep Kit | NEB | Cat# E7645S |
| Deposited Data | ||
| Raw and processed data | This paper | GEO GSE126319 |
| Primary DIPG single cell RNA-seq | Filbin et al. 2018 | GEO GSE102130 |
| Primary DIPG whole tissue RNA-seq | Grasso et al. 2015 | dbGaP phs000900.v1.p1 |
| H3K27M NPC Microarray | Funato et al. 2014 | GEO GSE55541 |
| HMEC contact domain list | Rao et al. 2014 | GEO GSE63525 |
| Human hg19 reference genome NCBI build 37, GRCh37 | UCSC Genome Browser | http://hgdownload.soe.ucsc.edu/downloads.html |
| Human CpG island annotations | UCSC Genome Browser | http://hgdownload.soe.ucsc.edu/downloads.html |
| Drosophila dm6 reference genome | UCSC Genome Browser | http://hgdownload.soe.ucsc.edu/downloads.html |
| RefSeq gene annotations | UCSC Genome Browser | https://genome.ucsc.edu |
| Experimental Models: Cell Lines | ||
| Human: 2242-1 iSPC cells | Laboratory of Sergiu Pasca | N/A |
| Human: Patient-derived DIPG cultures | Laboratory of Michelle Monje | Grasso et al., 2015; Nagaraja et al., 2017; Qin et al., 2017; this paper |
| Experimental Models: Organisms/Strains | ||
| Oligonucleotides | ||
| Recombinant DNA | ||
| 7TG (7xTCF/LEF GFP) | Brugmann et al., 2007 | RRID:Addgene_24314 |
| Human HIST1H3B Gene ORF cDNA clone expression plasmid, C-HA tag (pCMV3) | Sino Biological | Cat# HG15814-CY |
| Super piggyBac Transposase expression vector | Laboratory of Joanna Wysocka | N/A |
| PiggyBac Transposase | Laboratory of Joanna Wysocka | N/A |
| Software and Algorithms | ||
| bowtie2 | Langmead et al., 2012 | http://bowtie-bio.sourceforge.net/bowtie2/index.shtml |
| samtools | Li et al., 2009 | http://samtools.sourceforge.net/ |
| picardtools | Broad Institute, GitHub Repository | https://broadinstitute.github.io/picard/ |
| bedtools | Quinlan et al., 2010 | https://bedtools.readthedocs.io/en/latest/ |
| bedGraphToBigWig | Kent et al., 2010 | https://www.encodeproject.org/software/bedgraphtobigwig/ |
| macs2 | Zhang et al., 2008 | https://github.com/taoliu/MACS |
| tophat2 | Kim et al., 2013 | https://ccb.jhu.edu/software/tophat/index.shtml |
| Rsubread | Liao et al., 2014 | https://bioconductor.org/packages/release/bioc/html/Rsubread.html |
| HOMER | Heinz et al., 2010 | http://homer.ucsd.edu/homer/ |
| Rank Ordering of Super-Enhancers (ROSE) | Whyte et al., 2013; Loven et al., 2013 | http://younglab.wi.mit.edu/super_enhancer_code.html |
| Cytoscape Enrichment Map | Merico et al., 2010 | https://www.baderlab.org/Software/EnrichmentMap |
| BWA | Li et al., 2009 | http://bio-bwa.sourceforge.net/ |
| GATK | McKenna et al., 2010 | https://software.broadinstitute.org/gatk/ |
| FATHMM-MKL | Shihab et al., 2015 | http://fathmm.biocompute.org.uk/fathmmMKL.htm |
| VarScan 2 | Koboldt et al., 2012 | http://dkoboldt.github.io/varscan/ |
| ExomeDepth | Plagnol et al., 2012 | https://cran.r-project.org/web/packages/ExomeDepth/index.html |
| ChromVAR | Schep et al., 2017 | https://github.com/GreenleafLab/chromVAR |
| DESeq2 | Love et al., 2014 | https://bioconductor.org/packages/release/bioc/html/DESeq2.html |
| CellProfiler | McQuin et al., 2018 | https://cellprofiler.org/ |
| Other | ||
Highlights:
H3.3K27M and H3.1K27M DIPG tumors exhibit distinct active enhancer profiles
Extensive chromatin studies in primary H3K27M samples reveal oncogenic signaling
Disparate genomic locations of each H3K27M variant disrupts different PRC2 targets
H3K27M remodeling differs between NPCs and OPCs
Acknowledgments
We thank A.C. Carter, C.W. Mount, J. Wysocka, and H.Y. Chang for their helpful comments in preparing the manuscript. We thank S.P. Pasca for sharing the 2242–1 hPSC cell line. We are grateful for funding from Alex’s Lemonade Stand Foundation, McKenna Claire Foundation, Unravel Pediatric Cancer, Defeat DIPG Foundation, ChadTough Foundation, N8 Foundation, Cure Starts Now Foundation and the DIPG collaborative, Sam Jeffers Foundation, Abbie’s Army Foundation, Maiy’s Miracle Foundation, Virginia and D.K. Ludwig Fund for Cancer Research, National Institutes of Health ( R01NS092597 and DP1NS111132), the Anne T. and Robert M. Bass Endowed Faculty Scholarship in Pediatric Cancer and Blood Diseases, the Musella Foundation, Piedmont Community, Kisses for Kayla, LilaBean Foundation, and the Pediatric Brain Tumor Atlas-CBTTC.
Footnotes
Publisher's Disclaimer: This is a PDF file of an unedited manuscript that has been accepted for publication. As a service to our customers we are providing this early version of the manuscript. The manuscript will undergo copyediting, typesetting, and review of the resulting proof before it is published in its final citable form. Please note that during the production process errors may be discovered which could affect the content, and all legal disclaimers that apply to the journal pertain.
Declaration of Interests
The authors have no conflicts of interest to declare.
References
- Aihara K et al. (2014) ‘H3F3A K27M mutations in thalamic gliomas from young adult patients’, Neuro-Oncology. Oxford University Press, 16(1), pp. 140–146. doi: 10.1093/neuonc/not144. [DOI] [PMC free article] [PubMed] [Google Scholar]
- Banaszynski LA et al. (2013) ‘Hira-Dependent Histone H3.3 Deposition Facilitates PRC2 Recruitment at Developmental Loci in ES Cells’, Cell, 155(1), pp. 107–120. doi: 10.1016/j.cell.2013.08.061. [DOI] [PMC free article] [PubMed] [Google Scholar]
- Bender S et al. (2013) ‘Reduced H3K27me3 and DNA hypomethylation are major drivers of gene expression in K27M mutant pediatric high-grade gliomas.’, Cancer cell, 24(5), pp. 660–72. doi: 10.1016/j.ccr.2013.10.006. [DOI] [PubMed] [Google Scholar]
- Brugmann SA et al. (2007) ‘Wnt signaling mediates regional specification in the vertebrate face’, Development, 134(18), pp. 3283–3295. doi: 10.1242/dev.005132. [DOI] [PubMed] [Google Scholar]
- Buczkowicz P et al. (2014) ‘Genomic analysis of diffuse intrinsic pontine gliomas identifies three molecular subgroups and recurrent activating ACVR1 mutations’, Nature GeNetics VOLUME, 46(5). doi: 10.1038/ng.2936. [DOI] [PMC free article] [PubMed] [Google Scholar]
- Castel D et al. (2015) ‘Histone H3F3A and HIST1H3B K27M mutations define two subgroups of diffuse intrinsic pontine gliomas with different prognosis and phenotypes’, Acta Neuropathologica. Springer Berlin Heidelberg, 130(6), pp. 815–827. doi: 10.1007/s00401-015-1478-0. [DOI] [PMC free article] [PubMed] [Google Scholar]
- Castel D et al. (2018) ‘Transcriptomic and epigenetic profiling of “diffuse midline gliomas, H3 K27M-mutant” discriminate two subgroups based on the type of histone H3 mutated and not supratentorial or infratentorial location’, Acta Neuropathologica Communications, 6(1), p. 117. doi: 10.1186/s40478-018-0614-1. [DOI] [PMC free article] [PubMed] [Google Scholar]
- Chan K-M et al. (2013) ‘The histone H3.3K27M mutation in pediatric glioma reprograms H3K27 methylation and gene expression.’, Genes & development, 27(9), pp. 985–90. doi: 10.1101/gad.217778.113. [DOI] [PMC free article] [PubMed] [Google Scholar]
- Corces MR et al. (2017) ‘An improved ATAC-seq protocol reduces background and enables interrogation of frozen tissues.’, Nature methods, 14(10), pp. 959–962. doi: 10.1038/nmeth.4396. [DOI] [PMC free article] [PubMed] [Google Scholar]
- Deaton AM and Bird A (2011) ‘CpG islands and the regulation of transcription.’, Genes & development. Cold Spring Harbor Laboratory Press, 25(10), pp. 1010–22. doi: 10.1101/gad.2037511. [DOI] [PMC free article] [PubMed] [Google Scholar]
- Filbin MG et al. (2018) ‘Developmental and oncogenic programs in H3K27M gliomas dissected by single-cell RNA-seq’, Science, 360(6386), pp. 331–335. doi: 10.1126/science.aao4750. [DOI] [PMC free article] [PubMed] [Google Scholar]
- Fontebasso AM et al. (2014) ‘Recurrent somatic mutations in ACVR1 in pediatric midline high-grade astrocytoma’. doi: 10.1038/ng.2950. [DOI] [PMC free article] [PubMed] [Google Scholar]
- Funato K et al. (2014) ‘Use of human embryonic stem cells to model pediatric gliomas with H3.3K27M histone mutation.’, Science (New York, N.Y.), 346(6216), pp. 1529–33. doi: 10.1126/science.1253799. [DOI] [PMC free article] [PubMed] [Google Scholar]
- Gessi M et al. (2015) ‘High frequency of H3F3A K27M mutations characterizes pediatric and adult high-grade gliomas of the spinal cord’, Acta Neuropathologica. Springer Berlin Heidelberg, 130(3), pp. 435–437. doi: 10.1007/s00401-015-1463-7. [DOI] [PubMed] [Google Scholar]
- Grasso CS et al. (2015) ‘Functionally defined therapeutic targets in diffuse intrinsic pontine glioma.’, Nature medicine, 21(6), pp. 555–9. doi: 10.1038/nm.3855. [DOI] [PMC free article] [PubMed] [Google Scholar]
- Harutyunyan AS et al. (2019) ‘H3K27M induces defective chromatin spread of PRC2-mediated repressive H3K27me2/me3 and is essential for glioma tumorigenesis’, Nature Communications. Nature Publishing Group, 10(1), p. 1262. doi: 10.1038/s41467-019-09140-x. [DOI] [PMC free article] [PubMed] [Google Scholar]
- Heinz S et al. (2010) ‘Simple Combinations of Lineage-Determining Transcription Factors Prime cis-Regulatory Elements Required for Macrophage and B Cell Identities’, Molecular Cell, 38(4), pp. 576–589. doi: 10.1016/j.molcel.2010.05.004. [DOI] [PMC free article] [PubMed] [Google Scholar]
- Hnisz D et al. (2013) ‘Super-Enhancers in the Control of Cell Identity and Disease’, Cell, 155(4), pp. 934–947. doi: 10.1016/j.cell.2013.09.053. [DOI] [PMC free article] [PubMed] [Google Scholar]
- Hoeman CM et al. (2019) ‘ACVR1 R206H cooperates with H3.1K27M in promoting diffuse intrinsic pontine glioma pathogenesis’, Nature Communications. Nature Publishing Group, 10(1), p. 1023. doi: 10.1038/s41467-019-08823-9. [DOI] [PMC free article] [PubMed] [Google Scholar]
- Humphries AC and Mlodzik M (2018) ‘From instruction to output: Wnt/PCP signaling in development and cancer’, Current Opinion in Cell Biology, 51, pp. 110–116. doi: 10.1016/j.ceb.2017.12.005. [DOI] [PMC free article] [PubMed] [Google Scholar]
- Jung E et al. (2017) ‘Tweety-Homolog 1 Drives Brain Colonization of Gliomas’, The Journal of Neuroscience, 37(29), pp. 6837–6850. doi: 10.1523/JNEUROSCI.3532-16.2017. [DOI] [PMC free article] [PubMed] [Google Scholar]
- Kent WJ et al. (2010) ‘BigWig and BigBed: enabling browsing of large distributed datasets’, Bioinformatics. Narnia, 26(17), pp. 2204–2207. doi: 10.1093/bioinformatics/btq351. [DOI] [PMC free article] [PubMed] [Google Scholar]
- Khuong-Quang D-A et al. (2012) ‘K27M mutation in histone H3.3 defines clinically and biologically distinct subgroups of pediatric diffuse intrinsic pontine gliomas.’, Acta neuropathologica, 124(3), pp. 439–47. doi: 10.1007/s00401-012-0998-0. [DOI] [PMC free article] [PubMed] [Google Scholar]
- Kim D et al. (2013) ‘TopHat2: accurate alignment of transcriptomes in the presence of insertions, deletions and gene fusions.’, Genome biology, 14(4), p. R36. doi: 10.1186/gb-2013-14-4-r36. [DOI] [PMC free article] [PubMed] [Google Scholar]
- Koboldt DC et al. (2012) ‘VarScan 2: somatic mutation and copy number alteration discovery in cancer by exome sequencing.’, Genome research. Cold Spring Harbor Laboratory Press, 22(3), pp. 568–76. doi: 10.1101/gr.129684.111. [DOI] [PMC free article] [PubMed] [Google Scholar]
- Krug B et al. (2019) ‘Pervasive H3K27 Acetylation Leads to ERV Expression and a Therapeutic Vulnerability in H3K27M Gliomas’, Cancer Cell. Cell Press, 35(5), pp. 782–797.e8. doi: 10.1016/J.CCELL.2019.04.004. [DOI] [PMC free article] [PubMed] [Google Scholar]
- Langmead B and Salzberg SL (2012) ‘Fast gapped-read alignment with Bowtie 2’, Nature Methods. Nature Research, 9(4), pp. 357–359. doi: 10.1038/nmeth.1923. [DOI] [PMC free article] [PubMed] [Google Scholar]
- Larson JD et al. (2018) ‘Histone H3.3 K27M Accelerates Spontaneous Brainstem Glioma and Drives Restricted Changes in Bivalent Gene Expression’, Cancer Cell. doi: 10.1016/j.ccell.2018.11.015. [DOI] [PMC free article] [PubMed] [Google Scholar]
- Lewis PW et al. (2013) ‘Inhibition of PRC2 activity by a gain-of-function H3 mutation found in pediatric glioblastoma.’, Science (New York, N.Y.), 340(6134), pp. 857–61. doi: 10.1126/science.1232245. [DOI] [PMC free article] [PubMed] [Google Scholar]
- Li H et al. (2009) ‘The Sequence Alignment/Map format and SAMtools’, Bioinformatics, 25(16), pp. 2078–2079. doi: 10.1093/bioinformatics/btp352. [DOI] [PMC free article] [PubMed] [Google Scholar]
- Li H and Durbin R (2009) ‘Fast and accurate short read alignment with Burrows-Wheeler transform’, Bioinformatics, 25(14), pp. 1754–1760. doi: 10.1093/bioinformatics/btp324. [DOI] [PMC free article] [PubMed] [Google Scholar]
- Li Y et al. (2017) ‘Paired related homeobox 1 transactivates dopamine D2 receptor to maintain propagation and tumorigenicity of glioma-initiating cells’, Journal of Molecular Cell Biology. Narnia, 9(4), pp. 302–314. doi: 10.1093/jmcb/mjx017. [DOI] [PMC free article] [PubMed] [Google Scholar]
- Liao Y, Smyth GK and Shi W (2014) ‘featureCounts: an efficient general purpose program for assigning sequence reads to genomic features.’, Bioinformatics (Oxford, England), 30(7), pp. 923–30. doi: 10.1093/bioinformatics/btt656. [DOI] [PubMed] [Google Scholar]
- Lin GL et al. (2018) ‘Non-inflammatory tumor microenvironment of diffuse intrinsic pontine glioma’, Acta Neuropathologica Communications, 6(1), p. 51. doi: 10.1186/s40478-018-0553-x. [DOI] [PMC free article] [PubMed] [Google Scholar]
- Liu C et al. (2011) ‘Mosaic Analysis with Double Markers Reveals Tumor Cell of Origin in Glioma’, Cell, 146(2), pp. 209–221. doi: 10.1016/j.cell.2011.06.014. [DOI] [PMC free article] [PubMed] [Google Scholar]
- Lovén J et al. (2013) ‘Selective Inhibition of Tumor Oncogenes by Disruption of Super-Enhancers’, Cell, 153(2), pp. 320–334. doi: 10.1016/j.cell.2013.03.036. [DOI] [PMC free article] [PubMed] [Google Scholar]
- Mackay A et al. (2017) ‘Integrated Molecular Meta-Analysis of 1,000 Pediatric High-Grade and Diffuse Intrinsic Pontine Glioma’, Cancer Cell, 32(4), pp. 520–537.e5. doi: 10.1016/j.ccell.2017.08.017. [DOI] [PMC free article] [PubMed] [Google Scholar]
- McKenna A et al. (2010) ‘The Genome Analysis Toolkit: a MapReduce framework for analyzing next-generation DNA sequencing data.’, Genome research, 20(9), pp. 1297–303. doi: 10.1101/gr.107524.110. [DOI] [PMC free article] [PubMed] [Google Scholar]
- McLean CY et al. (2010) ‘GREAT improves functional interpretation of cis-regulatory regions’, Nature Biotechnology, 28(5). doi: 10.1038/nbt.1630. [DOI] [PMC free article] [PubMed] [Google Scholar]
- McQuin C et al. (2018) ‘CellProfiler 3.0: Next-generation image processing for biology.’, PLoS biology. Edited by Misteli T, 16(7), p. e2005970. doi: 10.1371/journal.pbio.2005970. [DOI] [PMC free article] [PubMed] [Google Scholar]
- Merico D et al. (2010) ‘Enrichment Map: A Network-Based Method for Gene-Set Enrichment Visualization and Interpretation’, PLoS ONE. Edited by Ravasi T. Public Library of Science, 5(11), p. e13984. doi: 10.1371/journal.pone.0013984. [DOI] [PMC free article] [PubMed] [Google Scholar]
- Mohammad F et al. (2017) ‘EZH2 is a potential therapeutic target for H3K27M-mutant pediatric gliomas.’, Nature medicine, 23(4), pp. 483–492. doi: 10.1038/nm.4293. [DOI] [PubMed] [Google Scholar]
- Monje M et al. (2011) ‘Hedgehog-responsive candidate cell of origin for diffuse intrinsic pontine glioma’, Proceedings of the National Academy of Sciences. National Academy of Sciences, 108(11), pp. 4453–4458. doi: 10.1073/pnas.1101657108. [DOI] [PMC free article] [PubMed] [Google Scholar]
- Mount CW et al. (2018) ‘Potent antitumor efficacy of anti-GD2 CAR T cells in H3-K27M+ diffuse midline gliomas’, Nature Medicine. Nature Publishing Group, 24(5), pp. 572–579. doi: 10.1038/s41591-018-0006-x. [DOI] [PMC free article] [PubMed] [Google Scholar]
- Nagaraja S et al. (2017) ‘Transcriptional Dependencies in Diffuse Intrinsic Pontine Glioma’, Cancer Cell, 31(5), pp. 635–652.e6. doi: 10.1016/j.ccell.2017.03.011. [DOI] [PMC free article] [PubMed] [Google Scholar]
- Nikbakht H et al. (2016) ‘Spatial and temporal homogeneity of driver mutations in diffuse intrinsic pontine glioma’, Nature Communications, 7, p. 11185. doi: 10.1038/ncomms11185. [DOI] [PMC free article] [PubMed] [Google Scholar]
- Orlando DA et al. (2014) ‘Quantitative ChIP-Seq Normalization Reveals Global Modulation of the Epigenome’, Cell Reports. Cell Press, 9(3), pp. 1163–1170. doi: 10.1016/J.CELREP.2014.10.018. [DOI] [PubMed] [Google Scholar]
- Osswald M et al. (2015) ‘Brain tumour cells interconnect to a functional and resistant network’, Nature, 528(7580), pp. 93–8. doi: 10.1038/nature16071. [DOI] [PubMed] [Google Scholar]
- Pathania M et al. (2017) ‘H3.3K27M Cooperates with Trp53 Loss and PDGFRA Gain in Mouse Embryonic Neural Progenitor Cells to Induce Invasive High-Grade Gliomas’, Cancer Cell, 32(5), pp. 684–700.e9. doi: 10.1016/j.ccell.2017.09.014. [DOI] [PMC free article] [PubMed] [Google Scholar]
- Picelli S et al. (2014) ‘Full-length RNA-seq from single cells using Smart-seq2’, Nature Protocols. Nature Publishing Group, 9(1), pp. 171–181. doi: 10.1038/nprot.2014.006. [DOI] [PubMed] [Google Scholar]
- Piunti A et al. (2017) ‘Therapeutic targeting of polycomb and BET bromodomain proteins in diffuse intrinsic pontine gliomas’, Nature Medicine. Nature Publishing Group, (November 2016), pp. 1–11. doi: 10.1038/nm.4296. [DOI] [PMC free article] [PubMed] [Google Scholar]
- Plagnol V et al. (2012) ‘A robust model for read count data in exome sequencing experiments and implications for copy number variant calling’, Bioinformatics, 28(21), pp. 2747–2754. doi: 10.1093/bioinformatics/bts526. [DOI] [PMC free article] [PubMed] [Google Scholar]
- Qi X et al. (2015) ‘p38γ MAPK Is a Therapeutic Target for Triple-Negative Breast Cancer by Stimulation of Cancer Stem-Like Cell Expansion’, STEM CELLS, 33(9), pp. 2738–2747. doi: 10.1002/stem.2068. [DOI] [PMC free article] [PubMed] [Google Scholar]
- Qin EY et al. (2017) ‘Neural Precursor-Derived Pleiotrophin Mediates Subventricular Zone Invasion by Glioma’, Cell, 170(5), pp. 845–859.e19. doi: 10.1016/j.cell.2017.07.016. [DOI] [PMC free article] [PubMed] [Google Scholar]
- Quinlan AR and Hall IM (2010) ‘BEDTools: a flexible suite of utilities for comparing genomic features.’, Bioinformatics (Oxford, England). Oxford University Press, 26(6), pp. 841–2. doi: 10.1093/bioinformatics/btq033. [DOI] [PMC free article] [PubMed] [Google Scholar]
- Rao SSP et al. (2014) ‘A 3D Map of the Human Genome at Kilobase Resolution Reveals Principles of Chromatin Looping’, Cell. Elsevier Inc., 159(7), pp. 1665–1680. doi: 10.1016/j.cell.2014.11.021. [DOI] [PMC free article] [PubMed] [Google Scholar]
- Reimand J et al. (2016) ‘g:Profiler—a web server for functional interpretation of gene lists (2016 update)’, Nucleic Acids Research, 44(W1), pp. W83–W89. doi: 10.1093/nar/gkw199. [DOI] [PMC free article] [PubMed] [Google Scholar]
- Rheinbay E et al. (2013) ‘An aberrant transcription factor network essential for Wnt signaling and stem cell maintenance in glioblastoma.’, Cell reports, 3(5), pp. 1567–79. doi: 10.1016/j.celrep.2013.04.021. [DOI] [PMC free article] [PubMed] [Google Scholar]
- Riising EM et al. (2014) ‘Gene Silencing Triggers Polycomb Repressive Complex 2 Recruitment to CpG Islands Genome Wide’, Molecular Cell. Cell Press, 55(3), pp. 347–360. doi: 10.1016/J.MOLCEL.2014.06.005. [DOI] [PubMed] [Google Scholar]
- Rojo de la Vega M, Chapman E and Zhang DD (2018) ‘NRF2 and the Hallmarks of Cancer’, Cancer Cell, 34(1), pp. 21–43. doi: 10.1016/j.ccell.2018.03.022. [DOI] [PMC free article] [PubMed] [Google Scholar]
- Roy Shomereeta et al. (2018) ‘Role of p38 MAPK in disease relapse and therapeutic resistance by maintenance of cancer stem cells in head and neck squamous cell carcinoma’, Journal of Oral Pathology & Medicine, 47(5), pp. 492–501. doi: 10.1111/jop.12707. [DOI] [PubMed] [Google Scholar]
- Schep AN et al. (2017) ‘chromVAR: inferring transcription-factor-associated accessibility from single-cell epigenomic data.’, Nature methods, 14(10), pp. 975–978. doi: 10.1038/nmeth.4401. [DOI] [PMC free article] [PubMed] [Google Scholar]
- Schwartzentruber J et al. (2012) ‘Driver mutations in histone H3.3 and chromatin remodelling genes in paediatric glioblastoma.’, Nature, 482(7384), pp. 226–31. doi: 10.1038/nature10833. [DOI] [PubMed] [Google Scholar]
- Sedykh I et al. (2018) ‘Zebrafish Rfx4 controls dorsal and ventral midline formation in the neural tube’, Developmental Dynamics, 247(4), pp. 650–659. doi: 10.1002/dvdy.24613. [DOI] [PMC free article] [PubMed] [Google Scholar]
- Shihab HA et al. (2015) ‘An integrative approach to predicting the functional effects of non-coding and coding sequence variation’, Bioinformatics. Narnia, 31(10), pp. 1536–1543. doi: 10.1093/bioinformatics/btv009. [DOI] [PMC free article] [PubMed] [Google Scholar]
- Sloan SA et al. (2017) ‘Human Astrocyte Maturation Captured in 3D Cerebral Cortical Spheroids Derived from Pluripotent Stem Cells’, Neuron, 95(4), pp. 779–790.e6. doi: 10.1016/j.neuron.2017.07.035. [DOI] [PMC free article] [PubMed] [Google Scholar]
- Stafford JM et al. (2018) ‘Multiple modes of PRC2 inhibition elicit global chromatin alterations in H3K27M pediatric glioma’, Science Advances. American Association for the Advancement of Science, 4(10), p. eaau5935. doi: 10.1126/sciadv.aau5935. [DOI] [PMC free article] [PubMed] [Google Scholar]
- Sturm D et al. (2012) ‘Hotspot IDH1 Define Distinct Epigenetic and Biological Subgroups of Glioblastoma’, pp. 425–437. doi: 10.1016/j.ccr.2012.08.024. [DOI] [PubMed] [Google Scholar]
- Szenker E, Ray-Gallet D and Almouzni G (2011) ‘The double face of the histone variant H3.3’, Cell Research. Nature Publishing Group, 21(3), pp. 421–434. doi: 10.1038/cr.2011.14. [DOI] [PMC free article] [PubMed] [Google Scholar]
- Tatavosian R et al. (2018) ‘Live-cell single-molecule dynamics of PcG proteins imposed by the DIPG H3.3K27M mutation’, Nature Communications. Nature Publishing Group, 9(1), p. 2080. doi: 10.1038/s41467-018-04455-7. [DOI] [PMC free article] [PubMed] [Google Scholar]
- Taylor KR et al. (2014) ‘Recurrent activating ACVR1 mutations in diffuse intrinsic pontine glioma.’, Nature genetics, 46(5), pp. 457–61. doi: 10.1038/ng.2925. [DOI] [PMC free article] [PubMed] [Google Scholar]
- Vinci M et al. (2018) ‘Functional diversity and cooperativity between subclonal populations of pediatric glioblastoma and diffuse intrinsic pontine glioma cells’, Nature Medicine. doi: 10.1038/s41591-018-0086-7. [DOI] [PMC free article] [PubMed] [Google Scholar]
- Weil S et al. (2017) ‘Tumor microtubes convey resistance to surgical lesions and chemotherapy in gliomas’, Neuro-Oncology, 19(10), pp. 1316–1326. doi: 10.1093/neuonc/nox070. [DOI] [PMC free article] [PubMed] [Google Scholar]
- Whyte W a et al. (2013) ‘Master transcription factors and mediator establish super-enhancers at key cell identity genes.’, Cell. Elsevier Inc., 153(2), pp. 307–19. doi: 10.1016/j.cell.2013.03.035. [DOI] [PMC free article] [PubMed] [Google Scholar]
- Wu G et al. (2012) ‘Somatic histone H3 alterations in pediatric diffuse intrinsic pontine gliomas and non-brainstem glioblastomas.’, Nature Genetics, 44(3), pp. 251–3. doi: 10.1038/ng.1102. [DOI] [PMC free article] [PubMed] [Google Scholar]
- Wu G et al. (2014) ‘The genomic landscape of diffuse intrinsic pontine glioma and pediatric non-brainstem high-grade glioma’, Nature Genetics. Nature Research, 46(5), pp. 444–450. doi: 10.1038/ng.2938. [DOI] [PMC free article] [PubMed] [Google Scholar]
- Yadavilli S et al. (2016) ‘The Role of NG2 Proteoglycan in Glioma’,Translational Oncology, 9(1), pp. 57–63. doi: 10.1016/j.tranon.2015.12.005. [DOI] [PMC free article] [PubMed] [Google Scholar]
- Yeung MSY et al. (2014) ‘Dynamics of Oligodendrocyte Generation and Myelination in the Human Brain’, Cell, 159, pp. 766–774. doi: 10.1016/j.cell.2014.10.011. [DOI] [PubMed] [Google Scholar]
- Zhang Y et al. (2008) ‘Model-based analysis of ChIP-Seq (MACS).’,Genome biology, 9(9), p. R137. doi: 10.1186/gb-2008-9-9-r137. [DOI] [PMC free article] [PubMed] [Google Scholar]
- Zhang Y et al. (2014) ‘An RNA-Sequencing Transcriptome and Splicing Database of Glia, Neurons, and Vascular Cells of the Cerebral Cortex.’, The Journal of neuroscience : the official journal of the Society for Neuroscience, 34(36), pp. 11929–47. doi: 10.1523/JNEUROSCI.1860-14.2014. [DOI] [PMC free article] [PubMed] [Google Scholar]
Associated Data
This section collects any data citations, data availability statements, or supplementary materials included in this article.
Supplementary Materials
Data Availability Statement
All sequencing data is available on Gene Expression Omnibus (GEO) at GSE126319.