Abstract
We consider self-assembly of proteins into a virus capsid by the methods of molecular dynamics. The capsid corresponds either to SPMV or CCMV and is studied with and without the RNA molecule inside. The proteins are flexible and described by the structure-based coarse-grained model augmented by electrostatic interactions. Previous studies of the capsid self-assembly involved solid objects of a supramolecular scale, e.g. corresponding to capsomeres, with engineered couplings and stochastic movements. In our approach, a single capsid is dissociated by an application of a high temperature for a variable period and then the system is cooled down to allow for self-assembly. The restoration of the capsid proceeds to various extent, depending on the nature of the dissociated state, but is rarely complete because some proteins depart too far unless the process takes place in a confined space.
Keywords: virus capsids, aggregation, structure-based models, proteins
1. Introduction
Protein aggregation is ubiquitous and results in different outcomes depending on the nature of the interactions between the proteins. Through cyclization and dimerization of the same protein, as well through combination with another protein, aggregation leads to a finite number of predicted topologies of protein complexes in quarternary structure space [1]. 14 of these topologies are observed in the protein data bank [2]. Aggregation may generate amorphous clusters during in vitro misfolding if there is no protection provided by chaperons [3], but it may also produce quasispherical hollow shells as in the case of apoferritin [4]. In addition, it may lead to formation of fibrous structures, such as amyloid fibers [5–8] or polymers made of sickle cell hemoglobins [9]. Finally, a spontaneous protein aggregation around a nucleic acid [10] creates compact virus capsids. The key mechanism for co-assembly of capsid proteins and RNA is provided by non-specific electrostatic interactions between RNA phosphate groups and positively charged residues, often located in flexible tails known as arginine rich motifs [11]. There is evidence that there are specific packaging sites on RNA that additionally affect the process [12]. It should be noted, however, that virus capsids can form (in vitro) without any nucleic acid as a result of manipulation of the pH of the solvent [13].
All of these aggregation processes are difficult to study through molecular dynamics especially because the entropy significantly disrupts the proper binding of the assembling units. Here, we propose an approach in which the fully assembled system is dissociated in a controlled manner by heating and then cooled back to the room temperature in an attempt to restore the original structure. Clearly, too much heating will disperse the components too much for them to reassembly within acceptable computational times. Thus there is a threshold bellow which the self-assembly still takes place, perhaps not fully, and, in this regime, one can study the reassembly pathways in a meaningful manner. In this paper, we explore this problem in the context of virus capsids.
Most of the quasispherical virus capsids are of the icosahedral symmetry. The proteins (called subunits in this context) in such capsids become arranged in special motifs. Here, we consider self-assembly of icosahedral virus capsids from proteins that are described by a coarse-grained structure-based model. This kind of the protein-based representation of the capsids has been used previously to study nanoindentation of the capsids that have been already formed [14, 15]. We focus on two viruses: SPMV (satellite panicum mosaic virus) [16] and CCMV (cowpea chlorotic mottle virus) [17, 18]. CCMV is one of the best studied viruses [19]. It contains RNA and 180 identical protein subunits. The subunits are arranged into 12 pentamers and 20 hexamers, known collectively as capsomers. This virus corresponds to the triangulation number, T, of 3 [20, 21]. It is made of 34 200 residues out of which 5 580 belong to disordered tails. SPMV is one of the smallest capsids and its symmetry corresponds to [22]. It is made of 9 420 residues grouped into 60 subunits. 960 of these residues are in the tails.
The kinetic pathways of the capsid self-assembly are diversified and the role of the nucleic acids in the process appears to depend on the system. An equilibrium Landau-type theory [23] suggests that the icosahedral state is in close competition with states that have tetrahedral and octahedral symmetries which may confound assembly. There is experimental evidence that in the case of CCMV the proteins tend to first form dimers and the capsomers arise by aggregation of the dimers [24]. However, HK97 seems to form heksamers and pentamers in one step [25]. Other experimental insights into the assembly process are scarce which calls for a thorough analysis of the process through modelling.
Existing theoretical studies of the problem involve coarse-grained models that use stiff objects imitating supramolecular objects such as capsomers that may correspond to hundreds of amino acid residues [26]. In particular, Wales [27] and Johnston et al [28] represent capsomers by rigid pentagonal pyramids so that the capsids are made of ten pyramids. Interactions between the apex points are repulsive and those between the base points are described by the Morse potential. The authors demonstrate existence of kinetic traps and a hysteretic behavior. A more detailed model has been considered by Elrad and Hagan [29, 30]. It involves truncated-pyramidal shapes constructed out of rigid polymers (see also [31–33]) that minimize their interaction energy in a perfect icosahedron. Each such object is meant to represent a trimer of proteins so the well formed capsid consists of 20 stacked objects. This model has allowed for identification of several characteristic modes of self-assembly in the presence of a polymer that depend on the strength of the object-object interactions relative to the interactions with the polymer (see also [34, 35]). In still another approach [36], the capsomers are represented by hard spheres to demonstrate that the dynamic influx of the capsomers in a cellular environment facilitates self-assembly.
It is natural to adopt a protein-based description of virus capsids when considering all-atom models [37]. However, the large number of the degrees of freedom involved has allowed only for short-time assessment of the fluctuational dynamics around the native, fully assembled conformation. Thus self-assembly, necessarily involving conformational changes of the proteins, needs to be described in terms of a flexible coarse-grained model. Here, we consider self-assembly of such proteins. They evolve according to the Newton’s equations of motion whereas the rigid supramolecular objects, considered in the previous theoretical approaches, usually undergo purely stochastic displacements (though a Newtonian approach has been proposed in [38]). Each effective atom in our model represents an amino acid residue and the contact interactions between them are of the Lennard-Jones kind. The presence of the interactions is determined through atomic-level considerations whereas in the models with the supramolecular solid objects, the intra-object interactions are engineered.
In our previous studies of nanoindentation within the same model [14, 15] (see also [39]), we have observed the crucial role of the inter-protein contacts in the capsid collapse, demonstrated existence of large differences in the deformation field compared to the continuum shell model [40], and related the Young modulus to the average contact number that a residue is a part of. The more detailed description of the model necessitates making simplifications in the physical setup. Instead of having a system of diffusing stiff capsomers that would allow for formation of tens of capsids, we just consider a single capsid. We separate the capsid into its proteins by an application of heating and then study the kinetics of self-assembly by restoring the room temperature. We study empty capsids and capsids with the polymeric RNA.
We find that the flexible and structure-based coarse-grained model of the proteins leads to self-assembly of the capsid in a way that does not necessarily proceeds through the formation of capsomers that would then combine into the capsid. It is the individual proteins that appear to be the agents of the process. The presence of the RNA molecule is observed to destabilize the capsid in a slight way, but not to affect aggregation in a significant way. The outcome of self-assembly is controlled by the unfolding temperature, the length of time during which unfolding is induced, and the waiting time as measured from the instant at which the room temperature is restored. Substantial thermal unfolding leads to only a partial reconstruction of the capsid in the cooling stage. We expect, however, that applying our procedure to many capsids, instead of just one, especially under the conditions of confinement, would improve the quality of self-assembly because a protein that separates from its original capsid through diffusion is likely to contribute to construction of another capsid elsewhere.
2. Methodology
The model of the empty capsid is described in [14, 15]. It is a generalization of the approach adopted in studies of individual proteins as outlined in [41–43]. The proteins are represented by effective atoms located at the α-C atoms of each residue and the solvent in implicit. The time evolution is defined in terms of molecular dynamics with the Langevin noise representing the influence of the solvent. The noise corresponds to temperature T. The interactions between the effective atoms divide into those corresponding to the native contacts and to the non-native contacts. The latter are softly repulsive and they operate at distances smaller than 4 Å.
The native contacts are described by the Lennard-Jones potentials of depth ϵ and with the length parameter σ determined from the native distance between the corresponding α-C atoms. Non-uniform values of ϵ within proteins have been demonstrated not to improve the model in any significant manner when confronted with the experimental data on stretching [43]. The value of ϵ has been calibrated to be equal to about 110 pN Å [42] which is close to 1.5 kcal obtained by matching all-atom energies to the coarse-grained expressions [44]. The room temperature, Tr, corresponds to of 0.3–0.35 ϵ and in the simulations, we take (kB is the Boltzmann constant). Temperatures around Tr correspond to the shortest folding times in the model with the chiral backbone stiffness [46] that is used here. After we disassembly the virus by an application of a high temperature, Th, we attempt to recombine it by restoring the temperature back to Tr. In our model, we take Th to be usually of order . Such values reduce the computational time scales, but it should be noted that the experimental melting temperatures of virus capsids are much lower. They are typically in the range 60–80 °C [45].
In order to identify the native contacts, we read in the structure file for the full capsid that is stored in the VIPERdb data base [47]. The contact map does not include the disordered tail segments of the proteins. We use the overlap criterion (for a fuller discussion of possible contact maps see [48]) to determine the existence of a native contact between two residues. The contact is considered to be present if there is at least one pair of heavy atoms whose enlarged van der Waals spheres overlap. The radii of the spheres are taken from [49] and then they are multiplied by 1.24 to account for attraction [50]. This factor corresponds to the inflection point in the Lennard-Jones potential. This leads to 71 520 native contacts in CCMV and 25 980 in SPMV. They split into intra- and inter-protein contacts. There are 19 740 intra- and 6240 inter-protein contacts in SPMV. In CCMV, the corresponding numbers are 54 600 and 16 920. In both cases, the number of the intra-protein contacts is about three times larger than the number of contacts between the proteins. Any conformation of the system of aggregating proteins can be characterized by the fraction of the established contacts relative to the native numbers of the contacts. We introduce parameters Q, Qp, and Qpp which are the fractions of all of the contacts established, contacts established within proteins, and contacts between proteins respectively. A contact is considered established if the corresponding distance between the α-C atoms does not exceed . This distance exceeds the inflection point in the potential by , but its precise choice has no dynamical consequences as it is used merely for descriptive purposes.
The simulations are performed in a free space, i.e. without any bounding walls. The implicit solvent used quenches any ballistic motion of the atoms and the characteristic time scale, τ, is of order 1 ns. This is the time needed for the effective atom to cover a distance of 5 Å through diffusion [51].
The model outlined above does not include the RNA or the disordered N-proximal segments in the proteins which contains an ARG-rich RNA binding motif. Deleting the segments does not inhibit packaging of the RNA but induces structural changes in the capsid [52]. The structure file 1CWP for the CCMV protein does not contain entries for the first 41 (chain A) or 26 (chains B and C) out of 190 residues, which shows dependence on the location in the capsomer. These are the tail segments mentioned in the Introduction. The structure file 1STM for SPMV does not specify coordinates for the first 16 out of 157 residues. In the improved model, we describe the disordered segments as chains of residues that are endowed with the excluded volume but are not capable of forming attractive contacts.
All non-neutral residues come with with the electric charges, qi. In units of e, these are for ASP and GLU, +1 for ARG and LYS, and +0.5 for HIS (to account for the different coexisting protonation states of this residue). In addition, each N-terminus is ascribed the charge of +1 and C-terminus of . There are also charges of on the phosphorus atoms of each of the bases of the RNA and the RNA itself is represented as a chain of harmonically connected beads separated by a distance of 5.8 Å. The distance associated with soft repulsion between the beads is taken after Voss and Gerstein [53] to be 8 Å, i.e. twice as large as the one associated with the amino acid residues. The distance of soft repulsion between the RNA and amino acid residue beads is 6 Å.
The electrostatic interactions are described by the Debye–Hueckel potential:
| 1 |
where r is the distance between the charges, Å is the screening length, and is the dielectric constant of water. The electrostatic terms do not apply to the pairs of residues which are already connected by the native contacts because such connections are generally expected to incorporate electrostatics. They act primarily within the RNA and between the RNA and the charged amino acid residues, especially in the dangling ends, to which no native contacts can be assigned.
The genome content of the CCMV virus has been determined through mass spectroscopy [54]. There is a number of different RNA molecules that can be present in any CCMV capsid. The most common of them are denoted as RNA1, RNA2, RNA3 and RNA4. Their lengths correspond to 3171, 2774, 2173, and 824 bases respectively. In most cases, three different fraction of capsids are found: those containing single RNA1 or RNA2 molecules and those encompassing both RNA3 and RNA4 molecules. However, in theory, there are other possibilities for the length and they range between 100 to 12 000 with the preferential packaging of about 3200 [55, 56] yielding the the optimal protein/RNA mass ratio of 6:1, which allows encapsulations of all RNA in solution. There is just one molecule of RNA in SPMV and it is made of 826 bases [57]. We adopt a shorthand notation in which ‘with RNA’, especially in the figures and tables, denotes a model that takes both the RNA and the protein tails into account. Otherwise (or with the annotation ‘empty’), there are no RNA and no tails as in the previous study [14, 15].
3. Results
3.1. Dependence of the equilibrium properties on the temperature
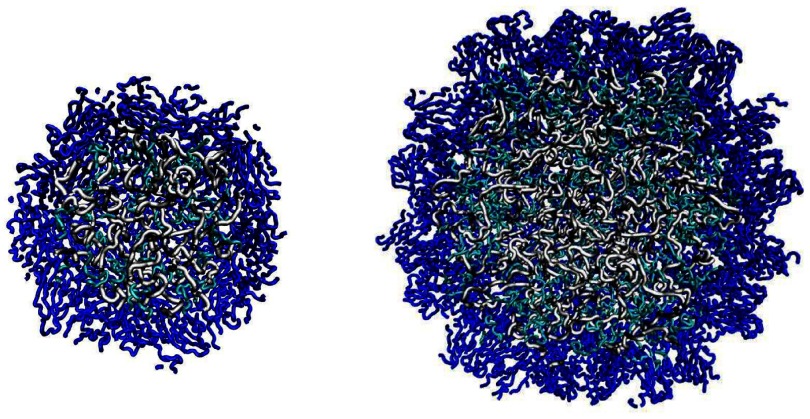
The initial state of the system with the RNA is derived by starting with the hollow crystalline structure and adding the missing elements: the dangling ends and the RNA. These elements are generated as self-avoiding random walks that also avoid other chains. When generating such walks, we attempt to select an orientation of each next bond by choosing random Euler angles up to 10 000 times until a non-overlapping conformation is found. A failure results in repeating the construction anew. Such structures need to be equilibrated at Tr. We find that the equilibration lasting for 1000 τ is sufficient. For a meaningful comparison, we also equilibrate the empty structures in the similar way. Examples of the derived structures are shown in figure 1. They correspond to snapshots obtained at 20 000 τ.
Figure 1.
Cross-sections of the SPMV (on the left) and CCMV (on the right) virus capsids in our model. The snapshots are shown after equilibration. The dark blue symbols represent the structured segments of the proteins whereas the light blue symbols represent the dangling ends. The RNA molecule is shown in gray.
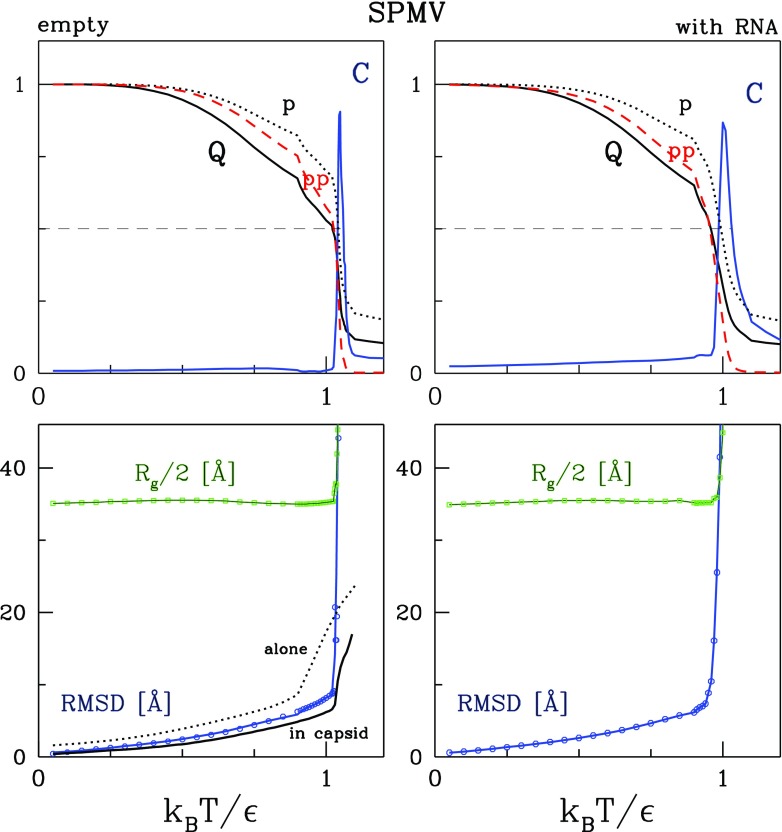
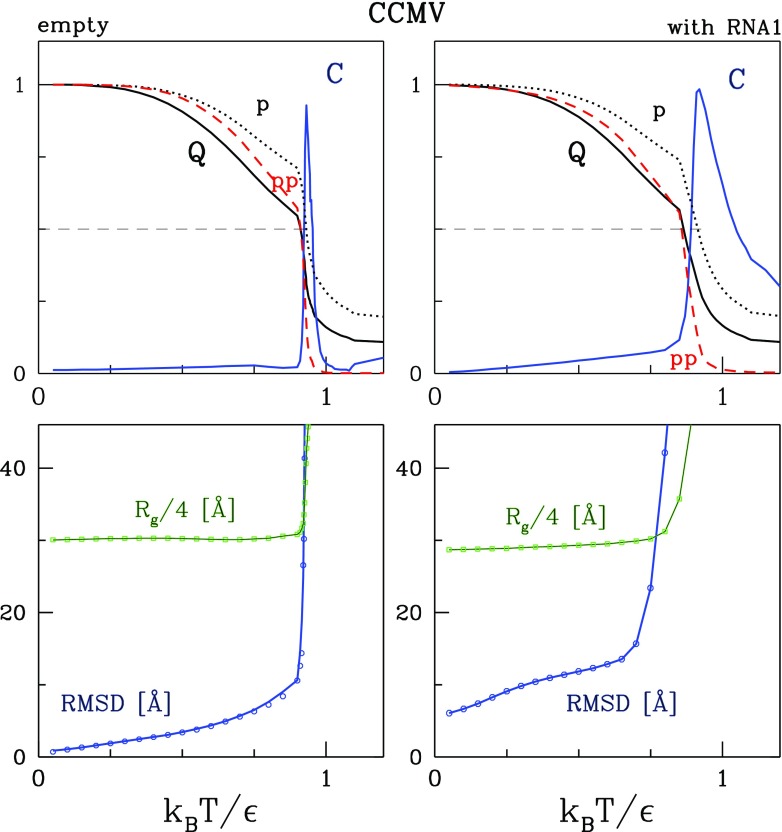
Figures 2 and 3 show the dependence of the equilibrium values of six parameters on T for SPMV and CCMV respectively, as obtained from 10 trajectories of 100 000 τ that start from the conformations generated through the initial equilibration. The left panels are for the empty capsids and the right panels are for the capsids with the RNA (in the case of CCMV this is the molecule RNA1) and the protein tails. The first parameter is C. This is the specific heat normalized to its maximal value. The maximum in the specific heat is located at temperature Tmax, the values of which are listed in table 1. Around Tmax there is a transition between the quasispherical shape and disordered arrangements. Tmax is observed to be lower for CCMV than for SPMV. The difference is about 10% both for capsids with the RNA and without. The presence of the RNA is seen to lead to a lowering of Tmax. This happens because the moving RNA molecule keeps striking the capsid shell which contributes to its destabilization. The maxima in C get broader when the RNA is included. The RNA contributes to fluctuations in the total energy from which C is calculated.
Figure 2.
The temperature dependence of the equilibrium parameters describing the SPMV capsid (empty capsid in the left panels and encompassing the RNA in the right panels). The top panels show the normalized specific heat (in blue), Q (in black), (in black), and Qpp (in red). The dashed lines indicate the level of . The bottom panels show Rg and RMSD. The bottom left panel also shows the RMSD for a single protein when studied alone (the dotted line) or as a part of the capsid (the solid black line).
Figure 3.
Similar to figure 2 but for CCMV, except that here no results for single proteins are shown.
Table 1.
Characteristic temperatures for the systems studied.
| CAPSID | ||||
|---|---|---|---|---|
| SPMV | 1.045 | 1.021 | 1.044 | 1.029 |
| SPMV with RNA | 1.025 | 0.965 | 0.991 | 0.961 |
| CCMV | 0.932 | 0.904 | 0.929 | 0.908 |
| CCMV with RNA1 | 0.912 | 0.865 | 0.910 | 0.852 |
The other three parameters are Q, Qp, and Qpp. They cross at characteristic temperatures denoted as TQ, Tp, and Tpp respectively. The values of these temperatures are also listed in table 1. Generally, they are close to Tmax. It should be noted, however, that the growth in T destabilizes the inter-protein contacts more than the intra-protein ones. This is reflected in the values of Tp and Tpp and in the plots of Qp and Qpp in figures 2 and 3. This is also analogous to what happens on squashing the capsid through nanoindentation: the mechanical collapse of the structure starts by a destruction of most of the inter-protein contacts.
The lower panels in figures 2 and 3 also show Rg, the average values of the radius of gyration of the capsids, and RMSD, the average values of the root mean square deviations in the positions of the α-C atoms relative to those in the crystalline structure obtained without the RNA molecules. In the calculation of Rg in the presence of the RNA, we include the protein tails but not the nucleic acid. However, in the calculation of the RMSD, the tails do not contribute as there is no reference structure to compare to. We observe that both Rg and RMSD grow rapidly around Tmax.
The lower left panel of figure 2 also shows the RMSD for a single protein in two states: in isolation and as a part of the capsid. We observe that, in the latter case, the protein is more stable due to the contact interactions with the neighboring proteins. At Tr, The RMSD drops from 2.54 ± 0.45 to 1.05 ± 0.10 Å when the isolated 1STM chain is made to be a part of SPMV. In the case of the 1CWP chain of CCMV, the drop is from 3.85 ± 0.94 to 1.42 ± 0.14 Å for chain A and from 7.2 ± 1.72 to 1.45 ± 0.13 Å for chains B and C.
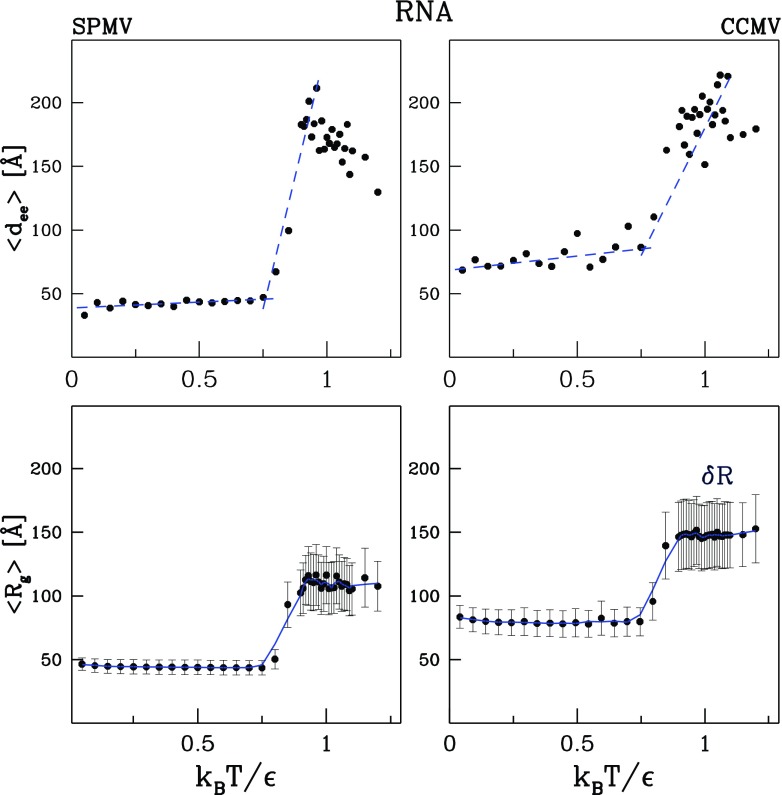
We now discuss the properties of RNA in a capsid. Figure 4 shows the T-dependence of Rg and the average end-to-end distance, , for the RNA molecule in SPMV and RNA1 molecule in CCMV. Around Tmax, both quantities are seen to undergo a rapid rise that is related to the molecule leaving the dissociating capsid and thus experiencing a significantly reduced confinement. Rg is observed to switch from a lower to a higher level on heating. The data points for Rg are very close to those for , which is the average radial distance of the α-C atoms from the (moving) center of mass of the molecule. The vertical bars in the bottom panels of figure 4 show the width, , of the nearly Gaussian distribution of the distances (the full length of the bars is equal to the width).
Figure 4.
Characterization of the RNA molecule in the model SPMV (the left panels) and CCMV (the right panels) capsids. The top panels represent the end-to-end distance. The bottom panels show the average radius of gyration and the vertical bars show the width of the distribution of the average distance from the center of mass.
Table 2 lists other geometrical parameters that pertain to the capsid: the average distance from the center of mass, , Rg, the width of the radial distribution of the mass, which serves as a measure of the thickness of the viral shell, and the average minimal and maximal distances from the center of mass to the α-C atoms. ( is analogous to , but the former is for the proteins and the latter for the RNA.) All of these averages are calculated at Tr and compared to the native values whenever the nucleic acid is absent (for a more extensive discussion of the native-state geometry of the capsids see [58]). We observe that is very close to Rg. With the RNA, Rg is smaller than without because of the electrostatic attraction between the more or less centrally located nucleic acid and the proteins. In the case of CCMV the reduction in Rg is by 4%. However, the thickness with the RNA is larger than without, because of the tails that tend to point away from the structured parts of the proteins. The tails are also responsible for the substantial lowering the the values of Rmin. We observe that the electrostatic attraction between the RNA and the proteins affects primarily the dangling ends: when the dangling ends are removed, the values of and Rg are found to be nearly the same as in the systems without the RNA.
Table 2.
Characteristic geometric properties of the systems studied. The equilibrated values are determined from five simulations that are 100 000 τ long. Without dangling ends means that they were not considered in parameter calculation but were present in the simulation.
| CAPSID | (Å) | Rg (Å) | (Å) | Rmin (Å) | Rmax (Å) | |||||
|---|---|---|---|---|---|---|---|---|---|---|
| native & at | native & at | native & at | native & at | native & at | ||||||
| SPMV | 69.66 | 70.54 | 69.97 | 70.84 | 6.64 | 6.59 | 56.99 | 55.76 | 85.37 | 87.79 |
| SPMV with RNA | — | 68.29 | — | 68.96 | — | 9.63 | — | 21.89 | — | 88.10 |
| Without dandling ends | — | 70.68 | — | 70.98 | — | 6.52 | — | 56.56 | — | 87.86 |
| CCMV | 119.56 | 121.39 | 120.02 | 121.84 | 10.54 | 10.36 | 95.34 | 93.25 | 142.49 | 145.92 |
| CCMV with RNA1 | — | 115.84 | — | 117.03 | — | 16.61 | — | 34.79 | — | 149.76 |
| Without dangling ends | — | 121.39 | — | 121.83 | — | 10.36 | — | 96.88 | — | 146.50 |
3.2. Dissociation of the capsids
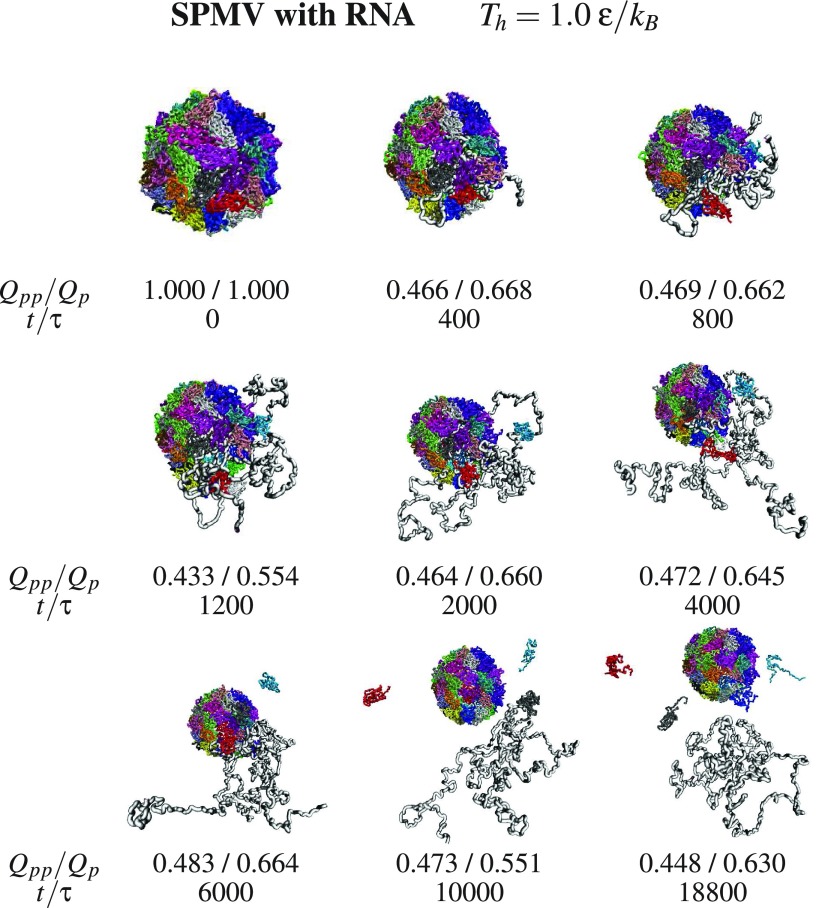
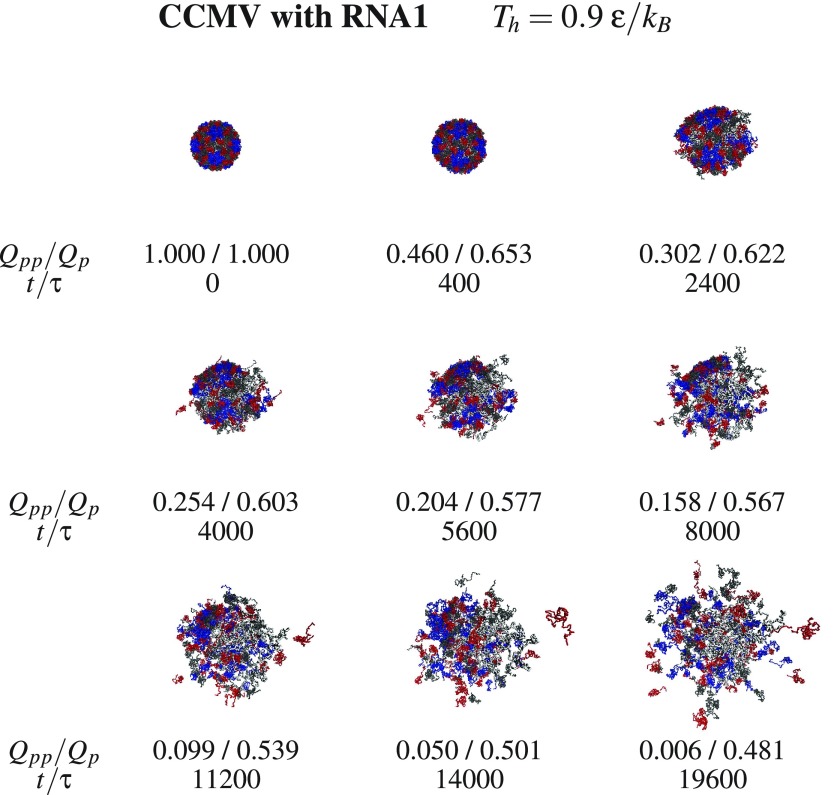
One may obtain fast dissociation by selecting Th to be in the vicinity of Tmax. Such temperatures are unrealistically high, but they serve the numerical purpose and can also be thought of as representing potent chemical denaturants. Figures 5 and 6 show examples of the dissociation process for SPMV at and CCMV at , both with the RNA molecule, respectively. The subsequent conformations are characterized by the values of Qpp and Qp. In the snapshots shown for SPMV, Qpp decreases (not strictly monotonically) from 1 to 0.448 in the time span of 18 800 τ. In the case of CCMV, Qpp decreases to 0.006 in a comparable time span of 19 600 τ. Despite the increasing number of the ruptured links between the proteins, the proteins themselves are pretty well connected by the internal contacts. In the final stage shown, Qp is 0.630 for SPMV and 0.481 for CCMV. There appears to be an important difference between the behavior of the RNA molecule in the two systems. For SPMV, the RNA separates from the capsid proteins entirely whereas for CCMV, RNA1 continues to be surrounded by the proteins in all directions. The difference may have to do with the larger mobility of the four times shorter RNA in SPMV compared to CCMV, or perhaps also, to the specific choice of the temperature.
Figure 5.
Snapshots form one trajectory of dissociation of the model SPMV with RNA at Th written at the top. Under each snapshot, there is information about the corresponding values of Qpp, Qp, and the time of heating. The colors used to show proteins are arbitrary. The RNA is shown in gray.
Figure 6.
Similar to figure 5 but for CCMV with RNA. Chains A, B, and C are marked in blue, red, and black respectively.
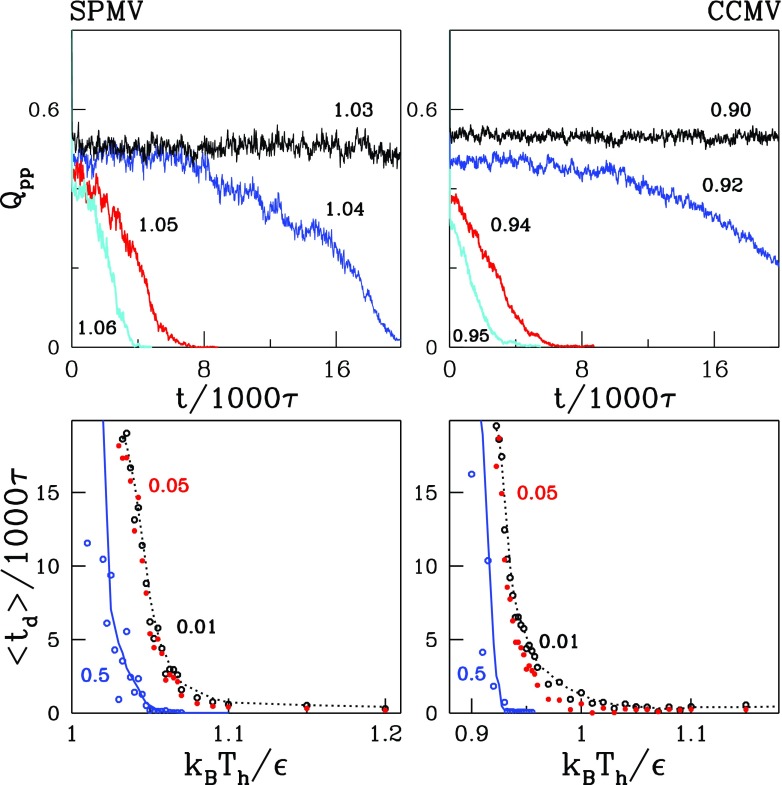
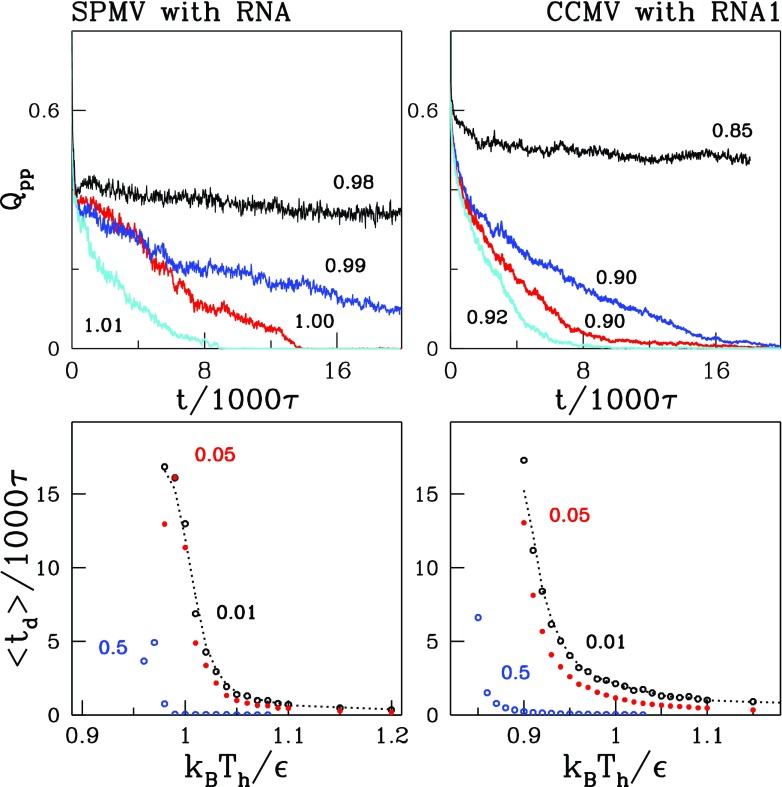
The disintegration is a kinetic process and its observed outcome depends on the value of Th and the duration of heating. This is illustrated in the top panels of figures 7 and 8 which show the time (t) dependence of Qpp at several temperatures in the vicinity of Tmax for the systems considered. The second of these figures is for the systems with the RNA and the first—without. For the Th selected, the dissociation times, td, are of order 1000–10 000 τ.
Figure 7.
The top panels show the time dependence of Qpp during heating, on the left for SPMV and on the right for CCMV. The numbers indicate the values of Th in units of . The bottom panels show the average dissociation times for various indicated levels of what is considered to be a successful dissociation.
Figure 8.
Similar to figure 7 but for capsids with RNA.
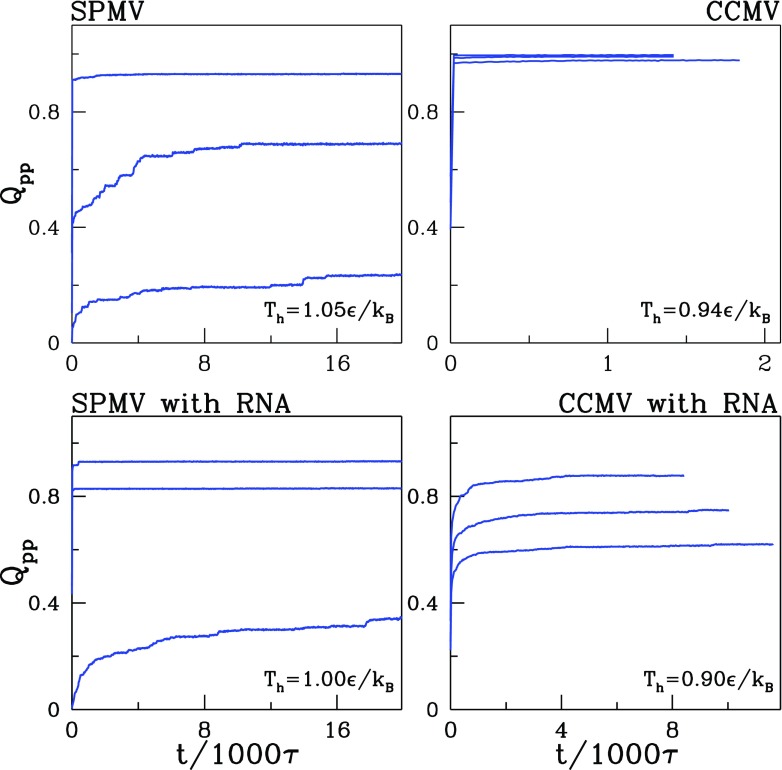
Figures 7 and 8 show the average dissociation times needed for Qpp to drop to predefined threshold value, Qth, as a function of Th. The data points are based on 20 trajectories. We consider Qth to be 0.01, 0.05, and 0.5 as indicated in the figure. The more stringent the disintegration criterion is (the lower value of Qth), the longer the corresponding time. Another way to describe the data in figures 7 and 8 is to say that a given dissociation time is achieved at a higher Th if Qth is lowered. By manipulating Th and the time of heating we can prepare a capsid corresponding to a given value of Qpp and then observe how it aggregates on restoring the T back to Tr.
3.3. Self-assembly of the capsids
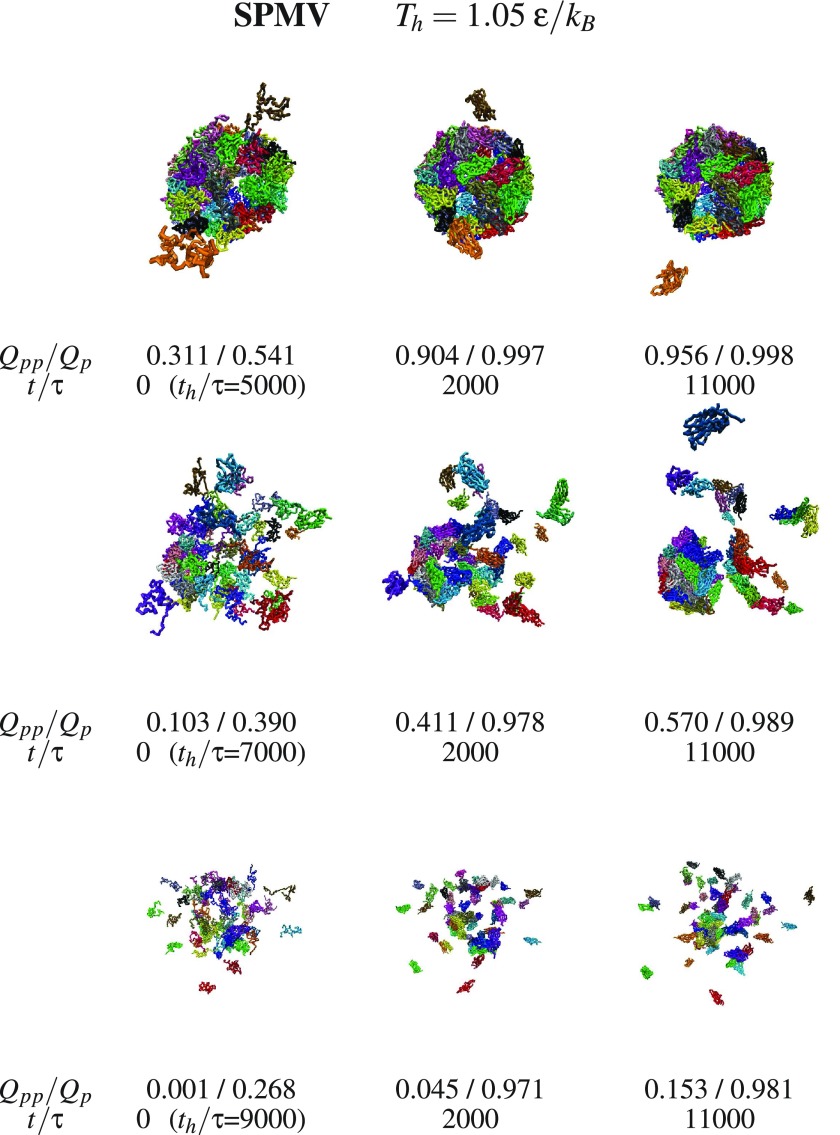
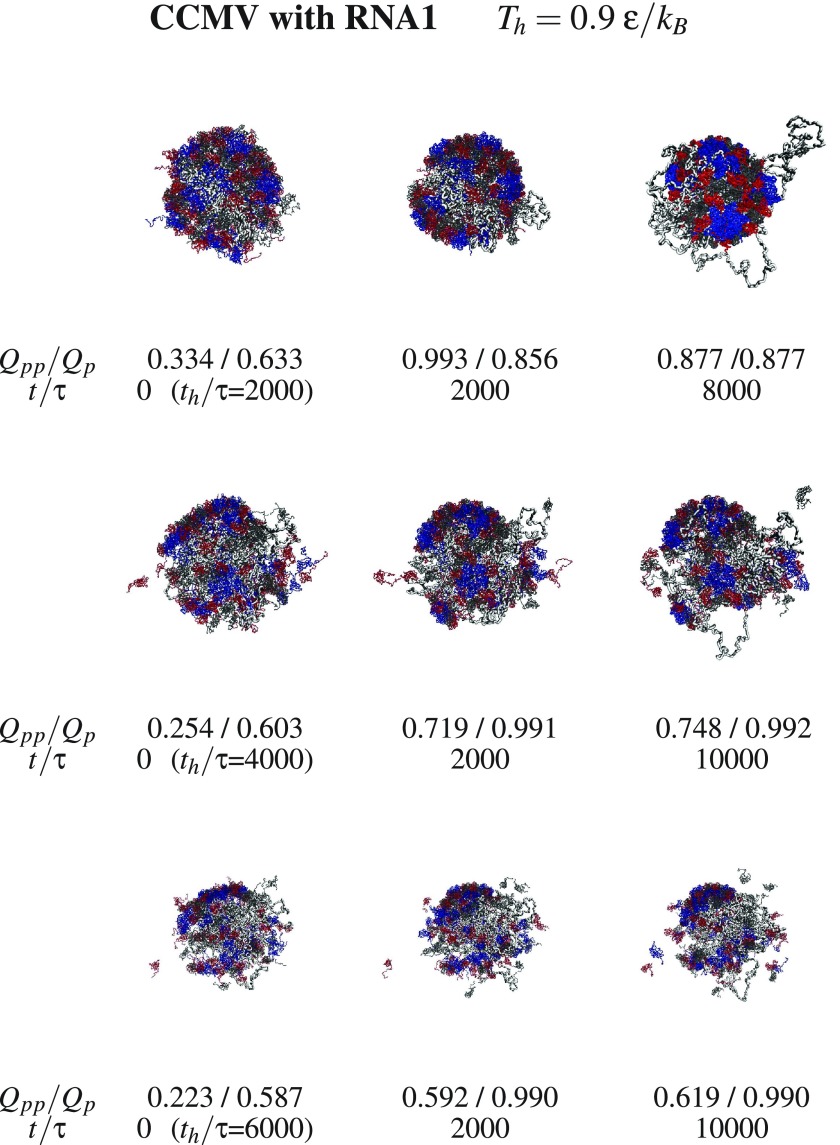
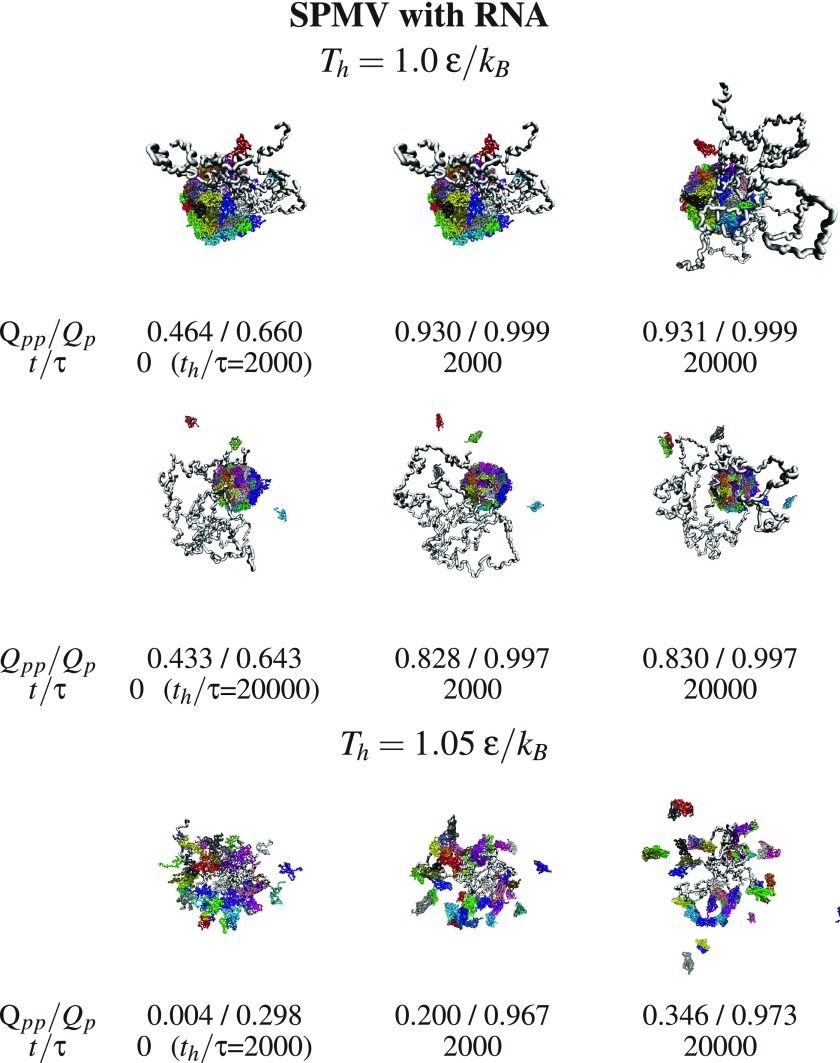
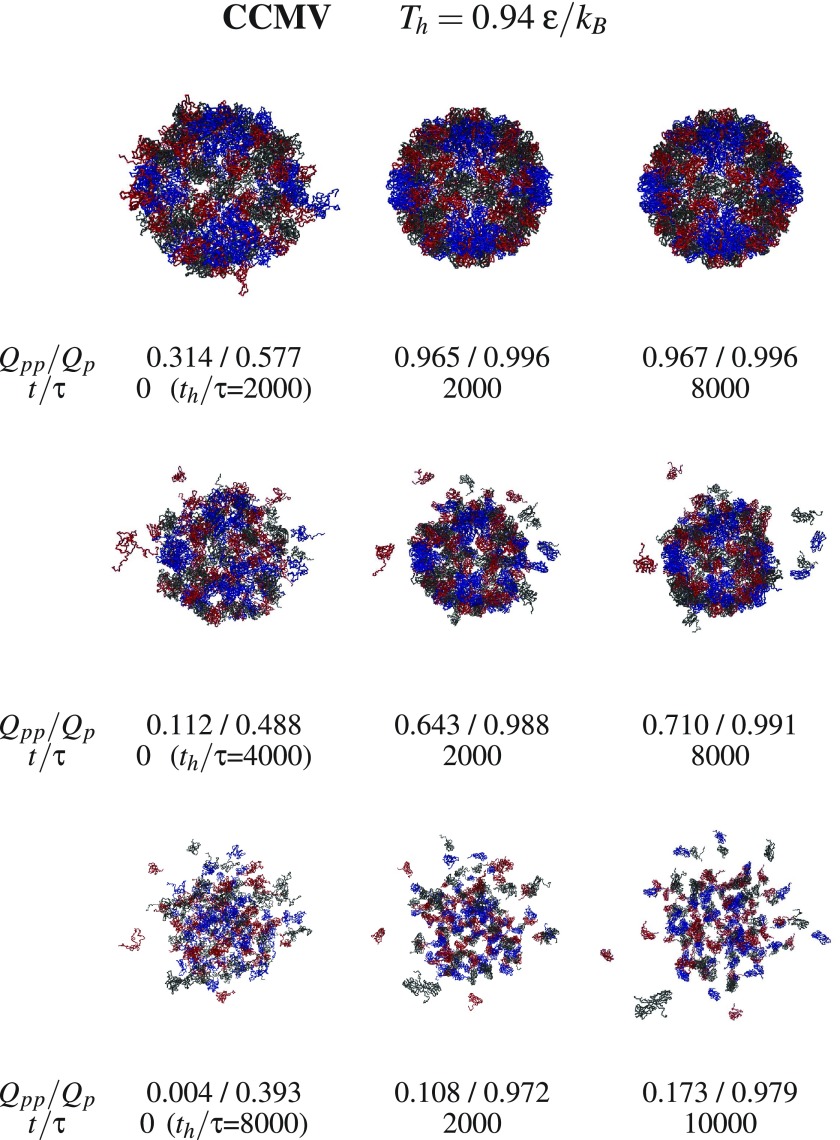
We now consider aggregation and discuss what happens with the dissociated fragments when the temperature is switched back from Th to Tr. Examples of triplet snapshots from the aggregation trajectories are shown in figures 9–12, where the first two figures address the systems without the RNA and the last two—with the RNA. In each triplet, the first snapshot defines the state which is considered to be initial for the studied aggregation process. This initial state is characterized by the values of Th (specified at the top of each figure) and the duration of the dissociation, th, (specified next to the first snapshot in each triplet).
Figure 9.
Examples of the SPMV capsid assembly after thermal denaturation at the temperature indicted at the top. Each horizontal triplet of panels shows snapshots appearing after evolving from the leftmost structure. This starting structure has been obtained at Th applied for time th written underneath in the brackets. The values of Qpp and Qp are indicated. The colors of the proteins are arbitrary.
Figure 12.
Similar to figure 9 but for CCMV with RNA1. Chains A, B, and C are marked in blue, red, and black respectively.
Figure 10.
Similar to figure 9 but form SPMV with RNA. The RNA molecule is shown in gray.
Figure 11.
Similar to figure 9 but for for CCMV. Chains A, B, and C are marked in blue, red, and black respectively.
The snapshots point to a steady growth in the inter-protein connectivity and to an aggregation which, in the case of SPMV, leaves the RNA outside of the assembling capsid when the initial state corresponds to the RNA being separated. The energy terms in our model do not appear to provide means of return penetration of the capsid by the RNA.
Figure 13 shows the t-dependence of Qpp in the trajectories from which the snapshots were captured. We observe that, at least within our time scales, the self-assembly is never perfect. Qpp is seen to usually rise rapidly and then to saturate on a constant value, which may be even as high as nearly 90%, but typically is much smaller. The incomplete nature of the process is primarily due to some proteins departing too far away from the original location of the capsid that dissociated. Reconstruction speeds can be defined as the time derivatives of Qpp. Their analysis at short time scales indicates an approximate decrease. Based on this, we estimate that achieving the ultimate saturation level should take several seconds.
Figure 13.
The time dependence of Qpp during self-assembly at Tr for the systems indicted. The initial states were obtained by heating at Th with values written in the right bottom corners of the panels.
We do not observe any clear signature of assembly that would proceed by first forming capsomeres and then joining the capsomeres together. Heating may disrupt local structural patterns but they are obviously capsomer related: any group of proteins may rupture and then come back to the original state on cooling, if the perturbation is not too large. Separated proteins may combine into clusters but the clusters are not necessarily capsomerial entities. The proteins do not have identity and appear to act similar to condensing gas molecules that can fit to many places in a growing droplet.
It should be noted that our model is defined primarily by the native contact map. Thus, when two proteins recombine, it is of a secondary importance whether they belong to the same or different capsomers, unless there is a strong imbalance in the number of the connecting contacts. There could be a difference in statistics, but we could not capture it. It requires further studies to figure out whether comparable formation of the intra- and inter-capsomer dimers is the feature of the structure-based model or is more general. It would also be interesting to do a systematic study for various viruses in this context.
4. Conclusions
We have considered self-assembly of flexible proteins coming from a single capsid that gets dismantled thermally. We have used the the structure-based coarse-grained model with short range contact interactions and effectively short range Coulomb interactions. We demonstrate that this model does lead to self-assembly but the process is incomplete because of some proteins diffusing outside of the range of the interactions. The escape of the proteins could be eliminated by considering the process under the conditions of confinement.
In a situation with many capsids in a solvent, and not just one considered here, it is possible that a stray protein may dock properly into some other self-assembling capsid, leading to its more complete construction. It would be interesting to generalize our model to a multi-capsid version and to study self-assembly as a function of the number of the capsids and under confinement. It should be noted, however, that the multiple-capsid problem involves conceptual issues when considered within the structure-based model. These issues are not solved yet. For a single globular protein, the native structure defines a unique contact map (for a given scheme of selecting the contacts). However, a possibility of aggregating proteins that belong originally to various capsids requires defining a contact map which sheds information about the capsid of origin.
A multi-capsid model that needs to be constructed could also be used to analyze formation of capsid lattices on solids, which are of interest in biotechnological applications [59, 60]. Another related direction of a future research within our approach could be considering virus self-assembly on a fluctuating lipid membrane [61] since the membranes can promote association.
We have not observed any clear differences between self-assembly of SPMV and CCMV except that, during the dissociation taking place around Tmax, the RNA molecule finds it easier to leave the SPMV shell than the CCMV one and then cannot get back inside. This difference is primarily due to the fact that the RNA molecule associated with SPMV is much more mobile than RNA1 associated with CCMV because it is a factor of 4 shorter sequentially. However, the dissociation patterns are governed also by the temperature. At temperatures higher than Tmax the SPMV capsid fully unravels in a way shown in figure 6 for CCMV near Tmax.
Our model does not explicitly introduce a possibility of hierarchical assembly in which binding characteristics depend on the stage of the process [62] (say, forming capsomeres involves different propensity than that of the full capsids). However, such features may arise naturally and are worth being explored.
Supplementary Material
Acknowledgments
KW was supported by the European Framework Programme VII NMP grant 604530-2 (CellulosomePlus) which was cofinanced by by the Polish Ministry of Science and Higher Education from the resources granted for the years 2014–2017 in support of international scientific projects. MC has received funding from the National Science Centre (NCN), Poland, under grant No. 2014/15/B/ST3/01905. MC has also benefited from grant No. 2015/19/P/ST3/03541 to Panagiotis Theodorakis administered by NCN and awarded by the European Union’s Horizon 2020 research and innovation programme under the Marie Skłodowska–Curie grant agreement No. 665778. The computer resources were supported by the PL-GRID infrastructure and financed by the European Regional Development Fund under the Operational Programme Innovative Economy NanoFun POIG.02.02.00-00-025/09.
References
- 1.Ahnert S E, Marsh J A, Hernandez H, Robinson C V, Teichmann S A. Science. 2015;350:aaa2245. doi: 10.1126/science.aaa2245. [DOI] [PubMed] [Google Scholar]
- 2.Berman H M, Westbrook J, Feng Z, Gilliland G, Bhat T N, Weissig H, Shindyalov I N, Bourne P E. Nucl. Acids Res. 2000;28:235–42. doi: 10.1093/nar/28.1.235. [DOI] [PMC free article] [PubMed] [Google Scholar]
- 3.Gething M-J, Sambrook J. Nature. 1992;355:33–45. doi: 10.1038/355033a0. [DOI] [PubMed] [Google Scholar]
- 4.Harrison P M, Arosio P. Biochim. Biophys. Acta. 1996;1275:161–203. doi: 10.1016/0005-2728(96)00022-9. [DOI] [PubMed] [Google Scholar]
- 5.Wu C, Shea J E. Curr. Opin. Struct. Biol. 2011;21:209–20. doi: 10.1016/j.sbi.2011.02.002. [DOI] [PubMed] [Google Scholar]
- 6.Nguyen P, Derreumaux P. Acc. Chem. Res. 2014;47:603–11. doi: 10.1021/ar4002075. [DOI] [PubMed] [Google Scholar]
- 7.Knowles T P, Vendruscolo M, Dobson C M. Nat. Rev. Mol. Cell. Biol. 2014;15:384–96. doi: 10.1038/nrm3810. [DOI] [PubMed] [Google Scholar]
- 8.Ranganathan S, Maji S K, Padinhateeri R. J. Am. Chem. Soc. 2016;138:13911–22. doi: 10.1021/jacs.6b06433. [DOI] [PubMed] [Google Scholar]
- 9.Eaton W A, Hofrichter J. Adv. Protein Chem. 1990;40:63–279. doi: 10.1016/s0065-3233(08)60287-9. [DOI] [PubMed] [Google Scholar]
- 10.Adolph K W, Butler P J. Phil. Trans. R. Soc. B. 1976;276:113–22. doi: 10.1098/rstb.1976.0102. [DOI] [PubMed] [Google Scholar]
- 11.Schneemann A. Annu. Rev. Microbiol. 2006;60:51–67. doi: 10.1146/annurev.micro.60.080805.142304. [DOI] [PubMed] [Google Scholar]
- 12.Dykeman E C, Grayson N E, Toropova K, Ranson N A, Stockley P G, Twarock R. J. Mol. Biol. 2011;408:399–407. doi: 10.1016/j.jmb.2011.02.039. [DOI] [PubMed] [Google Scholar]
- 13.Fraenkel-Conrat H, Williams R C. Proc. Natl Acad. Sci. USA. 1955;41:690–8. doi: 10.1073/pnas.41.10.690. [DOI] [PMC free article] [PubMed] [Google Scholar]
- 14.Cieplak M, Robbins M O. J. Chem. Phys. 2010;132:015101. doi: 10.1063/1.3276287. [DOI] [PubMed] [Google Scholar]
- 15.Cieplak M, Robbins M O. PLoS One. 2013;8:e63640. doi: 10.1371/journal.pone.0063640. [DOI] [PMC free article] [PubMed] [Google Scholar]
- 16.Omarov R T, Qi D, Scholthof K-B G. J. Virol. 2005;79:9756–64. doi: 10.1128/JVI.79.15.9756-9764.2005. [DOI] [PMC free article] [PubMed] [Google Scholar]
- 17.Bancroft J B, Hiebert E, Rees M W, Markham R. Virology. 1968;34:224–39. doi: 10.1016/0042-6822(68)90232-8. [DOI] [PubMed] [Google Scholar]
- 18.Konecny R, Trylska J, Tama F, Zhang D, Baker N A, Brooks C L, III, McCammon J A. Biopolymers. 2006;82:106–20. doi: 10.1002/bip.20409. [DOI] [PMC free article] [PubMed] [Google Scholar]
- 19.Roos W H, Bruisma R, Wuite G J L. Nat. Phys. 2010;6:733–43. doi: 10.1038/nphys1797. [DOI] [Google Scholar]
- 20.Speir J A, Munshi S, Wang G J, Baker T S, Johnson J E. Structure. 1995;3:63–78. doi: 10.1016/S0969-2126(01)00135-6. [DOI] [PMC free article] [PubMed] [Google Scholar]
- 21.Lin T, Chen Z, Usha R, Stauffacher C V, Dai J-B, Schmidt T, Johnson J E. Virology. 1999;265:20–34. doi: 10.1006/viro.1999.0038. [DOI] [PubMed] [Google Scholar]
- 22.Ban N, McPherson A. Nat. Struct. Biol. 1995;2:882–90. doi: 10.1038/nsb1095-882. [DOI] [PubMed] [Google Scholar]
- 23.Dharmavaran S, Xie F, Klug W, Rudnick J, Bruinsma R. Phys. Rev. E. 2017;95:062402. doi: 10.1103/PhysRevE.95.062402. [DOI] [PubMed] [Google Scholar]
- 24.Zlotnick A, Aldrich R, Johnson J M, Ceres P, Young M J. Virology. 2000;277:450–6. doi: 10.1006/viro.2000.0619. [DOI] [PubMed] [Google Scholar]
- 25.Xie Z, Hendrix R W. J. Mol. Bol. 1995;253:74–85. doi: 10.1006/jmbi.1995.0537. [DOI] [PubMed] [Google Scholar]
- 26.Endres D, Zlotnick A. Biophys. J. 2002;83:1217–30. doi: 10.1016/S0006-3495(02)75245-4. [DOI] [PMC free article] [PubMed] [Google Scholar]
- 27.Wales D J. Phil. Trans. R. Soc. 2005;363:357–77. doi: 10.1098/rsta.2004.1497. [DOI] [PubMed] [Google Scholar]
- 28.Johnston I G, Louis A A, Doye J P K. J. Phys.: Condens. Matter. 2010;22:104101. doi: 10.1088/0953-8984/22/10/104101. [DOI] [PubMed] [Google Scholar]
- 29.Elrad O M, Hagan M F. Nano Lett. 2008;8:3850–7. doi: 10.1021/nl802269a. [DOI] [PMC free article] [PubMed] [Google Scholar]
- 30.Elrad O M, Hagan M F. Phys. Biol. 2010;7:045003. doi: 10.1088/1478-3975/7/4/045003. [DOI] [PMC free article] [PubMed] [Google Scholar]
- 31.Rapaport D C. Phys. Rev. Lett. 2008;101:186101. doi: 10.1103/PhysRevLett.101.186101. [DOI] [PubMed] [Google Scholar]
- 32.Rapaport D C. Phys. Rev. E. 2004;70:051905. doi: 10.1103/PhysRevE.70.051905. [DOI] [PubMed] [Google Scholar]
- 33.Nguyen H D, Reddy V S, Brooks C L., III J. Am. Chem. Soc. 2009;131:2606–14. doi: 10.1021/ja807730x. [DOI] [PMC free article] [PubMed] [Google Scholar]
- 34.Zlotnick A, Porterfield J Z, Wang J C-Y. Biophys. J. 2013;104:1595–604. doi: 10.1016/j.bpj.2013.02.005. [DOI] [PMC free article] [PubMed] [Google Scholar]
- 35.Garmann R F, Comas-Garcia M, Gopal A, Knobler C M, Gelbart W M. J. Mol. Biol. 2014;426:1050–60. doi: 10.1016/j.jmb.2013.10.017. [DOI] [PMC free article] [PubMed] [Google Scholar]
- 36.Boettcher M A, Klein H C R, Schwarz U S. Phys. Biol. 2015;12:016014. doi: 10.1088/1478-3975/12/1/016014. [DOI] [PubMed] [Google Scholar]
- 37.Freddolino P L, Arkhopov A S, Larson S B, McPherson A, Schulten K. Structure. 2006;14:437–49. doi: 10.1016/j.str.2005.11.014. [DOI] [PubMed] [Google Scholar]
- 38.Hagan M F, Chandler D. Biophys. J. 2006;91:42–54. doi: 10.1529/biophysj.105.076851. [DOI] [PMC free article] [PubMed] [Google Scholar]
- 39.Kononova O, Snijder J, Brasch M, Cornelissen J, Dima R I, Marx K A, Wuite G J L, Roos W H, Barsegov V. Biophys. J. 2013;105:1893–903. doi: 10.1016/j.bpj.2013.08.032. [DOI] [PMC free article] [PubMed] [Google Scholar]
- 40.Gibbons M M, Klug W S. Phys. Rev. E. 2007;75:031901. doi: 10.1103/PhysRevE.75.031901. [DOI] [PubMed] [Google Scholar]
- 41.Sułkowska J I, Cieplak M. J. Phys.: Condens. Matter. 2007;19:283201. doi: 10.1088/0953-8984/19/28/283201. [DOI] [Google Scholar]
- 42.Sikora M, Sułkowska J I, Cieplak M. PLoS Comp. Biol. 2009;5:e1000547. doi: 10.1371/journal.pcbi.1000547. [DOI] [PMC free article] [PubMed] [Google Scholar]
- 43.Sułkowska J I, Cieplak M. Biophys. J. 2008;95:3174–91. doi: 10.1529/biophysj.107.127233. [DOI] [PMC free article] [PubMed] [Google Scholar]
- 44.Poma A B, Chwastyk M, Cieplak M. J. Phys. Chem. B. 2015;119:12028–41. doi: 10.1021/acs.jpcb.5b06141. [DOI] [PubMed] [Google Scholar]
- 45.Rayaprolu V, et al. J. Virol. 2013;87:13150–60. doi: 10.1128/JVI.01415-13. [DOI] [PMC free article] [PubMed] [Google Scholar]
- 46.Wołek K, Cieplak M. J. Chem. Phys. 2016;144:185102. doi: 10.1063/1.4948783. [DOI] [PubMed] [Google Scholar]
- 47.Carrillo-Tripp M, Shepherd C, Borelli I A, Venkataraman S, Lander G, Natarajan P, Johnson J E, Brooks C L, III, Reddy V. Nucl. Acids Res. 2009;37:D436–42. doi: 10.1093/nar/gkn840. [DOI] [PMC free article] [PubMed] [Google Scholar]
- 48.Wołek K, Gómez-Sicilia À, Cieplak M. J. Chem. Phys. 2015;143:243105. doi: 10.1063/1.4929599. [DOI] [PubMed] [Google Scholar]
- 49.Tsai J, Taylor R, Chothia C, Gerstein M. J. Mol. Biol. 1999;290:253–66. doi: 10.1006/jmbi.1999.2829. [DOI] [PubMed] [Google Scholar]
- 50.Settanni G, Hoang T X, Micheletti C, Maritan A. Biophys. J. 1002;83:3533–41. doi: 10.1016/S0006-3495(02)75353-8. [DOI] [PMC free article] [PubMed] [Google Scholar]
- 51.Szymczak P, Cieplak M. J. Chem. Phys. 2006;125:164903. doi: 10.1063/1.2358346. [DOI] [PubMed] [Google Scholar]
- 52.Annamalai P, Apte S, Wilkens S, Rao A L N. J. Virol. 2005;79:3277–88. doi: 10.1128/JVI.79.6.3277-3288.2005. [DOI] [PMC free article] [PubMed] [Google Scholar]
- 53.Voss N R, Gerstein M. J. Mol. Biol. 2005;346:477–92. doi: 10.1016/j.jmb.2004.11.072. [DOI] [PubMed] [Google Scholar]
- 54.van de Waterbeemd M, Snijder J, Tsvetkova I B, Dragnea B G, Cornelissen J J, Heck A J R. J. Am. Soc. Mass Spectrom. 2016;27:1000–9. doi: 10.1007/s13361-016-1348-6. [DOI] [PMC free article] [PubMed] [Google Scholar]
- 55.Comas-Garcia M, Cadena-Nava R D, Rao A L, Knobler C M, Gelbart W M. J. Virol. 2012;86:12271–82. doi: 10.1128/JVI.01695-12. [DOI] [PMC free article] [PubMed] [Google Scholar]
- 56.Sicard A, Michalakis Y, Gutierrez S, Blanc S. PLoS Pathogens. 2016;3:1005819. doi: 10.1371/journal.ppat.1005819. [DOI] [PMC free article] [PubMed] [Google Scholar]
- 57.Masuta C, Zuidema D, Hunter B G, Heaton L A, Sopher D S, Jackson A O. Virology. 1987;159:329–38. doi: 10.1016/0042-6822(87)90471-5. [DOI] [PubMed] [Google Scholar]
- 58.Chwastyk M, Jaskolski M, Cieplak M. Proteins. 2016;84:1275–86. doi: 10.1002/prot.25076. [DOI] [PubMed] [Google Scholar]
- 59.Lai Y-T, King N P, Yeates T O. Trends Cell Biol. 2012;22:653–61. doi: 10.1016/j.tcb.2012.08.004. [DOI] [PubMed] [Google Scholar]
- 60.Valbuena A, Mateu M G. Nanoscale. 2015;7:14953–64. doi: 10.1039/C5NR04023J. [DOI] [PubMed] [Google Scholar]
- 61.Ruiz-Herrero T, Hagan M F. Biophys. J. 2015;108:585–95. doi: 10.1016/j.bpj.2014.12.017. [DOI] [PMC free article] [PubMed] [Google Scholar]
- 62.Baschek J, Klein H C R, Schwarz U S. BMC Biophys. 2012;5:22. doi: 10.1186/2046-1682-5-22. [DOI] [PMC free article] [PubMed] [Google Scholar]
Associated Data
This section collects any data citations, data availability statements, or supplementary materials included in this article.


