Abstract
Miniaturized bio-diagnostic devices have the potential to allow for rapid pathogen screening in clinical patient samples, as a low cost and portable alternative to conventional bench-top equipment. Miniaturization of key bio-diagnostic techniques, such as: nucleic acid detection and quantification, polymerase chain reaction (PCR), DNA fingerprinting, enzyme linked immunosorbent assay (ELISA), results in substantial reduction of reaction volumes (expensive samples/reagents) and shorter reaction times. Droplet microfluidics (DMF) is one of several miniaturized bio-sample handling techniques available for manipulating clinical samples and reagents in microliter (10−6 L) to picoliter (10−12 L) volume regime. Electro-actuation of sample and reagent in the form of droplets in the aforementioned volume regime, using dielectrophoresis (DEP) and/or Electrowetting (EW) are achieved by means of patterned, insulated metal electrodes on one or more substrates. In this work, we have utilized electro-actuation based DMF technology, integrated with suitably tailored resistive micro-heaters and temperature sensors, to achieve chip based real-time, quantitative PCR (qRT-PCR). This qRT-PCR micro-device was utilized to detect and quantify the presence of influenza A and C virus nucleic acids, using in-vitro synthesized viral RNA segments. The experimental analysis of the DMF micro-device confirms its capabilities in qRT-PCR based detection and quantification of pathogen samples, with accuracy levels comparable to established commercial bench-top equipment (PCR efficiency ∼95%). The limit of detection (LOD) of the chip based qRT-PCR technique was estimated to be ∼5 copies of template RNA per PCR reaction.
Influenza viruses, which belong to the family Orthomyxoviridae, are important pathogens of humans and animals.1 Influenza viruses from three different genera are currently circulating in the human population: influenza A, influenza B and influenza C viruses. Of these, influenza A viruses have the greatest impact on the population, in terms of severity of disease and because of their greater capacity to generate new strains through a high rate of mutagenesis causing genetic drift. Influenza A viruses originated from wild aquatic birds whose population contains a very large reservoir of influenza A viruses from which new emerging strains can enter the human population, directly or through another species such as swine. These emerging influenza A viruses can on occasion trigger pandemics, the worst of which, to date, was the 1918 “Spanish Flu” pandemic which was also the worst natural disaster of the 20th century.1 Influenza C is a more benign pathogen than influenza A or B, in term of severity of disease and reported cases; however it is under-diagnosed and underestimated because most clinical laboratories do not test for this agent. Recently ProvLab investigated the importance of this agent in Alberta.2
Testing for influenza viruses is often required for patient care and is of the utmost public health importance. Molecular techniques, such as polymerase chain reaction (PCR),3,4 and immunoassays5 have now become the methods of choice for virus detection in clinical samples. Real time, quantitative, reverse transcription polymerase chain reaction (qRT-PCR), which uses the well-known PCR technique for DNA amplification along with a specific molecular probe that allows for target detection in real time.6 When this technique is brought to bear on RNA targets, such as the genome of influenza viruses, a preliminary step of “reverse transcription” is required to transcribe the RNA segment into a complementary DNA (cDNA) segment. Nowadays, this is almost always done through a “one tube” technique, involving a reaction mixture containing both a reverse transcriptase enzyme and a thermostable DNA polymerase, with the two enzymatic reactions performed serially through temperature control.7
For influenza A testing, ProvLab has adapted an assay designed and implemented by the Centers for Disease Control, as described in,8 and which uses the common methodology of hydrolysis probe for detection.6 For influenza C, the real time RT-PCR method developed at ProvLab,2 was in fact validated to work with either a hydrolysis probe or a beacon probe.6 The beacon probe has the property that it can be used for both real time detection and post amplification detection, which was a useful stepping stone in some preliminary chip based post amplification viral screening experiments, not detailed in this report.9
Miniaturization of nucleic acid amplification based pathogen detection methods promises to reduce the cost of these bio-assays, by utilizing ultra-low volume of samples/reagents (μL to pL) and furthermore enables shorter turnaround time (sample-to-detection time) due to faster reaction kinetics at the miniaturized scale. Such PCR micro-devices can either be implemented using conventional closed channel microfluidic10,11,12 or droplet microfluidic technologies.13–17 Chip based PCR amplification using closed channel microfluidics was first to be explored;10,12,18–20 however, such methods suffer from problems such as: the requirement of valves and micro-tubes for sample loading and fluidic control, bio-adsorption in the exposed microfluidic channels etc. The closed channel microfluidic PCR chips clearly established the potential of chip based PCR technology. Droplet based PCR21,22 has recently emerged as a more popular alternative method for on-chip PCR reactions. In this method, PCR droplets are thermal cycled by either keeping the droplet stationary in a variable temperature control zone (static droplet PCR)22,23 or by moving the droplet continuously between two or more different temperature control zones (transport based droplet PCR).21 The transport based droplet PCR technique is in many ways superior to the static method due to its shorter temperature ramp times, resulting in fast and more efficient chip based PCR reactions.
In this investigation, we have leveraged electro-actuation based Droplet microfluidics (DMF), where electric field effects are utilized for dispensing and subsequent handling of droplets, as the method of choice for handling PCR samples and reagents. The DMF electro-actuation method was preferred due to its precision dispensing, transport and mixing capability of ultrafine PCR reaction volumes over patterned surfaces. The two electro-actuation techniques: Electrostatic/Droplet dielectrophoresis (D-DEP)16,17 and Electrowetting (EW)13,14 have been leveraged through tailored micro-electrode architectures to facilitate the required on-chip droplet manipulation. A different set of micro-electrode pattern was used to create resistive micro-heaters23,24 and resistance temperature detectors (RTDs),24 required during the PCR thermal cycling. A nano-textured super hydrophobic (SH) surface25 was engineered in order to prevent sample adsorption and droplet collapse, during the on-chip qRT-PCR detection. Performance of the integrated DMF device was analyzed in real-time chip based qRT-PCR detection of in-vitro synthesized influenza A and C virus RNAs during 30–35 PCR cycles. The reported work demonstrates the utility of the electro-actuation based qRT-PCR micro-device for detecting and quantifying the presence of viral nucleic acids with a detection threshold (limit of detection) of <5 viral nucleic acid copies per PCR reaction.
Theory
The proposed qRT-PCR micro-device is comprised of, and integrates the key requirement of liquid sample handling and temperature control. The PCR samples/reagents were controlled using tailored microfluidic electrode structures which were energized by low frequency (30–90 Hz), AC voltage (50–120 Vpp), whereas the temperature control was achieved by means of resistive micro-heaters and RTD sensor electrode structures. Here, these two key aspects of the qRT-PCR micro-device are examined and furthermore optimized in order to achieve the required device operation and performance.
Design and optimization of micro-heater electrodes for PCR thermal cycling application
Temperature control is essential for an integrated PCR micro-device since performance of PCR reaction is greatly impacted by the temperature set-points and temperature ramp rates during thermal cycling.7,10 Poor temperature control can result in low PCR efficiency and non-specific probe-target DNA binding and amplification. Methods for chip-based temperature control can be classified as: contact or non-contact. In non-contact temperature control methods,26,27 heating and temperature cycling is achieved by using schemes such as: selective infrared heating,26 laser induced heating27 and thermocouple temperature sensing. Although effective, such methods often require specialized heating equipment (laser sources and other optical components) and additional temperature reference chamber (for accurate temperature measurement), which results in complicated micro-device design and relatively lower degree of integration and miniaturization. Contact temperature control methods can utilize commercial thermo-cycler, Peltier thermoelectric element designs28 to achieve nearly the same thermal conditions as in case of the conventional PCR set-up. More recently, as an alternative, commercial micro-heaters and thermocouples have been integrated with microfluidic platform to create PCR microsystems.28 Though having excellent performances, this micro-device requires manual placement/integration of commercial heaters and thermocouples, to the back side of the microfluidic chip, resulting in reproducibility problems related to their manual placement. As an alternative, micro-heaters and resistance temperature detectors (RTDs) sensors can be micro-fabricated on the same substrate, along with the microfluidic electrodes, to create a more compact PCR micro-device.23,24 These integrated thermal elements improve the overall thermal transfer from the heating element to the PCR chamber and increase the accuracy as well as the reproducibility of the required temperature. Among the contact temperature control methods, the micro-fabricated resistive heaters/RTDs have smaller power requirement, faster thermal response and higher heating ramp rates and are therefore preferred for the proposed qRT-PCR micro-device.
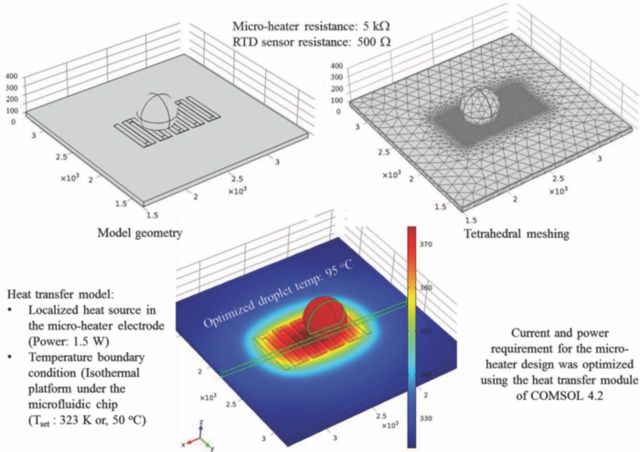
The micro-heater and RTDs were micro-fabricated using thin, patterned electrodes of Chromium. Chromium was selected due to its high resistivity (ρ: 12.9 μΩ−cm), temperature coefficient of resistance (α = 3000 ppm/°C) and its superior adhesion to the substrate of choice (Borofloat Glass). Contact pads and electrical connections were fabricated using Au/Cr layer to minimize their resistive contribution. Size and shape of the micro-heater electrode was optimized using COMSOL Multiphysics software's Heat transfer module (version 4.2). The micro-heater was designed to operate under a ‘constant voltage’ condition which relates the electrical power (P) for the resistive micro-heater as:
| [1] |
In Eqn. 1, ‘L’ and ‘A’ are respectively the total length and cross-sectional area of the micro-heater electrode. Dimensions of the designed micro-heater were optimized to reduce the voltage needed to generate the required thermal zones. The power/energy requirement of the micro-heater was modeled using the fundamental heat transfer expression:
| [2] |
where v is the PCR droplet volume, D is the sample density, Cp is the heat capacity of water (Cp ∼ 4.2 J/g/°C) and dT being the required change in droplet temperature. For a 100% efficient micro-heater, the power requirement can be estimated as: (P = dH/dt). To precisely estimate the power requirement for each thermal zone, the micro-heater design was modeled in COMSOL (v. 4.2), for each thermal zone to maintain the optimum thermal zones during the PCR thermal cycling.
Figure 1 shows the results of the COMSOL simulation for the resistive micro-heater. Serpentine electrode geometry was utilized to increase the L/A ratio and hence the micro-heater resistance which results in lower power consumption and reduced voltage requirement. Interactive meshing (adjustable tetrahedral mesh) was used for simulating the micro-heater as a constant power source. The PCR droplet (10 μL)-to-micro-heater size ratio was also optimized during the COMSOL simulations. Result of the multiphysics simulation for the final, optimized micro-heater design is shown in Figure 1. The multiphysics simulation assisted in adjusting the micro-heater power requirement and accommodating the surface-to droplet body temperature difference in the designed and fabricated micro-devices.
Figure 1.
Model geometry of micro heater design and COMSOL simulation results for optimized micro-heater electrode architecture, showing the steady state thermal profile for the 95°C heating zone.
Thermoresistive effect in thin, patterned metal films was utilized to create the RTD sensors, which were coupled with each micro-heater element to facilitate active monitoring and control of the thermal zones. The RTD sensor resistance is related to a given temperature, given by the following expression.
| [3] |
In the above equation (Eqn. 3), RRTD is the resistance of the RTD sensor at temperature T expressed in terms of degrees Celsius, αRTD is the temperature coefficient of resistance and Ro is the resistance of the metal film measured at the same temperature at which αRTD is valid. Eqn. 3 is a simplified form of the generic Callendar-van Deusen equation,29 and is highly linear in the temperature range of 0°C to 100°C.
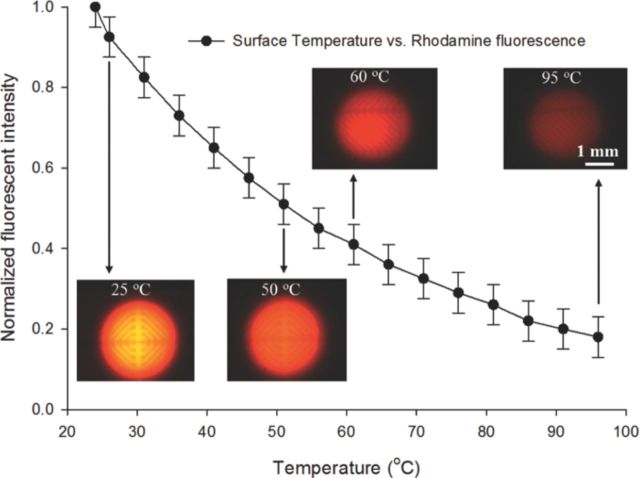
A fluorescence thermometry technique was used for standard calibration of the RTD sensor. This technique is widely used in microfluidic systems, for measuring fluidic body temperature using one-color ratiometric laser induced fluorescence (LIF).30 In this technique, a dilute concentration (0.1 mM) of temperature sensitive ‘Rhodamine B’ dye, which has strong temperature dependent quantum efficiency, was placed in the temperature control zone and its fluorescence signal vs. temperature dependence was captured using a fixed gain photomultiplier tube (PMT). In order to account for set-up based variance during different experiments, the extracted fluorescence signal is normalized with a reference signal at a known temperature (e.g. room temperature, 25°C). By measuring changes in the normalized fluorescent intensity the fluid temperature can then be determined using the standard calibration curve with high spatial and temporal resolution, as illustrated in Figure 2.
Figure 2.
Standard temperature calibration curve for the designed RTD sensor extracted before the chip based qRT-PCR assay.
The standard calibration curve was correlated to the RTD surface temperature measured using an external thermocouple probe for each of the designed and fabricated micro-devices to ensure the correct required temperature in the thermal control zones.
Single surface droplet actuation methodologies for transport, mixing and cycling of PCR samples and reagents
Dispensing, mixing and subsequent manipulations of PCR sample and reagent droplets were achieved using two popular electro-actuation methods, namely Droplet dielectrophoresis (D-DEP)16,17 and/or, Electrowetting (EW).13,14 This section provides a brief overview of the two droplet actuation methodologies.
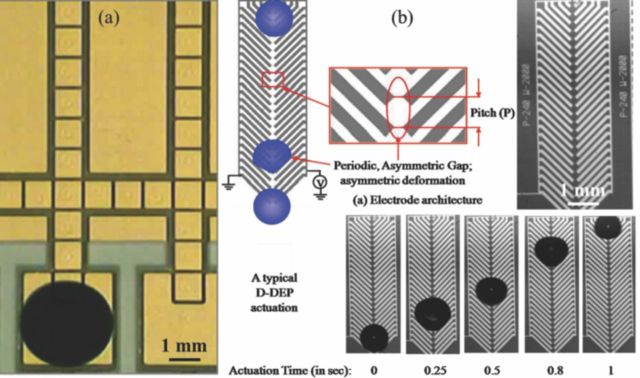
In EW based droplet actuation schemes, passivated metal electrodes patterned on silicon or, glass substrates are energized with external electric field, at low frequency (DC – 1 kHz), to alter the interfacial force equilibrium at the droplet-surface boundary.14 The liquid contact angle (CA) and the shape of the sample droplet is henceforth affected by the change of force equilibrium which, with the assistance of suitably tailored electrode structures, can be utilized to transport individual droplets. Such EW droplet actuation schemes frequently make use of two patterned surfaces, separated by a gap which depends upon the size of droplets to be handled (see Figure 3a).13 In most popular EW electrode architectures, the lower substrate consists of large arrays of co-planer square or rectangular shaped electrodes, which are controlled and switched using inter-digitized, programmable input.13,14 The top surface and the gap are utilized to facilitate a larger droplet deformation, which helps to reduce the droplet actuation voltage. The two surfaces, gap, electrode geometry and dielectric insulation are key components of modern EW based DMF, which can achieve droplet dispensing, mixing/splitting and extensive droplet transport of microliter to nanoliter sample volumes.14 Single surface based EW schemes require relatively higher actuation voltages (>100 Vpp) and/or super hydrophobic surfaces, in order to induce the large contact angle change necessary for such EW droplet actuations.31 EW actuation schemes provide versatile droplet handling capabilities but are often restricted by the sequential, digital actuation, requiring active electrode switching and hence a complex electrode architecture and electrical control/switching system. Droplet transport and mixing/splitting processes are restricted by the droplet volume, viscosity, density and surface tension of the fluidic samples. EW microfluidic devices have found applications in implementing PCR based bio-assays,21 immunoassays32,33 and several other bio-combinatorial assays; however the technology still suffers from lack of parallelism, complex electrode architectures, the necessity for active switching and large electrode capacitances.
Figure 3.
(a) Two surface EW electrode array for droplet manipulation;13 (b) Droplet transport (1 μL, de-ionized water) using a single surface, herring-bone shaped D-DEP electrode structure (pitch: 100 μm; gap: 10 μm).
Dielectrophoresis (DEP) is another electrokinetic effect observed when a dielectric body is placed under the influence of an external, spatially non-uniform electric field.34 In case of dielectric fluidic samples, the DEP electro-actuation method results in generation of pondermotive DEP body force which can be leveraged to create controlled deformation of the fluidic mass toward the regions of higher Electric field intensity. Such DEP fluidic manipulation can be used for rapid, ultrafine droplet dispensing (Liquid-DEP (L-DEP))15,16,35 or, subsequent droplet manipulation (Droplet-DEP or, D-DEP)16,17 by energizing a pair of coplanar metal electrodes, patterned on an insulated substrate, using AC voltage. Attributes of a typical D-DEP electrode structure and the mechanism of the D-DEP droplet actuation are shown in Figure 3b. Both electrodes of the D-DEP electrode pair are shaped as interconnected, unidirectional herring-bone structures usually inclined at 45° angle. When the electrode pair is energized by a low voltage (<100 Vpp) and frequency (30–100 Hz) AC signal, it induces periodic deformations of the droplet which is placed at one end of the D-DEP electrode (see Figure 3b). The herring-bone shape ensures that the electric field induced droplet deformation is unidirectional, causing a net shift in the center of mass (CM) of the droplet. The periodic deformation and droplet oscillation frequency is twice that of the applied AC signal frequency,16,17 hence resulting in transport of the fluidic sample droplets.
Both the aforementioned droplet actuation methods benefit from the presence of a top surface which can help retain a large droplet CA during the entire actuation process. The micro-device reported in this work utilizes a nano-textured superhydrophobic surface,25 which yields a very high droplet CA (∼155°), resulting in a more reliable and efficient handling of PCR sample/reagent droplets, compared to non-textured hydrophobic surfaces.
Materials and Methods
Sample preparation: design of primers and probes.— Real-time RT-PCR assay
Primer and probe sequences from previously reported real-time RT-PCR assays were used for the detection of influenza A36 and influenza C.2 Both assays target the matrix gene and result in the amplification of a 105 base pair product for influenza A and 64 base pair product for influenza C. In this study, we used a modification of our previous influenza A detection protocol that was validated at ProvLab, which consisted of using the TaqMan Fast Virus One-Step RT-PCR Master Mix. This master mix requires a smaller reaction volume (10 μL) and allows for faster thermal cycling. Amplification was performed by one-step RT-PCR using the TaqMan Fast Virus One-Step RT-PCR Master Mix, 0.8 μM each of sense and antisense primers and 0.2 μM of the labeled probe (see Table I). Five μl of in-vitro RNA was combined with 5 μl of the master mix. The reaction parameters are described in Table II.
Table I.
Reagent concentration and volumes used to prepare the RT-PCR reaction mix.
| Working | Sample | Final | |
|---|---|---|---|
| Reagent | Conc. | volume (μl) | Conc. |
| Taqman Fast Virus One-Step RT-PCR MMix | 4× | 2.5 | 1× |
| INFC-M-Forward primer | 20 μM | 0.4 | 0.8 μM |
| INFC-M-Reverse primer | 20 μM | 0.4 | 0.8 μM |
| INFC-M-Probe (FAM) | 10 μM | 0.2 | 0.2 μM |
| PCR Water | N/A | 1.5 | N/A |
| Master Mix Volume | 5.0 |
Table II.
Protocols for the chip based RT-PCR reactions.
| PCR (Cycles 30×) | ||||
|---|---|---|---|---|
| RT | Enzyme | Annealing | ||
| Step | reaction | Activation | Denaturation | (data acquisition) |
| Temperature | 50°C | 95°C | 95°C | 60°C |
| Time | 5 min | 20 sec | 3 sec | 20 sec |
Preparation of RNA transcripts
Primers flanking the detection region were utilized to amplify fragments of the M gene including the region targeted by the primers and probes for the real-time assays from control strains. We used amplicons from Influenza A/Wyoming/03/2003 and Influenza C/Taylor/1233/47. The PCR products were cloned using the TOPO TA Cloning Dual Promoter Kit (Life Technologies, California, USA). The plasmid DNA was linearized using restriction enzymes Hind III and transcribed using the T7 RiboMAXTM Express (Promega, Madison, WI, USA) to synthesize negative-strand RNA in vitro. The transcribed RNA was spectrophotometrically quantified and serial dilutions were utilized for testing.
Device fabrication
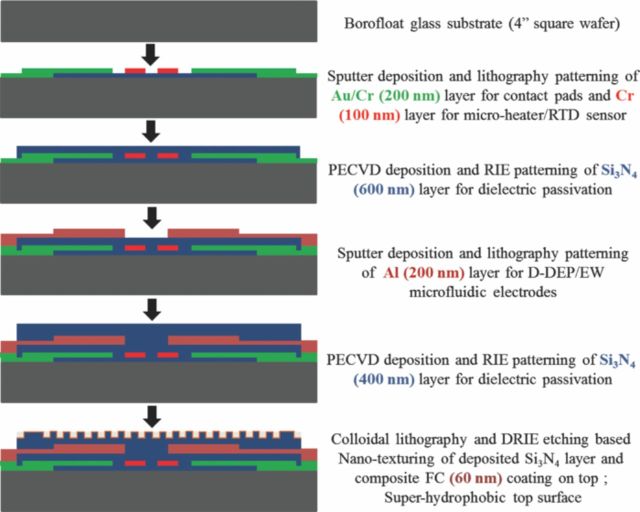
The DMF devices were designed using MEMSPro L-Edit (v. 8.0) and the micro-heater component was optimized using COMSOL Multiphysics (v. 4.2). The optimized integrated microdevices were fabricated at a micro/nano fabrication facility (Nanofab, Edmonton, Canada). The device fabrication procedure is outlined in Figure 4. The qRT-PCR micro-devices were fabricated on a 4′′ Borofloat substrate. It consisted of a pair of patterned metal (Cr) based micro-heater and resistance temperature detectors (RTDs) to create the two temperature control zones required for PCR thermal cycling, patterned gold/chrome overlay as electrical connectors for the resistive heaters/RTD sensors and one or two layers of patterned Aluminum or Au/Cr metallization for DMF electrode structures.
Figure 4.
Schematic flow chart of the micro-fabrication process, implemented to realize the designed qRT-PCR micro-devices.
These metal layers were electrically isolated and passivated using dielectric stacks of silicon nitride (Si3N4), to prevent sample electrolysis. The top nitride layer is furthermore rendered super hydrophobic (SH) using a soft-lithography based nano-texturing technique, as reported in.25 The nano-textured SH surface ensures a high droplet contact angle (CA ∼ 156°) while significantly minimizes the extent of sample adsorption and the resulting loss of CA. Advantage of such SH surfaces for DEP liquid actuation of TAQ DNA polymerase was studied in.25
Experimental set-up and procedure
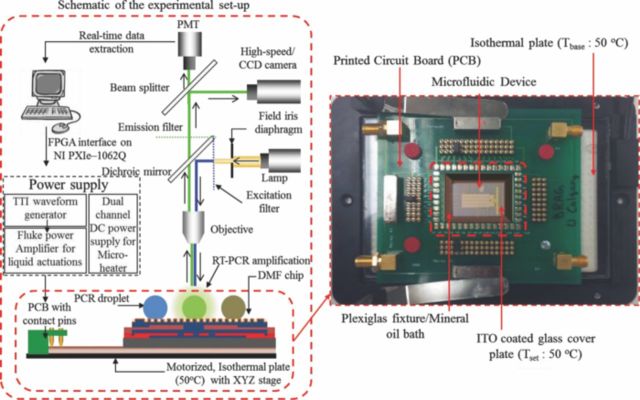
The experimental set-up utilized in this work is illustrated in Figure 5. It is comprised of a NI-PXIe-1062 (National Instruments, USA) system, used to control the microfluidic actuations as well as the on-chip thermal control units (TCUs). An isothermal plate (TOKAIHIT, Japan) is utilized to create and maintain a 50°C base temperature during all operations. Fluorescent Microscope (Olympus BX-51) based optical set-up consists of: suitable excitation/emission filters, a high gain photomultiplier tube (Hamamatsu, Japan), color CCD camera (QImaging, Canada) and a high speed CMOS camera (Canadian Photonics Lab, Canada). The photomultiplier tube (PMT) is operated at a fixed, high gain (×106) for quantification of the fluorescence signal during chip based qRT-PCR assays. The DMF chip was secured on a printed circuit board (PCB), attached to an isothermal plate and mounted onto a motorized XY microscope stage for imaging and data acquisition. The electro-actuation of bio-fluids was accomplished using a waveform generator (TTi, USA) and a precision power amplifier (Fluke, USA) whereas, the TCUs were powered by a dual channel DC power supply (Power Designs Inc., USA).
Figure 5.
Schematic of the experimental set-up and snapshot of the microfluidic chip-PCB assembly.
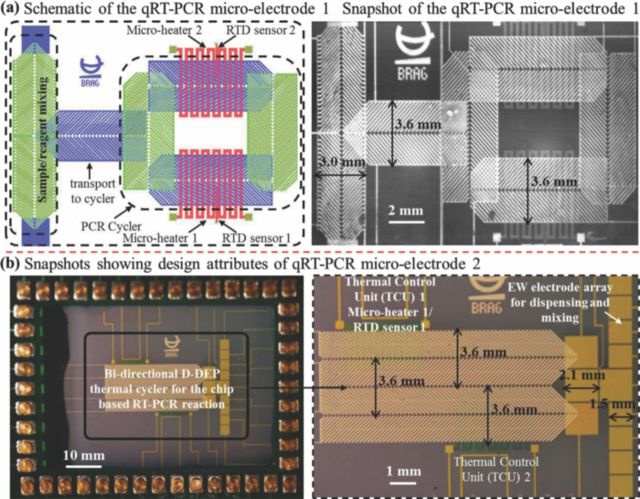
Figure 5 also shows the microchip-PCB assembly on the isothermal plate. In order to minimize evaporation of the PCR sample during the thermal cycling process, the microfluidic chip was immersed in PCR-grade mineral oil (Biomerieux, Canada), encapsulated within a Plexiglas fixture and an ITO coated glass cover, maintained at 50°C during the qRT-PCR reactions. The presence of ITO coated heated top plate, to seal the mineral oil bath, resulted in reducing the evaporative and diffusion based sample volume loss to less than 10% of the reaction volume. The two integrated micro-electrode architectures used for the chip based qRT-PCR reactions are illustrated in Figure 6. The microfluidic component in each structure consists of three sections: 1) dispensing and mixing section where the RNA sample droplet and PCR reagent droplet is mixed; 2) transport section which is maintained at 50°C for the RT-reaction and subsequently transports the PCR droplet onto the thermal cycler section; 3) the on-chip PCR thermal cycler design which has two TCUs (maintained respectively at 65°C and 95°C) and a D-DEP electrode scheme to circulate the droplet between the two TCUs during the course of the qRT-PCR reaction. Micro-electrode 1 solely relies on D-DEP actuation for sample/reagent dispensing to thermo-cycling, with two metalized layers (Al) of herring-bone shaped D-DEP electrodes, separated by ∼300 nm of Si3N4 (see Figure 6a). Micro-electrode 2 consists of single surface EW electrode array (Au/Cr) for dispensing, PCR sample/reagent mixing (electrode gap: 100 μm) and a linear, bi-directional D-DEP electrode scheme (Al) for PCR thermal cycling (Figure 6b). Electrode pitch, gap and width for the mixing (pitch: 250 μm; gap: 50 μm) and transport (pitch: 300 μm; gap: 60 μm) micro-electrodes were optimized for 5μL and 10 μL droplet volumes respectively. Average droplet actuation speeds during the chip based qRT-PCR assays were found to be ∼3 mm/sec.
Figure 6.
(a) Schematic diagram and photomicrograph showing the qRT-PCR micro-electrode 1; (b) Snapshot showing attributes of the qRT-PCR micro-electrode 2.
During the qRT-PCR process, Fluorescence emission from the PCR droplet was captured for each cycle, during the annealing phase (at 60°C in TCU 2 zone), using the PMT based optical set-up. This captured fluorescence signal was plotted in real-time, with respect to cycle number to generate standard PCR curves. A logarithmic plot of the qRT-PCR curve yields a better observation of the very distinct reaction kinetics during the amplification process. Ct (threshold cycle) is defined as the intersection between an amplification curve and a threshold line, placed in the qRT-PCR curves above the signal noise floor. It can be shown to be related to the initial target concentration, in the PCR reaction. The equation below describe the exponential amplification of PCR:
| [4] |
Where, Ni = initial copy number; Nn = copy number at cycle n; n = number of cycles and E = efficiency of target amplification, with theoretical values between 0 and 1. When the reaction efficiency is a maximum (E = 1), the equation reduces to: Nn = Ni (2n) and the target DNA copy count increase by 2-fold at each cycle. The quantity of PCR product generated at each cycle decreases with decreasing efficiency, and the amplification plot is delayed. The measured efficiency (%) for successful and reliable PCR amplification should lie between 90 and 110%.
Results and Discussion
In this section, experimental results obtained using the chip based qRT-PCR assays are reported and analyzed. The micro-device was used to perform qRT-PCR amplification of both influenza A and C virus RNAs, prepared at the ProvLab Calgary. Limit of detection (LOD) of the qRT-PCR assays were determined and the device performance compared to that of the conventional qRT-PCR equipment. All chip-based qRT-PCR reactions reported in this section, unless indicated otherwise, were carried out using a recommended 10 μL PCR reaction volume in order to use the PCR reagent mixture in the same sample-to-reagent ratios, which were optimized for the conventional qRT-PCR set-up.
Chip based amplification and qRT-PCR detection of Influenza C virus
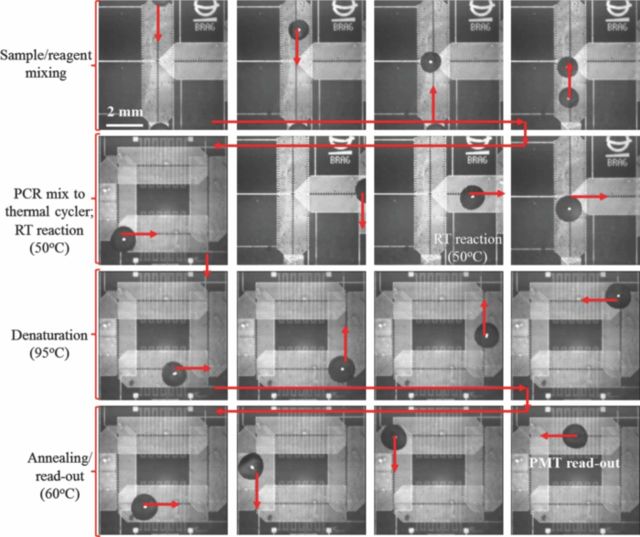
The two qRT-PCR micro-devices were first tested for amplification and detection of in-vitro synthesized RNA segment of the M-gene, of the influenza C virus. Mixing of the influenza C RNA sample and the off-chip prepared PCR reagents, followed by the RT reaction and thermal cycling over Micro-electrode 1, is shown in Figure 7. The first phase of droplet actuation combines the RNA sample droplet with PCR Master Mix. The mixed PCR droplet is then maintained at 50°C for 5 minutes, to complete the RT-reaction (conversion of RNA to c-DNA) (see Figure 7). Once this stage is completed, the PCR droplet (volume: 10 μL) is conveyed onto the thermal cycler electrode, where it is subjected to 30–35 thermal cycles between the desired temperature set-points. In every cycle, fluorescent signal read-out is carried out during the annealing phase, at 60°C (Figure 7). This droplet transport based thermal cycling is carried out in approximately 45 sec per PCR cycle and the entire process (dispensing to qRT-PCR amplification for 30 cycles) is completed within 30–35 minutes. The elapsed qRT-PCR process time for the micro-device is comparable to the conventional, fast qRT-PCR set-up from Applied Biosystems (ABI 7500).
Figure 7.
Snapshots extracted from a PCR droplet actuation video, of the qRT-PCR reaction using micro-electrode 1. PCR droplet actuated using 90 Vpp at 60 Hz AC signal.
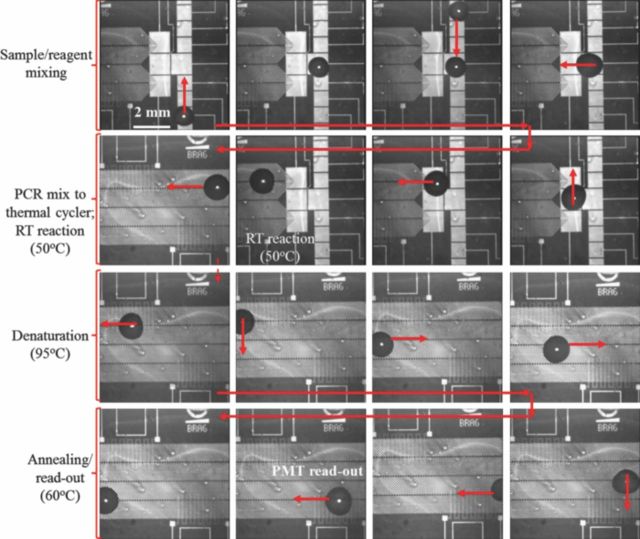
The micro-graphs in Figure 8 illustrate the various reaction stages of chip based qRT-PCR assay, over micro-electrode 2. As reported earlier, this electrode design incorporates single surface EW for mixing of influenza C RNA and the PCR reagent mix (see Figure 8). The mixed PCR droplet (volume: 10 μL) is subsequently transferred onto a linear, bi-direction D-DEP electrode design where it is initially held at 50°C for RT reaction. The droplet is then cycled over the two TCUs maintained at the desired temperatures and PMT read-out is again carried out during the annealing phase (see Figure 8). Each thermal cycle over this electrode design was accomplished in 35 seconds. This results in a complete qRT-PCR assay (30 PCR cycles) within 30 minutes. The quantitative PCR curves extracted for amplification of influenza C virus over micro-electrode 1 structure is reported in Figure 9.
Figure 8.
Snapshots of qRT-PCR droplet actuation over micro-electrode 2. Applied AC signal for droplet actuation: 120 Vpp at 90 Hz for EW and 90 Vpp @ 60 Hz for D-DEP electrodes.
Figure 9.
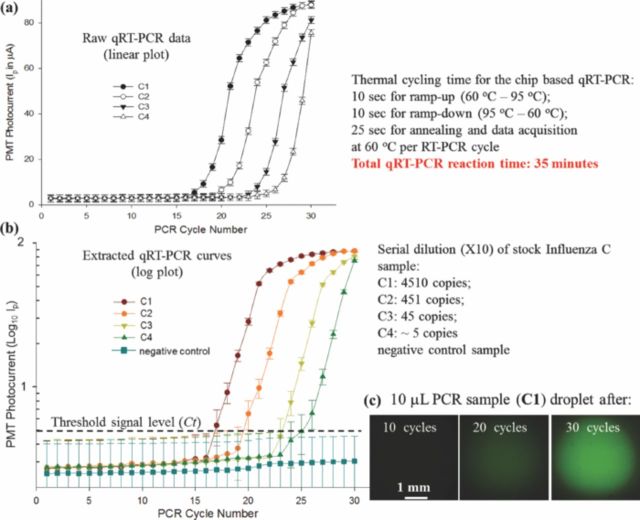
qRT-PCR experimental data for different influenza C RNA samples actuated using micro-electrode 1. (a) Raw PCR data; (b) processed log qRT-PCR curves and (c) fluorescent micro-graphs of PCR droplet during amplification.
The stock influenza C RNA sample (C1: 4510 copies per 5 μL) was sequentially diluted to create four samples with an order of magnitude difference in their RNA concentration. The four samples (C1, C2, C3 and C4) were actuated over micro-electrode 1 and the raw qRT-PCR data was extracted, as shown in Figure 9a–9c. The PMT photocurrent, which is proportional to the fluorescence signal, was used to extract the logarithmic plot of PMT output vs. PCR cycle number (Figure 9b). The threshold signal level was manually placed based on the signal noise levels before the amplification starts. The threshold level was set at the onset of exponential amplification region of the extracted quantitative PCR curves. Ct was then extracted as the PCR cycle number just above the threshold signal level (second cycle in the exponential amplification region). The extracted Ct values, along with the qRT-PCR curves for the four influenza C samples are reported in Figure 9b. The lowest RNA concentration subjected to the chip based qRT-PCR detection was quantified as ∼5 viral RNA copies per PCR reaction. Repeatability and standard quantification of the chip based qRT-PCR is reported in a later section (section 4.3).
Efficiency of the chip based qRT-PCR reaction, extracted using Eqn. 4, was found to be ∼96.5%. The acceptable qRT-PCR efficiency confirms the reliability of the developed micro-device for on-chip qRT-PCR detection assays.
Outcomes of chip based qRT-PCR detection of Influenza A virus
Once the influenza C RNA was successfully detected using the qRT-PCR micro-device, it was used for amplification and detection of in-vitro synthesized M-gene RNA of the influenza A virus. The stock RNA solution (A-1; conc.: 2930 copies per 5 μL) was again sequentially diluted to achieve three orders of magnitude variation in the initial RNA concentration.
The four influenza A RNA samples (A-1, A-2, A-3 and A-4), along with a negative control sample, were actuated utilizing micro-electrode 2. The extracted qRT-PCR curves from two different sets of chip based qRT-PCR reactions are reported in Figure 10a, 10b. In order to confirm the detection of influenza A RNA in the ultra-low concentration sample, A-4, four identical A-4 samples were prepared off-chip and qRT-PCR amplified over different micro-devices. Two out of the four A-4 samples (∼3 copies per PCR volume) were successfully amplified and detected whereas the other two yielded in no detectable amplification over the 35 PCR cycles, as reported in Figure 10b. The 50% sensitivity of detection at the lowest RNA concentration in sample A-4 could be a result of off-chip sample preparation. Efficiency of the qRT-PCR amplification, for each of the four influenza A sample was found to be ∼ 94.4%.
Figure 10.
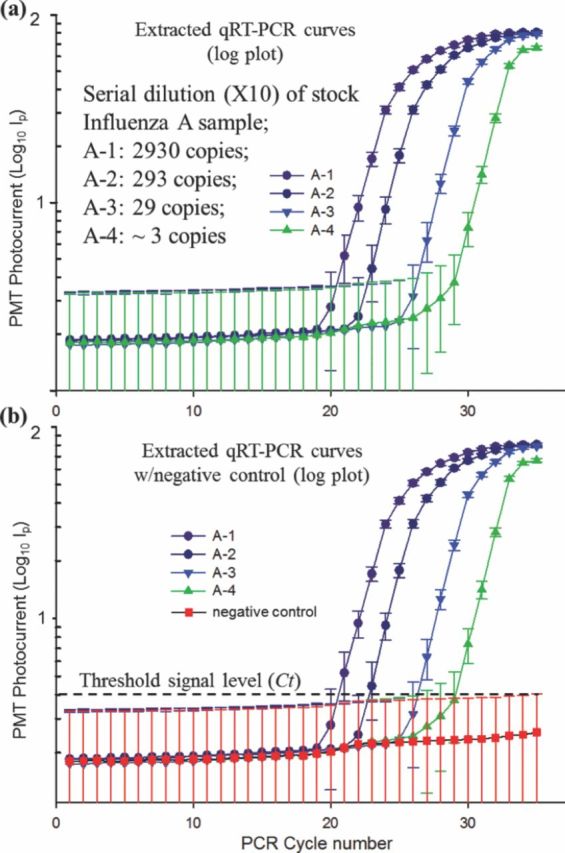
Results of the chip based qRT-PCR amplification and detection of influenza A virus using micro-electrode 2. (a) Extracted log plots of PMT photocurrent vs. PCR cycle number for various sample dilutions and (b) with negative control sample.
Standard, quantitative PCR amplification curves and limit of detection for chip based qRT-PCR assays
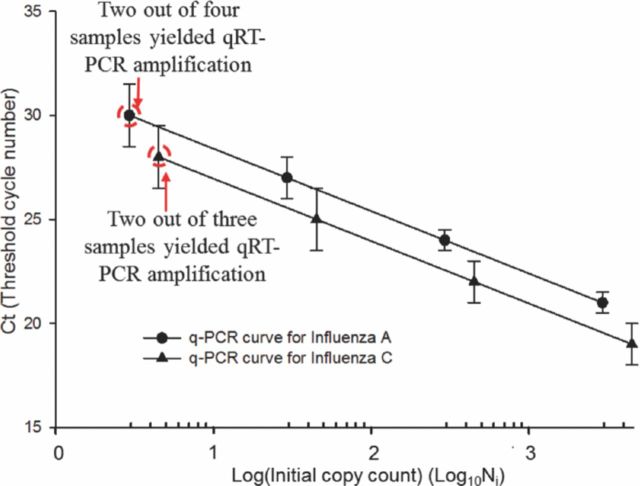
Quantitative PCR exploits the linear relationship between Ct and the logarithm of the number of initial copies Ni of the template, which is predicted from Eqn. 4. Figure 11 illustrates that the data we obtained in our experiments with influenza A and influenza C RNA templates is in conformity with the predicted behavior of the quantitative PCR. From Eqn. 4 the slope m of this linear curve can be shown to be related to the efficiency E as follows:
| [5] |
Figure 11.
Standard quantification curves for chip based qRT-PCR amplification of influenza A and C RNA samples.
The slope was calculated from the experimental data by linear regression and the measured efficiency is then derived from Eqn. 5. For the qRT-PCR data of influenza C, the slope was found to be: −3.4, corresponding to PCR efficiency of 97% whereas for influenza A qRT-PCR experimental data, the slope was estimated to be: −3.46, which corresponds to a PCR efficiency of 95%.
The LOD for the chip based qRT-PCR assay is thus estimated to be ∼ 5 viral RNA copies per PCR reaction although, the authors are aware that at such low sample concentrations, manual sample preparation can influence the detection threshold, as indicated by the <100% detection in repeated RNA samples. A more precise measurement of the LOD could be obtained using a serial, 2-fold dilution from, say, a 100 copy sample; but as a demonstration of principle these experiments establish a performance level comparable to standard PCR methodologies.
Chip based qRT-PCR with reduced PCR droplet volumes
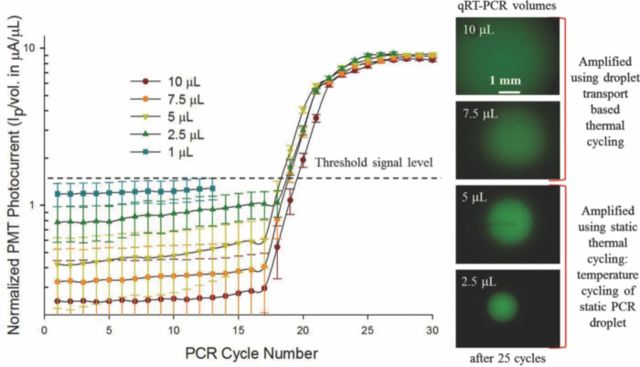
The qRT-PCR experiments reported thus far have all used 10 μL volume PCR droplets to achieve a droplet transport based qRT-PCR reaction. The PCR volume was maintained constant in order to compare micro-device performance with the conventional, off-chip PCR set-up which requires a minimum of 10 μL PCR reaction volume. At this stage of proof-of-concept, it was important to match the sample preparation protocols of the conventional set-up to suitably compare the micro-device performance. However, since one of the promising advantages of leveraging micro-devices for bio-diagnostics is to substantially reduce the required bio-sample/reagent volumes; we investigated on-chip qRT-PCR reactions in PCR droplet volumes of: 1 μL, 2.5 μL, 5 μL, 7.5 μL and 10 μL. Results of this different volume qRT-PCR experiment are reported in Figure 12. The different volume PCR droplets were all pipetted from a 40 μL PCR reaction mix (20 μL influenza C RNA sample + 20 μL PCR Master Mix). The 7.5 μL and 10 μL PCR droplets were successfully actuated over micro-electrodes 1 and 2 respectively to achieve transport based PCR reaction. However, due to the fact that the two micro-electrode structures were tailored for PCR volumes close to 10 μL, PCR droplets <5 μL were subjected to a static PCR thermal cycling, where they were positioned in one of the two TCUs and the thermal zone was cycled between the two temperature limits of 60°C and 95°C. Cycle time for static qRT-PCR was observed to be 2.5 times larger than that of transport based PCR assay. As a result of the slower ramp rates, the PCR droplet is exposed in the high temperature region (between 80°C – 95°C) for a larger amount of time, per cycle during the entire qRT-PCR reaction. This coupled with the smaller droplet volumes, resulted in change in the PCR efficiency for the smaller 2.5 μL PCR droplet (see Figure 12). Furthermore, the 1 μL PCR droplet did not show any amplification and suffered from significant volume loss (∼25% of sample volume was lost during the first 10 cycles). The PCR efficiency for the 7.5 μL and 10 μL PCR droplets was close to ∼95%; whereas the efficiencies of the 5 μL and 2.5 μL PCR were found to be ∼90% and 78% respectively. The calculated PCR efficiency values indicate that the transport based chip qRT-PCR is superior to the static PCR method. The poor performance of PCR in the smaller reaction volumes can henceforth be attributed to the fact that the current experimental set-up and the micro-electrode structures were tailored to handle larger PCR droplets (close to 10 μL); however, this exercise does demonstrate the possibility of reducing the PCR reaction volumes to microliter or sub-microliter PCR droplets. Although from the view-point of clinical pathogen detection, the possible reduction of PCR droplet volumes is not a significant improvement since the point of emphasis for such applications is to lower the detection threshold which may often require sampling larger sample volumes for the qRT-PCR detection assays.
Figure 12.
Outcomes of the chip based qRT-PCR assays using different PCR droplet volumes and images of the amplified PCR droplets of various volumes.
Conclusions
This article demonstrates the design and micro-fabrication of integrated droplet microfluidic device, with nano-textured superhydrophobic top surface, that is capable of electro-handling of PCR samples/reagents, facilitating chip based mixing/sample preparation and chip based qRT-PCR amplification and detection of influenza viruses. It illustrates micro-electrode designs which offer integration of micro-heater/RTD sensor based TCUs, with DEP/EW based miniaturized droplet handling technology, on a single substrate, for achieving the on-chip qRT-PCR assays. The on-chip TCUs were simulated using COMSOL v4.2 and calibrated using Rhodamine B dye. Results of the on-chip qRT-PCR amplification and real-time detection of influenza A and C viruses are furthermore analyzed to establish standard quantitative PCR curves, which help establish the satisfactory PCR efficiencies for the micro-device. Limit of detection (LOD) for the qRT-PCR micro-device, based on the targeted detection of influenza A and C viruses, is estimated to be ∼5 copies per PCR reaction. The success of the micro-device, in carrying out different volume qRT-PCR reactions, suggests the potential for further reduction of the required PCR sample and reagent volumes. The current micro-electrode designs restrict the chip usability to one PCR per chip however; work is currently underway toward developing multiplexed qRT-PCR micro-devices, which can simultaneously accommodate eight or more qRT-PCR reactions per chip. Such multiplexed qRT-PCR chips are better suited for clinical experimentation, where numerous repeated testing of known and unknown viral samples is required in order to provide robust pathogenic bio-diagnostics.
Acknowledgments
The authors are grateful for the financial support received from National Science and Engineering Research Council of Canada (NSERC) under the Discovery grant program, microfabrication financial support provided by CMC Microsystems, Canada. The authors are also thankful to the Provincial Laboratory for Public Health of Alberta in providing the PCR samples and reagents.
References
- 1.Wright P. F., Neumann G., Kawaoka Y. In: Orthomyxoviruses. Fields Virology. 6th ed Knipe D. M., Howley P. M., editors. Lippincott Williams & Wilkins; Philadelphia: 2013. : Chapter 41, , [Google Scholar]
- 2.Pabbaraju K., Wong S., Wong A., May-Hadford J., Tellier R., Fonseca K. Influenza Other Resp Viruses. 2013;7(6):954. doi: 10.1111/irv.12099. ( ) [DOI] [PMC free article] [PubMed] [Google Scholar]
- 3.Mullis K., Faloona F., Scharf S., Saiki R., Horn G., Erlich H. Cold Spring Harb Symp Quant Biol. 1986;51(1):263. doi: 10.1101/SQB.1986.051.01.032. ( ) [DOI] [PubMed] [Google Scholar]
- 4.Saiki R. K., Gelfand D. H., Stoffel S., Scharf S. J., Higuchi R., Horn G. T., Mullis K. B., Erlich H. A. Science. 1988;239:488. doi: 10.1126/science.2448875. [DOI] [PubMed] [Google Scholar]
- 5.Betts Carpenter A. Manual of Clinical Microbiology. 10th ed. ASM Press; Washington DC: 2011. Immunoassays for the Diagnosis of Infectious Diseases p. pp 60-72. . Chapter 5: [Google Scholar]
- 6.Wittmer C. T., Kusukawa N. In: Real-time PCR and melting analysis, Molecular Microbiology Diagnostic Principles and Practice. 2nd ed. Persing D. H., editor. ASM Press; Washington: 2011. : Chapter 4, [Google Scholar]
- 7.Datta V., Hayden R. T. In vitro nucleic acid amplification techniques. In: Persing D. H., editor. Molecular Microbiology Diagnostic Principles and Practice. 2nd ed. ASM Press; Washington: 2011. : Chapter 3, [Google Scholar]
- 8.Pabbaraju K., Wong S., Lee B., Tellier R., Fonseca K., Louie M., Drews S. J. Influenza Other Resp Viruses. 2011;5(2):99. doi: 10.1111/j.1750-2659.2010.00170.x. ( ) [DOI] [PMC free article] [PubMed] [Google Scholar]
- 9.Prakash R., Kaler K. V. I. S., Papageorgiou D. P., Papathanasiou A. G., Tellier R. Proc. 8th International meeting on Electrowetting; 2012. Athens. [Google Scholar]
- 10.Lagally E. T., Emrich C. A., Mathies R. A. Lab Chip. 2001;1-2:102. doi: 10.1039/b109031n. [DOI] [PubMed] [Google Scholar]
- 11.Erill I., Campoy S., Erill N., Barbe J., Aguilo J. Sens. Act. B: Chem. 2003;96(3):685. doi: 10.1016/S0925-4005(03)00522-7. ( ) [DOI] [Google Scholar]
- 12.Mathies R. A., Lagally E. T. J. Phys. D: Appl. Phys. 2004;37:R245. doi: 10.1088/0022-3727/37/23/R01. [DOI] [Google Scholar]
- 13.Pollack M. G., Shenderov A. D., Fair R. B. Lab Chip. 2002;2(2):96. doi: 10.1039/b110474h. ( ) [DOI] [PubMed] [Google Scholar]
- 14.Mugele F., Baret J. C. J. Phys.: Condens. Matter. 2005;17:R705. doi: 10.1088/0953-8984/17/28/R01. [DOI] [Google Scholar]
- 15.Jones T. B. J. Electrostatics. 2001;51:290. doi: 10.1016/S0304-3886(01)00074-2. [DOI] [Google Scholar]
- 16.Kaler K. V. I. S., Prakash R., Chugh D. Biomicrofluidics. 2010;4(2):022805. doi: 10.1063/1.3411003. ( ) [DOI] [PMC free article] [PubMed] [Google Scholar]
- 17.Gunji M., Nakanishi H., Washizu M. Proceedings of Micro Total Analysis Systems. 2004;1:168. [Google Scholar]
- 18.Hashimoto M., Chen P. C., Mitchell M. W., Nikitopoulos D. E., Soper S. A., Murphy M. C. Lab Chip. 2004;4:638. doi: 10.1039/b406860b. [DOI] [PubMed] [Google Scholar]
- 19.Lagally et. al. E. T. J. Anal. Chem. 2004;76:3162. doi: 10.1021/ac035310p. [DOI] [PubMed] [Google Scholar]
- 20.Liu R. H., Yang J. N., Lenigk R., Bonanno J., Grodzinski P. J. Anal. Chem. 2004;76(7):1824. doi: 10.1021/ac0353029. ( ) [DOI] [PubMed] [Google Scholar]
- 21.Pollack M. G., Shenderov A. D., Fair R. B. Proc. TAS 2003. California, USA: 2003. μ. , [Google Scholar]
- 22.Tewhey et. al. R. Nature Biotechnology. 2009;27:1025. doi: 10.1038/nbt.1583. [DOI] [PMC free article] [PubMed] [Google Scholar]
- 23.Lagally E. T., Simpson P. C., Mathies R. A. Sensors and Actuators B. 2006;63(3):138. doi: 10.1016/S0925-4005(00)00350-6. ( ) [DOI] [Google Scholar]
- 24.Zhong R., Pan X., Jiang L., Dai Z., Qin J., Lin B. Electrophoresis. 2009;30:1297. doi: 10.1002/elps.200800491. [DOI] [PubMed] [Google Scholar]
- 25.Prakash R., Papageorgiou D. P., Papathanasiou A. G., Kaler K. V. I. S. Sensors and Actuators B: Chemical. 2013;182:351. doi: 10.1016/j.snb.2013.03.024. [DOI] [Google Scholar]
- 26.Roper M. G., Easley C. J., Legendre L. A., Humphrey J. A., Landers J. P. Anal. Chem. 2007;79(4):1294. doi: 10.1021/ac0613277. ( ) [DOI] [PubMed] [Google Scholar]
- 27.Kim H., Dixit S., Green C. J., Faris G. W. Opt. Express. 2009;17(1):218. doi: 10.1364/OE.17.000218. ( ) [DOI] [PMC free article] [PubMed] [Google Scholar]
- 28.Khandurina J., McKnight T. E., Jacobson S. C., Waters L. C., Foote R. S., Ramsey J. M. Anal. Chem. 2000;72:2995. doi: 10.1021/ac991471a. [DOI] [PubMed] [Google Scholar]
- 29.McGee T. D. Principles and Methods of Temperature Measurement. John Wiley & Sons; New York: 1988. ISBN: 978-0-471-62767-8. [Google Scholar]
- 30.Glawdel T., Almutairi Z., Wang S., Ren C. Lab Chip. 2009;9(1):171. doi: 10.1039/b805172k. ( ) [DOI] [PubMed] [Google Scholar]
- 31.Heikenfeld J., Dhindsa M. Journal of Adhesion Science and Technology. 2008;22:319. doi: 10.1163/156856108X295347. [DOI] [Google Scholar]
- 32.Miller E. M., Ng A. H. C., Uddayasankar U., Wheeler A. R. Anal. Bioanal. Chem. 2011;399:337. doi: 10.1007/s00216-010-4368-2. [DOI] [PubMed] [Google Scholar]
- 33.Sivagnanam et. al. V. J. Anal. Chem. 2009;81:6509. doi: 10.1021/ac9009319. [DOI] [PubMed] [Google Scholar]
- 34.Pohl H. A. J. Appl. Phys. 1958;29(8):1182. doi: 10.1063/1.1723398. ( ) [DOI] [Google Scholar]
- 35.Jones T. B., Gunji M., Washizu M., Feldman M. J. J. Appl. Phys. 2001;89(3):1. ( ) [Google Scholar]
- 36.Dawood F. S., Finelli L., Shaw et. al. M. W. N. Engl. J. Med. 2009;360:2605. doi: 10.1056/NEJMoa0903810. [DOI] [PubMed] [Google Scholar]


