Abstract
X-ray luminescence computed tomography (XLCT) is an emerging hybrid molecular imaging modality and has shown great promises in overcoming the strong optical scattering in deep tissues. Though the narrow x-ray beam based XLCT imaging has been demonstrated to obtain high spatial resolution at depth, it suffers from a relatively long measurement time, hindering its practical applications. Recently, we have designed a focused x-ray beam based XLCT imaging system and have successfully performed imaging in about 7.5 seconds per section for a mouse sized object. However, its high spatial resolution capacity has not been fully implemented yet. In this paper, with a superfine focused x-ray beam we design a focused-x-ray luminescence tomography (FXLT) system for spatial resolution up to 94 μm. First, we have described our design in details. Then, we estimate the performance of the designed FXLT imaging system. Lastly, we have found that the spatial resolution of FXLT can be further improved by reducing the scan step size, which has been demonstrated by numerical simulations.
Keywords: x-ray luminescence computed tomography, optical imaging, x-ray imaging, optical tomography, tomographic imaging
1. Introduction
Several groups, including our own, have explored the concept of x-ray luminescence computed tomography (XLCT) imaging (1-5). Using a collimator to generate a fine x-ray pencil beam, XLCT could reconstruct two targets with an edge-to-edge distance of 0.4 mm in 5 mm deep optical scattering media (6). Without an x-ray collimator, conical x-ray beam based XLCT achieved a location accuracy about 1.5 mm (1). For “superficial” targets, XLCT can reach a spatial resolution of about 0.1 mm as demonstrated through numerical simulations (5). XLCT has also been proven to recover the nanophosphor concentration linearly (7). In addition, Zhang et al. have used multiple pinholes to speed up the XLCT imaging time and have also found that the radiation dose of XLCT is in a typical range of a CT scan (8). Recently, Lun et al. have demonstrated that XLCT was able to reconstruct a 21 mm deep target with a phosphor concentration of 0.01 mg/mL or 27 μM with a collimated x-ray beam scan scheme (9). The molecular sensitivity can be improved dramatically if we applied a focused x-ray beam based XLCT because the focused x-ray beam has three orders of magnitude higher photon density than a collimated x-ray beam (10). Furthermore, Zhang et al. have also proven that the spatial resolution of XLCT is about double the size of the x-ray beam diameter (11). Cong et al. have proposed the concept to use a dual-cone geometry of a focused x-ray beam to achieve high spatial resolution XLCT imaging and validated their idea with numerical simulations (12). However, until now, there is no reported XLCT imaging systems able to explore high spatial resolution imaging of up to 150 micrometers for x-ray excitable nanophosphors in deep tissues. In this study, we plan to build an XLCT imaging system, in which we use a superfine focused x-ray beam to achieve a spatial resolution of 94 micrometers for deep targets.
There are two types of XLCT imaging systems in terms of the excitation beam geometries. One is the conical x-ray beam based XLCT imaging (1, 13), in which a conical x-ray beam excites the whole mouse body at once. This approach can image the mouse in a very short time but the spatial resolution is compromised because there is no structural guidance from the x-ray beam in the XLCT reconstruction. Another is the pencil beam based XLCT imaging system (2, 5), in which a pencil beam x-ray is used to scan the object sequentially. The pencil beam approach generally requires a long measurement time (typically up to 1 hour) but can achieve sub-millimeter spatial resolution by using the pencil beam size and position as structural guidance in the XLCT image reconstruction. To obtain the high spatial resolution imaging for deep targets, we have focused on the superfine x-ray beam based XLCT imaging (11). Recently, we have found that the spatial resolution of FXLT can be improved further by reducing the scanning step size (14). Here, we have summarized the results briefly.
The rest of the paper is organized as follows. In Section 2, we present the design of the FXLT imaging system and the numerical simulation setup. In Section 3, we present the numerical simulation results. Lastly in Section 4, we discuss our results and conclude the paper.
2. Methods
2.1. System Design
2.1.1. Schematic of FXLT imaging system
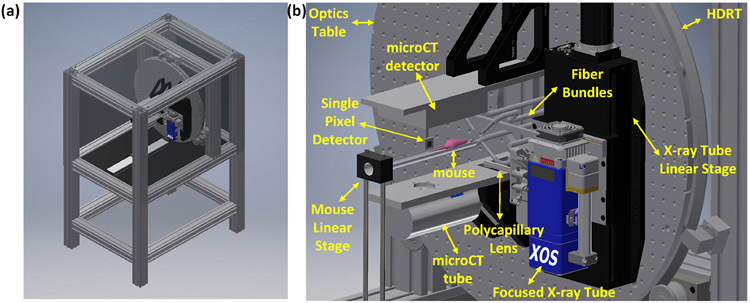
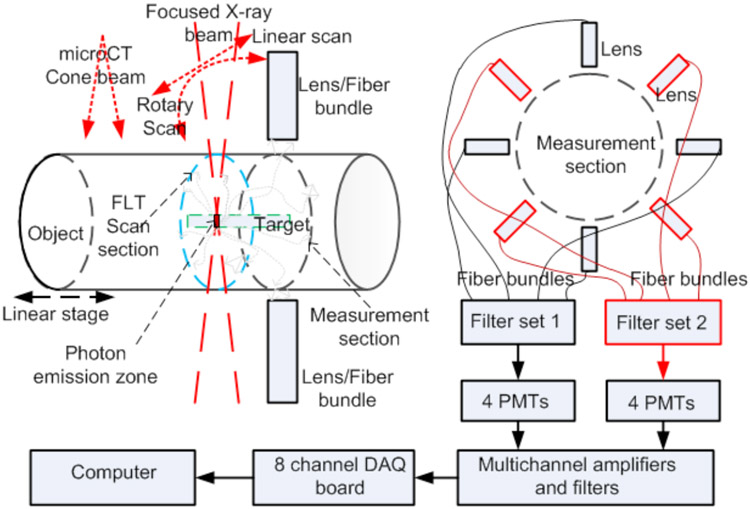
Fig. 1 shows the CAD model of the proposed FXLT imaging system. The frame of the imaging system will be constructed from T-slotted aluminum bars. We use an x-ray tube with a polycapillary lens (XOS fleX-Beam, East Greenbush, NY) to focus the x-ray beam to a focal diameter of 55 micrometers. The x-ray tube with the polycapillary lens is mounted on a linear stage (NLS8, Newmark Systems Inc.) that is fixed to an optics table that is mounted onto a heavy duty ring track (HDRT). For each rotary angle, the linear stage will move in total about 3 centimeters so that the focused x-ray beam will scan a single transverse section of the mice in less than 15 seconds per angular projection. The rotary frame is a HDRT from HepcoMotion (Devon, England), which has central bore diameter of 650 mm. The inside of the HDRT has been machined with MOD 4 teeth and is driven by a pinion connected to a powerful servo motor (ClearPath Integrated Servo Motor, Teknic) for acquiring measurements at different angular projections. A mouse to be imaged is placed on a transparent and thin stage that is mounted onto a motorized linear stage. The focused x-ray beam scans the mouse linearly for a specified number of angular projections. The angular projection number is flexible with a typical projection number of 6. At the opposite side of the mice, a single pixel x-ray detector is used to measure the transmitted x-ray photon intensity to monitor the focused x-ray. The single pixel x-ray sensor is fixed on a U-shape frame mounted on the x-ray tube’s linear stage so that the x-ray detector moves together with the x-ray tube. An array of 4 fiber bundles is mounted circularly around the mouse and is fixed two millimeters away from the focused x-ray beam. The emitted luminescence photons on the mice body surface are collected by the 4 fiber bundles and delivered to an array of four photomultiplier tubes (PMTs) as shown in Fig. 2. The PMTs work in a single photon counting mode. Two sets of optical bandpass filters following 4 PMTs are used to measure the emission photons at two different wavelengths simultaneously. At each wavelength, we have two measurement points for each linear scan step. The electrical signals from the PMTs will be amplified, filtered and then collected by a data acquisition (DAQ) board, which will be controlled by a computer.
Figure 1.
(a) Right front view and (b) zoomed in view of the CAD model of the proposed FXLT imaging system. Note that the shielding on right and top side of (a) have been made transparent and the door has also been removed for viewing purposes.
Figure 2.
Scan scheme and 8 PMTs as optical photon detectors to measure photons at two different wavelengths simultaneously.
As shown in Fig. 1, an x-ray tube (XTF5011, Oxford Instruments, 50 kVp and 1 mA) and a flat panel x-ray detector (Shad-o-Box 1K HS, Teledyne Dalsa) are mounted for microCT imaging of the imaged object. Before FXLT imaging, the linear stage places the object in the field of view (FOV) of the microCT that will take measurements at 360 angular projections with an angular step size of 1 degree. After the microCT scan, the linear stage moves the object to the FOV of the FXLT. A filtered back-projection with a Shepp-Logan filter will be used to reconstruct the microCT images.
The FXLT imaging system, except the PMT arrays, amplifiers, filters, and computer is placed on an optics tables inside a custom made x-ray shielding and light tight cabinet made from the steel frame. The FXLT’s x-ray tube is air-cooled. The heat from the x-ray tube will warm up the cabinet. At the same time, we will design a heating system to blow warm air around the mice stage to keep its temperature around the normal mice body temperature. We will also install a water cooling system with a heat radiator inside the cabinet and design a temperature control system to warm up the stage if the temperature is low and to turn on the water cooling system if the temperature is too high.
2.1.2. Cone beam with a small beam angle
In this study, we use a high power x-ray tube (Mo-anode) that is coupled with a polycapillary focusing lens optimized for Mo Kα radiation (X-Beam, XOS, East Greenbush, NY). The maximum operating parameters are 50 kV and 1.0 mA or 50 W. The x-ray unit itself has a built-in cooling fan. Fig. 3 plots the approximate arrangement of the polycapillary optic lens. The distance from X-beam’s window to its focus spot is 45 mm. The optic enclosure diameter is 10 mm. The output focal spot is less than 50 μm at Mo Kα (17.4 keV). The beam size is less than 75 micrometers in a range up to 10 mm around the focal spot. The beam convergence angle is less than 2 degrees, which will be included in the reconstruction algorithm. The output intensity at 50 W is greater than 2×10⁷ photons/sec. The flux intensity is estimated to be approximately 100 times larger than that of a collimator based x-ray beam.
Figure 3.
Schematic of x-ray tube with a polycapillary optic lens. The convergence angle θ is less than 2 degrees.
2.1.3. PMT arrays as photon detectors
We use 8 photosensor modules with PMTs (H7422P-50, Hamamatsu) as the photon detectors to measure the emitted optical photons from the mice surface delivered by fiber bundles. Each module comes with a C-Mount adaptor, a heatsink, and a power supply. The efficient cooling reduces thermal noise from the photocathode and a high SNR is obtained even at extremely low light levels. The H7422-50 is sensitive along a wide spectral range from 380 nm to 890 nm. Thus, the measurement time will be reduced dramatically compared the reported EMCCD camera based measurements. The output signals from the 8 photosensor modules are connected to a data acquisition board.
2.1.4. Linear scan and angular projections of FXLT
Our design allows us to have flexibility on the number of angular projections. For the FXLT images, our simulation results have shown that measurements at 6 angular projections are sufficient to reconstruct complex XLCT images as described in the following sections. For each angular projection, we will have a continuous scan for one linear scan in 3 seconds. Thus, the total scan time for each transverse section depends on the angular projection number. For a typical angular projection number of 6, we need less than 1 minute for each transverse section scan if including the rotation time.
2.2. FXLT reconstruction models
For each scanned section, we will calculate the sensitivity matrix at first from the known measurement locations. Then, we will interpolate the finite element mesh with a dense grid. The pixel size of the grid will be 25 μm × 25 μm. For each linear scan, we will find the superfine x-ray beam regions. Lastly, the system matrix will be calculated. The detailed steps are described in reference (15).
It is worth noting that the spatial resolution of the FXLT imaging system does not depend on the tissue optical properties. The optical properties will affect the imaged quantity. We can find the absorption coefficients and the reduced scattering coefficients of different tissues in mice from reference (16). The x-ray attenuation coefficient of tissues can be found in (4).
The proposed FXLT is a type of tomographic imaging, in which the reconstruction algorithms play a critical role. Especially, for sparse targets, the sparsity enhancement reconstruction algorithms such as L1 and Lq regularizations could reconstruct the images with reduced number of measurements that lead to less measurement time and a lower level of x-ray dose. The experimental data will be reconstructed with different regularizations and preconditioners. The reconstructed results will be compared. The best algorithms will be selected to further tune the experimental system design.
We have described the XLCT reconstruction algorithm using the x-ray pencil beam priors as in (15). Following similar modeling, we will develop the algorithms for FXLT as:
| (1) |
where A is the system matrix, b is the measurements, and λ · R(x) is the regularization term. The x-ray beam position and size information are included in the system matrix A as described in reference (15). We propose to compare the effects of different regularization methods as well as the effects of different preconditioning methods so that the best images can be reconstructed. We will solve Eq. 1 under a uniform optimization transfer framework. We follow the separable quadratic surrogate routine (17) to construct the surrogate function for the data-misfitting term. Regularizations are typically employed to counteract the ill-conditioning of A and suppress noises. We propose to compare the effects of different regularization methods as described in reference (18).
2.3. FXLT numerical simulations
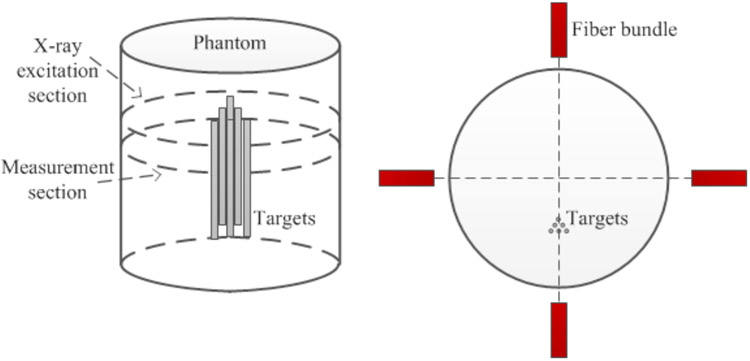
To validate the feasibility of our designed FXLT imaging system, we have performed two sets of numerical simulations. For both simulation studies, we generated a cylindrical background phantom of 12 mm in diameter and 20 mm in height. The background phantom had an absorption coefficient (μa) of 0.0072 mm1 and a reduced scattering coefficient μs`) of 0.72 mm−1 to mimic the optical properties of mice tissue. Inside the background phantom we placed six cylindrical targets of 1.0 mg/mL GOS:Eu3+ concentration as shown in Fig. 4. The 15 mm long targets each had diameters of 75 μm and were placed such that each target has an edge-to-edge distance of 75 μm. During the simulated scan, the emitted luminescent photons were collected by 4 detectors (fiber-PMT set-ups) that were positioned 2 mm below the scanned transverse section. We only performed scanning and reconstruction of a single transverse section of the phantom and targets which were discretized with a 2D grid having a pixel size of 10 μm × 10 μm.
Figure 4.
Phantom geometry and target positions for numerical simulations. Fiber bundles indicate the measurement locations.
In the first numerical simulation, we simulated the scanning scheme of the proposed FXLT imaging system and included the dual-cone geometry of the focused x-ray beam as well as x-ray attenuation and scattering (of 17.5 keV x-ray photons) in the forward model and reconstruction algorithm. For all simulation cases, we used a single dual-cone x-ray beam to scan the phantom at the depth of 5 mm from the phantom top surface and collected the emitted optical photons using 4 fiber-PMT set-ups surrounding the phantom 2 mm below the scanned section (each spaced 90° apart). In first numerical simulation, we incorporated as closely as we can, the actual dual-cone x-ray beam geometry provided by the manufacture (XOS, East Greenbush, NY) for our designed FXLT system as given below in Table 1. However, due to the constraints of our 2D grid, we round the focal spot to 50 μm in diameter and only incorporate the beam changes at ±2 mm (60 μm) as well as ±4 mm (70 μm). We placed the x-ray beam focal spot such that it would scan the center of our phantom during the FXLT scan. For this simulation study, we performed FXLT scans of different angular projections (3, 6, and 9) with angular step sizes of 60, 30, and 20 degrees respectively to determine the effect of different projection numbers on the spatial resolution. In addition, a second set of numerical simulations was performed to determine the effects of the x-ray beam size on the spatial resolution. In this case, we doubled the x-ray beam diameters used in the first simulation.
Table 1.
Manufacture provided table of the output x-ray beam size.
| Distance from the focus | At Focus (25 mm OFD) |
±1mm | ±2mm | ±3mm | ±4mm | ±5mm | ±10mm |
|---|---|---|---|---|---|---|---|
| Output beam size at 17.5 keV (μm, FWHM) | 55 | 57 | 60 | 65 | 70 | 78 | 135 |
2.4. FXLT numerical simulations with the reduced scanning step size
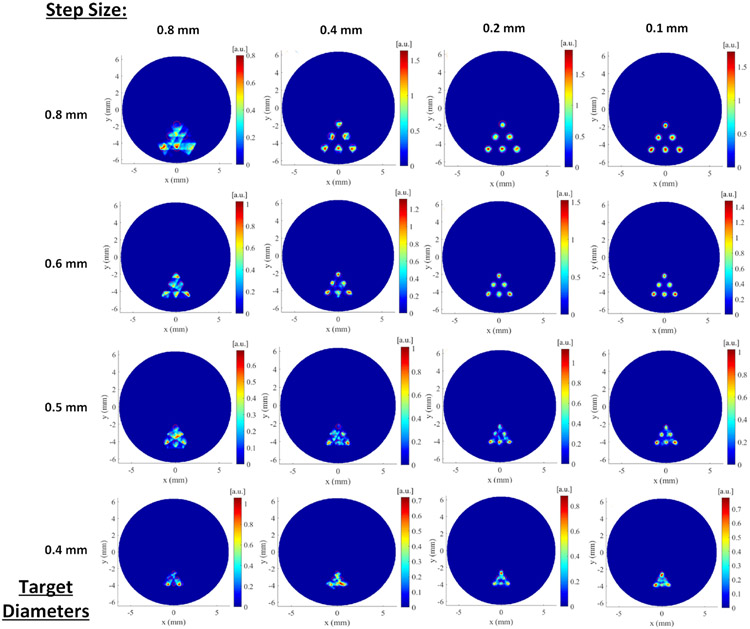
Recently, we have found that the spatial resolution of FXLT imaging can be further improved by reducing the scanning step size. All the details of this method have been reported in (14). Here, we briefly describe a set of numerical simulations to demonstrate the efficacy of our proposed method. The phantom geometry and the target location are similar to those described in Fig. 4 except that we used a cylindrical phantom with a diameter of 12.8 mm. We have also used a straight, cylindrical x-ray beam with an x-ray beam diameter of 0.8 mm. As shown in Fig. 4, we have 6 targets with the same diameter and the same edge-to-edge distance. We have changed the target diameter and edge-to-edge distance from 0.8 mm to 0.4 mm with an interval of 0.1 mm. And for each target size, we have performed FXLT simulations with different scanning step size from 0.8 mm to 0.4 mm. In this set of simulation, we also had four measurement fiber bundles as shown in Fig. 4.
3. Results
3.1. Effect of projection number and beam size on spatial resolution
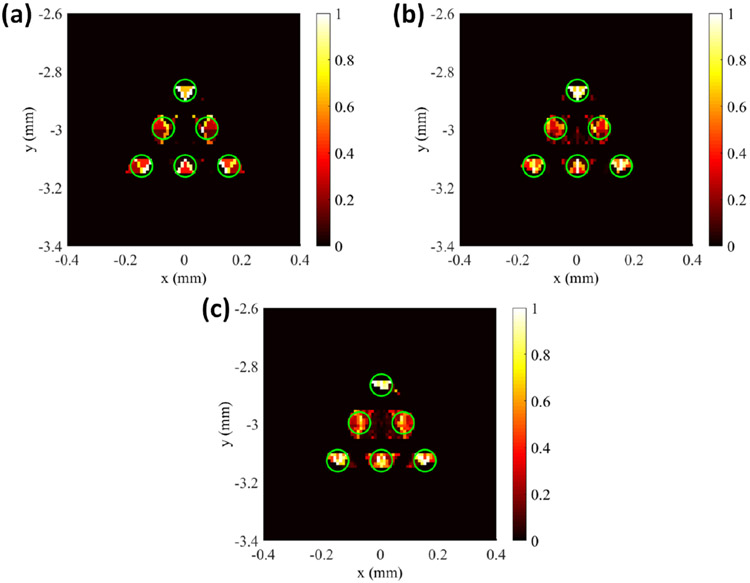
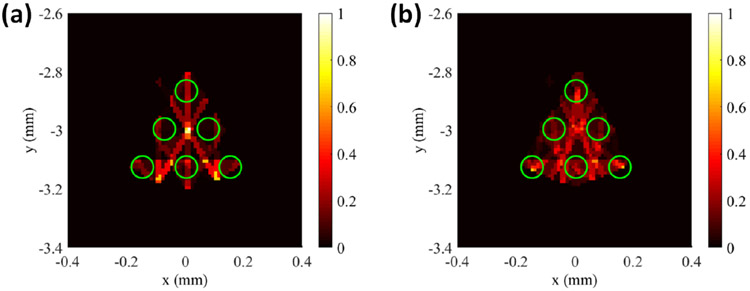
For the image reconstruction, the system matrix generated by the forward model was interpolated to the fine 2D grid. During reconstruction, the L1 regularization method was applied in the Majorization-Minimization reconstruction framework to reconstruct the images. Fig. 5 below shows the results of the numerical simulations of different angular projections of the proposed FXLT imaging system from which we can see the six targets have been successfully reconstructed and can be separated for all cases. The green circles in the figure represent the true target locations. We calculated the DICE similarity coefficients for each of the reconstructed cases and for each projection number of 3, 6, and 9 projections, the corresponding DICE was calculated using the full width ten percent maximum (FW10%M) to be 35.2490, 46.0967, and 49.3333 % respectively. In addition, the size of each of the two targets in the middle row was also calculated using the FW10%M and the results shown in Table 2. It should be noted that with our numerical simulation setup, it is impossible to obtain a perfect target size (0.075 mm) since our grid is only 10 μm in size. Our results indicate that we can perform FXLT scans with as little as 3 angular projections and that we can improve the spatial resolution and imaging quality using more angular projections if required with the proposed imaging system.
Figure 5.
Results of numerical simulation determining the effects of projection number on spatial resolution. The green circle represents the true target regions. Reconstructed images at (a) 3 Projections, (b) 6 Projections, and (c) 9 Projections.
Table 2.
Calculated target sizes for different angular projections.
| # Angular Projections | Left Target Size (mm) | Right Target Size (mm) |
|---|---|---|
| 3 | 0.060 | 0.060 |
| 6 | 0.060 | 0.070 |
| 9 | 0.080 | 0.080 |
The second set of numerical simulations performed was to investigate the effects of the x-ray beam size on the imaging quality and spatial resolution of the proposed FXLT imaging system. This simulation was set-up exactly the same as the previous simulation, except that the x-ray beam diameter used was twice the size. In this set-up we used an x-ray focal diameter of 100 μm and set the x-ray beam diameter to be 120 μm at ±2 mm away from the focal spot and 140 μm at ±4 mm away from focal spot. For this simulation, we performed scans using both 6 and 9 angular projections using angular step sizes of 30 and 20 degrees respectively. The results of the numerical simulation are shown above in Fig. 6. It can be seen that even at 9 angular projections, the targets cannot be resolved successfully. For the angular projections used (6 and 9), the corresponding DICE for the middle row targets were calculated to be 9.780 and 22.6138 % respectively. Compared to the earlier results in Figs. 5(b, c), the image quality is heavily degraded by using a larger x-ray beam and the targets cannot be resolved. These results are consistent with our previous findings in reference (18) where we found that the spatial resolution of XLCT is about double the size of the x-ray beam diameter used. It is worth noting that we used a scanning step size of 100 μm, which is the same as the x-ray beam size. In the section below, the image quality is improved when a smaller scanning step size is used.
Figure 6.
Results of numerical simulation of the effect of beam size. Reconstructed images using (a) 6 Projections and (b) 9 Projections. FXLT reconstruction failed when the beam size is large.
3.2. Effects of the scanning step size on FXLT imaging
The reconstructed FXLT images are plotted in Fig. 7 where each row indicates the results with the same target diameter and the same edge-to-edge distance as indicated by the left most number. Each column of Fig. 7 plots the reconstructed FXLT images for the same scanning step size with different target diameters. The scanning step size is indicated on the top of each column. From Fig. 7, we see the reconstructed XLCT image quality has improved substantially when the scanning step size is reduced. In particular, for the case with a scanning step size of 0.1 mm and a target diameter of 0.4 mm, as shown by the figure in the fourth row and the rightmost column, all the six targets have been barely reconstructed although the scanning beam size is 0.8 mm. This indicated that the spatial resolution of FXLT could achieve the size of the x-ray beam, two times better than the previously reported results.
Figure 7.
Results of numerical simulation of the effect of the scanning beam size. Each column represents a different step size while each row represents a different set of target diameters.
4. Discussion and Conclusions
We have designed a FXLT imaging system using a focused beam x-ray tube with a beam size of 75 μm, hoping to achieve a spatial resolution of 150 μm. Recently, we have found that the spatial resolution of FXLT can be improved further by reducing the scanning step size as shown by our numerical simulations. Thus, we expect the designed FXLT imaging system may achieve a spatial resolution of 94 μm with 1.6 times improvement by using a scanning step size of 18.5 μm which is a quarter of the beam size as suggested by our recent paper (14).
In summary, we have designed a focused x-ray beam based XLCT imaging system and will build the imaging system in the coming year. We have estimated the spatial resolution of the designed imaging system by three sets of numerical simulations. We expect to achieve a spatial resolution of 94 μm with the super fine focused x-ray beam by using a reduced scanning step size. We hope that the planned FXLT imaging system will become a potentially powerful tool for the molecular imaging community.
Acknowledgments
This study is partially funded by R01EB026646 from the National Institutes of Health.
References
- [1].Liu X, Liao QM, Wang HK. In vivo x-ray luminescence tomographic imaging with single-view data. Optics Letters. 2013;38(22):4530–3. [DOI] [PubMed] [Google Scholar]
- [2].Li C, Di K, Bec J, Cherry SR. X-ray luminescence optical tomography imaging: experimental studies. Optics Letters. 2013;38(13):2339–41. [DOI] [PMC free article] [PubMed] [Google Scholar]
- [3].Badea CT, Stanton IN, Johnston SM, Johnson GA, Therien MJ. Investigations on x-ray luminescence CT for small animal imaging. Proc Spie. 2012;8313. [DOI] [PMC free article] [PubMed] [Google Scholar]
- [4].Cong WX, Shen HO, Wang G. Spectrally resolving and scattering-compensated x-ray luminescence/fluorescence computed tomography. J Biomed Opt. 2011;16(6). [DOI] [PMC free article] [PubMed] [Google Scholar]
- [5].Pratx G, Carpenter CM, Sun C, Xing L. X-ray luminescence computed tomography via selective excitation: a feasibility study. IEEE Trans Med Imaging. 2010;29(12):1992–9. [DOI] [PubMed] [Google Scholar]
- [6].Zhang W, Zhu D, Zhang K, Li C. Microscopic x-ray luminescence computed tomography. SPIE BiOS. 2015;93160M:93160M–6. [Google Scholar]
- [7].Carpenter CM, Sun C, Pratx G, Rao R, Xing L. Hybrid x-ray/optical luminescence imaging: Characterization of experimental conditions. Med Phys. 2010;37(8):4011–8. [DOI] [PMC free article] [PubMed] [Google Scholar]
- [8].Zhang W, Zhu D, Lun M, Li CQ. Multiple pinhole collimator based x-ray luminescence computed tomography. Biomed Opt Express. 2016;7(7):2506–23. [DOI] [PMC free article] [PubMed] [Google Scholar]
- [9].Lun MC, Zhang W, Li CQ. Sensitivity study of x-ray luminescence computed tomography. Applied Optics. 2017;56(11):3010–9. [DOI] [PMC free article] [PubMed] [Google Scholar]
- [10].Zhang W, Lun MC, Nguyen A, and Li C, “A focused x-ray beam based x-ray luminescence computed tomography,” J. of Biomed. Opt. 22 (11), 116004 (2017). [DOI] [PMC free article] [PubMed] [Google Scholar]
- [11].Zhang W, Zhu D, Lun M, Li CQ. Collimated superfine x-ray beam based x-ray luminescence computed tomography. Journal of x-ray science and technology. 2017;25(6):945–957. [DOI] [PMC free article] [PubMed] [Google Scholar]
- [12].Cong WX, Pan ZW, Filkins R, Srivastava A, Ishaque N, Stefanov P, Wang G. X-ray micromodulated luminescence tomography in dual-cone geometry. J Biomed Opt. 2014;19(7). [DOI] [PMC free article] [PubMed] [Google Scholar]
- [13].Zhang GL, Liu F, Liu J, Luo JW, Xie YQ, Bai J, Xing L. Cone Beam x-ray Luminescence Computed Tomography Based on Bayesian Method. Ieee T Med Imaging. 2017;36(1):225–35. [DOI] [PMC free article] [PubMed] [Google Scholar]
- [14].Zhang Y, Lun MC, Li C, and Zhou Z, “A method for improving the spatial resolution of narrow x-ray beam based x-ray luminescence computed tomography (XLCT) imaging,” J. of Biomed. Opt, In Review. [DOI] [PMC free article] [PubMed] [Google Scholar]
- [15].Li C, Martinez-Davalos A, Cherry SR. Numerical simulation of x-ray luminescence optical tomography for smallanimal imaging. J Biomed Opt. 2014;19(4):46002. [DOI] [PMC free article] [PubMed] [Google Scholar]
- [16].Alexandrakis G, Rannou FR, Chatziioannou AF. Effect of optical property estimation accuracy on tomographic bioluminescence imaging: simulation of a combined optical-PET (OPET) system. Physics in Medicine and Biology. 2006;51(8):2045–53. [DOI] [PMC free article] [PubMed] [Google Scholar]
- [17].Erdogan H, Fessler JA. Ordered subsets algorithms for transmission tomography. Physics in Medicine and Biology. 1999;44(11):2835–51. [DOI] [PubMed] [Google Scholar]
- [18].Zhu DW, Li CQ. Nonuniform update for sparse target recovery in fluorescence molecular tomography accelerated by ordered subsets. Biomed Opt Express. 2014;5(12):4249–59. [DOI] [PMC free article] [PubMed] [Google Scholar]


