

Abstract
Introduction:
The ankle-brachial index (ABI) is the most common test to diagnose peripheral artery disease (PAD). In dialysis patients, the ABI may under-diagnose PAD, due to a high prevalence of concomitant medial arterial calcification (MAC). The toe-brachial index (TBI) is not as susceptible to misclassification by MAC. Taking the ABI and TBI together in the form of their difference, the ABI-TBI, may provide a single measure for assessing both atherosclerosis and calcification. The relationship of these variables in dialysis patients has not been well studied.
Methods:
We identified 37 dialysis patients referred for vascular studies between 2009 and 2017 in the San Diego Veterans Administration Medical Center (SDVAMC). The ABI and TBI were performed systematically for each patient, and TBI was performed regardless of ABI or waveform. We examined associations between ABI, TBI, and the difference between them (ABI-TBI) with all-cause mortality and major adverse limb events (MALE), which includes revascularizations and amputations.
Findings:
The mean age was 65 years and 30% were African American. All patients were men, reflecting the Veterans Administration population. There were 26 deaths during follow-up and mortality was highest in patients who had low ABI and low TBI and least in those with high ABI and high TBI. Persons with TBI < 0.7 had an increased risk of all-cause mortality. The ABI-TBI, and the ABI itself, were not significantly associated with all-cause mortality although the patterns were similar.
Discussion:
Although ABI may be an important initial risk stratification tool, the TBI may be a more informative predictor of mortality in dialysis patients. Strengths of this study include a high rate of MALE and deaths. The TBI, and the difference between ABI and TBI, should be studied further in a larger cohort of persons with advanced kidney disease.
Keywords: Peripheral artery disease, ankle-brachial index, toe-brachial index, difference of ABI and TBI, dialysis, amputation
INTRODUCTION
A low ankle-brachial index (ABI) is the most common tool to diagnose peripheral artery disease (PAD) in the general population.1 However, in dialysis patients, the use of the clinical cut-off of ABI < 0.9 to identify PAD may underdiagnose PAD, due to a high prevalence of concomitant medial arterial calcification (MAC) and PAD in the lower extremities.2 MAC causes stiff and incompressible arteries, resulting in elevated ABI measurements and decreased sensitivity of the clinical cut-off of ABI < 0.9.3 The under-diagnosis of PAD in dialysis patients is especially concerning given that limb loss due to PAD is extremely common in this population, has a significant impact on quality of life, and is a recognized risk factor for mortality.4 The problem of under-diagnosed concomitant PAD and MAC in dialysis patients is even more concerning because MAC, once considered to be clinically insignificant, is now seen as itself an important independent predictor of all-cause and cardiovascular disease (CVD) mortality.5 Early recognition of the presence of PAD and MAC in this population could help identify those who are at highest risk of limb loss and mortality.
An alternative to the ABI is the toe-brachial index (TBI). The TBI, defined as the ratio of the systolic pressure in the great toe to the brachial artery, may be more sensitive in patients with MAC because smaller, more distal arteries have been shown to not be as vulnerable to MAC.6,7 In light of this finding, the American Diabetic Association8 and the American Heart Association9 have recommended measuring the TBI in patients with ABI > 1.4. Because of these recommendations, in most settings, TBI is only measured if ABI is greater than 1.4, meaning that limited TBI data are available on patients with putatively normal ABI. To the best of our knowledge, there are no studies measuring TBI in dialysis patients in routine clinical care.
It may be that in the dialysis population, the ABI and TBI can yield additional information when used jointly in the form of the ABI minus TBI, the differential of the two measurements (ABI-TBI). We hypothesized that a higher ABI-TBI may be indicative of both MAC and PAD in dialysis patients. Therefore, the ABI-TBI, in comparison to either ABI or TBI alone, might be more associated with various cardiovascular risk factors such as age and diabetes, as well as all-cause mortality and major adverse limb events (MALE; defined as lower limb amputations or revascularizations).
At the San Diego Veterans Administration Medical Center (SDVAMC) vascular laboratory, it is standard practice to measure TBI in all patients, regardless of ABI or waveforms. We thus had the opportunity to examine both ABI and TBI in dialysis patients referred for vascular studies, to determine the utility of each measure individually as well as the ABI-TBI.
MATERIALS AND METHODS
Population
We reviewed the charts of all patients receiving dialysis (hemodialysis or peritoneal dialysis) at the SDVAMC from 2009 to 2017. We identified those patients who had been referred to the vascular laboratory of SDVAMC because of clinically suspected PAD. We included all patients who had complete ABI and TBI measures performed while they were receiving chronic dialysis or within 6 months of starting dialysis therapy.
Exposure variables
All ABI and TBI readings were measured in the SDVAMC vascular laboratory. A standard protocol for obtaining ABI and TBIs used at the SDVAMC vascular laboratory has been described previously in detail.10,11 In brief, with the patient in the supine position and using the Unetixs Multi-Lab Series II LHS peripheral vascular diagnostic system, systolic blood pressures in the posterior tibial and dorsalis pedis arteries were obtained using handheld doppler probes and appropriately sized cuffs, while pressures in both big toes were obtained using photoplethysmography sensors embedded in the toe cuffs. Of the pressures of the arteries of the ankle, the highest pressure was used. If the patient had a fistula, the brachial pressures were measured on the arm without the fistula. If both arms were available, the ABI and TBI were calculated using the higher of the brachial systolic pressures because of the strong correlation between subclavian stenosis and PAD.12
For ABI-TBI analyses, the ABI-TBI was calculated from the leg which gave the highest difference between the ABI and TBI, because we hypothesized that the higher ABI-TBI may be more strongly associated with atherosclerosis and MAC. For the analyses using ABI and TBI as primary markers, the lower of the TBI and ABI measurements from the legs were used, because the lower measurements are generally used as the clinical indication for PAD and are most relevant for prognostication of clinical outcomes.13
Outcomes
Our primary endpoint was all-cause mortality, and our secondary endpoint was MALE, defined as the occurrence of either revascularization or amputation in the lower limbs. All-cause mortality and date of death were determined from review of the VA-computerized medical record, which included deaths that occurred at out-side hospitals. Chart review was conducted to record dates and types of lower-limb revascularizations and amputation procedures done after the ABI and TBI measurements.
Covariates
Covariates were recorded from chart review and included age, sex, ethnicity, smoking status (categorized as current or quit/never), diabetes, use of insulin, dry weight (defined as weight measured post-dialysis session, in kg), dialysis vintage (length of time on dialysis, in years), and past medical history of myocardial infarction (MI), coronary artery bypass grafting (CABG), percutaneous coronary intervention (PCI), stroke or transient ischemic attack (TIA), revascularization, and amputation.
Statistical analysis
Because there are no prior data on the reference range for ABI-TBI, we chose to stratify the ABI-TBI at the median value. We compared differences in demographics and risk factors for CVD stratified by ABI-TBI using unpaired T tests for continuous normally distributed variables (age and dialysis vintage), Mann-Whitney U tests for skewed continuous variables (ABI, TBI, and dry weight) and χ2 tests for categorical variables.
We constructed a scatterplot of patients’ ABI vs. TBI to examine the association of ABI-TBI with mortality across low/high groups and used the χ2 test to compare differences across the groups. We also created receiver operating characteristic curves to determine optimal ABI-TBI cut points associated with mortality and MALE and reported c statistics associated with the curves. We then constructed Kaplan-Meier survival and MALE-free survival curves comparing the two groups split by median ABI-TBI. We also evaluated ABI and TBI as exposure variables because the relationships of ABI and TBI with all-cause mortality and MALE are not clearly defined in the dialysis population. To this end, we constructed Kaplan-Meier survival and time to MALE curves comparing groups split by the clinical cut-points of ABI = 0.9 and TBI = 0.7.14
We then used Cox proportional hazard models to evaluate the associations of ABI-TBI, ABI, and TBI, respectively, with survival. The initial models were unadjusted. The reference groups were ABI-TBI < median ABI-TBI (0.46), ABI ≥ 0.9 and TBI ≥ 0.7, respectively. We only adjusted for age as the relatively small sample and number of events limited the stability of models adjusted for other factors.
A p < 0.05 was considered statistically significant for all analyses. All analyses were computed using R version 3.4.1 (R Foundation for Statistical Computing, Vienna, Austria).15
Ethics
The original study protocol was approved by the SDVAMC Institutional Review Board (IRB) as a retrospective chart review under Project #H120081.
RESULTS
Of 281 patients who received chronic outpatient dialysis at the San Diego Veterans Administration Medical Center between 2009 and 2017, ABI and TBI measurements were clinically available for 37 patients. The mean age of this cohort was 65 ± 8 (range 49–89) years. All were men, 19 (51%) were Caucasian, and 11 (30%) were African American; 28 (76%) patients had diabetes. The mean dialysis vintage was 2.9 ± 3.8 years; 13 (35%) patients were current smokers and 18 (49%) had past medical history of adverse cardiovascular events (MI, CABG, PCI, stroke or TIA); 11 (30%) had past medical history of MALE (revascularizations or amputations). The median follow-up was 2.0 (1.0–3.4) years, and 70% of participants died during follow-up.
Baseline characteristics of the patients stratified by median ABI-TBI = 0.46 are shown in Table 1. Compared to patients with ABI-TBI < 0.46, patients with ABI-TBI ≥ 0.46 were more likely to have diabetes, have higher ABI, and lower TBI measurements. There were no significant differences in age, race, smoking, vintage length, dry weight, previous cardiovascular events, or previous MALE.
Table 1.
Baseline characteristics stratified by median ABI-TBI
| Characteristicsa | ABI-TBI < 0.46b n = 18 (49%) | ABI-TBI > = 0.46b n = 19 (51%) | P-value |
|---|---|---|---|
| Age, years | 66 ± 10 | 65 ± 7 | 0.68 |
| Caucasian | 9 (50%) | 10 (53%) | 0.87 |
| Female | 0 (0%) | 0 (0%) | NA |
| Diabetes | 11 (61%) | 17 (89%) | < 0.05 |
| Current smoker | 6 (33%) | 7 (37%) | 0.82 |
| Dry weight, kg | 84 ± 20 | 94 ± 25 | 0.20 |
| Vintage length, years | 2.9 ± 3.8 | 3.0 ± 4.0 | 0.99 |
| Previous cardiovascular event | 6 (33%) | 12 (63%) | 0.07 |
| Previous MI | 4 (22%) | 4 (21%) | 0.93 |
| Previous CABG | 2 (11%) | 6 (32%) | 0.13 |
| Previous PCI | 3 (17%) | 3 (16%) | 0.94 |
| Previous stroke or TIA | 3 (17%) | 6 (32%) | 0.29 |
| Previous MALE | 5 (28%) | 6 (32%) | 0.80 |
| Previous revascularization | 3 (17%) | 5 (26%) | 0.69 |
| Previous amputation | 3 (17%) | 2 (11%) | 0.66 |
| ABI | 1.12 (0.79–1.22) | 1.20 (1.10–1.33) | < 0.01 |
| TBI | 0.74 (0.38–0.95) | 0.49 (0.39–0.65) | < 0.01 |
MI = myocardial infarction, CABG = coronary artery bypass graft, PCI = percutaneous coronary intervention, TIA = transient ischemic attack, MALE = major adverse limb event, ABI = ankle brachial index, TBI = toe brachial index
Categorical data are presented as number (%) and continuous data as mean ± standard deviation or median (25–75th percentile).
Represents the median ABI-TBI for this cohort.
The median ABI in these patients was 1.11 (IQR: 0.83–1.23), and 20 (54%) of patients were within the normal range of 0.9 ≤ ABI < 1.30. The median TBI was 0.54 (IQR: 0.36–0.81) and the median ABI-TBI was 0.46 (IQR: 0.32–0.66).
There were 26 deaths (70.2%) during the follow-up period. Mortality was highest in patients who had both ABI < 0.9 and TBI < 0.7 (91%; 10/11), while those with ABI ≥ 0.9 and TBI < 0.7 had 77% (10/13) mortality, and those with ABI ≥ 0.9 and TBI ≥ 0.7 had a mortality rate of 46% (6/13) (p = 0.046) (Figure 1).
Figure 1.
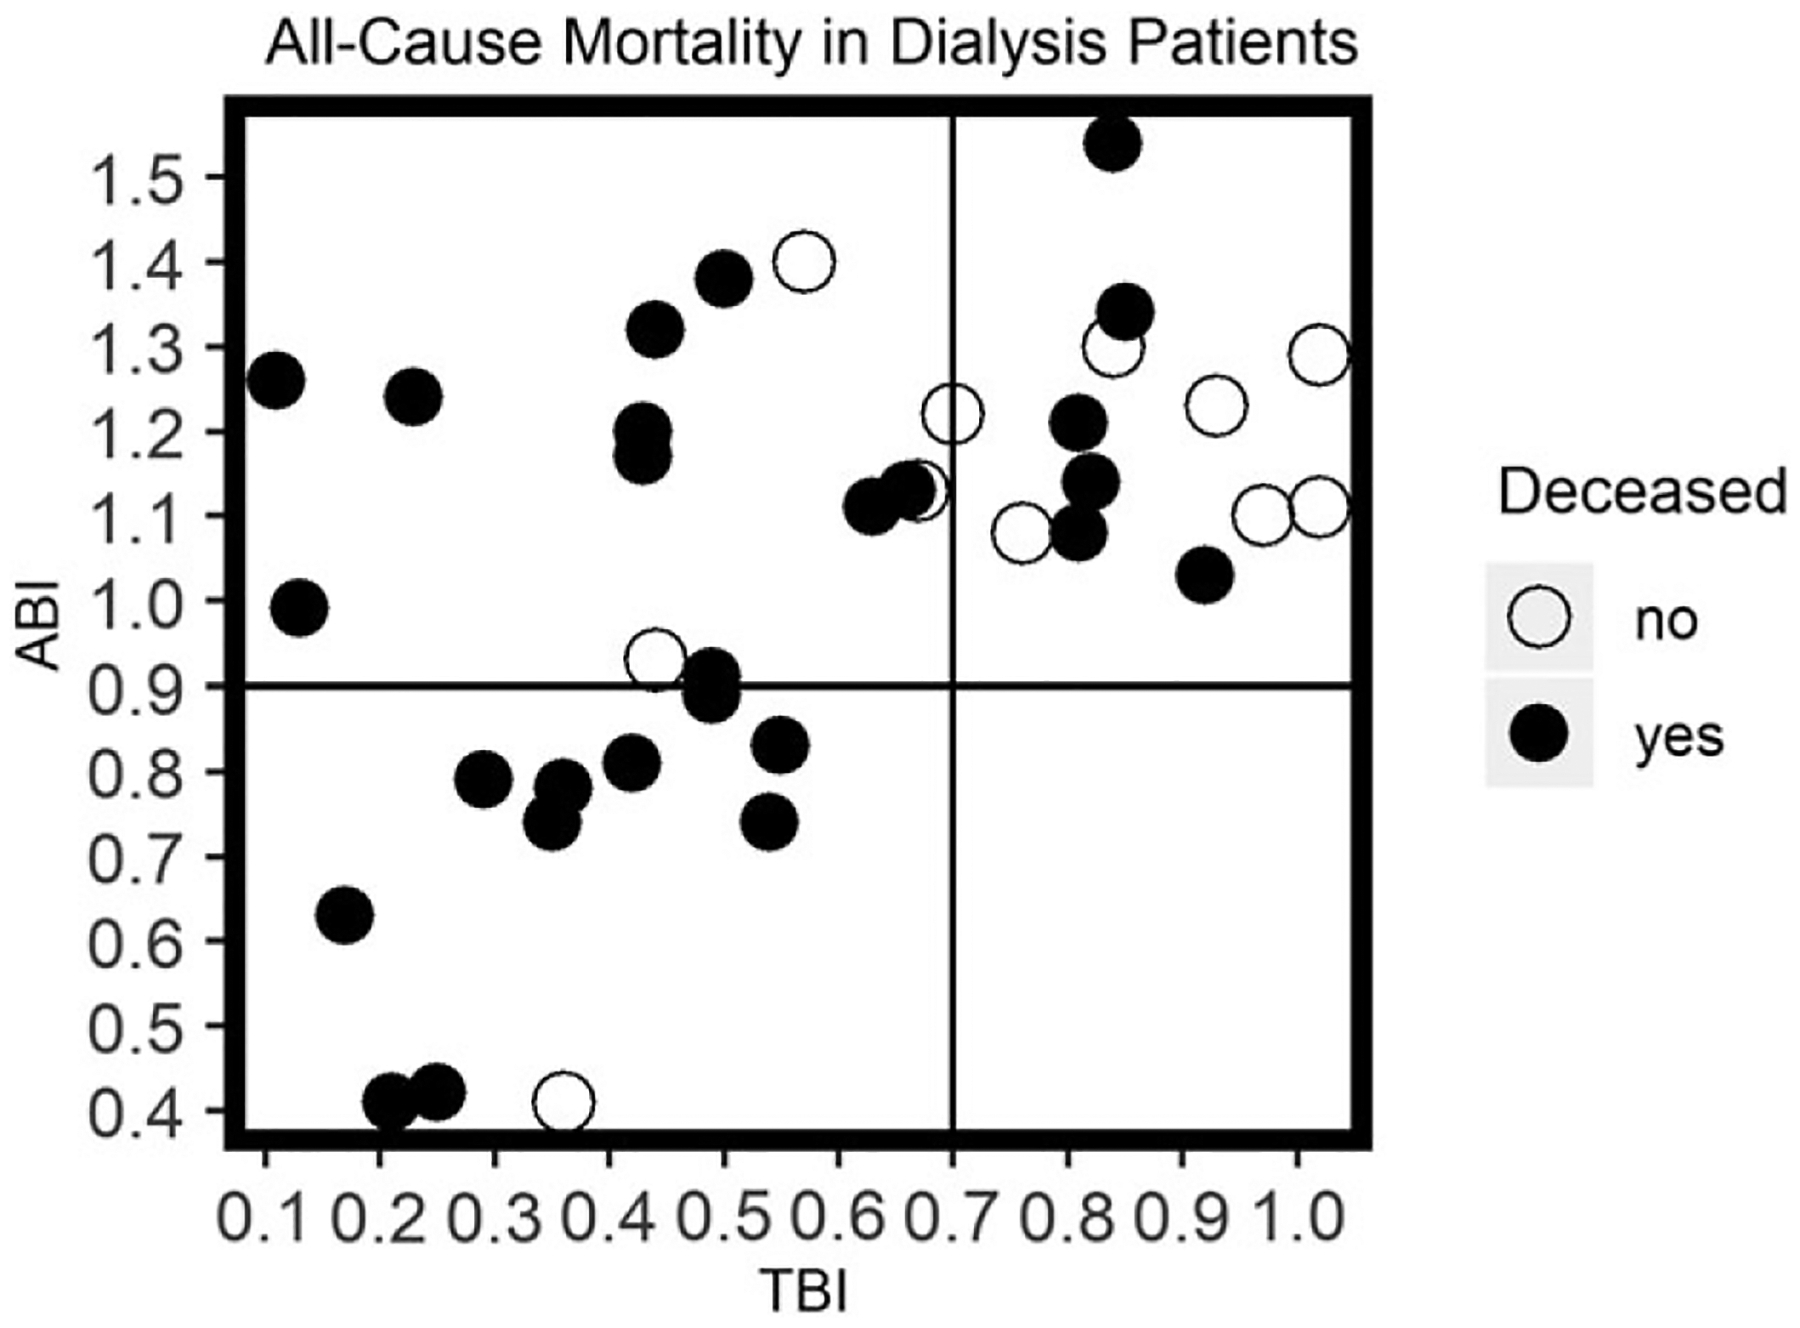
All-cause mortality distribution across toe brachial index and ankle brachial index. N = 37.
The receiver operating characteristic curve for ABI-TBI associated with mortality gave an optimal cut point of 0.39 with sensitivity of 77% and specificity of 55% (c-statistic: 0.66). The receiver operating characteristic curve for ABI-TBI associated with MALE resulted in an optimal cut point of 0.54 with sensitivity of 47% and specificity of 75% (c-statistic: 0.56). If we applied the more standard cutoff values, the sensitivity of ABI < 0.9 for mortality was 38%, whereas the sensitivity of TBI < 0.7 with respect to mortality was 77%. The sensitivity of the median ABI-TBI ≥ 0.46 for mortality was 58%.
Kaplan-Meier curves for all-cause mortality and MALE are shown for ABI-TBI groups (Figures 2 and 3), ABI groups (Figures 4 and 5), and TBI groups (Figures 6 and 7). There was no statistical difference in mortality or MALE risk when stratified by the median ABI-TBI of 0.46 (Figures 2 and 3) although both the risk of mortality and MALE seemed greater in those with ABI-TBI > 0.46. Similarly, there was no statistical difference in mortality or MALE risk when stratified by the ABI < 0.9 (Figures 4 and 5) although the ABI < 0.9 group did appear to have worse mortality outcomes.
Figure 2.

Kaplan-Meier curve of all-cause mortality across ABI-TBI. Categories were created by median ABI-TBI = 0.46. Crosses on curves indicate censoring events.
Figure 3.

Kaplan-Meier curve of time to MALE across ABI-TBI. Categories were created by median ABI-TBI = 0.46. Crosses on curves indicate censoring events.
Figure 4.

Kaplan-Meier curve of all-cause mortality across ABI. Categories were created by clinical ABI cutoff of 0.9. Crosses on curves indicate censoring events.
Figure 5.

Kaplan-Meier curve of time to MALE across ABI. Categories were created by clinical ABI cutoff of 0.9. Crosses on curves indicate censoring events.
Figure 6.

Kaplan-Meier curve of all-cause mortality across TBI. Categories were created by clinical TBI cutoff of 0.7. Crosses on curves indicate censoring events.
Figure 7.

Kaplan-Meier curve of time to MALE across TBI. Categories were created by clinical TBI cutoff of 0.7. Crosses on curves indicate censoring events.
The risk of all-cause mortality was greater in the TBI < 0.7 group (Figure 6). Differences in risk of MALE were not detected between the TBI < 0.7 and TBI ≥ 0.7 groups (Figure 7). In the unadjusted model (Table 2), TBI < 0.7 was associated with all-cause mortality (HR: 3.20, 95% CI: 1.18–8.66). However, this association was no longer significant after age adjustment (HR: 2.50, 95% CI: 0.83–7.54) (Table 2).
Table 2.
Associations of TBI with all-cause mortality in dialysis patients
| Group | Events (#) | Model 1a HR (95% CI) |
Model 2b HR (95% CI) |
|---|---|---|---|
| TBI < 0.7 | 20 | 3.20 (1.18–8.66) | 2.50 (0.83–7.54) |
| TBI ≥ 0.7 | 6 | 1.00 (Reference) | 1.00 (Reference) |
| ABI < 0.9 | 10 | 2.17 (0.95–4.98) | 1.73 (0.73–4.01) |
| ABI ≥ 0.9 | 16 | 1.00 (Reference) | 1.00 (Reference) |
| ABI-TBI ≥ 0.46 | 15 | 1.88 (0.83–4.24) | 1.70 (0.76–3.83) |
| ABI-TBI < 0.46 | 11 | 1.00 (Reference) | 1.00 (Reference) |
CI = confidence interval; HR = hazard ratio
Unadjusted
Adjusted for age
DISCUSSION
In our cohort of dialysis patients with both ABI and TBI measurements, our results suggest that TBI < 0.7 may be associated with heightened risk of mortality, while findings were not as strong for the traditional marker of ABI < 0.9, or for the ABI-TBI. We also found no significant association between MALE and ABI < 0.9, TBI < 0.7 or ABI-TBI < 0.46. Although the statistical significance of our findings was limited by sample size, we observed important patterns of association that warrant further study. Of these three modalities, TBI < 0.7 may have the most robust association with mortality. These findings suggest that while ABI may be an important initial risk stratification tool, the TBI may be a more informative predictor of mortality in dialysis patients.
To the best of our knowledge, differences between ABI and TBI in a dialysis population have never been described before. We found, as we hypothesized, that those with a high ABI-TBI were more likely to be diabetic, reflective of a population with greater MAC. Previous work has found that MAC is highly prevalent in the dialysis and diabetic population, making these overlapping patient groups susceptible to falsely elevated ABI measurements.2 Because it is thought that the toe vessels are spared from MAC, dialysis patients may have TBI measurements that could be more indicative of PAD and predictive of mortality. In the context of dialysis, a population that is known to have high rates of PAD and MAC, we proposed that the ABI-TBI could be a useful metric, and we hypothesized that higher ABI-TBI would be associated with mortality and MALE. Our findings suggest that ABI-TBI is indeed suggestive of worse mortality and MALE outcomes, although these findings were not significant in our small sample.
Although the association of ABI with mortality has been studied in some detail in dialysis patients,16 and both the ABI and TBI have been described in a cross-sectional study of dialysis patients,17 there has been no comprehensive analysis looking at both the associations of ABI and TBI with mortality and MALE outcomes in dialysis patients. We found that TBI < 0.7 was also associated with a higher risk of mortality in dialysis patients. This result holds clinical implications for dialysis patients with clinically suspected PAD. The current TASC II, ACA and ADA recommendations are to take TBI measurements only when ABI > 1.4. However, our cohort of dialysis patients had a median ABI of 1.11, with an interquartile range within the limits of normal ABI measurements (0.83–1.23), even though this cohort had a high rate of MALE and death events. Our work suggests that TBI testing may be informative even in the context of a normal ABI result in the dialysis population.
Our study also has important limitations, including small sample size and an all-male cohort reflective of the Veterans Administration patient population. The patients had all been referred to the vascular laboratory based on clinical suspicion of PAD, thus resulting in indication bias. However, we are unaware of any prior data in dialysis patients which have evaluated the ABI, TBI, and their associations with mortality and we believe that our study provides supportive data for future studies. Another limitation we encountered was that the MALE were found to be tightly linked to the vascular testing, often with the vascular testing done within weeks before or after the MALE procedures.
Strengths of this study include a sample with long-term follow-up and a high rate of MALE and deaths, with detailed chart review for outcomes in this population. The ABI and TBI were taken concurrently and systematically for each patient, and TBI was done for each patient referred for ABI; this protocol of including the TBI in all patients avoided bias of standard practice, which is to only check the TBI when ABI is >1.4 or incompressible.
CONCLUSION
In summary, the TBI < 0.7 may be associated with risk of mortality in dialysis patients. Further research in a larger sample size of dialysis patients is needed so that the associations with ABI-TBI, and ABI and TBI with mortality can be confirmed. If confirmed, this observation may highlight the need for additional TBI testing in all dialysis patients undergoing PAD evaluation.
ACKNOWLEDGEMENTS
This study was supported through the following grants: UAB-UCSD grant from O’Brien Center for Acute Kidney Injury Research, K23 DK114556, and VA Merit IIR 15-369 (HSR&D).
Disclosures and funding: RP was supported by a grant from the UAB-UCSD O’Brien Center for Acute Kidney Injury Research. PG was supported by grant K23 DK114556. DR was supported by VA Merit IIR 15—369 (HSR&D).
Footnotes
Conflicts of interest: There are no financial or non-financial relationships to declare.
REFERENCES
- 1.Norgren L, Hiatt WR, Dormandy JA, Nehler MR, Harris KA, Fowkes FGR. Inter-society consensus for the Management of Peripheral Arterial Disease (TASC II). J Vasc Surg. 2007;45:S5–S67. [DOI] [PubMed] [Google Scholar]
- 2.Ix JH, Criqui MH. Epidemiology and diagnosis of peripheral arterial disease in patients with chronic kidney disease. Adv Chronic Kidney Dis. 2008;15:378–383. [DOI] [PubMed] [Google Scholar]
- 3.Everhart JE, Pettitt DJ, Knowler WC, Rose FA, Bennett PH. Medial arterial calcification and its association with mortality and complications of diabetes. Diabetologia. 1988;31:16–23. [DOI] [PubMed] [Google Scholar]
- 4.Kaminski MR, Raspovic A, McMahon LP, et al. Risk factors for foot ulceration and lower extremity amputation in adults with end-stage renal disease on dialysis: A systematic review and meta-analysis. Nephrol Dial Transplant. 2015;30:1747–1766. [DOI] [PubMed] [Google Scholar]
- 5.London GM, Guérin AP, Marchais SJ, et al. Arterial media calcification in end-stage renal disease: Impact on all-cause and cardiovascular mortality. Nephrol Dial Transplant. 2003;18:1731–1740. [DOI] [PubMed] [Google Scholar]
- 6.Leskinen Y, Salenius JP, Lehtimäki T, Huhtala H, Saha H. The prevalence of peripheral arterial disease and medial arterial calcification in patients with chronic renal failure: Requirements for diagnostics. Am J Kidney Dis. 2002;40:472–479. [DOI] [PubMed] [Google Scholar]
- 7.Young MJ, Adams JE, Anderson GF, Boulton AJM, Cavanagh PR. Medial arterial calcification in the feet of diabetic patients and matched non-diabetic control subjects. Diabetologia. 1993;36:615–621. [DOI] [PubMed] [Google Scholar]
- 8.American Diabetes Association. Peripheral arterial disease in people with diabetes. Diabetes Care. 2003;26: 3333–3341. [DOI] [PubMed] [Google Scholar]
- 9.Hirsch AT, Haskal ZJ, Hertzer NR, et al. ACC/AHA 2005 practice guidelines for the management of patients with peripheral arterial disease (lower extremity, renal, mesenteric, and abdominal aortic): A collaborative report from the American Association for Vascular Surgery/Society for Vascular Surgery, Society for Cardiovascular Angiography and Interventions, Society for Vascular Medicine and Biology, Society of Interventional Radiology, and the ACC/AHA Task Force on Practice Guidelines (Writing Committee to Develop Guidelines for the Management of Patients with Peripheral Arterial Disease): Endorsed by the American Association of Cardiovascular and Pulmonary Rehabilitation; National Heart, Lung, and Blood Institute; Society for Vascular Nursing; TransAtlantic Inter-Society Consensus; and Vascular Disease foundation. Circulation. 2006;113: e463–e654. [DOI] [PubMed] [Google Scholar]
- 10.Bird CE, Criqui MH, Fronek A, Denenberg JO, Klauber MR, Langer RD. Quantitative and qualitative progression of peripheral arterial disease by non-invasive testing. Vasc Med Lond Engl. 1999;4:15–21. [DOI] [PubMed] [Google Scholar]
- 11.Aboyans V, Criqui MH, Denenberg JO, Knoke JD, Ridker PM, Fronek A. Risk factors for progression of peripheral arterial disease in large and small vessels. Circulation. 2006;113:2623–2629. [DOI] [PubMed] [Google Scholar]
- 12.Shadman R, Criqui MH, Bundens WP, et al. Subclavian artery stenosis: Prevalence, risk factors, and association with cardiovascular diseases. J Am Coll Cardiol. 2004;44:618–623. [DOI] [PubMed] [Google Scholar]
- 13.Aboyans V, Criqui MH, Abraham P, et al. Measurement and interpretation of the ankle-brachial index: A scientific statement from the American Heart Association. Circulation. 2012;126:2890–2909. [DOI] [PubMed] [Google Scholar]
- 14.Høyer C, Sandermann J, Petersen LJ. The toe-brachial index in the diagnosis of peripheral arterial disease. J Vasc Surg. 2013;58:231–238. [DOI] [PubMed] [Google Scholar]
- 15.R Core Team. R: A Language and Environment for Statistical Computing. Vienna, Austria: R Foundation for Statistical Computing, 2017. URL https://www.R-project.org/. [Google Scholar]
- 16.Miguel JB, De MJPS, Lugon JR. Ankle-brachial index as a predictor of mortality in hemodialysis: A 5-year cohort study. Arq Bras Cardiol. 2017;108:204–211. [DOI] [PMC free article] [PubMed] [Google Scholar]
- 17.Morimoto S, Nakajima F, Yurugi T, et al. Risk factors of normal ankle-brachial index and low toe-brachial index in hemodialysis patients. Ther Apher Dial. 2009;13: 103–107. [DOI] [PubMed] [Google Scholar]