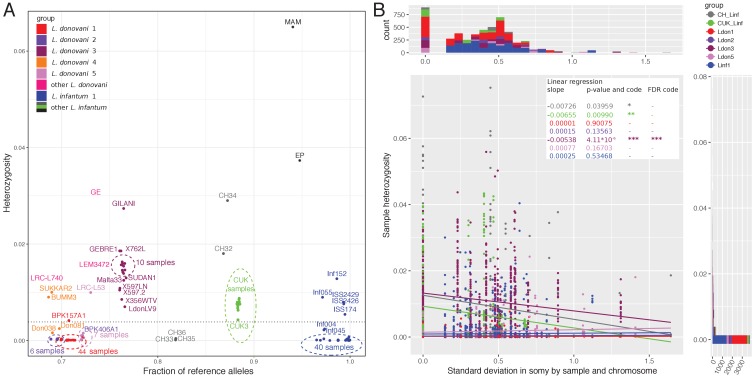
Figure 3. Whole genome sample heterozygosities.
(A) Whole genome heterozygosities versus fraction of reference alleles. The fraction of reference alleles is calculated across all 395,602 SNP loci in the data set. Isolate names are written unless they are present in dense clusters indicated by dashed-line circles. Groups are indicated by colour as defined in figure 1. The dashed horizontal line at a genome-wide heterozygosity of 0.004 was chosen to separate samples with putative recent between-strain hybridisation history. (B) Relationship between chromosome-specific somy variability and sample heterozygosity. The scatterplot describes the relationship between the standard deviation in chromosome-specific somy by group (groups with ≥ 5 samples) against the chromosome-specific sample heterozygosity. Linear regressions were performed for each group. Asterisks indicate statistical significance of the estimated regression slope with *: < 0.05, **: < 0.01, ***: < 0.001 or '-' for not significant. Marginal histograms on the top and on the right correspond to the x-values and the y-values of the scatterplot, respectively. Groups are indicated by the different colours.


