Abstract
The distribution of fitness effects (DFE) defines how new mutations spread through an evolving population. The ratio of non-synonymous to synonymous mutations (dN/dS) has become a popular method to detect selection in somatic cells. However the link, in somatic evolution, between dN/dS values and fitness coefficients is missing. Here we present a quantitative model of somatic evolutionary dynamics that determines the selective coefficients of individual driver mutations from dN/dS estimates. We then measure the DFE for somatic mutant clones in ostensibly normal oesophagus and skin. We reveal a broad distribution of fitness effects, with the largest fitness increases found for TP53 and NOTCH1 mutants (proliferative bias 1–5%). This study provides the theoretical link between dN/dS values and selective coefficients in somatic evolution, and measures the DFE of mutations in human tissues.
Research organism: Human
Introduction
One of the principal goals of large-scale genome sequencing of somatic tissues is to uncover genetic loci under positive selection, so-called ‘driver’ genes, that lead to clonal expansions. Measurement of the selective advantage of each driver mutation enables prediction of future evolutionary dynamics (Williams et al., 2019), provided the selective regime remains constant. In evolutionary biology, the distribution of fitness effects (DFE) is a fundamental entity that describes the selective consequences of a (large) number of individual mutations of an ancestral genome (Eyre-Walker and Keightley, 2007). In somatic evolution, particularly in cancer genomes, we have an extensive knowledge of the catalogue of recurrent, and likely positively selected, somatic mutations (Martincorena et al., 2017), but the fitness changes associated with each mutation remain largely unquantified.
Extensive experimental effort is ongoing to determine the fitness effects of mutations. Most prominently is lineage tracing of mutations in mouse models (Vermeulen et al., 2013; Rogers et al., 2018), but these methods are not sufficiently high-throughput to produce the DFE for all somatic mutations. Other studies have estimated the selective coefficient of somatic mutations by measuring their frequency over time in the same individual using longitudinal sampling (Körber et al., 2019), however this method is broadly limited to somatic evolution in the blood (Gibson and Steensma, 2018) (where it is feasible to take samples from healthy individuals over time) and in rare cases of patients under active surveillance.
An alternative approach is to infer selective coefficients directly from genome sequencing data. Methods to identify positively-selected (driver) mutations rely on finding genes that have significantly more mutational ‘hits’ (typically hits are non-synonymous mutations) than would be expected by chance, after correction for factors known to influence the mutation rate across the genome (Bailey et al., 2018). Conversely, negatively selected genes are expected to show a paucity of mutations (Weghorn and Sunyaev, 2017; Zapata et al., 2018). This idea is formalised in the calculation of the dN/dS ratio – a method originally developed in molecular species evolution – that has recently been adapted to study somatic evolution (both cancer and normal tissue) (Martincorena et al., 2017; Weghorn and Sunyaev, 2017; Zapata et al., 2018; Wu et al., 2016; Greenman et al., 2006; Yang et al., 2003; Martincorena et al., 2018; Lee-Six et al., 2018). The intuitive idea behind dN/dS is to measure the rate of non-synonymous (dN) mutations (possibly under selection) and compare that to the rate of synonymous (dS) mutations (presumed neutral). The ratio of these two numbers, each normalised for the local sequence-specific biases in the mutation rate, putatively identifies a signature of selection: dN/dS >1 indicating positive selection, dN/dS = 1 indicating neutral evolution and dN/dS <1 indicating negative selection.
Transforming dN/dS values to selective coefficients in somatic evolution is an unaddressed problem. dN/dS was originally developed in the context of species evolution using the Wright-Fisher process, a classical population genetics model that assumes that evolution occurs over very long timescales, which permits new mutations to fix within lineages. The Wright-Fisher model assumes constant population sizes, non-overlapping generations and that all individuals have equal potency. Under the Wright-Fisher model, the dN/dS of a locus is related to its selective coefficient by the relation (Nielsen and Yang, 2003):
Where is the effective population size and the selection coefficient.
However, in somatic evolution the assumptions of the Fisher-Wright model are violated. Somatic evolution is rapid and new mutations are infrequently fixed in the population (McGranahan and Swanton, 2017), clonal dynamics are complex (Williams et al., 2019), and population sizes unlikely to be constant (Sottoriva et al., 2015). Further, the lack of recombination in somatic evolution can result in strong hitchhiking effects (Tilk et al., 2019). In addition, since in somatic evolution, the ancestral genome is known, the need to measure dN/dS across a phylogeny is circumvented (a necessary step for dN/dS analysis in species evolution). Violations of some of these assumptions was previously recognised to make the interpretation of dN/dS problematic (Kryazhimskiy and Plotkin, 2008; Mugal et al., 2014), and consequently the relationship between selective coefficients and dN/dS values is uncertain.
The size distribution of clones (called the site frequency spectrum in population genetics nomenclature) also contains information on the selective coefficients of newly arising mutations. Mathematical descriptions of the dynamics of populations of cells can make predictions on the shape of the clone size distribution under different demographic and evolutionary models (Simons, 2016a; Durrett, 2013). This approach has been used to quantify the dynamics and cell fate properties of stem cells across many tissues in model systems (Klein et al., 2010; Lopez-Garcia et al., 2010; Vermeulen et al., 2013). We and others have also used similar approaches applied to deep sequencing data to infer the evolutionary dynamics of tumours (Williams et al., 2016; Williams et al., 2018; Bozic et al., 2016; Ling et al., 2015) and of clonal haematopoiesis in the blood (Watson et al., 2019).
To date, dN/dS analysis and the analysis of the clone size distribution have been performed independently, with conflictual results (Simons, 2016b; Martincorena et al., 2016). Here we develop the mathematical population genetics theory necessary to combine these approaches and explore how the inter-individual measure of selection at a locus as provided by dN/dS values, is related to the underlying cell population dynamics that generate intra-individual clone size distributions. This approach naturally accounts for the nuances in somatic evolution that can make the interpretation of dN/dS difficult. We show how this unified approach allows for greater insight into patterns of selection than either method in isolation, and importantly reveal the precise mathematical relationship between dN/dS values and selective coefficients in somatic evolution. We use this approach to infer the selective advantage of mutations in normal tissue.
Results
A general approach to integrate dN/dS and clone size distributions
We present a general mathematical framework for the interpretation of frequency-dependent dN/dS values in somatic evolution. First, we construct null models of the evolutionary dynamics in the absence of selection, and then augment these models to incorporate the consequences of selection. Evolutionary dynamics differ between normal tissues and cancer cells: in normal tissues maintained by stem cells, the long-term population dynamics is controlled by an approximately fixed-size set of equipotent stem cells undergoing a process of neutral competition (Klein and Simons, 2011), whereas in tumour growth the overall population increases over time. We develop a null model to predict the expected genetic diversity in the population in the absence of selection. Positive selection causes selected variants to rise to higher frequency than expected under neutral evolution (Figure 1a), and negative selection has the opposite effect. This insight guides how we model the effects of selection, namely the diversity of non-synonymous mutations.
Figure 1. dN/dS in somatic evolution depends on the frequency of clones.
(a) Variants under positive selection are enriched at high frequency, this means dN/dS estimates are dependent on the frequency of mutation, (b). The strength of selection influences the degree to which positively selected variants are enriched at high frequencies (c).
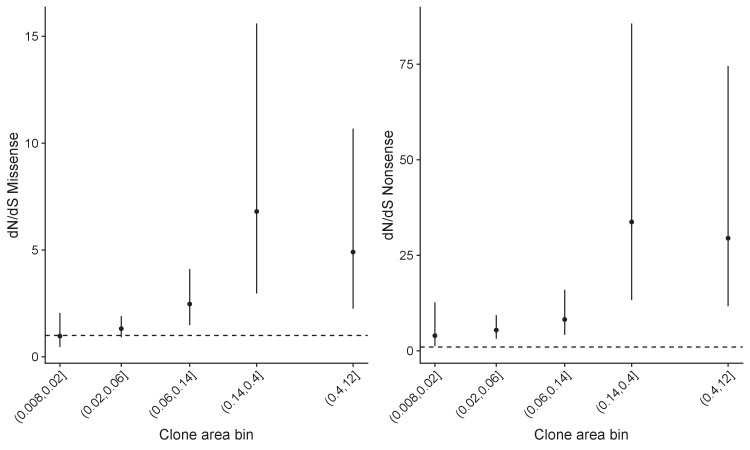
Figure 1—figure supplement 1. Global dN/dS values in different frequency bins for patient PD31182 showing that the values depend on the frequency of mutations.
Specifically, we defined the function as the expected number of mutations with selective (dis)advantage found at a frequency , for a given evolutionary dynamics scenario, where mutations accumulate at a rate µ per division. For the remainder of the paper we use passenger mutations to refer to those mutations that have no functional effect (s=0) and driver mutations those that have s>0. When comparing to data, driver mutations are taken as equivalent to non-synonymous mutations and passengers equivalent to synonymous mutations.
The functional form of encapsulates the population dynamics of the system with parameter vector , which may, for example, include the growth rate of a tumour, or loss replacement rate of stem cells in normal tissue. The direct interpretation of depends on the system under question. Following the logic of the effect of selection above, for we have that:
Since dN/dS measures the excess or deficiency of mutations due to selection, taking the ratio of when to and normalizing for the mutation rates, which may differ for passenger () and driver () mutations respectively, informs how dN/dS is expected to change as a function of the frequency of mutations in the population (Equation 1).
| (1) |
We discuss the general properties of this model. Firstly, when (neutral evolution), and provided that the mutation rates are correctly normalised, the numerator and denominator are equal resulting in , as expected. Secondly, dN/dS increases as a function of frequency (clone size) for positive selection, and decreases as a function of for negative selection (Figure 1b), for all that we explored. Thirdly, the shape of the curves predicted by the underlying population model encodes the value of the selection coefficient; for example the steepness of the increase is proportional to the selection coefficient (Figure 1c). These observations are a natural consequence of positive selection driving selected mutations to higher frequency (Figure 1a).
Unfortunately, directly using Equation (1) to measure selective coefficients from the slope of the dN/dS curve as function of frequency is often impractical. Real sequencing data often suffers from a limited number of mutations detected at any particular frequency and measurement uncertainties in these frequencies. To circumvent these issues, we introduce ‘interval dN/dS’ (i-dN/dS) that aggregates over a frequency range to reduce the influence of these sources of noise. Interval dN/dS is defined as:
| (2) |
Fixing the integration range allows for robust inference of in potentially sparse and noisy sequencing data using maximum likelihood methods (see Materials and methods).
Frequency-dependent dN/dS values in stem cell populations
In healthy tissue, only mutations that are acquired in the stem cells will persist over long times, and so we restrict our attention to these cells. Quantitative analysis of lineage tracing data has shown that the stem cell dynamics of many tissues conform to a process of population asymmetry (Klein and Simons, 2011). In this paradigm, under homeostasis, the loss of stem cells through differentiation is compensated by the replication of a neighbouring stem cell, thus maintaining an approximately constant number of stem cells. These dynamics are represented by the rate equations:
| (3) |
where SC refers to a single stem cell which divides symmetrically to produce either two stem cells or two differentiated cells (denoted as D above), is the rate of cell division per unit time, and is the probability of a symmetric divisions. The product is referred to as the loss/replacement rate. Differentiated cells will ultimately be lost from the population over long time scales. Under homeostasis, loss and replacement should be exactly balanced, so Δ = 0. With Δ ≠ 0, the fate of a stem cell is ‘biased’, introducing positive or negative selection into the model. Previous mathematical analysis shows that this model is a good description of the clonal dynamics in the oesophagus and skin (Klein et al., 2010; Doupé et al., 2012; Alcolea et al., 2014). Using previous analytical results describing the temporal evolution of the clone size distribution (see methods for detailed discussion) we derive the frequency distribution for oesophagus and skin as (Simons, 2016a; Klein et al., 2010; Nicholson and Antal, 2016):
| (4) |
Where A is the area of the clone, is density of stem cells per mm2, is the starting population size and μ the mutation rate, which may be different for drivers and passenger mutations , ie drivers and passengers may accumulate at different rates. is a scaling factor that depends on Δ, the bias toward self-renewal, which we interpret as our selection coefficient in this system. Specifically:
| (5) |
| (6) |
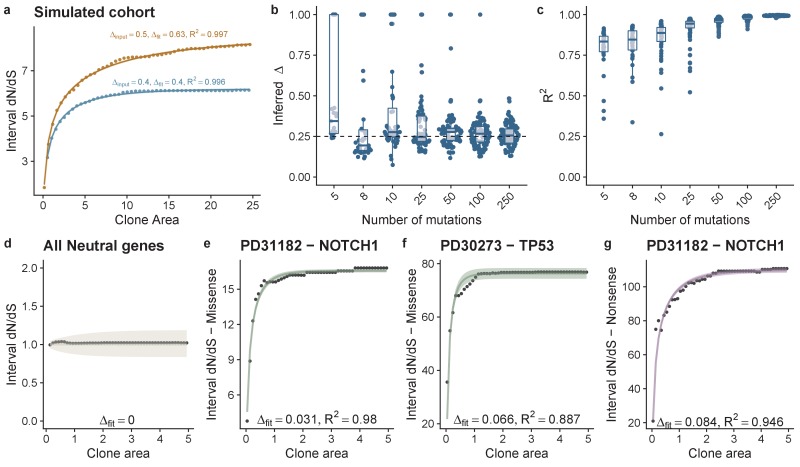
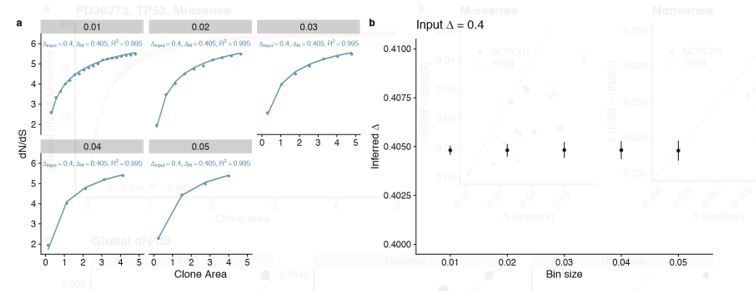
can be interpreted as the average size of a labelled clone after time , which even under homeostasis grows over time and compensates for some clones being lost due to drift. From these expressions, we can then write down an expression for i-dN/dS as a function of clone frequency (see Materials and methods) that allows for maximum likelihood estimation of parameter values (Δ). We confirmed the accuracy of our derivation using simulations (Figure 2a), and performed power calculations to determine the minimum number of mutations required to correctly infer the underlying population dynamics: we determined that 8 mutations per gene was sufficient to accurately recover Δ (Figure 2b) with accuracy increasing for higher mutation burdens (Figure 2c). We also performed simulations where Δ was itself a random variable, simulating the effect of different sites within the gene having different fitness effects. We assumed Δ was exponentially distributed and generated 500 simulated cohorts. Fitting i-dN/dS demonstrated that on average we infer the mean value of the exponential distribution, Figure 2—figure supplement 1.
Figure 2. Theoretical model of interval dN-dS fitted to simulated data and data from deep sequencing of the oesophagus.
(a) Interval dN/dS as a function of clone area for 2 simulated cohorts where driver mutations induce different biases, theoretical model captures the dynamics well and enables us to recover the bias ∆, accurately. As the number of mutations increases ability to recover the correct ∆ and the model fit (measured using R2) improves (b) and (c). (d) Data and model fit for all neutral genes, shows i-dN/dS = 1 across the frequency range and inferred bias of 0. Data and model fit for (e) NOTCH1 missense mutations in patient PD31182, (f) missense TP53 mutations in PD30273 and NOTCH1 nonsense mutations in PD31182 (g). Data are black points and model fits are solid lines with shaded areas denoting 95% CI.
Figure 2—figure supplement 1. Histogram of inferred Δ values from simulations using an exponentially distributed fitness effect.
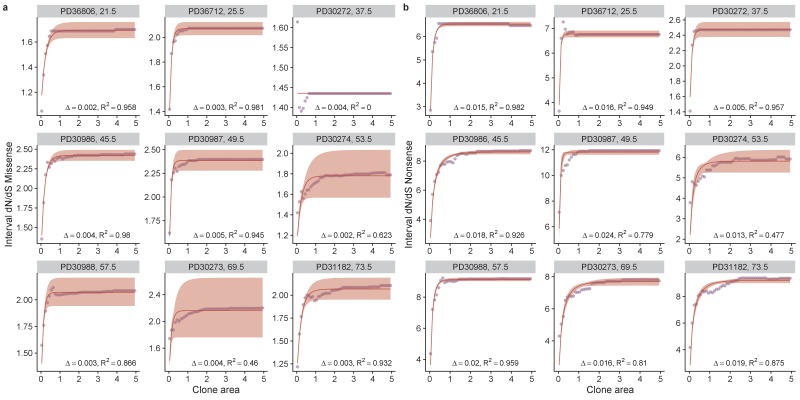
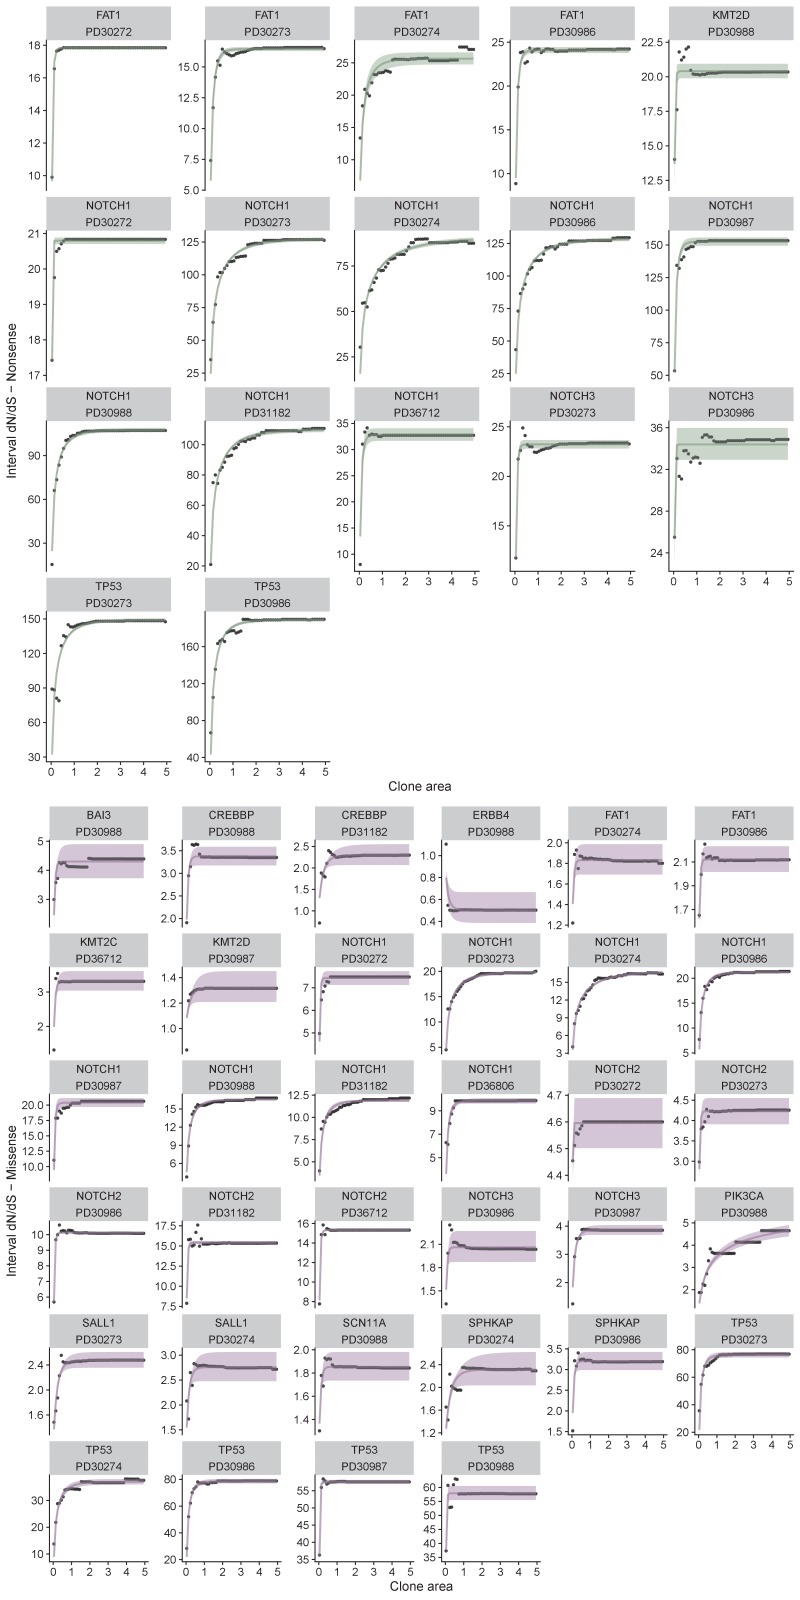
Figure 2—figure supplement 2. Model fits for all patients in the oesophagus data set.
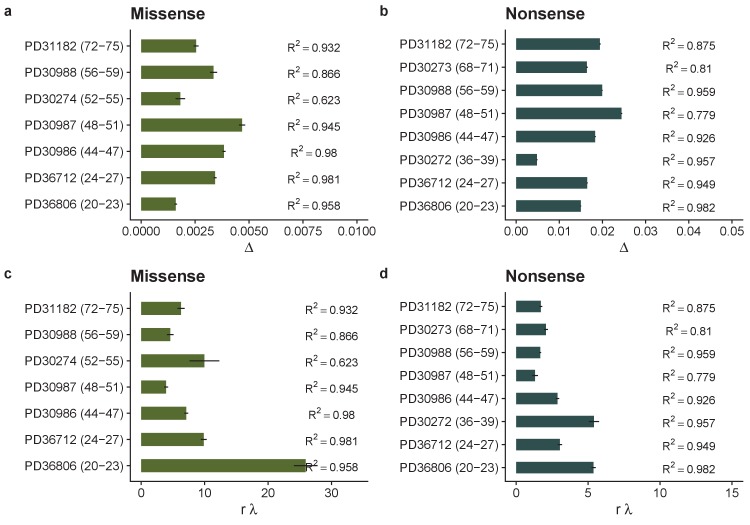
Figure 2—figure supplement 3. Inferred biases for for each patient in the oesophagus dataset based on missense, (a) and nonsense mutations, (b).
Figure 2—figure supplement 4. Individual fits for each gene in each patient in the oesophagus dataset.
Selection advantages in histopathologically-normal human oesophagus
We inferred the selective advantage of driver mutations in human oesophagus using published deep sequencing data from Martincorena and colleagues (Martincorena et al., 2018) that documents the clonal expansion of a panel of putative driver mutations in histopathologically-normal oesophageal biopsies.
We used the dndscv bioinformatics tool (Martincorena et al., 2017) to calculate frequency-dependent dN/dS values from these data (clone size measured in fraction of mutant reads multiplied by 2 mm2 – the area of the biopsy – and assuming 5000 stem cells per mm2 (Eyre-Walker and Keightley, 2007) tissue). dN/dS values varied considerably as a function of mutation area (Figure 1—figure supplement 1).
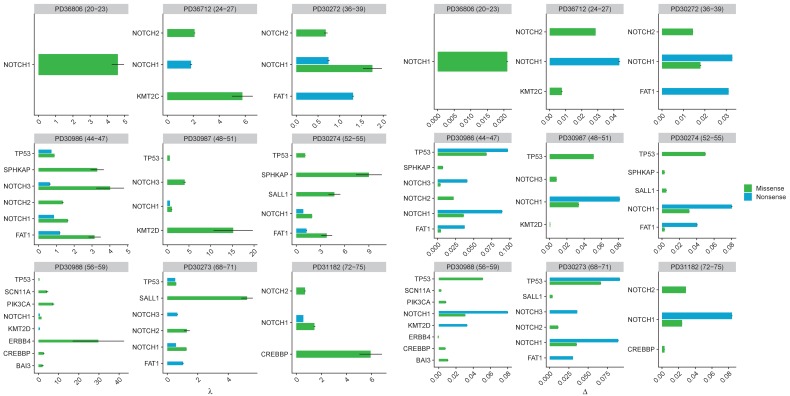
We considered the average frequency-dependent dN/dS values simultaneously across all genes in the panel, on a patient-by-patient basis. Our theoretical model of i-dN/dS calculated from these data fitted strikingly well (Figure 2—figure supplement 2). Estimates of the loss/replacement rate of the stem cell population were in the range 1.2-5.0 per year (Figure 2—figure supplements 2 and 3). Inference of the selective advantage (measured in terms of the bias towards self renewal Δ) revealed an average bias of 0.004 (0.002 – 0.005 95% CI) per missense mutation (Figure 2—figure supplement 3). Nonsense mutations caused a five-fold greater bias towards self-renewal of 0.021 (0.008 – 0.032 95% CI) (Figure 2—figure supplement 3). After removal of all genes that are strongly selected, global dN/dS values on the remaining 48 genes show dN/dS of approximately 1 across the frequency range (Figure 2d), and i-dN/dS analysis revealed that these somatic mutations do not associate with a proliferative bias (Δ=0).
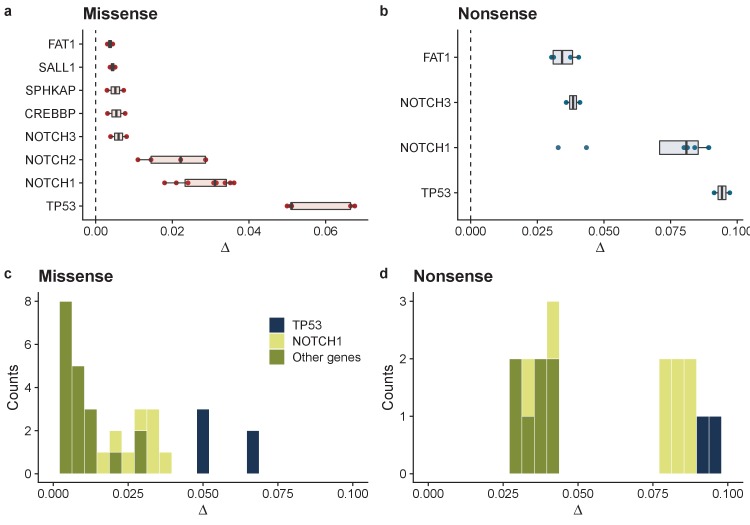
We then fitted the data on a gene-by-gene and patient-by-patient basis for cases where sufficient mutations were available to perform the fit (Figure 2e–g; Figure 2—figure supplement 4). A broad range of selective advantages were inferred (Figure 3 and Figure 3—figure supplement 1). Mutations in TP53 showed large biases across all patients for both missense, Δ = 0.057 (0.05–0.068 95% CI) and nonsense mutations, Δ = 0.094 (0.091–0.097 95% CI) (Figure 3a–b). This was also true for mutations in NOTCH1 with Δ = 0.029 (0.019–0.036 95% CI) for missense and Δ = 0.072 (0.034–0.089 95% CI) for nonsense mutations. NOTCH2, PIK3CA, CREBBP and FAT1 also showed a bias toward self-proliferation in multiple patients (Figure 3a–b), though most had a small effect on fitness (range 0.003–0.029 for missense mutations and 0.030–0.041 for nonsense mutations). Together these data suggest a distribution of fitness effects (DFE) characterized by many small effect mutations with few large effect mutations (Figure 3c–d), as is seen in organismal evolution (Eyre-Walker and Keightley, 2007). We recognize that there may be intra-gene variation of selection coefficients, that is, some sites within genes may have stronger fitness effects than others. This is supported by clustering of mutations within particular domains and hotspots of mutations as documented in the original study (Martincorena et al., 2018). In future, larger cohorts and methods to estimate site level dN/dS values would allow this approach to be extended to the site level.
Figure 3. Summary of model fits across all patients for normal oesophagus data.
Inferred biases ∆ for genes where at least 2 patients had good model fits (R2 > 0.6 & >7 mutations) for missense mutations (a), and nonsense mutations (b). Inferred distribution of fitness effects for all genes across all patients for missense mutations (c), and nonsense mutations (d).
Figure 3—figure supplement 1. Inferred parameters for each gene in each patient in the oesophagus dataset where there were sufficient mutations to perform the analysis.
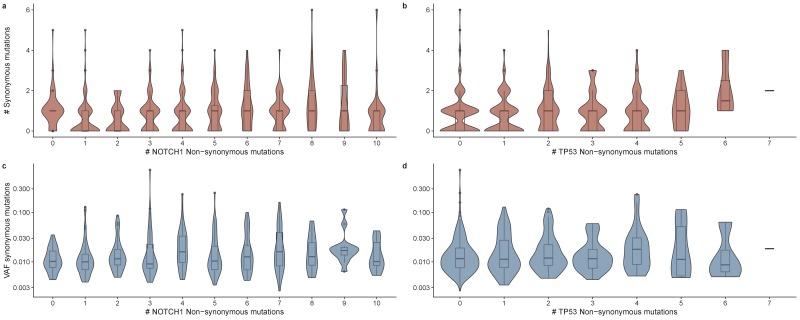
As our model assumes that clones emerge and expand independently we checked that the data is not overly influenced by hitchhiking mutations,which would violate these assumptions. For this, we leveraged the spatial sampling of tissue pieces. Approximately 90 patches were sampled from each patient. We reasoned that patches with selected clones might be expected to have more hitchhiking mutations, and for those mutations to be at a higher frequency when compared to patches without selected clones. To test this hypothesis, we counted the number of non-synonymous NOTCH1 and TP53 mutations and the number of synonymous mutations in each patch. If the synonymous mutations we observe in the data are largely due to hitchhiking effects we would expect the number and size of synonymous variants to correlate with the number of driver mutations per patch. While there =was a statistically significant correlation for both NOTCH1 (linear regression, p<0.001) and TP53 mutations (p=0.031), the effect was small (Figure 5—figure supplement 1): for each additional driver there was on average 0.05 additional synonymous variants (0.047 for NOTCH1 and 0.056 for TP53). We note too that the correlation was very noisy (R2 < 0.02) and we observed no statistically significant relationship between VAF of synonymous mutations and the number of TP53 or NOTCH1 mutations (linear regression, p>0.1). This analysis suggests that the majority of synonymous mutations are not hitchhikers, and consequently that assuming the independence of clones isreasonable.
Driver mutation selective advantage in normal skin
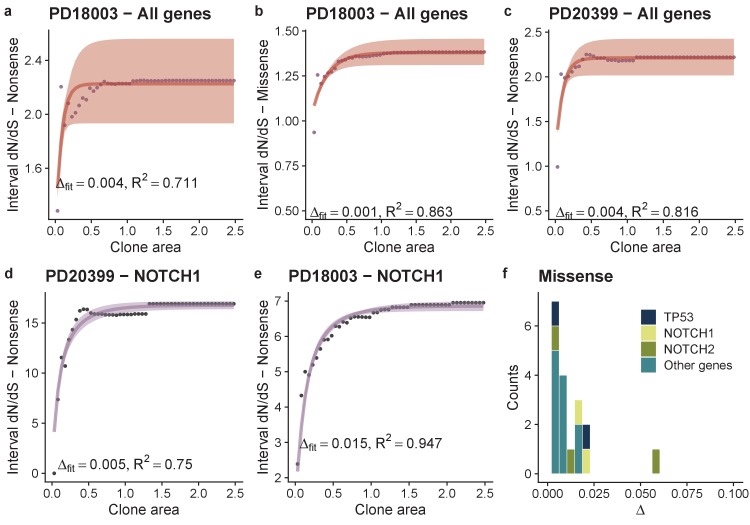
Martincorena and colleagues had also published data on the expansion of driver mutations in ostensibly normal human skin (Martincorena et al., 2015). Analyses of these data with interval dN/dS revealed a per-patient average selective advantage per mutation (again measured in terms of the bias towards self renewal) of Δ = 0.001 for missense mutations and four-fold higher (Δ = 0.004) for nonsense mutations (Figure 4a-c). Performing the analysis on a gene-by-gene basis was limited by the lower number of detected mutations, and the limited frequency range (clone size range) compared to the oesophagus dataset. Good fits to the data were obtainable for NOTCH1 missense mutations in patient PD18003 with fitness estimated to be Δ = 0.0149 (0.0148-0.0150 95% CI), and TP53 missense mutations also in patient PD18003, Δ = 0.0054 (0.0051-0.0058 95% CI) Figure 4. These fitness coefficients were similar to the oesophagus data. For missense mutations we were also able to produce the distribution of fitness effects across the skin cohort, which showed similar characteristics to the oesophagus data of a small number of high effect mutations and a larger number of smaller effect mutations, Figure 4f.
Figure 4. Analysis of skin dataset shows similar DFE to oesophagus.
Model fits per patient and per gene per patient when there were sufficient mutations in the skin dataset. Points are data and lines are model fits, (a-e). (f) Shows the distributions of fitness effects for missense mutations across the cohort. There were insufficient nonsense mutations in the majority of genes to draw the equivalent plot for nonsense mutations.
Site frequency spectra
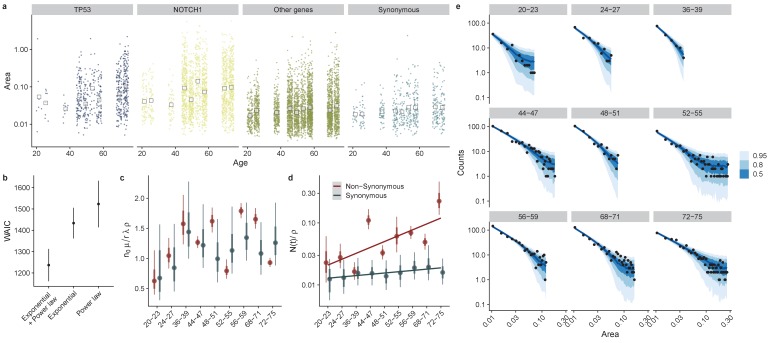
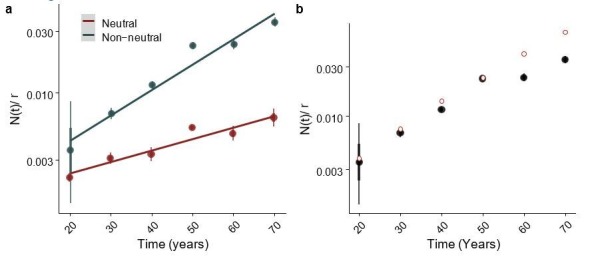
We next sought to challenge our model by directly fitting the site frequency spectra across ages, taking a similar approach to studies of the blood (Watson et al., 2019), colon (Lopez-Garcia et al., 2010), skin (Simons, 2016a) and other tissues (Klein and Simons, 2011). Our model of stem cell dynamics makes predictions on the properties of these distributions as a function of the age of donors. In particular, Equations (5) and (6) predict that the characteristic frequency N(t) increases exponentially for non-neutral mutations and linearly for neutral mutations as a function of time. Plotting the distribution of clone size areas showed a widening of the distribution as a function of age, which was particularly striking for mutations in the NOTCH1 and TP53 genes, consistent with these genes conferring large selective advantages (Figure 5a).
Figure 5. Directly fitting site frequency specta supports interval dN/dS inferences.
(a) Site frequency spectra become wider for older donors, with increases in the median clone area which is more pronounced for mutations in TP53 and NOTCH1. (b) Using WAIC to perform model selection, we found a model with an exponential term and a power law to be the best fitting model (lowest WAIC). (c) Posterior parameter estimates for . (d). The characteristic frequency , Interval represent 66% and 95% credible intervals respectively. (e) Site frequency spectra from data (black dots) and posterior predictive fits for 50, 80% and 95% credible intervals (blue ribbons) for non-synonymous mutations in each don or.
Figure 5—figure supplement 1. The number of synonymous mutations as a function of the number of NOTCH1 (a) and TP53 (b) mutations per tissue piece.
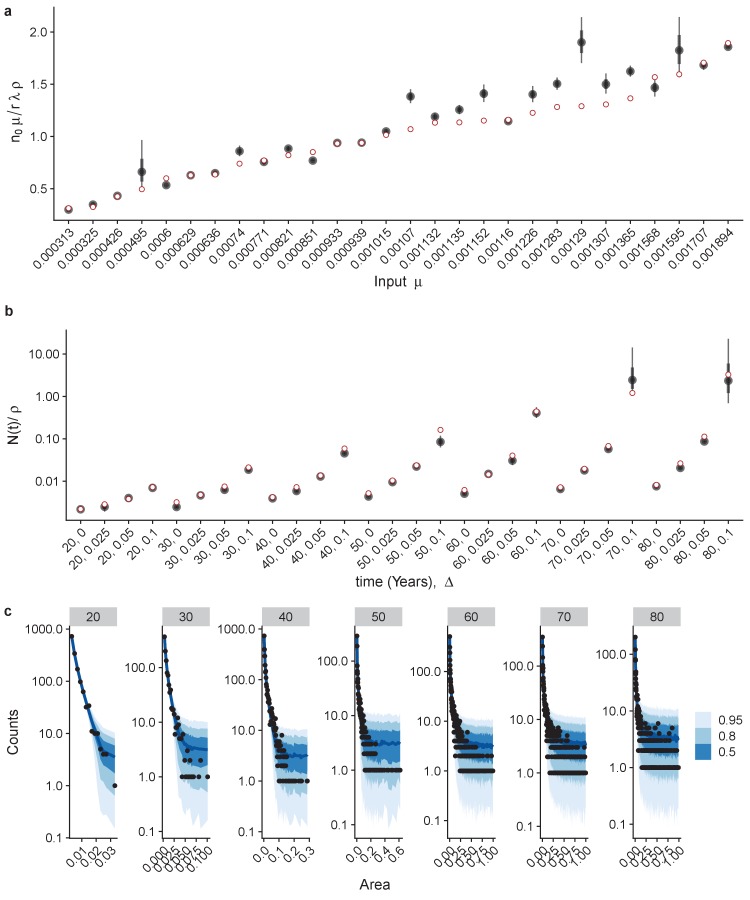
Figure 5—figure supplement 2. Inferring parameters from the site frequency spectrum of a simulated dataset.
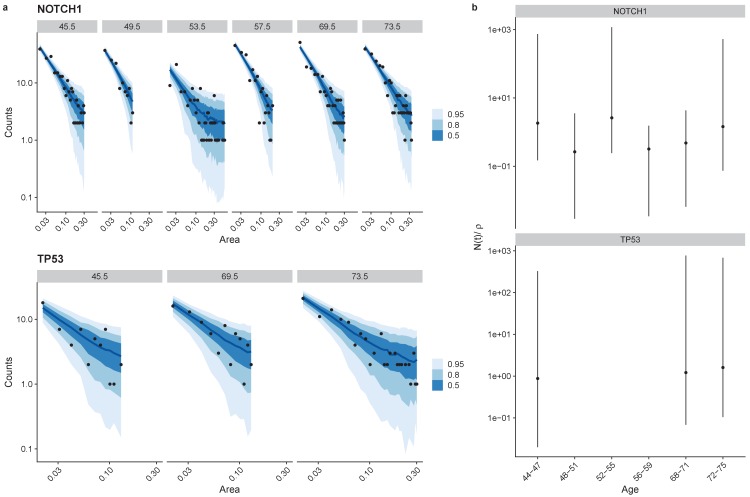
Figure 5—figure supplement 3. Site frequency spectra fits for NOTCH1 and TP53 non-synonymous mutations, (a).
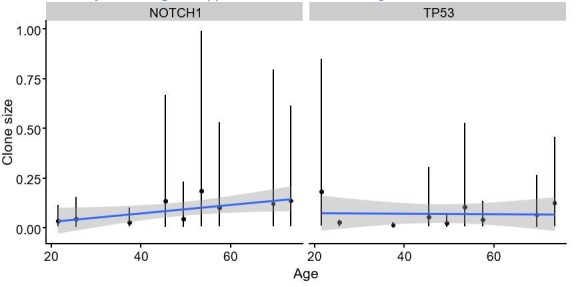
Figure 5—figure supplement 4. Regression of clone size against age.
Figure 5—figure supplement 5. Comparison of results using dndscv and SSB-dN/dS.
To quantitively test the predictions of the model and to infer parameters of interest we implemented a Bayesian non-linear fitting method (see methods) to fit the following model:
| (7) |
With the parameters , and to be estimated. We first validated that the approach could correctly infer known parameters from synthetic data generated from our simulation framework, Figure 5—figure supplement 2. Next, we fitted the model to the oesophagus dataset, separately for non-synonymous and synonymous mutations and across ages, Figure 5e. Posterior estimates of the compound parameter showed consistent estimates for both non-synonymous and synonymous mutations (taking into account the approximate 3:1 ratio of mutable sites), Figure 5c. Unfortunately decoupling directly from the data is not possible and requires independent estimates of either the mutation rate or number of stem cells. Posterior estimates of the characteristic frequency N(t) showed an increase as a function of age for non-synonymous mutations and a more modest increase for synonymous as would be predicted from theory, Figure 5d.
As another challenge to the proposed model, we also fitted the following two models which are simpler subsets of the full model we derive theoretically, thus testing two alternate decay functions.
Here, and are parameters to be estimated. Comparison of the fits using the widely applicable information criteria, WAIC (a generalized version of information criteria such as AIC and BIC) found that our theoretical model with an exponential term and a power law term (Equation 7) provided the best predictive accuracy (lowest WAIC), Figure 5b. Bayes factors for the proposed theoretical model also strongly supported this as the best model (BF > 103 for both models).
We also attempted to fit the model on a gene by gene basis. However due to the limited data points at the gene level we found that our posterior estimates for the parameters were very wide, precluding further insight from the site frequency spectrum at the gene level, Figure 5—figure supplement 3. This reveals one of the strengths of our i-dN/dS approach, which by leveraging information across genes to infer the background mutation model and integrating over clone sizes we can perform the inference with a limited number of data points. As an alternative to fitting the full clone size distribution, we performed a Bayesian multi-level regression to assess which mutations showed the largest increase in clone size as a function of age. This analysis revealed that TP53 and NOTCH1 had the largest regression coefficients, consistent with these genes having the largest selection coefficients, Figure 5—figure supplement 4, providing qualitative support for our approach. Our inferred selection coefficients from i-dN/dS were also correlated with the regression coefficients from the statistical model (linear regression, p=0.004, R2 = 0.47). Taken together, analysis of the site frequency spectrum on a patient by patient basis and a gene level statistical model are consistent with our inferences from i-dN/dS. We find that the proposed model provides the best fit to data when compared to other similar models, that the characteristic frequency of non-synonymous mutations increases rapidly with age and that NOTCH1 and TP53 exhibit the largest increase in clone size as a function of age.
Discussion
Here we have shown that the combination of dN/dS values with mutation frequency-based information provides additional quantitative insight into dynamics of somatic evolution than either method alone. Specifically, the combined approach enables direct inference of the selection coefficients of mutations in somatic tissues. We note that our study also shows that the magnitude of the selection coefficient is not necessarily represented by simply calculating a ‘point estimate’ of dN/dS that neglects mutation subclonal frequency information.
Using this methodology, we have begun the construction of the distribution of fitness effects (DFE) in somatic evolution, observing a distribution where most mutations that we analysed were near-neutral, with a tail of highly selected variants. In both skin and oesophagus, the most highly selected mutant genes were NOTCH1 and TP53 (increased proliferative bias of >1% and>5% respectively). We observed that values of selective coefficients of individual genes varies between patients, likely because of inter-patient difference in the precise location of point mutations, but potentially also because of inter-patient variation in selective pressure from the microenvironment. Nevertheless, the comparative rank of per-gene fitness coefficients was broadly consistent across patients (e.g. for missense mutations across patients, TP53 mutations always had the highest fitness, followed by NOTCH1 mutations). This consistency in selective coefficients is in agreement with the observation of highly recurrent gene mutations in cancer (Lawrence et al., 2013) and evidence of repeatability in cancer evolution (Caravagna et al., 2018).
Non-synonymous NOTCH1 mutations were observed approximately 3-fold more frequently that non-synonymous TP53 mutations in oesophagus, and approximately 5-fold more frequently in skin, suggesting that the mutation rate of NOTCH1 is greater than for TP53. Coupling these data with our quantitative measurements of the fitness coefficients leads to the prediction that the oesophagus will become transiently repopulated by NOTCH1-mutant cells during ageing, before subsequent replacement by fitter mutant-TP53 clones.
On a cautionary note, our theoretical work shows that the clonality of mutations strongly determine the observed value of dN/dS, and so a misleading picture of the selective forces will be produced if dN/dS frequency-dependent effects are not corrected for. The accuracy of any estimate of evolutionary dynamics from dN/dS values is of course dependent on the underlying accuracy of the dN/dS measure itself, which is compromised by uncharacterised variability in the mutation rate across the genome (Van den Eynden and Larsson, 2017) and in the uncertain pathogenicity of individual single nucleotide variants (extensions to estimate site level selection coefficients may circumvent some of these issues [Cannataro et al., 2018; Temko et al., 2018]). We also recognize that our model assumes a well-mixed population, while the data used in our study is from spatially structured epithelia. Spatial structure influences the distribution of clone sizes. Effects include: the influence of the boundary that enable rapid growth of mutants on the expanding front and conversely ‘encapsulation’ within a growing mass that slows clone growth (Fusco et al., 2016; Chkhaidze et al., 2019), and clonal interference that slows the growth of two similarly fit competing clones (Martens et al., 2011; Hall et al., 2019).
Combining population genetics methods with comparative genomics is a powerful way to infer selection pressures in human somatic evolution, giving new insight into the fundamental parameters that determine evolutionary dynamics in health and disease.
Materials and methods
Oesophagus and skin data
For the oesophagus and skin data we used mutation calls provided by the original studies. In the oesophagus data when a mutation was present in multiple adjacent biopsies we used the sum of the mutation frequency times the area of the biopsies (2 mm2) as our readout of clone size and performed the dN/dS analysis on a patient by patient basis.
dN/dS calculations
For calculating dN/dS ratios the dndscv R package was used, which calculates both global dN/dS ratios across the whole exome or a panel of genes as well as per gene dN/dS ratios using a covariate based model to infer dN/dS values with a limited number of mutations (Martincorena et al., 2017). We used the default settings of dndscv, using the default hg19 transcript reference provided by the package. dndscv can also take into account small insertions and deletions, which we included in our analysis. Therefore, where we refer to mutation this includes indels in addition to SNVs.
To calculate the interval dN/dS measure we took the clone size measurements and determined a low cutoff based on the minimum clone size. We then created a vector of clone sizes that covered the total range and calculated dN/dS between and all values of . This allowed us to plot dN/dS as a function of and fit our interval dN/dS models. In our data, clone size is measured in units of area (mm2).
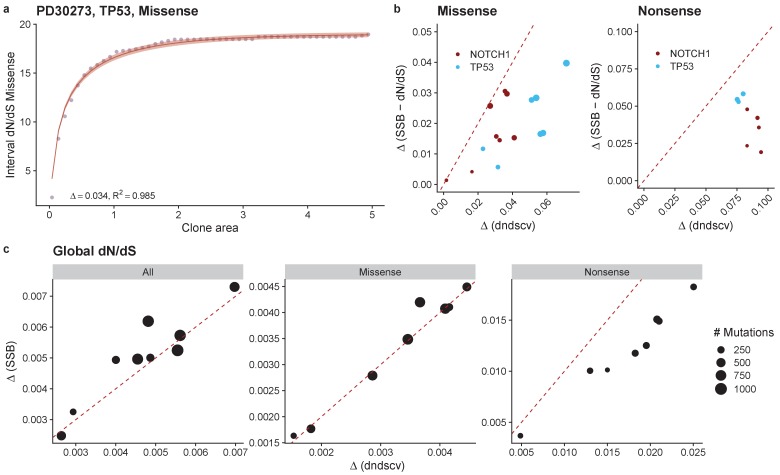
Accurately estimating dN/dS from sequencing data of somatic tissues can be challenging due to the strong sequence context dependence of mutations and variability of mutation rates across the genome. To confirm our inferences were not dependent on the choice of dN/dS methodology we calculated dN/dS values using SSB-dNdS and then fitted our model (Zapata et al., 2018). As SSB-dNdS only uses SNVs, we reran dndscv after removing indels. Inferences on a patient by patient basis were highly consistent between the methods, see Figure 5—figure supplement 4. There was more variability at the gene level, perhaps due to differences in the approaches used to control for variability in mutation rates across the genome.
Model fitting
We used a maximum likelihood approach to fit our models to the data. Defining the observed interval dN/dS as and the model dN/dS as . First of all we define the residuals between the data and the model as . Assuming that the residuals are normally distributed with mean 0 we can write down the negative log likelihood (NLL) as
where N denotes the normal probability density function. We can then find the parameters that minimize the NLL and calculate confidence intervals on these estimates using the Fisher information matrix. When fitting to data we ensured that there were a minimum of 8 mutations and only included model fits with R2 > 0.6 for downstream analysis. We used a maximum likelihood approach over a Bayesian approach to fit the model because the integral of the clone size distribution does not have a closed form solution, making it unfeasible to use readily available MCMC samplers which we adopt later.
Interval dN/dS model
For the stem cell model, using Equations 2, 3, 4, 5, 6 in the main text, interval dN/dS is given by:
Where is the exponential integral . is density of stem cells per mm2, which we set to 5,000 cells /mm2 for fitting (Hall et al., 2019).
Simulations
To confirm the accuracy of our analytical model and investigate the influence of uncertainty in mutation frequencies due to sequencing noise and to challenge some of the underlying assumptions of our theoretical approach, we developed a simulation based model.
We seed a population of stem cells that then undergo loss/replacement as described by the following rate equations
As only the stem cells are long lived the differentiated cells are not explicitly modelled such that when a stem cell 'differentiates' it is effectively lost from the population. During division, daughter cells acquire mutations with a fitness effect at rate and passenger mutations at rate . Fitness increases the bias toward self-proliferation of a stem cell lineage. Additional driver mutations do not further increase the fitness of stem cells.
To calculate dN/dS across a cohort of tissue biopsies we count the number of driver mutations and the number of passenger mutations, and then normalize by their respective mutation rates. In our model drivers = non-synonymous and thus every driver has an effect on fitness. Then the ratio of these two numbers gives us the excess or deficit of mutations due to selection – ie the dN/dS ratio.
For the interval dN/dS we simply calculate the between and .
To introduce uncertainty into mutation frequencies we perform a process of empirically motivated sampling to the true underlying frequency . Firstly, we specify the average depth of sequencing D, then the depth of sequencing for mutation i is given by
The sampled number of read counts is then
And the sampled variant frequency is then .
The simulation framework was written in Julia (Bezanson et al., 2017) and is available at https://github.com/marcjwilliams1/StemCellModels.jl.
Fitting site frequency spectra
To fit the site frequency spectra we first removed mutations with clone size area < 0.008. This cutoff was determined by inspection of the point of highest density of the clone size area histograms, reasoning that below this frequency the data was limited due to the resolution of the sequencing assay. We then binned the data using a bin size of 0.005 and counted the number of mutations in each bin. We did this for each donor and separately for non-synonymous and synonymous mutations. We then used the brms (Bayesian Regression Modeling with Stan) R package (Bürkner, 2017) to fit the following non-linear model jointly across all patients:
With the parameters , and to be estimated and C being the number of mutations and A the area. We used the following priors for the parameters:
We ran 4 chains with 5000 iterations with the first 2500 used as warmup. To assess convergence we ensured that the scale reduction factor (a measure of mixing of chains) was < 1.01 as recommended.
We also fitted the following two models:
We used the same prior distributions as above. We then compared the predictive accuracy of the different models using the widely applicable information criteria (WAIC) (Vehtari et al., 2017). This found that the functional form derived from theory provided the best fit, Figure 5b. Bayes factors to compare models were calculated using the bayestestR package (Makowski et al., 2019). The log10(BF) of the proposed theoretical model vs the power law was 52 and 44 when compared against the exponential model.
Bayesian multi-level regression
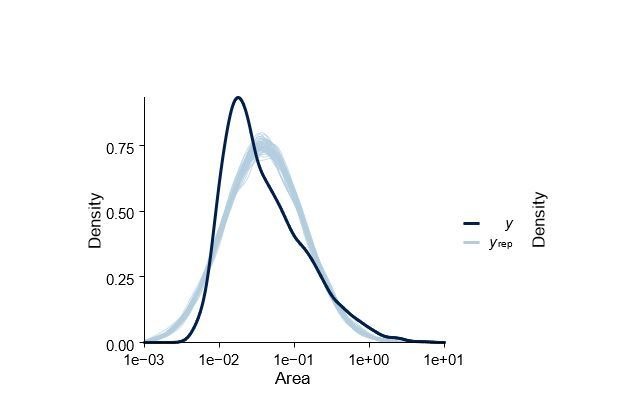
We performed a Bayesian multi-level regression of clone size ~ age with the gene as a random effect. This allowed us to determine which genes cause the largest increase in frequency as a function of age. This was done using brms in R with default priors, 4 chains and 5000 iterations. Using R’s statistical modelling syntax the model is given by clone size ~age + (1 + age|gene). We fit the model assuming a normal distribution as well as a log-normal distribution, finding the latter to provide the best predictive accuracy (lowest WAIC) and superior posterior predictive check.
Site frequency spectra for a model of stem cell proliferation
Our mathematical model of stem cell proliferation drew on results from a range of studies analysing the clone size distribution from lineage tracing experiments. Particularly useful are the results from Klein et al. (2010), which we took as a starting point for our model. We follow the notation used in this study to a large extent. Other studies that are also illuminating and relevant are the theoretical work of Nicholson and Antal (2016), while similar theoretical models have also been applied to the oesophagus (Doupé et al., 2012), airway epithelia (Teixeira et al., 2013) and the blood (Watson et al., 2019) amongst others. In this section we outline the key results relevant to our approach.
We begin with the set of rate equations presented in the main text:
From this we are interested in the clone size distribution, that is, the probability of observing a clone of size n after time t. In other fields such as population genetics, this distribution is equivalent to the site frequency spectrum. Given the above rate equations, we can express the dynamics as a birth-death process with birth rate and death rate which allows us to write down the master equation for the probability of observing a clone of size n at time t, .
This has the following solution (see Bailey, 1990 p92)
With and defined as follows:
From these results we can obtain the average size of surviving clones, :
Which, as will become apparent, gives a characteristic scale for the distribution.
Thus far we have only considered a single mutant at time 0, while we are interested in the case when mutants continually enter the population at a rate where µ is the mutation rate per cell division and is the number of stem cells. To derive the clone size distribution in this case, we take the integral over time multiplied by the mutation rate.
We can approximate which gives
The data we make use of doesn’t provide integer clone sizes but rather area of clones, so we can make the transformation :
This is the result presented in the main text.
Code and data availability
Code to reproduce all the figures in the manuscript (using a snakemake [Köster and Rahmann, 2012] workflow) is available at github.com/marcjwilliams1/dnds-clonesize (Williams, 2020; copy archived at https://elifesciences-publications/dnds-clonesize). We also created a singularity image with all software dependencies which is available at shub://marcjwilliams1/dnds-clonesize-R-container. Julia (Bezanson et al., 2017) was used for the simulations and R (R Development Core Team, 2019) was used to analyse the data and generate the figures. Some of the analysis rely in bespoke packages written for this study which are freely available under an open source licence.
Acknowledgements
AS is supported by the Wellcome Trust (202778/B/16/Z) and Cancer Research UK (A22909). TG is supported by the Wellcome Trust (202778/Z/16/Z) and Cancer Research UK (A19771). We acknowledge funding from the National Institute of Health (NCI U54 CA217376) to AS and TG This work was also supported a Wellcome Trust award to the Centre for Evolution and Cancer (105104/Z/14/Z). CPB is supported by the Wellcome Trust (209409/Z/17/Z).
Funding Statement
The funders had no role in study design, data collection and interpretation, or the decision to submit the work for publication.
Contributor Information
Marc J Williams, Email: william1@mskcc.org.
Andrea Sottoriva, Email: andrea.sottoriva@icr.ac.uk.
Trevor A Graham, Email: t.graham@qmul.ac.uk.
Patricia J Wittkopp, University of Michigan, United States.
Alfonso Valencia, Barcelona Supercomputing Center - BSC, Spain.
Funding Information
This paper was supported by the following grants:
Wellcome 202778/B/16/Z to Andrea Sottoriva.
Wellcome 202778/Z/16/Z to Trevor A Graham.
Wellcome 209409/Z/17/Z to Chris P Barnes.
Wellcome 105104/Z/14/Z to Andrea Sottoriva.
Cancer Research UK A22909 to Andrea Sottoriva.
Cancer Research UK A19771 to Trevor A Graham.
H2020 Marie Skłodowska-Curie Actions 846614 to Luis Zapata.
National Institutes of Health CA217376 to Andrea Sottoriva, Trevor A Graham.
Additional information
Competing interests
No competing interests declared.
Author contributions
Conceptualization, Data curation, Software, Formal analysis, Investigation, Visualization, Methodology.
Formal analysis, Investigation, Methodology.
Formal analysis, Investigation, Methodology.
Conceptualization, Software, Formal analysis, Supervision, Funding acquisition, Investigation, Methodology.
Conceptualization, Formal analysis, Supervision, Funding acquisition, Investigation, Methodology, Project administration.
Conceptualization, Resources, Formal analysis, Supervision, Funding acquisition, Investigation, Methodology, Project administration.
Additional files
Data availability
No new data was generated in this; only previously published data is reanalysed. Computer code implementing the new mathematical theory we developed is available here: https://github.com/marcjwilliams1/dnds-clonesize (copy archived at https://github.com/elifesciences-publications/dnds-clonesize).
The following previously published datasets were used:
Martincorena I, Fowler JC Wabik A, Lawson AAR, Abascal F, Michael Hall WJ, Cagan A, Murai k, Mahbubani K, Stratton MR, Fitzgerald RC, Handford PA, Campbell PJ, Saeb-Parsy K, Jones PH. 2018. EGAD00001004158. European Genome-phenome Archive. EGAD00001004158
Martincorena I, Fowler JC Wabik A, Lawson AAR, Abascal F, Michael Hall WJ, Cagan A, Murai k, Mahbubani K, Stratton MR, Fitzgerald RC, Handford PA, Campbell PJ, Saeb-Parsy K, Jones PH. 2018. EGAD00001004159. European Genome-phenome Archive. EGAD00001004159
Martincorena I, Roshan A, Gerstung M, Ellis P, Van Loo P, McLaren S, Wedge DC, Fullam A, Alexandrov LB, Tubio JM, Stebbings L, Menzies A, Widaa S, Stratton MR, Jones PH, Campbell PJ. 2016. EGAS00001000860. European Genome-phenome Archive. EGAS00001000860
Martincorena I, Roshan A, Gerstung M, Ellis P, Van Loo P, McLaren S, Wedge DC, Fullam A, Alexandrov LB, Tubio JM, Stebbings L, Menzies A, Widaa S, Stratton MR, Jones PH, Campbell PJ. 2016. EGAS00001000515. European Genome-phenome Archive. EGAS00001000515
Martincorena I, Roshan A, Gerstung M, Ellis P, Van Loo P, McLaren S, Wedge DC, Fullam A, Alexandrov LB, Tubio JM, Stebbings L, Menzies A, Widaa S, Stratton MR, Jones PH, Campbell PJ. 2016. EGAS00001000603. European Genome-phenome Archive. EGAS00001000603
References
- Alcolea MP, Greulich P, Wabik A, Frede J, Simons BD, Jones PH. Differentiation imbalance in single oesophageal progenitor cells causes clonal immortalization and field change. Nature Cell Biology. 2014;16:612–619. doi: 10.1038/ncb2963. [DOI] [PMC free article] [PubMed] [Google Scholar]
- Bailey NT. Elements of Stochastic Proccesses. John Wiley & Sons; 1990. [Google Scholar]
- Bailey MH, Tokheim C, Porta-Pardo E, Sengupta S, Bertrand D, Weerasinghe A, Colaprico A, Wendl MC, Kim J, Reardon B, Kwok-Shing Ng P, Jeong KJ, Cao S, Wang Z, Gao J, Gao Q, Wang F, Liu EM, Mularoni L, Rubio-Perez C, Nagarajan N, Cortés-Ciriano I, Zhou DC, Liang WW, Hess JM, Yellapantula VD, Tamborero D, Gonzalez-Perez A, Suphavilai C, Ko JY, Khurana E, Park PJ, Van Allen EM, Liang H, Lawrence MS, Godzik A, Lopez-Bigas N, Stuart J, Wheeler D, Getz G, Chen K, Lazar AJ, Mills GB, Karchin R, Ding L, MC3 Working Group, Cancer Genome Atlas Research Network Comprehensive characterization of Cancer driver genes and mutations. Cell. 2018;174:1034–1035. doi: 10.1016/j.cell.2018.07.034. [DOI] [PMC free article] [PubMed] [Google Scholar]
- Bezanson J, Edelman A, Karpinski S, Shah VB. Julia: a fresh approach to numerical computing. SIAM Review. 2017;59:65–98. doi: 10.1137/141000671. [DOI] [Google Scholar]
- Bozic I, Gerold JM, Nowak MA. Quantifying clonal and subclonal passenger mutations in Cancer evolution. PLOS Computational Biology. 2016;12:e1004731. doi: 10.1371/journal.pcbi.1004731. [DOI] [PMC free article] [PubMed] [Google Scholar]
- Bürkner P-C. Brms: an RPackage for bayesian multilevel models using stan. Journal of Statistical Software. 2017;80:1–28. doi: 10.18637/jss.v080.i01. [DOI] [Google Scholar]
- Cannataro VL, Gaffney SG, Townsend JP. Effect sizes of somatic mutations in Cancer. JNCI: Journal of the National Cancer Institute. 2018;110:1171–1177. doi: 10.1093/jnci/djy168. [DOI] [PMC free article] [PubMed] [Google Scholar]
- Caravagna G, Giarratano Y, Ramazzotti D, Tomlinson I, Graham TA, Sanguinetti G, Sottoriva A. Detecting repeated Cancer evolution from multi-region tumor sequencing data. Nature Methods. 2018;15:707–714. doi: 10.1038/s41592-018-0108-x. [DOI] [PMC free article] [PubMed] [Google Scholar]
- Chkhaidze K, Heide T, Werner B, Williams MJ, Huang W, Caravagna G, Graham TA, Sottoriva A. Spatially constrained tumour growth affects the patterns of clonal selection and neutral drift in Cancer genomic data. PLOS Computational Biology. 2019;15:e1007243. doi: 10.1371/journal.pcbi.1007243. [DOI] [PMC free article] [PubMed] [Google Scholar]
- Doupé DP, Alcolea MP, Roshan A, Zhang G, Klein AM, Simons BD, Jones PH. A single progenitor population switches behavior to maintain and repair esophageal epithelium. Science. 2012;337:1091–1093. doi: 10.1126/science.1218835. [DOI] [PMC free article] [PubMed] [Google Scholar]
- Durrett R. Population genetics of neutral mutations in exponentially growing Cancer cell populations. The Annals of Applied Probability. 2013;23:230–250. doi: 10.1214/11-AAP824. [DOI] [PMC free article] [PubMed] [Google Scholar]
- Eyre-Walker A, Keightley PD. The distribution of fitness effects of new mutations. Nature Reviews Genetics. 2007;8:610–618. doi: 10.1038/nrg2146. [DOI] [PubMed] [Google Scholar]
- Fusco D, Gralka M, Kayser J, Anderson A, Hallatschek O. Excess of mutational jackpot events in expanding populations revealed by spatial Luria-Delbrück experiments. Nature Communications. 2016;7:12760. doi: 10.1038/ncomms12760. [DOI] [PMC free article] [PubMed] [Google Scholar]
- Gibson CJ, Steensma DP. New insights from studies of clonal hematopoiesis. Clinical Cancer Research. 2018;24:4633–4642. doi: 10.1158/1078-0432.CCR-17-3044. [DOI] [PubMed] [Google Scholar]
- Greenman C, Wooster R, Futreal PA, Stratton MR, Easton DF. Statistical analysis of pathogenicity of somatic mutations in Cancer. Genetics. 2006;173:2187–2198. doi: 10.1534/genetics.105.044677. [DOI] [PMC free article] [PubMed] [Google Scholar]
- Hall MWJ, Jones PH, Hall BA. Relating evolutionary selection and mutant clonal dynamics in normal epithelia. Journal of the Royal Society. 2019;16:20190230. doi: 10.1098/rsif.2019.0230. [DOI] [PMC free article] [PubMed] [Google Scholar]
- Klein AM, Brash DE, Jones PH, Simons BD. Stochastic fate of p53-mutant epidermal progenitor cells is tilted toward proliferation by UV B during preneoplasia. PNAS. 2010;107:270–275. doi: 10.1073/pnas.0909738107. [DOI] [PMC free article] [PubMed] [Google Scholar]
- Klein AM, Simons BD. Universal patterns of stem cell fate in cycling adult tissues. Development. 2011;138:3103–3111. doi: 10.1242/dev.060103. [DOI] [PubMed] [Google Scholar]
- Körber V, Yang J, Barah P, Wu Y, Stichel D, Gu Z, Fletcher MNC, Jones D, Hentschel B, Lamszus K, Tonn JC, Schackert G, Sabel M, Felsberg J, Zacher A, Kaulich K, Hübschmann D, Herold-Mende C, von Deimling A, Weller M, Radlwimmer B, Schlesner M, Reifenberger G, Höfer T, Lichter P. Evolutionary trajectories of IDHWT glioblastomas reveal a common path of early tumorigenesis instigated years ahead of initial diagnosis. Cancer Cell. 2019;35:692–704. doi: 10.1016/j.ccell.2019.02.007. [DOI] [PubMed] [Google Scholar]
- Köster J, Rahmann S. Snakemake--a scalable bioinformatics workflow engine. Bioinformatics. 2012;28:2520–2522. doi: 10.1093/bioinformatics/bts480. [DOI] [PubMed] [Google Scholar]
- Kryazhimskiy S, Plotkin JB. The population genetics of dN/dS. PLOS Genetics. 2008;4:e1000304. doi: 10.1371/journal.pgen.1000304. [DOI] [PMC free article] [PubMed] [Google Scholar]
- Lawrence MS, Stojanov P, Polak P, Kryukov GV, Cibulskis K, Sivachenko A, Carter SL, Stewart C, Mermel CH, Roberts SA, Kiezun A, Hammerman PS, McKenna A, Drier Y, Zou L, Ramos AH, Pugh TJ, Stransky N, Helman E, Kim J, Sougnez C, Ambrogio L, Nickerson E, Shefler E, Cortés ML, Auclair D, Saksena G, Voet D, Noble M, DiCara D, Lin P, Lichtenstein L, Heiman DI, Fennell T, Imielinski M, Hernandez B, Hodis E, Baca S, Dulak AM, Lohr J, Landau DA, Wu CJ, Melendez-Zajgla J, Hidalgo-Miranda A, Koren A, McCarroll SA, Mora J, Crompton B, Onofrio R, Parkin M, Winckler W, Ardlie K, Gabriel SB, Roberts CWM, Biegel JA, Stegmaier K, Bass AJ, Garraway LA, Meyerson M, Golub TR, Gordenin DA, Sunyaev S, Lander ES, Getz G. Mutational heterogeneity in Cancer and the search for new cancer-associated genes. Nature. 2013;499:214–218. doi: 10.1038/nature12213. [DOI] [PMC free article] [PubMed] [Google Scholar]
- Lee-Six H, Øbro NF, Shepherd MS, Grossmann S, Dawson K, Belmonte M, Osborne RJ, Huntly BJP, Martincorena I, Anderson E, O'Neill L, Stratton MR, Laurenti E, Green AR, Kent DG, Campbell PJ. Population dynamics of normal human blood inferred from somatic mutations. Nature. 2018;561:473–478. doi: 10.1038/s41586-018-0497-0. [DOI] [PMC free article] [PubMed] [Google Scholar]
- Ling S, Hu Z, Yang Z, Yang F, Li Y, Lin P, Chen K, Dong L, Cao L, Tao Y, Hao L, Chen Q, Gong Q, Wu D, Li W, Zhao W, Tian X, Hao C, Hungate EA, Catenacci DV, Hudson RR, Li WH, Lu X, Wu CI. Extremely high genetic diversity in a single tumor points to prevalence of non-Darwinian cell evolution. PNAS. 2015;112:E6496–E6505. doi: 10.1073/pnas.1519556112. [DOI] [PMC free article] [PubMed] [Google Scholar]
- Lopez-Garcia C, Klein AM, Simons BD, Winton DJ. Intestinal stem cell replacement follows a pattern of neutral drift. Science. 2010;330:822–825. doi: 10.1126/science.1196236. [DOI] [PubMed] [Google Scholar]
- Makowski D, Ben-Shachar M, Lüdecke D. bayestestR: describing effects and their uncertainty, existence and significance within the bayesian framework. Journal of Open Source Software. 2019;4:1541–1548. doi: 10.21105/joss.01541. [DOI] [Google Scholar]
- Martens EA, Kostadinov R, Maley CC, Hallatschek O. Spatial structure increases the waiting time for Cancer. New Journal of Physics. 2011;13:115014. doi: 10.1088/1367-2630/13/11/115014. [DOI] [PMC free article] [PubMed] [Google Scholar]
- Martincorena I, Roshan A, Gerstung M, Ellis P, Van Loo P, McLaren S, Wedge DC, Fullam A, Alexandrov LB, Tubio JM, Stebbings L, Menzies A, Widaa S, Stratton MR, Jones PH, Campbell PJ. Tumor evolution. high burden and pervasive positive selection of somatic mutations in normal human skin. Science. 2015;348:880–886. doi: 10.1126/science.aaa6806. [DOI] [PMC free article] [PubMed] [Google Scholar]
- Martincorena I, Jones PH, Campbell PJ. Constrained positive selection on Cancer mutations in normal skin. PNAS. 2016;113:E1128–E1129. doi: 10.1073/pnas.1600910113. [DOI] [PMC free article] [PubMed] [Google Scholar]
- Martincorena I, Raine KM, Gerstung M, Dawson KJ, Haase K, Van Loo P, Davies H, Stratton MR, Campbell PJ. Universal patterns of selection in Cancer and somatic tissues. Cell. 2017;171:1029–1041. doi: 10.1016/j.cell.2017.09.042. [DOI] [PMC free article] [PubMed] [Google Scholar]
- Martincorena I, Fowler JC, Wabik A, Lawson ARJ, Abascal F, Hall MWJ, Cagan A, Murai K, Mahbubani K, Stratton MR, Fitzgerald RC, Handford PA, Campbell PJ, Saeb-Parsy K, Jones PH. Somatic mutant clones colonize the human esophagus with age. Science. 2018;362:911–917. doi: 10.1126/science.aau3879. [DOI] [PMC free article] [PubMed] [Google Scholar]
- McGranahan N, Swanton C. Clonal heterogeneity and tumor evolution: past, present, and the future. Cell. 2017;168:613–628. doi: 10.1016/j.cell.2017.01.018. [DOI] [PubMed] [Google Scholar]
- Mugal CF, Wolf JB, Kaj I. Why time matters: codon evolution and the temporal dynamics of dN/dS. Molecular Biology and Evolution. 2014;31:212–231. doi: 10.1093/molbev/mst192. [DOI] [PMC free article] [PubMed] [Google Scholar]
- Nicholson MD, Antal T. Universal asymptotic clone size distribution for general population growth. Bulletin of Mathematical Biology. 2016;78:2243–2276. doi: 10.1007/s11538-016-0221-x. [DOI] [PMC free article] [PubMed] [Google Scholar]
- Nielsen R, Yang Z. Estimating the distribution of selection coefficients from phylogenetic data with applications to mitochondrial and viral DNA. Molecular Biology and Evolution. 2003;20:1231–1239. doi: 10.1093/molbev/msg147. [DOI] [PubMed] [Google Scholar]
- R Development Core Team . Vienna, Austria: 2019. https://www.R-project.org [Google Scholar]
- Rogers ZN, McFarland CD, Winters IP, Seoane JA, Brady JJ, Yoon S, Curtis C, Petrov DA, Winslow MM. Mapping the in vivo fitness landscape of lung adenocarcinoma tumor suppression in mice. Nature Genetics. 2018;50:483–486. doi: 10.1038/s41588-018-0083-2. [DOI] [PMC free article] [PubMed] [Google Scholar]
- Simons BD. Deep sequencing as a probe of normal stem cell fate and preneoplasia in human epidermis. PNAS. 2016a;113:128–133. doi: 10.1073/pnas.1516123113. [DOI] [PMC free article] [PubMed] [Google Scholar]
- Simons BD. Reply to martincorena et al.: evidence for constrained positive selection of Cancer mutations in normal skin is lacking. PNAS. 2016b;113:E1130–E1131. doi: 10.1073/pnas.1601045113. [DOI] [PMC free article] [PubMed] [Google Scholar]
- Sottoriva A, Kang H, Ma Z, Graham TA, Salomon MP, Zhao J, Marjoram P, Siegmund K, Press MF, Shibata D, Curtis C. A big bang model of human colorectal tumor growth. Nature Genetics. 2015;47:209–216. doi: 10.1038/ng.3214. [DOI] [PMC free article] [PubMed] [Google Scholar]
- Teixeira VH, Nadarajan P, Graham TA, Pipinikas CP, Brown JM, Falzon M, Nye E, Poulsom R, Lawrence D, Wright NA, McDonald S, Giangreco A, Simons BD, Janes SM. Stochastic homeostasis in human airway epithelium is achieved by neutral competition of basal cell progenitors. eLife. 2013;2:e00966. doi: 10.7554/eLife.00966. [DOI] [PMC free article] [PubMed] [Google Scholar]
- Temko D, Tomlinson IPM, Severini S, Schuster-Böckler B, Graham TA. The effects of mutational processes and selection on driver mutations across Cancer types. Nature Communications. 2018;9:1857. doi: 10.1038/s41467-018-04208-6. [DOI] [PMC free article] [PubMed] [Google Scholar]
- Tilk S, Curtis C, Petrov DA, McFarland CD. Most cancers carry a substantial deleterious load due to Hill-Robertson interference. bioRxiv. 2019 doi: 10.1101/764340. [DOI] [PMC free article] [PubMed]
- Van den Eynden J, Larsson E. Mutational signatures are critical for proper estimation of purifying selection pressures in Cancer somatic mutation data when using the dN/dS metric. Frontiers in Genetics. 2017;8:415–419. doi: 10.3389/fgene.2017.00074. [DOI] [PMC free article] [PubMed] [Google Scholar]
- Vehtari A, Gelman A, Gabry J. Practical bayesian model evaluation using leave-one-out cross-validation and WAIC. Statistics and Computing. 2017;27:1413–1432. doi: 10.1007/s11222-016-9696-4. [DOI] [Google Scholar]
- Vermeulen L, Morrissey E, van der Heijden M, Nicholson AM, Sottoriva A, Buczacki S, Kemp R, Tavaré S, Winton DJ. Defining stem cell dynamics in models of intestinal tumor initiation. Science. 2013;342:995–998. doi: 10.1126/science.1243148. [DOI] [PubMed] [Google Scholar]
- Watson CJ, Papula A, Poon YP, Wong WH, Young AL, Druley TE, Fisher DS, Blundell JR. The evolutionary dynamics and fitness landscape of clonal haematopoiesis. bioRxiv. 2019 doi: 10.1101/569566. [DOI] [PubMed]
- Weghorn D, Sunyaev S. Bayesian inference of negative and positive selection in human cancers. Nature Genetics. 2017;49:1785–1788. doi: 10.1038/ng.3987. [DOI] [PubMed] [Google Scholar]
- Williams MJ, Werner B, Barnes CP, Graham TA, Sottoriva A. Identification of neutral tumor evolution across Cancer types. Nature Genetics. 2016;48:238–244. doi: 10.1038/ng.3489. [DOI] [PMC free article] [PubMed] [Google Scholar]
- Williams MJ, Werner B, Heide T, Curtis C, Barnes CP, Sottoriva A, Graham TA. Quantification of subclonal selection in Cancer from bulk sequencing data. Nature Genetics. 2018;50:895–903. doi: 10.1038/s41588-018-0128-6. [DOI] [PMC free article] [PubMed] [Google Scholar]
- Williams MJ, Sottoriva A, Graham TA. Measuring clonal evolution in Cancer with genomics. Annual Review of Genomics and Human Genetics. 2019;20:309–329. doi: 10.1146/annurev-genom-083117-021712. [DOI] [PubMed] [Google Scholar]
- Williams MJ. Github; 2020. https://github.com/marcjwilliams1/dnds-clonesize [Google Scholar]
- Wu CI, Wang HY, Ling S, Lu X. The ecology and evolution of Cancer: the Ultra-Microevolutionary process. Annual Review of Genetics. 2016;50:347–369. doi: 10.1146/annurev-genet-112414-054842. [DOI] [PubMed] [Google Scholar]
- Yang Z, Ro S, Rannala B. Likelihood models of somatic mutation and Codon substitution in Cancer genes. Genetics. 2003;165:695–705. doi: 10.1093/genetics/165.2.695. [DOI] [PMC free article] [PubMed] [Google Scholar]
- Zapata L, Pich O, Serrano L, Kondrashov FA, Ossowski S, Schaefer MH. Negative selection in tumor genome evolution acts on essential cellular functions and the immunopeptidome. Genome Biology. 2018;19:1–17. doi: 10.1186/s13059-018-1434-0. [DOI] [PMC free article] [PubMed] [Google Scholar]


