Abstract
The protein kinase MELK is an important kinase in cell signaling and has shown to be a promising anti-cancer target. Recent work has resulted in a novel small molecule scaffold targeting MELK, IN17. However, there has been little structural information or physical understanding of MELK-IN17 interactions. Using Tinker-OpenMM on GPUs, we have performed free energy simulations on MELK binding with IN17 and 11 derivatives. This series of studies provides structural insights into how substitution on IN17 leads to differences in complex structure and binding thermodynamics. In addition, this study serves as an assessment of the current capabilities of the AMOEBA forcefield, accelerated by GPU computing, to serve as a molecular dynamics-based free energy simulation platform for lead optimization.
Keywords: MELK, Kinase inhibitor, Molecular dynamics, Free energy calculation
Introduction
The protein kinase maternal embryonic leucine zipper kinase (MELK) has received interest as a potential therapeutic target for cancer. MELK is reported to directly activate the cancer-promoting transcription factors FOXM1 [1] and c-JUN [2], and to upregulate the expression of the anti-apoptotic protein MCl1 through eIF4B signaling pathway [3]. MELK expression has been found to be upregulated in many types of cancer cell cultures and tumor samples [4–6]. Overexpression of MELK is a correlate of poor prognosis in many cancer types, including triple negative breast cancer [7, 8], prostate cancer [9], lung adenocarcinoma [5], and acute myeloid leukemia [10].
Given its potential as a therapeutic target, several inhibitors of MELK have been developed, most prominently OTSSP167 [11–13]. However, OTSSP167 exhibits significant off-target binding, and has been found to inhibit the mitotic kinases BUB1 and Haspin, as well as Aurora B kinase [14]. Given the importance of these kinases in initiating mitosis [15–17], it is likely that at least some of the therapeutic effects of OTSSP167 is not a result of MELK inhibition. This has made probing the actual role of MELK in cancer progression difficult.
In an attempt to create a more specific chemical inhibitor of MELK, the IN17 scaffold was developed [18]. This scaffold is present in the approved drug nintedanib [19], and was slightly modified by moving the carboxy methyl ester from C29 to C28 to form IN17 (Fig. 1). IN17 has been shown to bind MELK with a sub-nanomolar KI, as well as to suppress cellular proliferation in cultured Triple Negative Breast Cancer cell lines [18]. However, little structural information is known about this compound and its derivatives, limiting the potential development of further improved compounds. In this paper, we use molecular dynamics (MD) and free energy methods to analyze the binding mechanism of IN17, and related derivatives, to MELK.
Fig. 1.
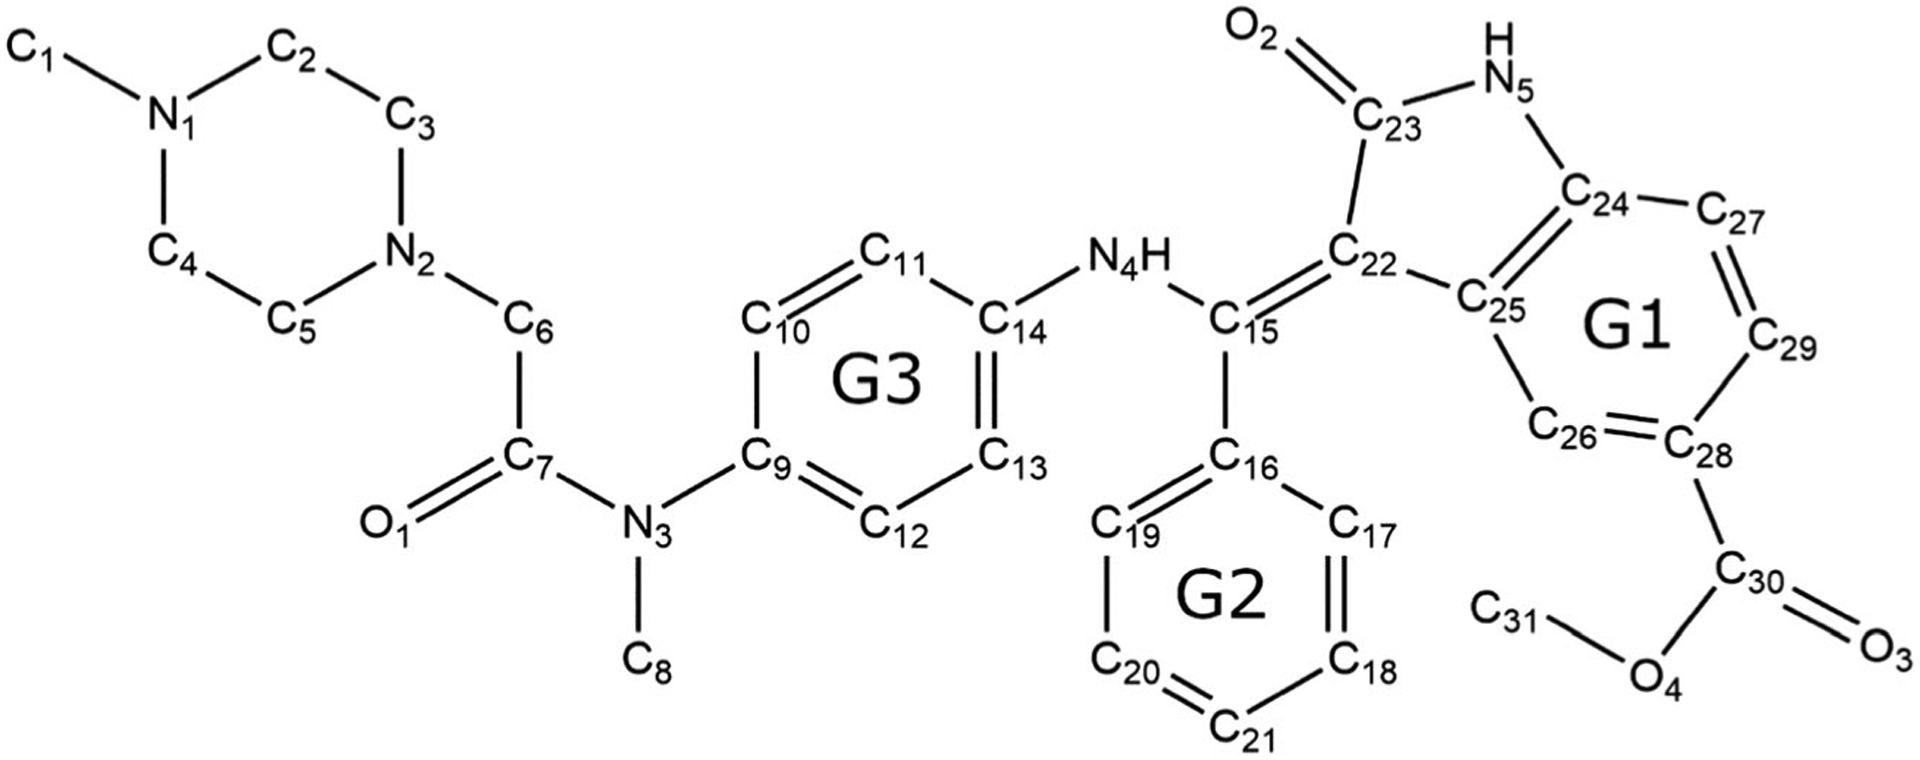
Structure of IN17. Atomic labels and ring group numbers are referred to throughout the paper
There has been a recent revival of interest in the toolkit of protein-ligand binding free energy calculations [20]. The long simulation runs necessary to calculate binding free energy have long been possible in fixed point charge based forcefields such as AMBER [21–24] and CHARMM [25–28]. However, these forcefields often fail at reliably modeling highly charged compounds (like IN17), and transferable binding free energy prediction is a goal that has yet to be reached [29]. This suggests that much work on improvements to forcefield and sampling schemes is needed for physics-based simulation to reach its full potential.
One approach to improve upon the accuracy of fixed charge models is to utilize polarizable force fields such as AMOEBA [30–32]. The AMOEBA forcefield is characterized by the inclusion of electrostatic polarization via induced dipoles, as well as the addition of atomic dipole, and quadrupole electrostatic terms. Previous studies have utilized the AMOEBA forcefield to calculate the hydration free energy of small molecules [33–35] and metal ions [36–38], in addition to ligand binding free energy to synthetic hosts [39] and proteins [32, 40–44]. However, until recently, the computational speed of AMOEBA has been a limiting factor for ligand throughput and sampling. The recently developed Tinker-OpenMM platform enables a 30-fold enhancement over what is possible in a single CPU process through the use of GPU computation [45]. In this study, we utilized the Tinker-OpenMM platform to perform protein–ligand binding studies at a scale that was infeasible using previous CPU approaches. Given the large size and highly charged nature of the IN17 ligands, we expect the polarization, dipoles and quadrupoles present in AMOEBA are necessary for accurate modeling.
Methods
Parameterization
Initial parameters for IN17 and nintedinib were generated as previously described using POLTYPE [31]. Torsion parameters for all rotatable bonds were derived manually by fitting to Gaussian 09 [46] QM energy at MP2/6–31G* in gas phase. These rotatable bonds were entered into the valence.py file provided in POLTYPE, enabling the parameterization of IN17 derivatives without recalculating these torsional parameters. The IN17 derivatives were then parameterized using POLTYPE with this new torsional dictionary. In order to speed up the structural optimization of IN17 and derivatives, POLTYPE was modified to run initial structural optimization at wB97XD/6–31G*.
Simulation parameters
Unless otherwise noted, all simulations were run using a 3.0 fs time step with the heavy-hydrogen option in order to increase stability at this longer time step. This keyword moves some of the mass from the heavy atom to the hydrogen [47]. MD Frames written out every 2 ps at a temperature of 298 K. All simulations used the r-RESPA integrator and the BUSSI thermostat. All constant pressure simulations were conducted using the Monte Carlo barostat. All binding simulations utilize a harmonic restraint between the G2 moiety to the centroid of a group consisting of I16 and Y87, which is turned on gradually as the interactions between ligand and surrounding is decoupled (more details in Binding free energy simulations). The restraint uses a reference distance of 4.7 Å and maximal restrain constant of 15 kcal mol−1 Å−1 (see SI).
Complex structure generation
The initial guess for the MELK structure with bound nintedanib was generated using 4BXY, docking nintedanib into the binding pocket using GOLD [48] at default settings. The resulting complex was minimized to 10.0 kcal mol−1 Å−1 with polarization off to resolve clashes, and again at1.0 kcal mol−1 Å−1 with polarization on. We then ran simulations for 0.3 ns at each temperature from 25 to 298 K at 1 Atm pressure, with temperature increasing at 25 K intervals, followed by 10 ns at 298 K with constant box size to equilibrate the system. After release of the PDBID 5MAF crystal structure, we prepared this structure for simulation in a similar manner. 5MAF has a gap in crystal density between residues 146 and 177. Therefore, the crystal structure PDBID 4IXP [49] was used to help resolve this extended loop gap between residues 156 and 171 of 5MAF using MODDELER as described previously [50]. This MELK-IN17 complex system was solvated in an 84.8 Å × 65.2 Å × 65.2 Å box of water using the Tinker “xyzedit” command. Two Mg+ ions, 41 Cl− ions, and 22 K+ ions were added manually to the water box at random locations to match experimental conditions. This loop was then heated as described above, with all atoms frozen except the modelled loop. This structure was then heated again as above without these added restraints to produce an equilibrated structure. The solvent phase was generated by soaking the ligand in a 59.8 Å × 46.6 Å × 46.6 Å equilibrated box of water using xyzedit, adding 1 Mg+ ion, 10 K+ ions, and 17 Cl ions to this box.
Binding free energy simulations
To generate initial structures of MELK-IN17 derivatives, the structure of IN17-MELK generated above was manually derivatized using Avogadro [51] by editing the IN17 ligand. Avogadro maintains rotational and translational frames, enabling the superposition of the generated derivatives onto apo-MELK. The structure of derivatives were put back into both the protein–solvent system with the water box generated above to produce initial structures of the complex and solvation systems for all the derivatives. The simulation systems were minimized to 10.0 kcal mol−1 Å−1 with polarization off to resolve steric clashes, and again at 1.0 kcal mol−1 Å−1 with polarization on. These complexes were then simulated for 3 ns at a constant volume and temperature at 298 K in a series of simulations with electrostatic lambda, which scales the electrostatic parameters of the ligand, gradually decreasing from1.0 to 0.0, followed by a series of simulations with vdWlambda, which scales the vdW interactions between ligand and surrounding using a softcore approach, decreasing from1.0 to 0.0. The exact lambda values for binding phase simulations, and for solvation phase simulations are available in Supplementary Table 1. The change in free energy, entropy and enthalpy for neighboring steps was calculated using Tinker “bar” program, using frames 150 to 1500. The correction due to the distance restraint and standard concentration was calculated using Tinker “freefix” program, which equals1.38 kcal mol−1. The binding free energy was then calculated as ΔG of complexation −ΔG of solvation + the correction described above.
IN17 solvent phase crystal structure
MELK-In-17 was dissolved in 5% methanol in dichloromethane in a vial. The vial was wrapped with aluminum foil; small holes were made to the foil. The solution was allowed to sit for 3 days to give crystals suitable for X-ray crystallography. Crystals grew as long, colorless needles by slow evaporation of methanol in dichloromethane. The data crystal was cut from a larger crystal and had approximate dimensions; 0.27 × 0.05 × 0.05 mm. The data were collected on an Agilent Technologies SuperNova Dual Source diffractometer using a μ-focus Cu Kα radiation source (λ = 1.5418 Å) with collimating mirror monochromators. A total of 583 frames of data were collected using ω-scans with a scan range of 1° and a counting time of 23 s per frame with a detector offset of ±42.4°, and 70 s per frame with a detector offset of ± 110.4°. The data were collected at 100 K using an Oxford 700 Cryostream low temperature device.
Results and discussion
Aryl-carbonyl isomerism
During initial structural studies of IN17, we realized the possibility that the C28–C30 bond (Fig. 1) of nintedanib (as well as IN17) has partial double bond character. Thus, there is a possibility of two distinct conformational isomers (cis vs trans) due to the rotation around this bound, likely leading to different binding energies. Indeed, simulations predict an approximately 1 kcal mol−1 difference in binding free energy between the two carboxyl isomers. In order to determine if these two isomers can readily interconvert, we calculated the quantum mechanical (QM) rotation barrier of the C28–C30 bond of IN17. QM calculations predict a 8 kcal barrier of rotation in solvent (using polarizable continuum method (PCM) [52]), and a 14 kcal in gas phase (Fig. 2). This barrier would be largely inaccessible at room temperatures, indicating that, once synthesized, this group is unlikely to swap between the two carboxyl isomers. In order to determine the most likely isomeric state of the carboxyl tail, a solvent phase crystal structure of IN17 was determined (Supplementary Fig. S1). This crystal structure displays a well resolved carboxyl tail, indicative of only one isomer being formed in solution. Similar isomerism may exist in other drug compounds, limiting potency. Further research is required in order to test this hypothesis.
Fig. 2.
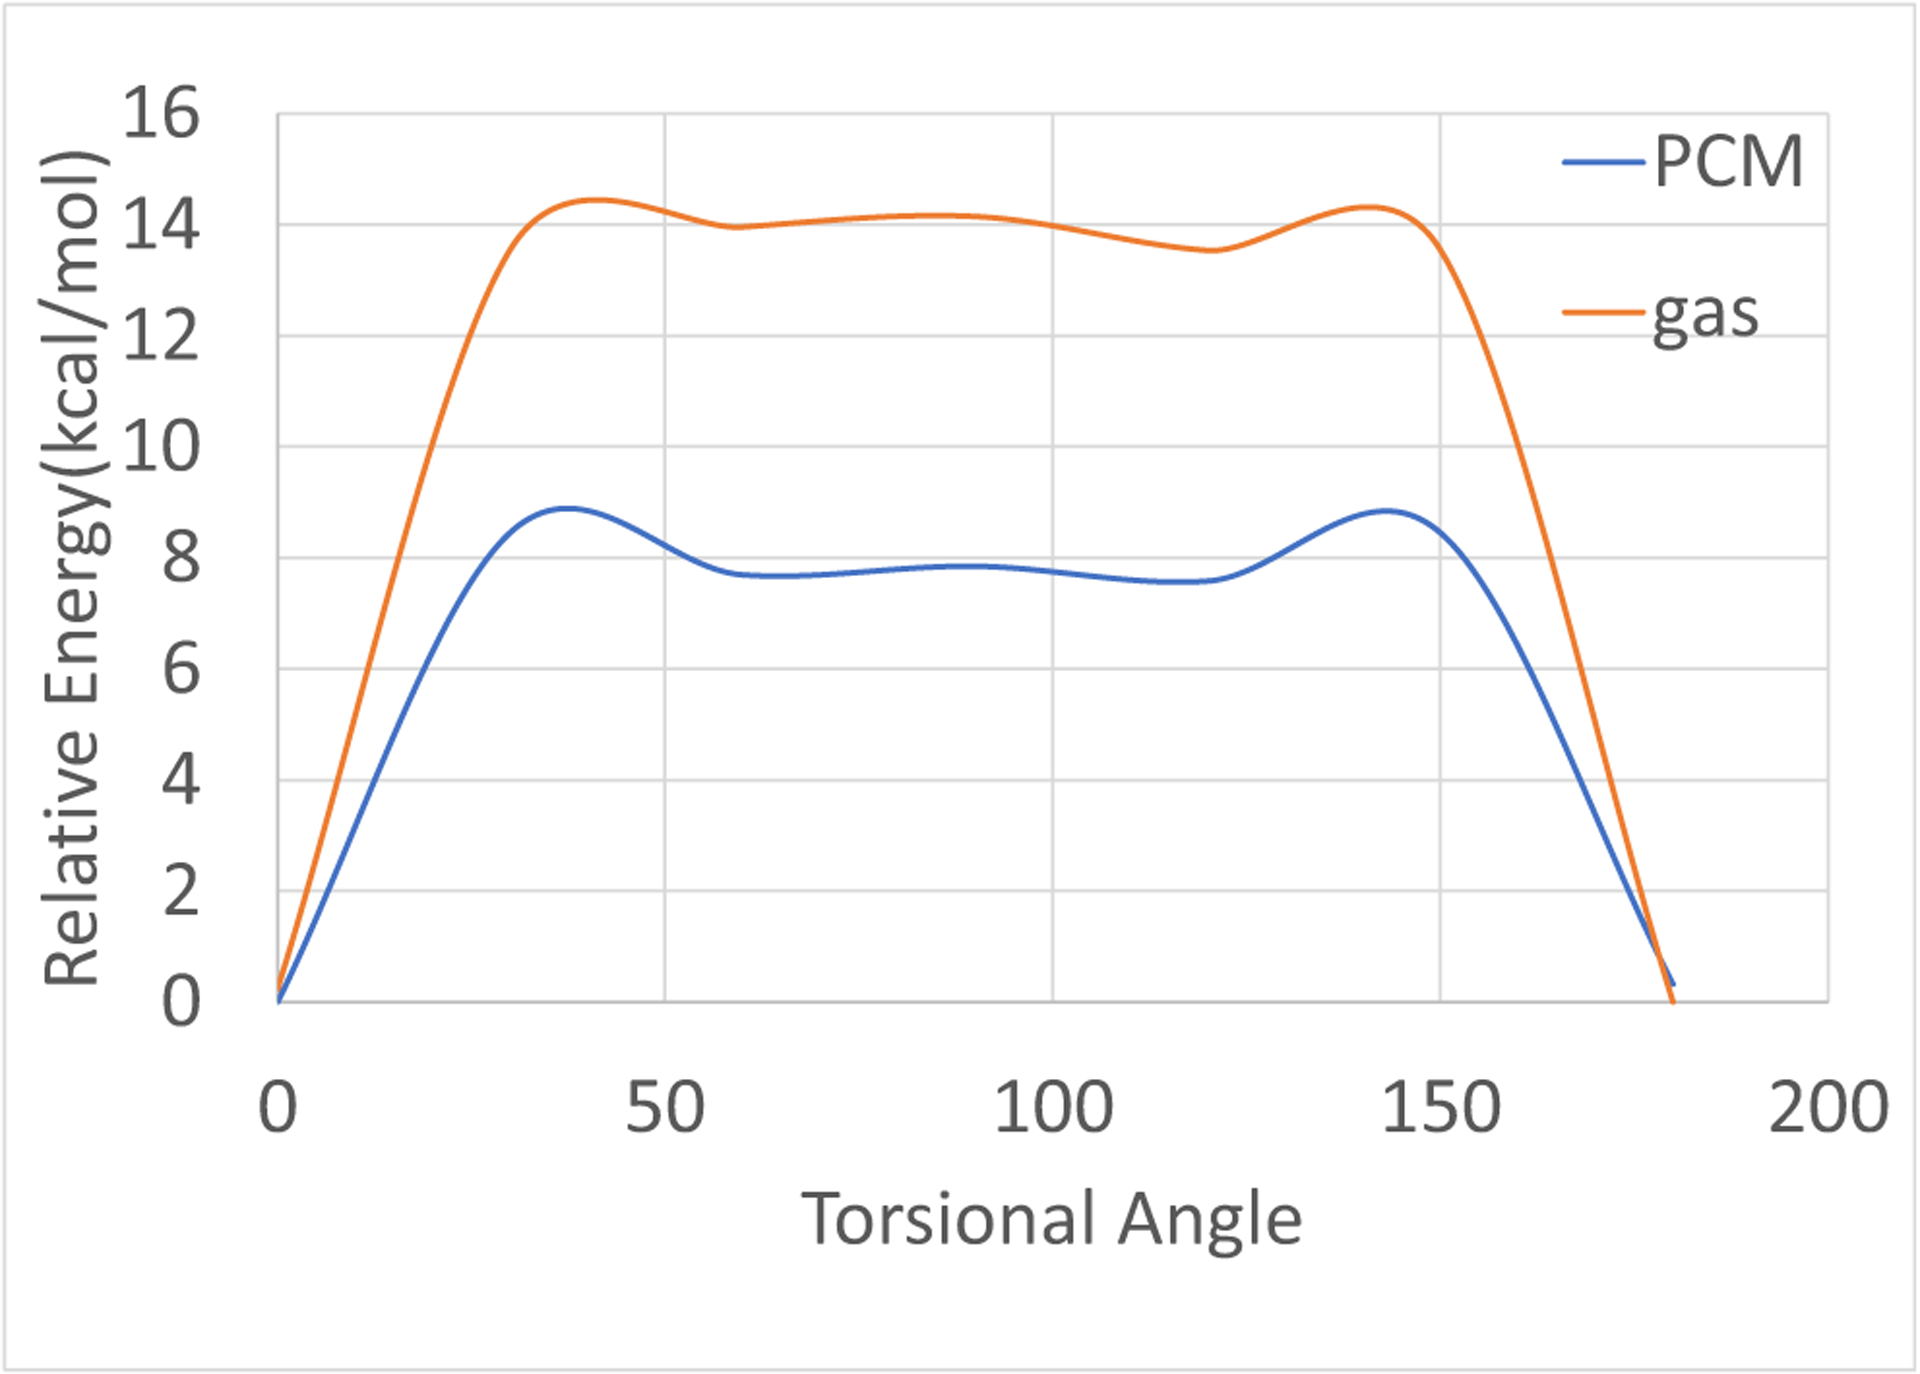
Rotational barrier for the O3–C30–C28–C29 torsion of IN17. The polarizable continuum method (PCM [52]) was used to capture the solvent effect. All quantum mechanical (QM) energies were calculated using MP2/6–311 + G**, with rotations at every 30 degrees
MELK-nintedanib complex structural prediction
To date, no crystal structure of the MELK-IN17 complex exists. On the other hand, nintedanib is a well-studied MELK inhibitor [19, 53] that differs from IN17 only in the location of the carboxyl tail on the indole ring (in nintedanib, the carboxyl tail is attached to C29 in Fig. 1). We first modeled the MELK-nintedanib complex structures by using virtual docking and Tinker-OpenMM MD simulations. Using GOLD, nintedanib was docked into the only ligand-bound crystal structure of MELK available at the time (PDB ID 4BKY [54]), which was then used as a starting point for 10 ns of MD simulations, as described in the Methods section. A MELK-nintedanib structure (PDB ID 5MAF [55]) was released after our initial simulations. In this crystal structure, the nintedanib carboxyl ester exists in a configurational state consistent with one of the isomers discussed above. The structure of MELK in 5MAF is in good agreement with the end state from Tinker-OpenMM simulation, with a Cα RMSD of 1.5 Å (Fig. 3a). Overall, the ligand and binding site residues from simulations adopted poses similar to those in 5MAF (Fig. 3b). This is an indication that the AMOEBA forcefield can capture realistic protein-ligand complex structures for this class of compounds. However, one major discrepancy was observed between the modeled nintedanib-MELK complex and the newly released crystal structure 5MAF. N1 of the piperazine moiety of nintedanib, rather than being free in solution as predicted by docking and MD simulations based on 4BKY, was bound to residue Glu14 in the 5MAF. This interaction was missed in the initial modeling, as this N-terminal region was not resolved in the 4BKY crystal structure. While 5MAF shows that the piperazine of nintedanib is interacting with Glu14 residue in the crystal, the relevance of this interaction in solution, where the buffer and solvent conditions are different, has not been established. Further discussion of this interaction is presented below.
Fig. 3.
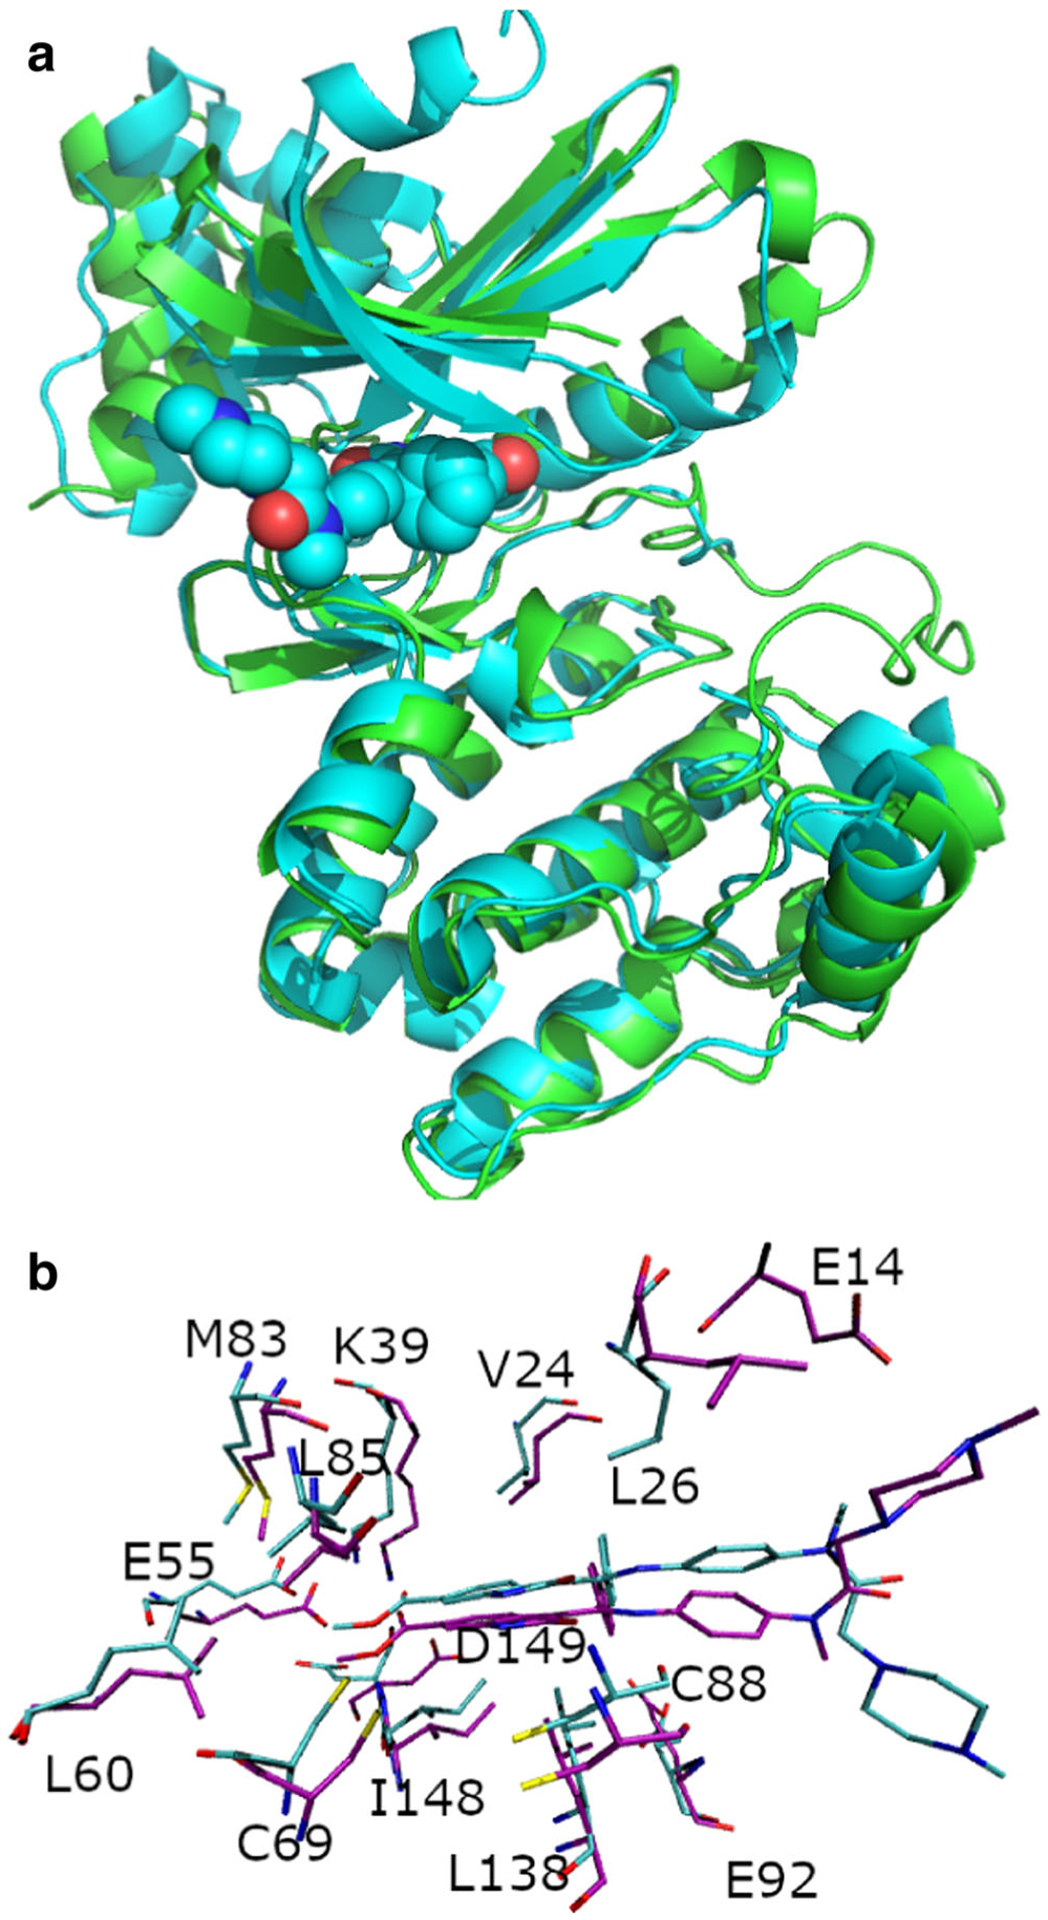
a Superposition of crystal structure 5MAF (cyan) and simulation endstate of a maternal embryonic leucine zipper kinase (MELK) nintedanib simulation of 10 ns (green). For clarity, the nintedanib ligand from the simulation is omitted. b Comparison of the binding site structure of the simulation of nintedanib-MELK (cyan) and the 5MAF crystal structure (purple)
Absolute binding free energy of MELK with IN17
Predicting the absolute binding free energy computationally is more challenging than predicting the relative affinities, where error cancellation often occurs. First, we wanted to determine this pipeline’s capabilities in predicting the absolute binding affinity of IN17. Initially, before the publication of the crystal structure of the MELK–nintedanib complex, we utilized a MELK-IN17 complex structure, predicted using docking to MELK as a starting point for MD and free energy simulation. Simulations based on PDB 4BKY lacked the first 20 residues, including Glu14. This series of simulations resulted in a binding free energy of −12.4 ± 0.1 kcal mol−1, in reasonable agreement with experiment (−13.3 kcal mol−1).
When a crystal structure of the MELK-nintedanib complex (PDB ID 5MAF) was released, this structure was used to generate a MELK-IN17 complex by removing the carboxyl tail and manually adding the carboxyl methyl ester to the C28 position. The predicted MELK-IN17 complex was then used as a starting point for free energy simulation. The main difference is an additional interaction between the positively charged piperazine group of the ligand and the negatively charged Glu14, observed in the crystal structure. One uncertainty is the protonation state of the piperazine moiety. The nitrogen near the terminal of the ligand (N1 in Fig. 1) is more likely to be protonated due to the inductive effects of the carbonyl group (C7 = O1). Simulations of the MELK-IN17 complex in this charge state results in a strong Glu14-IN17 interaction and a binding free energy of −18.3 ±0.2 kcal mol−1, i.e., 5 kcal mol−1 more negative than the experimental result of −13.3 ± 0.1 kcal mol−1 On the other hand, if the piperazine is deprotonated at the N2 position, this interaction between piperazine and Glu14 essentially disappears, giving a binding free energy of −13.7 ± 0.2 kcal mol−1, in good agreement with experiment (−13.3 ± 0.1 kcal mol−1).There is possibility that the Glu14-piperazine salt-bridge interaction may not be important or present in solution, as opposed to in the crystal lattice.
In addition, the experimental measurement was performed at very high buffer concentration (50 mM vs 10 nM for protein), which can affect interaction of this pair due to the buffer agent (HEPES) being able to bind in the protein pocket [56, 57]. Note that the HEPES or 4-(2-hydroxyethyl)-1-piperazineethanesulfonic acid, also contains the same piperazine moiety. It is therefore expected to compete with the piperazine group in IN17 when binding to Glu14, especially given the buffer agent concentration is several orders of magnitudes higher than that of ligand. We computed the binding free energy of HEPES to Glu14 to be −8.4 ± 0.2 kcal mol−1. The calculated absolute binding free would be in agreement with experimental measurement if we take into account the protonation state and/or buffer competition. Nonetheless, for the relative affinities among IN17 and its derivatives, the contribution of this piperazine group cancels and becomes irrelevant. In addition, this overprediction of affinity could be due to modeling too much average charge on the piperazine nitrogen, or due to misprediction of the protonation state of the piperazine group.
IN17 binding mode
Most of the close interactions present in the IN17 binding mode (≤0.3 nm in Fig. 7) are also observed across all derivatives in our simulations. The protein–ligand contacts are largely between hydrophobic groups, with the relative positioning of Ile16, Gly17, Ala37, and Leu138 serving to provide a tight groove for IN17 binding (Fig. 4). Other than the Glu14 interaction described above as a potential point of electrostatic contact, few strong electrostatic contacts are present. Cys88 forms hydrogen bonds with the ligand atoms O2 and N4, constraining the relative orientation of the G2 and G3 of the ligand. HN5 of the indole group in IN17 forms a hydrogen bond with the backbone carbonyl of Asp86, but this interaction is unlikely to add specificity. The ester carbonyl tail (COOC) interacts mainly with Lys39, with some hydrophobic interaction with Val24.
Fig. 7.
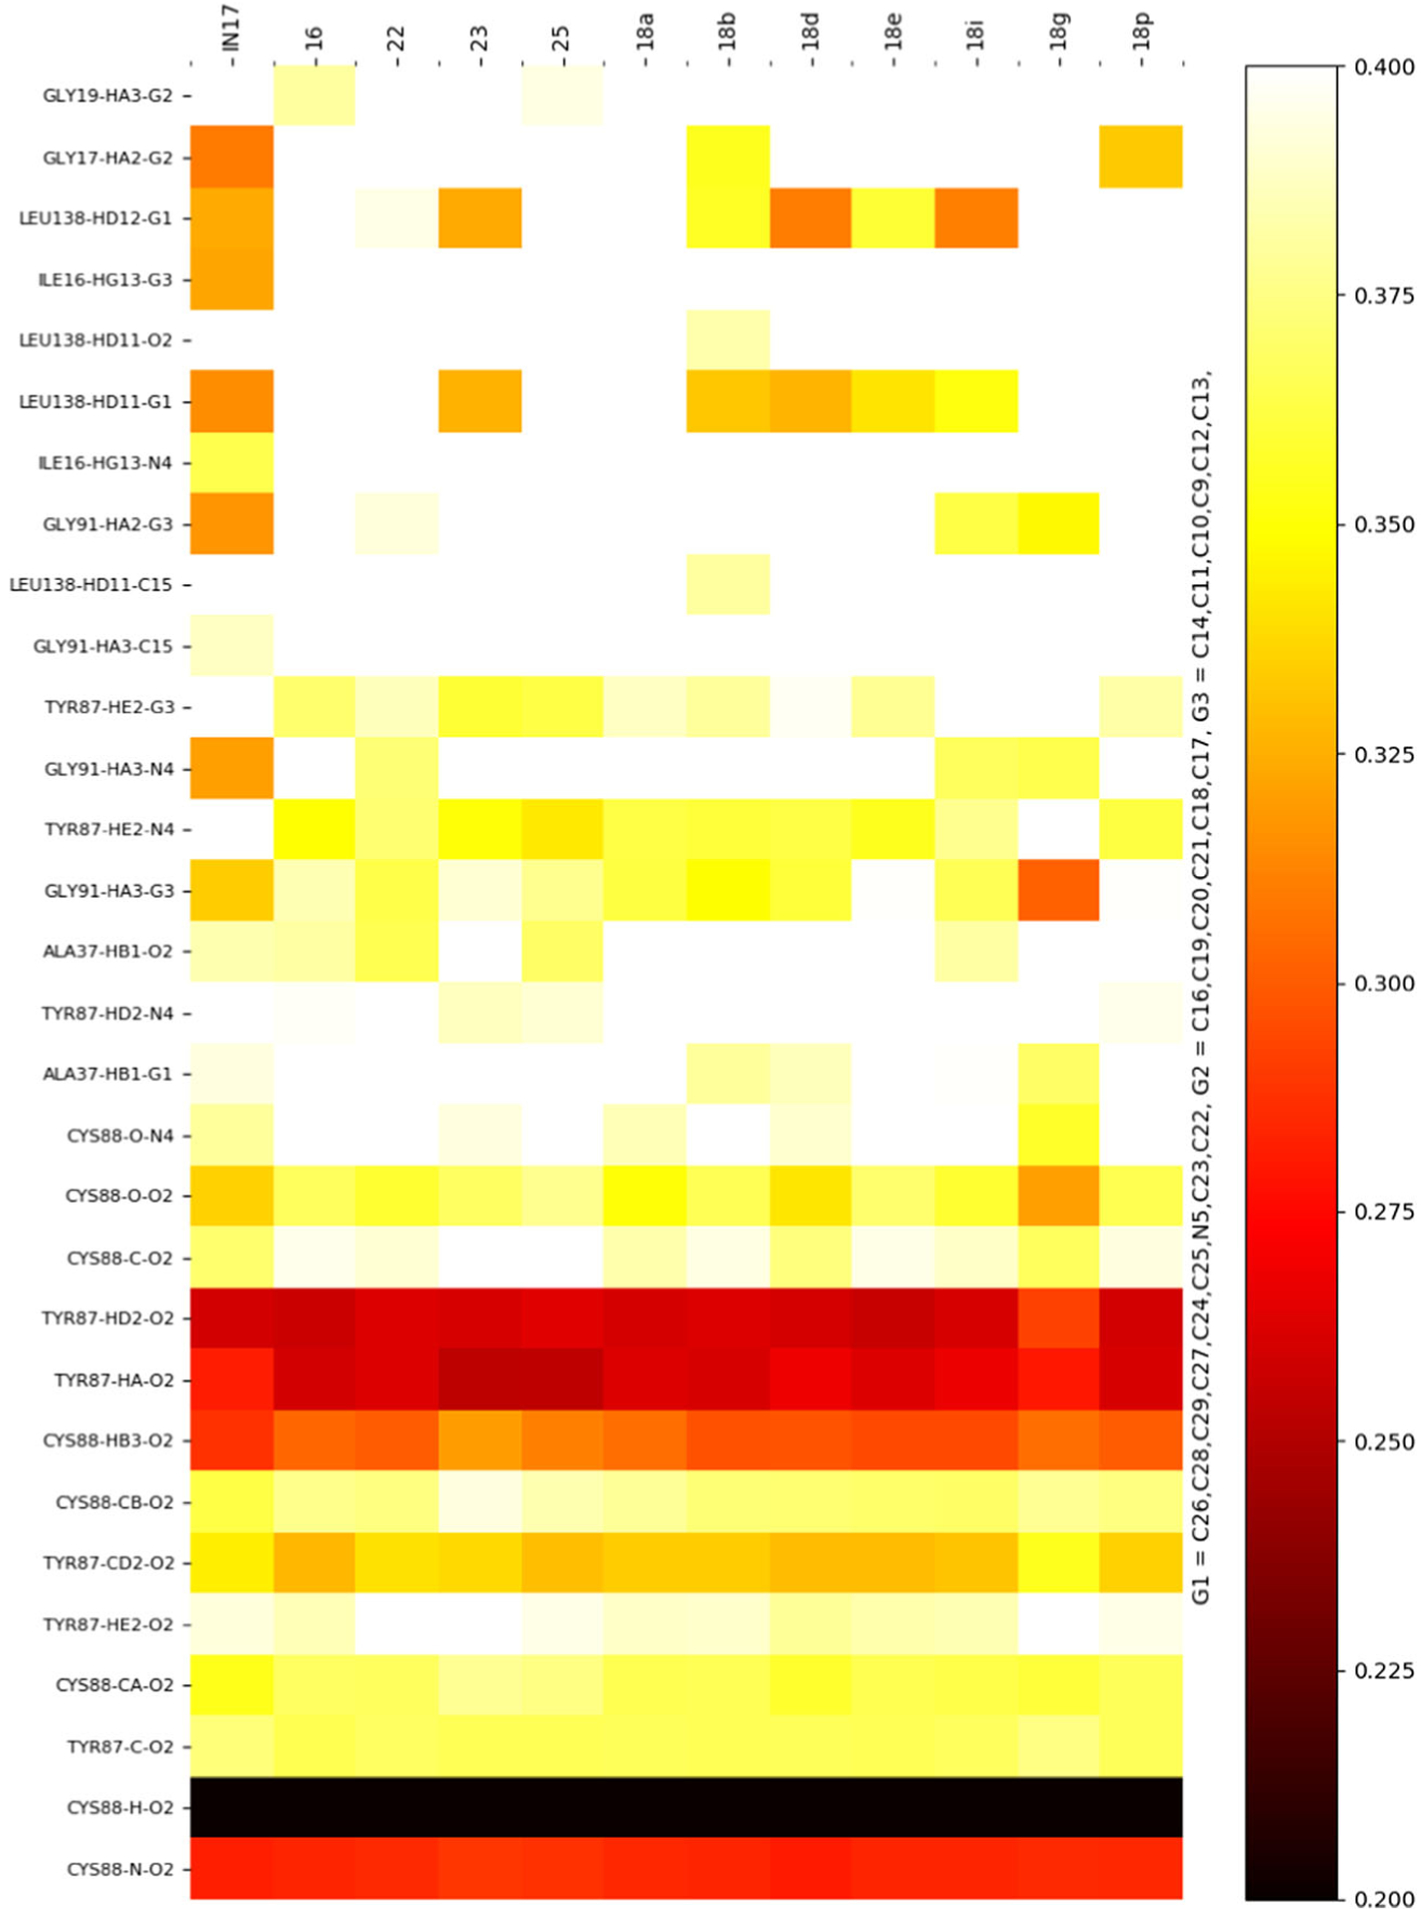
Heatmap of ligand–protein interactions across all studied ligands. Color corresponds to average contact distance (nm) across all 3 ns of molecular dynamics (MD) simulation. The heatmap is ordered by most conserved interactions across all derivatives
Fig. 4.
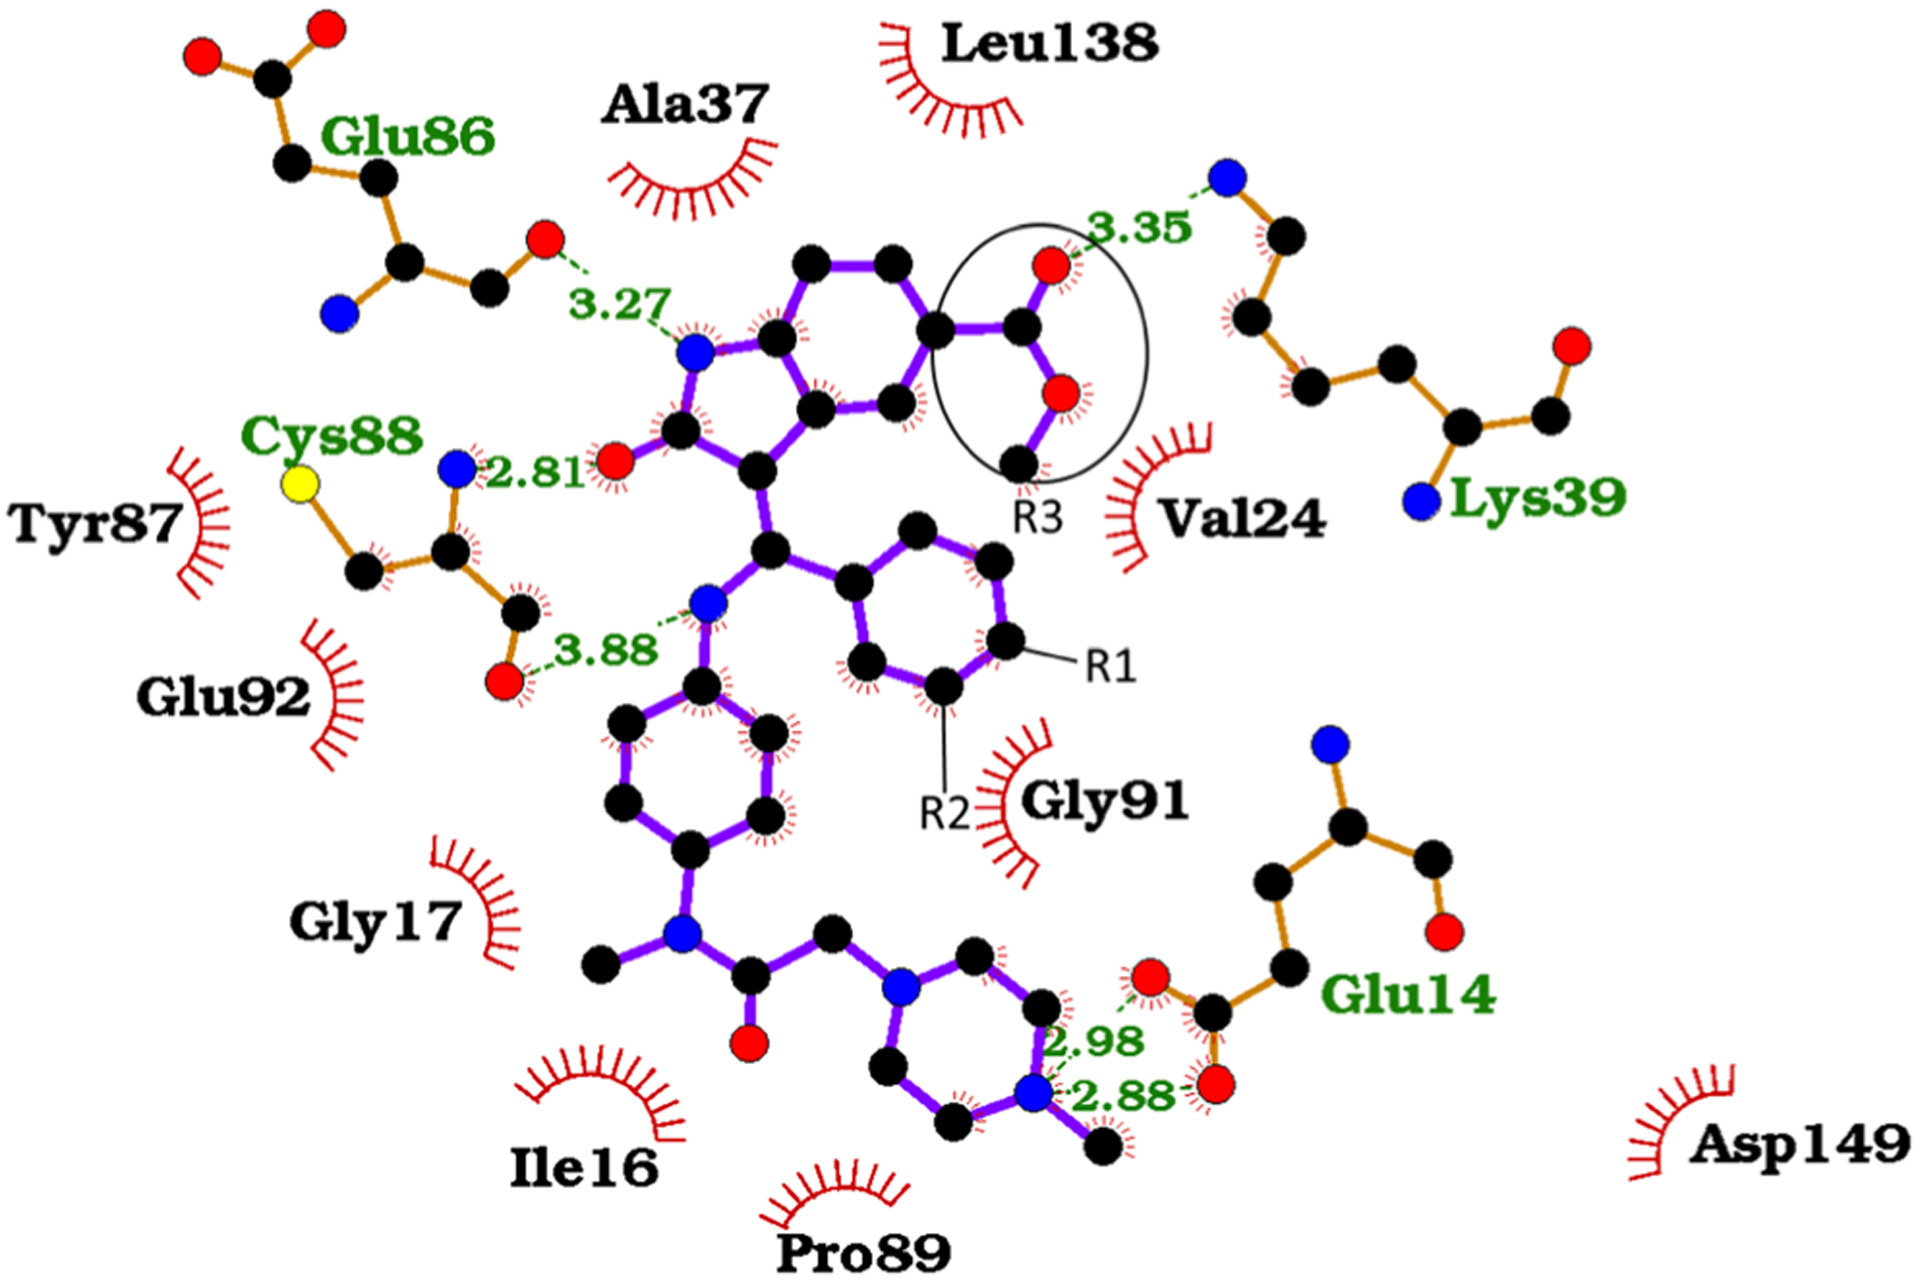
Interaction map of IN17 MELK binding. The positions of substitution groups R1, R2, and R3 are labeled. Image generated using Ligplot+ [56]
Relative binding free energy of IN17 derivatives
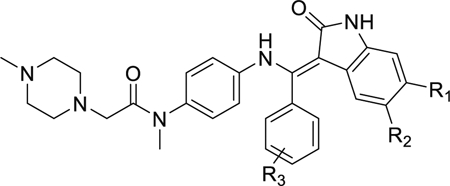
After gaining an understanding of the binding mode of IN17, we wanted to determine the effects of compound derivitization on ligand binding. In order to attempt to add electrostatic contacts and potentially improve affinity and selectivity, electronegative groups were added to the central polar benzene moiety (R1 and R2 in Table 1). Since the meta and para positions of the central benzene ring (G2 in Fig. 1) are pointed towards the protein and did not appear to have severe steric constraints, the meta and para positions on this ring were chosen for derivitization. In addition, the importance of the carboxyl tail in IN17 (R3 in Table 1) was not well understood, so we performed studies where the carboxyl tail was removed or lengthened. Since it was uncertain if the piperazine ring was binding E14, the arbitrary decision to proceed with calculations as if this interaction was occurring was made. Since all substitutions were at positions of IN17 far away from the piperazine group, binding energy relative to IN17 should be unaffected by this decision.
Table 1.
Groups present at R1, R2, and R3 for the derivatives tested
| Compound | R1 | R2 | R3 |
|---|---|---|---|
| IN17 | H | C(=O)OCH3 | H |
| 16 | H | H | H |
| 22 | C(=O)NH(CH2)3N(CH3)2 | H | H |
| 23 | C(=O)NH(CH2)3NH2 | H | H |
| 25 | H | C(=O)N(CH3)2 | H |
| 18a | H | C(=O)OCH3 | p-NO2 |
| 18b | H | C(=O)OCH3 | p-NH2 |
| 18d | H | C(=O)OCH3 | p-C(=O)OCH3 |
| 18e | H | C(=O)OCH3 | p-OCH3 |
| 18i | H | C(=O)OCH3 | m-, p-[1,3]-dioxol |
| 18g | H | C(=O)OCH3 | m-OCH3 |
| 18p | H | C(=O)OCH3 | m-NO2 |
Overall, experimental affinity relative to IN17 was predicted with an optimal RMSD of 0.8 kcal mol−1, a raw RMSD of1.1 kcal mol−1 (Table 2), and an R2 value of 0.75 (Fig. 5). The Kendall’s tau (a measure of relative rank order of compounds) was 0.50. This level of accuracy is sufficient to determine which compounds are unlikely to bind effectively to a target protein, such as in compounds 22 and 23. This ability to predict non-binding compounds would potentially allow for prediction of compound selectivity across a range of related proteins.
Table 2.
Computational predictions and experimental binding energies (in kcal mol−1)
| Relative predictiona | Relative experimentala | |
|---|---|---|
| 18a | 2.2 | 0.6 |
| 18b | 1.3 | −0.6 |
| 18d | 1.5 | 0.7 |
| 18e | −0.3 | −0.1 |
| 18g | 1.1 | −0.5 |
| 18i | 1.0 | −0.1 |
| 18p | 1.0 | 1.6 |
| 16 | 0.9 | 0.4 |
| 22 | 4.9 | 4.4 |
| 23 | 3.7 | >4.7 |
| 25 | 2.6 | 2.2 |
All relative values use the IN17 value as 0 kcal mol−1. As explained in the main text, additional restrained simulation was used to obtain binding free energy for compound 18 g. To within one decimal place, uncertainty for each of the relative predictions is 0.2 kcal mol−1, and uncertainty in the experimental values is 0.1 kcal mol−1. Optimal RMSD is0.8 kcal mol−1, and raw RMSD is 1.1 kcal mol−1
Fig. 5.
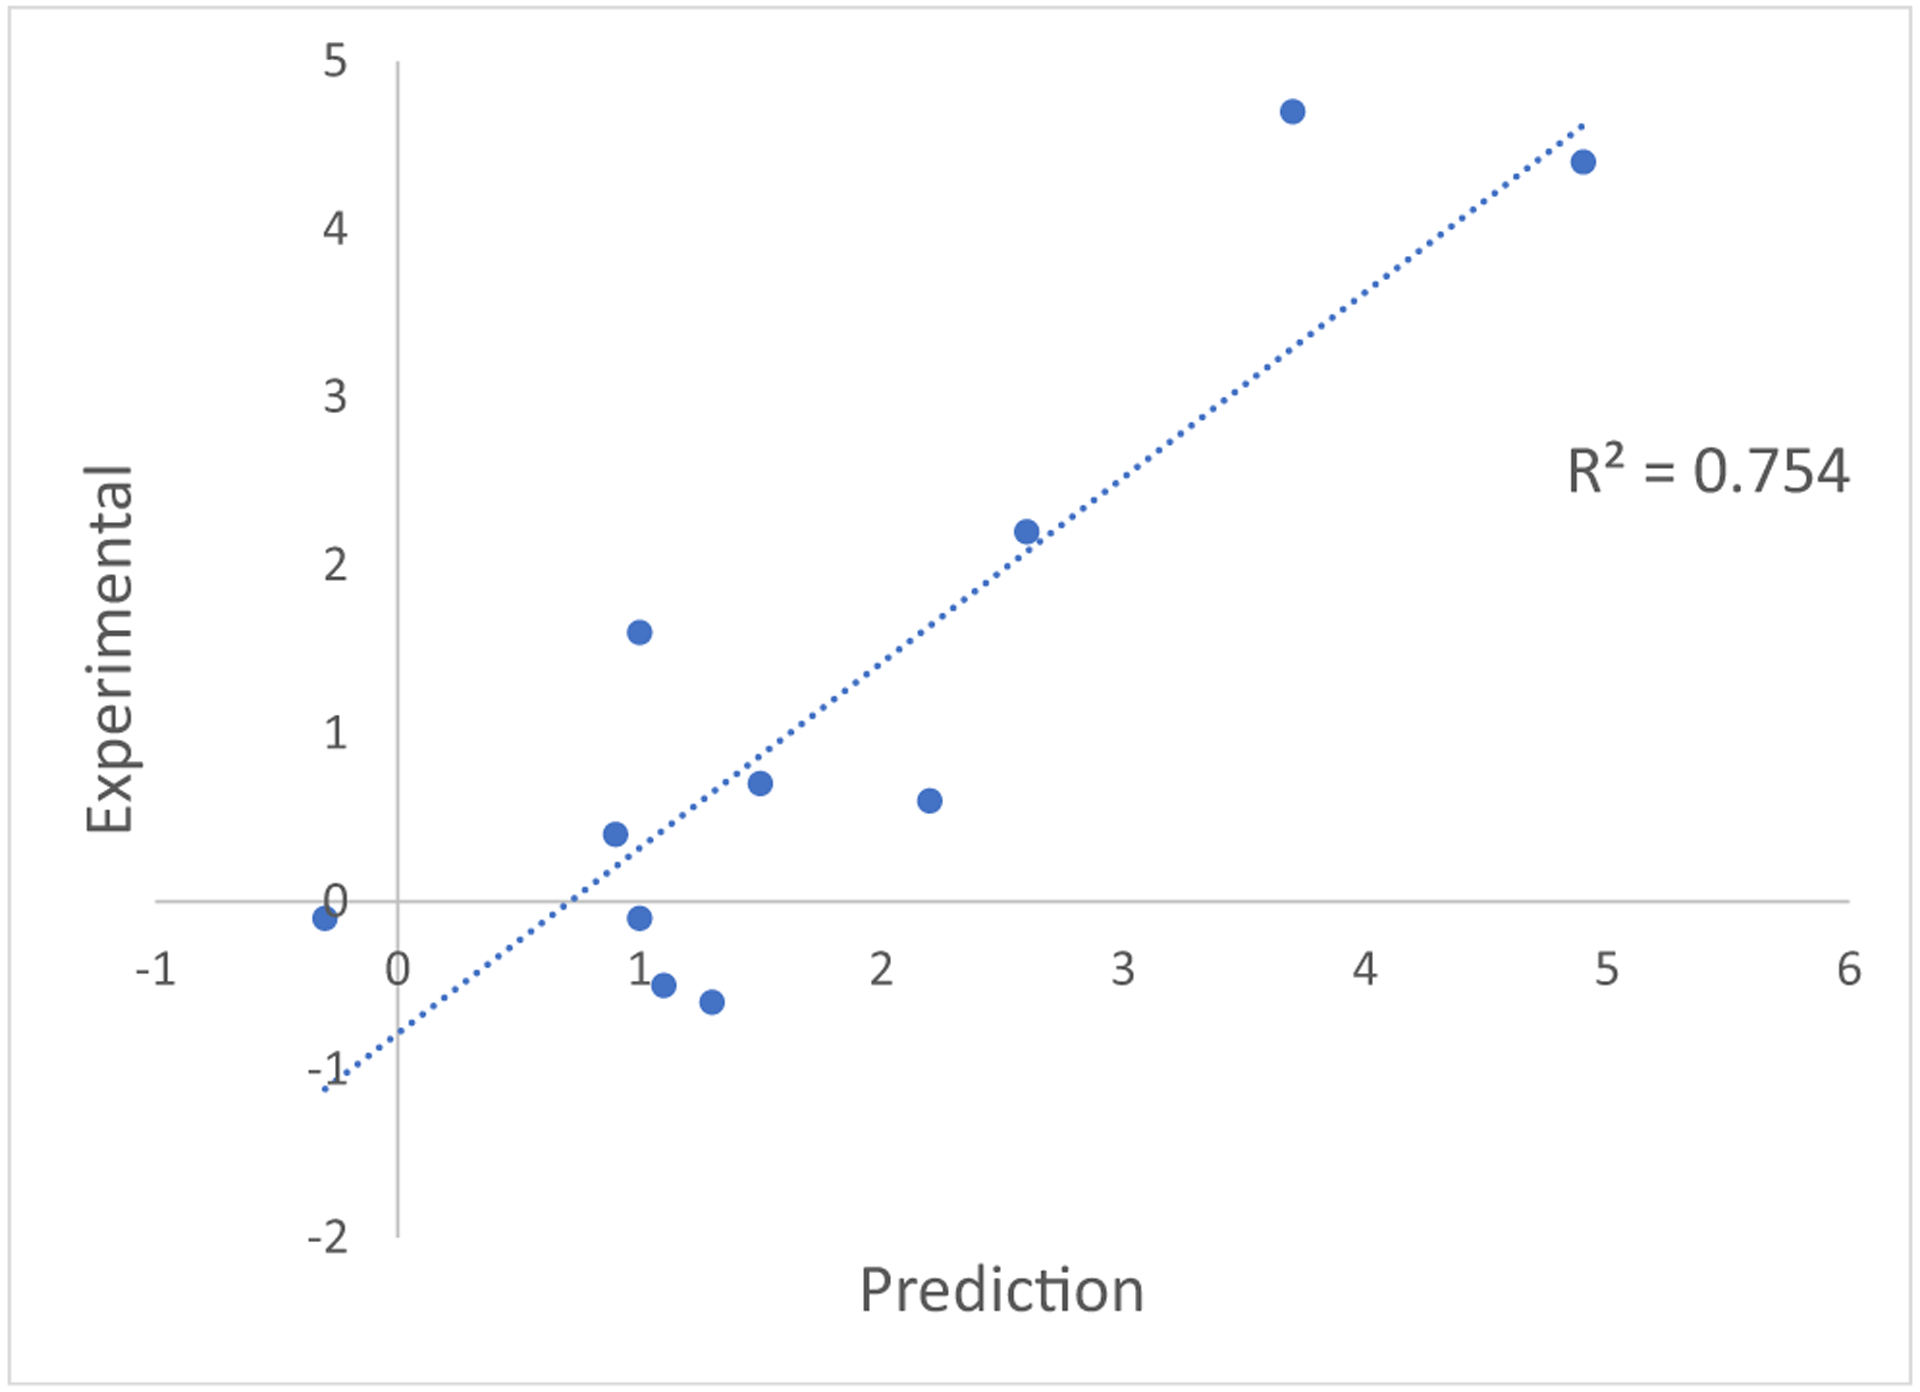
Correlation between experimental binding affinity and computational prediction. All values in kcal mol−1
N-terminal loop structure is altered by substitution on the benzene (G2) offshoot
Substitution at the central benzene ring (G2 in Fig. 1) can result in alterations in neighboring beta-sheet structure near the binding pocket (Fig. 6). In IN17 simulations, this beta sheet is shortened by a bulge that results in hydrophobic packing against the exposed edge of the G2 benzene ring. Interestingly, in the nintedanib structure (PDB ID 5MAF), this loop bulging is not observed, suggesting that the crystal structure of nintedanib provides an inaccurate representation of certain aspects of loop dynamics. Another explanation is that the lack of loop bulging in 5MAF could be a result of cross crystal contacts (this loop is surface exposed). When electronegative groups are added directly to atom C21, as in derivatives 18a, 18e, 18 g, 18i and 18p, this region forms a beta sheet, with interactions occurring between the electronegative atom and HN of Thr18 (Fig. 6). When a carboxyl ester is added to the C21 position (as in ligand 18d), the beta sheet structure distorts into a loop to form interactions with the carbonyl oxygen of the carboxyl methyl ester substitution group. The observation that a beta sheet is not formed in the 18d complex is likely due to rigid structural requirements for formation of this beta sheet–ligand interaction. The protein beta sheet structure is rigidly defined, as is the relative positioning of C21 and the neighboring indole group. This rigidity results in not enough backbone or ligand flexibility to form this backbone-ligand interaction unless the para carbon (C21) is directly connected to an electronegative atom. This rigid structural element combined with the knowledge of this alternative beta sheet form should result in improved ability to predict the structural effects of substitution on this ring.
Fig. 6.
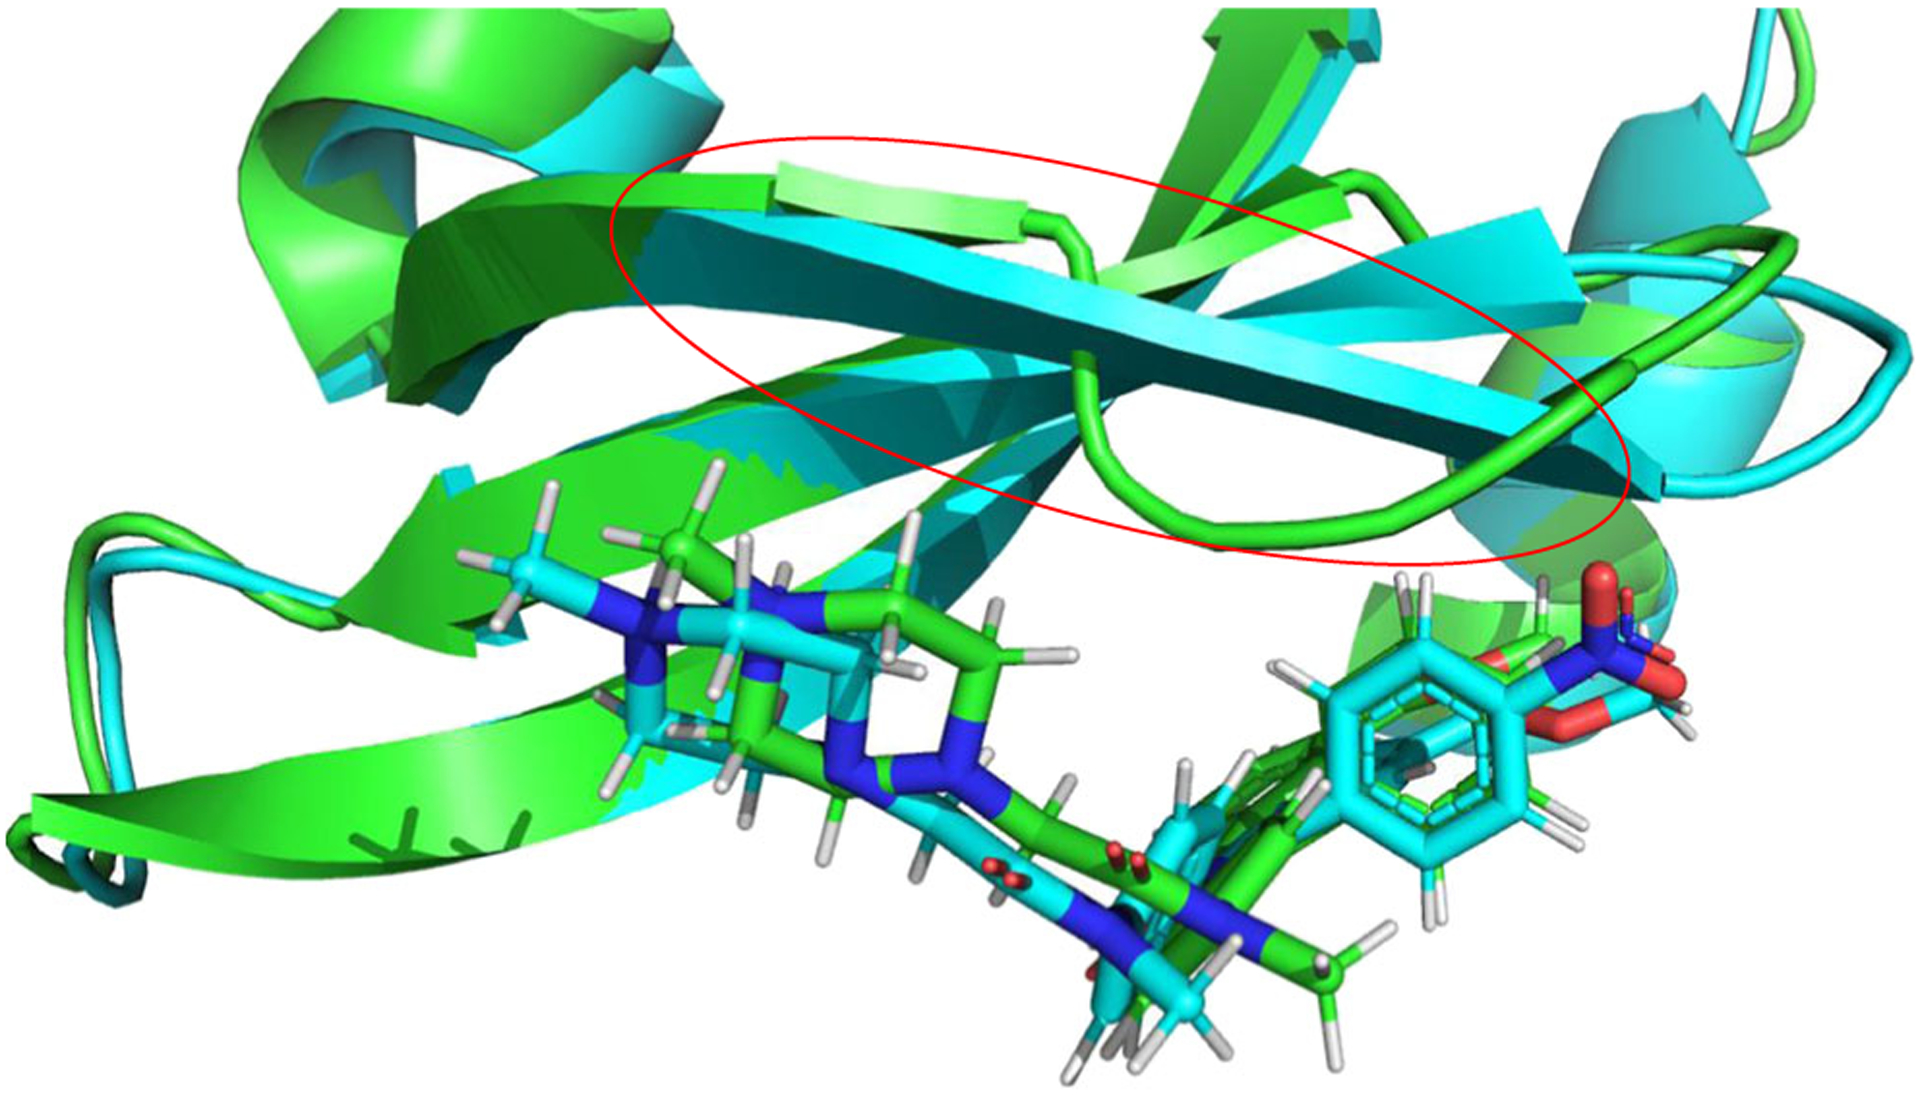
Comparison of IN17 simulation structure (green) and 18a simulation structure (cyan). Only the first 50 residues are shown for clarity. The loop structure discussed in main text is enclosed in the red circle
Effects of substitution on binding mode
Compared to IN17, the substitution process largely resulted in only minor changes in contact distance, with most interactions being maintained across all derivatives (Fig. 7). The exceptions to this are mostly residues Gly17 and Gly91, both of which maintain close contacts in IN17, but not in many of the tested derivatives. Interestingly, the neighboring Ile16 is a strictly maintained interaction, indicating that the alteration of the structure of the loop containing Gly17 are minor, and that interactions between the ligand and Ile16 are likely essential for IN17 and derivative binding. Gly91 is proximal to the derivatized C28, so alterations in structure in this region are expected. This is consistent with substitutions at this group leading to alterations to the first shell of contacts around this ring, but only minor alterations occurring at other interaction sites. Any induced fit effects are likely to occur at timescales longer than effectively simulated using the AMOEBA forcefield.
Use of restrained equilibration to improve prediction
Compound 18 g represents a case were Tinker-OpenMM poorly predicted the binding free energy, with a relative prediction of 2.1 ± 0.2 kcal mol−1, significantly weaker than the experimental −0.5 ± 0.1 kcal mol−1 We hypothesized that this error was because the equilibration procedure was unable to capture the induced-fit effects involved in the fitting a methyl ether at the meta position, and thus resulted in an unstable pose. If this is the case, further restraining the ligand within the protein pocket and then running a longer equilibration simulation may result in a more stable starting configuration for free energy calculation.
In order to test the hypothesis, the 18 g starting point was equilibrated for 4 ns with a 3.0 kcal mol−1 Å−1 restraint between the terminal methyl carbon of Ala37 and O2 of 18 g, as well as between the nearest terminal methyl carbon of Val24 and C15. Both of the restraint distances were set to 3.5 Å. Since the indole moiety of this ligand is tightly bound, and both of these ligand atoms are nearby the R1 substitution point, this region of the ligand is closest to the system instability that resulted from R1 substitution. This end-state was then used as a starting point for free energy simulation, with a gradual reduction of these restraints in the first six simulation steps, as well as a two-step reduction of restraints at full interaction strength (ele and vdw-lambda = 1). Thus, the overall simulation end-states are identical to before, while the intermediate states now utilize additional contact restraints. This series of simulations resulted in a reduction of error in the relative binding free energy from 2.6 kcal mol−1 to 1.6 kcal mol−1, suggesting that additional equilibration with contact restraints can improve prediction for derivatives with strong perturbations. Further research is necessary on the general applications of contact restrain in free energy perturbation.
Entropy–enthalpy compensation
Post processing analysis of the free energy calculations enable an estimation of the enthalpic and entropic components of binding and solvation energies. Both binding and solvation entropies and enthalpies displayed a wide range of absolute values across the derivative series (supplementary Table S2), indicating that even these small changes to ligand structure can result in massive changes to both entropy and enthalpy, even if the final binding free energy has limited changes. This entropy–enthalpy compensation analysis also provides insight into why compounds with extended carboxy tails like compound 22 display relatively weak binding. The electronegative tail results in strong enthalpic interactions with MELK, indeed, the −150.8 ± 43.6 kcal mol−1 binding enthalpy is 56 kcal mol−1 more negative than IN17 and shows unfavorable enthalpic interactions with water (only −34.8 ± 31.3 kcal mol−1. However, the entropy losses associated with binding are significantly more negative than that of IN17, resulting in a ΔG that is less favorable than that of IN17.
In addition, the relative entropy-enthalpy differences between IN17 (with the carboxyl tail) and compound 16 (without the tail) reveals important thermodynamics contributions of this carboxyl tail to binding. Unexpectedly, the loss of entropy of binding is much greater for compound 16 (−76.4 kcal mol−1 vs. −23.0 kcal mol−1 for IN17). This cannot be easily explained by ligand entropy alone; one would expect constraining a large group would result in a greater entropy decrease. The most reasonable explanation for this is that compound binding excludes water from this pocket, resulting in these water molecules not experiencing the constrained protein environment. As expected, the presence of a carboxyl-ester tail in IN17 results in a large change in solvation entropy relative to compound 16 (−115.1 kcal vs −77.4 kcal TΔS), due to the presence of hydrophobic groups. Comparing IN17 to ligand 16, the 40 kcal mol−1 increase in TΔS almost exactly cancels the 37 kcal mol−1 increase in solvation enthalpy, and thus the overall binding free energy remains similar. The importance of interfacial waters is emphasized in the apo-MELK crystal structure(5TWU), which contains many structural waters in this pocket, indicating that this pocket is solvent exposed. Another interesting question is why IN17 displays a much lesser binding enthalpy than compound 16 (−94.87 ± 32.9 kcal mol−1vs −149.8 ± 32.8 kcal mol−1). IN17 likely disturbs the apo residue contact network, resulting in a loss of protein–protein contacts that is greater than the gain in protein–ligand contacts. For example, as explained above, the N-terminal beta-sheet is disrupted, causing a loss of protein hydrogen bonds without regaining strong electrostatic interactions. Thus, due to the entropic effects of binding and solvation, as well as disruption of the native protein contact network, the carboxyl group of IN17 causes little improvement in binding affinity vs. compound 16.
This series of simulations provides insight into the importance of entropy–enthalpy compensation. An increase in binding enthalpy is often, although not always, countered by a corresponding decrease in binding entropy. These simulation results illustrate that the exact magnitude of this change is incredibly challenging to predict based on structure alone. While one can estimate potential enthalpic interactions, without dynamics information, predicting important entropic effects is difficult, as are the effects of ligand binding on protein interaction networks. Computational predictions such as those performed in this study allow for an analysis of these effects in a way that cannot be easily assessed by experiment.
Conclusions
The state of computational free energy prediction technologies has reached a point where it can serve as a valuable addition to commonly used experimental and crystallographic approaches for the study of ligand binding structure and thermos-dynamics. To crystalize the number of derivatives utilized in this study would be highly costly and time prohibitive. However, molecular modeling techniques provide the ability to understand the structural effects of ligand derivatization of the ligand–protein complex in a matter of several days. Even in cases where the crystal structure is present, these structures ignore the dynamics of the system, which is easily captured by MD. This study has revealed multiple valuable insights into the binding mode of IN17 to MELK, including the importance of carboxyl tail isomerism, and the N-terminal loop/beta sheet interconversion. The application of free energy simulation technologies should enable more effective and efficient lead optimization, an application that is difficult and time-consuming using medicinal chemistry techniques.
Supplementary Material
Acknowledgments
The authors are grateful for support by grants from the National Institutes of Health (R01GM106137 and R01GM114237), the Cancer Prevention Research Institute of Texas grant (RP160657 and RP180880), and The Welch Foundation (F-1390).
Footnotes
This paper belongs to Topical Collection Festschrift in Honor of Nohad Gresh
Electronic supplementary material The online version of this article (https://doi.org/10.1007/s00894-019-4036-1) contains supplementary material, which is available to authorized users.
Publisher’s note Springer Nature remains neutral with regard to jurisdictional claims in published maps and institutional affiliations.
References
- 1.Joshi K et al. (2013) MELK-dependent FOXM1 phosphorylation is essential for proliferation of glioma stem cells. Stem Cells 31(6): 1051–1063 [DOI] [PMC free article] [PubMed] [Google Scholar]
- 2.Gu C et al. (2013) Tumor-specific activation of the C-JUN/MELK pathway regulates glioma stem cell growth in a p53-dependent manner. Stem Cells 31(5):870–881 [DOI] [PMC free article] [PubMed] [Google Scholar]
- 3.Wang Y et al. (2016) Mitotic MELK-eIF4B signaling controls protein synthesis and tumor cell survival. Proc Natl Acad Sci USA 113(35):9810–9815 [DOI] [PMC free article] [PubMed] [Google Scholar]
- 4.Gray D et al. (2005) Maternal embryonic leucine zipper kinase/murine protein serine-threonine kinase 38 is a promising therapeutic target for multiple cancers. Cancer Res 65(21):9751–9761 [DOI] [PubMed] [Google Scholar]
- 5.Li YF et al. (2013) Network-based approach identified cell cycle genes as predictor of overall survival in lung adenocarcinoma patients. Lung Cancer 80(1):91–98 [DOI] [PMC free article] [PubMed] [Google Scholar]
- 6.Ryu B et al. (2007) Comprehensive expression profiling of tumor cell lines identifies molecular signatures of melanoma progression. PLoS One 2(7):e594. [DOI] [PMC free article] [PubMed] [Google Scholar]
- 7.Komatsu M et al. (2013) Molecular features of triple negative breast cancer cells by genome-wide gene expression profiling analysis. Int J Oncol 42(2):478–506 [DOI] [PubMed] [Google Scholar]
- 8.Al-Ejeh F et al. (2014) Meta-analysis of the global gene expression profile of triple-negative breast cancer identifies genes for the prognostication and treatment of aggressive breast cancer. Oncogenesis 3:e124. [DOI] [PMC free article] [PubMed] [Google Scholar]
- 9.Kuner R et al. (2013) The maternal embryonic leucine zipper kinase (MELK) is upregulated in high-grade prostate cancer. J Mol Med 91(2):237–248 [DOI] [PubMed] [Google Scholar]
- 10.Alachkar H et al. (2014) Preclinical efficacy of maternal embryonic leucine-zipper kinase (MELK) inhibition in acute myeloid leukemia. Oncotarget 5(23):12371–12382 [DOI] [PMC free article] [PubMed] [Google Scholar]
- 11.Ganguly R et al. (2014) Maternal embryonic leucine zipper kinase: key kinase for stem cell phenotype in glioma and other cancers. Mol Cancer Ther 13(6):1393–1398 [DOI] [PMC free article] [PubMed] [Google Scholar]
- 12.Chung S, Nakamura Y (2013) MELK inhibitor, novel molecular targeted therapeutics for human cancer stem cells. Cell Cycle 12(11):1655–1656 [DOI] [PubMed] [Google Scholar]
- 13.Chung SY et al. (2012) Development of an orally-administrative MELK-targeting inhibitor that suppresses the growth of various types of human cancer. Oncotarget 3(12):1629–1640 [DOI] [PMC free article] [PubMed] [Google Scholar]
- 14.Ji WB et al. (2016) OTSSP167 abrogates mitotic checkpoint through inhibiting multiple mitotic kinases. PLoS One 11(4): e0153518. [DOI] [PMC free article] [PubMed] [Google Scholar]
- 15.Taylor SS, McKeon F (1997) Kinetochore localization of murine Bub1 is required for normal mitotic timing and checkpoint response to spindle damage. Cell 89(5):727–735 [DOI] [PubMed] [Google Scholar]
- 16.Wang F et al. (2010) Histone H3 Thr-3 phosphorylation by Haspin positions Aurora B at centromeres in mitosis. Science 330(6001): 231–235 [DOI] [PMC free article] [PubMed] [Google Scholar]
- 17.Hirota T et al. (2005) Histone H3 serine 10 phosphorylation by Aurora B causes HP1 dissociation from heterochromatin. Nature 438(7071):1176. [DOI] [PubMed] [Google Scholar]
- 18.Edupuganti R et al. (2017) Discovery of a potent inhibitor of MELK that inhibits expression of the anti-apoptotic protein Mcl-1 and TNBC cell growth. Bioorg Med Chem 25(9):2609–2616 [DOI] [PubMed] [Google Scholar]
- 19.Hilberg F et al. (2008) BIBF 1120: triple angiokinase inhibitor with sustained receptor blockade and good antitumor efficacy. Cancer Res 68(12):4774–4782 [DOI] [PubMed] [Google Scholar]
- 20.Mobley DL, Gilson MK (2017) Predicting binding free energies: frontiers and benchmarks. Annu Rev Biophys 46:531–558 [DOI] [PMC free article] [PubMed] [Google Scholar]
- 21.Pérez A et al. (2007) Refinement of the AMBER force field for nucleic acids: improving the description of α/γ conformers. Biophys J 92(11):3817–3829 [DOI] [PMC free article] [PubMed] [Google Scholar]
- 22.Meagher KL, Redman LT, Carlson HA (2003) Development of polyphosphate parameters for use with the AMBER force field. J Comput Chem 24(9):1016–1025 [DOI] [PubMed] [Google Scholar]
- 23.Wang J et al. (2004) Development and testing of a general amber force field. J Comput Chem 25(9):1157–1174 [DOI] [PubMed] [Google Scholar]
- 24.Pearlman DA et al. (1995) AMBER, a package of computer programs for applying molecular mechanics, normal mode analysis, molecular dynamics and free energy calculations to simulate the structural and energetic properties of molecules. Comput Phys Commun 91(1–3):1–41 [Google Scholar]
- 25.Brooks BR et al. (1983) CHARMM: a program for macromolecular energy, minimization, and dynamics calculations. J Comput Chem 4(2):187–217 [Google Scholar]
- 26.Vanommeslaeghe K et al. (2010) CHARMM general force field: a force field for drug-like molecules compatible with the CHARMM all-atom additive biological force fields. J Comput Chem 31(4): 671–690 [DOI] [PMC free article] [PubMed] [Google Scholar]
- 27.Klauda JB et al. (2010) Update of the CHARMM all-atom additive force field for lipids: validation on six lipid types. J Phys Chem B 114(23):7830–7843 [DOI] [PMC free article] [PubMed] [Google Scholar]
- 28.MacKerell AD Jr, Banavali N, Foloppe N (2000) Development and current status of the CHARMM force field for nucleic acids. Biopolymers 56(4):257–265 [DOI] [PubMed] [Google Scholar]
- 29.Gaieb Z et al. (2018) D3R grand challenge 2: blind prediction of protein–ligand poses, affinity rankings, and relative binding free energies. J Comput Aided Mol Des 32(1):1–20 [DOI] [PMC free article] [PubMed] [Google Scholar]
- 30.Ren P, Ponder JW (2003) Polarizable atomic multipole water model for molecular mechanics simulation. J Phys Chem B 107(24): 5933–5947 [Google Scholar]
- 31.Wu JC, Chattree G, Ren P (2012) Automation of AMOEBA polarizable force field parameterization for small molecules. Theor Chem Accounts 131(3):1138. [DOI] [PMC free article] [PubMed] [Google Scholar]
- 32.Shi Y et al. (2013) Polarizable atomic multipole-based AMOEBA force field for proteins. J Chem Theor Comput 9(9):4046–4063 [DOI] [PMC free article] [PubMed] [Google Scholar]
- 33.Shi Y et al. (2011) Multipole electrostatics in hydration free energy calculations. J Comput Chem 32(5):967–977 [DOI] [PMC free article] [PubMed] [Google Scholar]
- 34.Abella JR et al. (2014) Hydration free energy from orthogonal space random walk and polarizable force field. J Chem Theor Comput 10(7):2792–2801 [DOI] [PMC free article] [PubMed] [Google Scholar]
- 35.Schnieders MJ et al. (2012) The structure, thermodynamics, and solubility of organic crystals from simulation with a polarizable force field. J Chem Theor Comput 8(5):1721–1736 [DOI] [PMC free article] [PubMed] [Google Scholar]
- 36.Jiao D et al. (2006) Simulation of Ca2+ and Mg2+ solvation using polarizable atomic multipole potential. J Phys Chem B 110(37): 18553–18559 [DOI] [PubMed] [Google Scholar]
- 37.Wu JC et al. (2010) Polarizable molecular dynamics simulation of Zn (II) in water using the AMOEBA force field. J Chem Theor Comput 6(7):2059–2070 [DOI] [PMC free article] [PubMed] [Google Scholar]
- 38.Grossfield A, Ren P, Ponder JW (2003) Ion solvation thermodynamics from simulation with a polarizable force field. J Am Chem Soc 125(50):15671–15682 [DOI] [PubMed] [Google Scholar]
- 39.Bell DR et al. (2016) Calculating binding free energies of host–guest systems using the AMOEBA polarizable force field. Phys Chem Chem Phys 18(44):30261–30269 [DOI] [PMC free article] [PubMed] [Google Scholar]
- 40.Zhang J, Shi Y, Ren P (2012) Polarizable force fields for scoring protein–ligand interactions. Protein-Ligand Interactions: 99–120 [Google Scholar]
- 41.Shi Y et al. (2012) Probing the effect of conformational constraint on phosphorylated ligand binding to an SH2 domain using polarizable force field simulations. J Phys Chem B 116(5):1716–1727 [DOI] [PMC free article] [PubMed] [Google Scholar]
- 42.Jiao D et al. (2009) Trypsin-ligand binding free energies from explicit and implicit solvent simulations with polarizable potential. J Comput Chem 30(11):1701–1711 [DOI] [PMC free article] [PubMed] [Google Scholar]
- 43.Jiao D et al. (2008) Calculation of protein–ligand binding free energy by using a polarizable potential. Proc Natl Acad Sci USA 105(17):6290–6295 [DOI] [PMC free article] [PubMed] [Google Scholar]
- 44.Zhang J et al. (2012) Modeling structural coordination and ligand binding in zinc proteins with a polarizable potential. J Chem Theor Comput 8(4):1314–1324 [DOI] [PMC free article] [PubMed] [Google Scholar]
- 45.Harger M et al. (2017) Tinker-OpenMM: absolute and relative al-chemical free energies using AMOEBA on GPUs. J Comput Chem 38(23):2047–2055 [DOI] [PMC free article] [PubMed] [Google Scholar]
- 46.Frisch M et al. (2010) Gaussian 09, revision b. 01. Gaussian. Inc, Wallingford, CT, p 6492 [Google Scholar]
- 47.Hopkins CW et al. (2015) Long-time-step molecular dynamics through hydrogen mass repartitioning. J Chem Theor Comput 11(4):1864–1874 [DOI] [PubMed] [Google Scholar]
- 48.Jones G et al. (1997) Development and validation of a genetic algorithm for flexible docking. J Mol Biol 267(3):727–748 [DOI] [PubMed] [Google Scholar]
- 49.Cao L-S et al. (2013) Structural basis for the regulation of maternal embryonic leucine zipper kinase. PLoS One 8(7):e70031. [DOI] [PMC free article] [PubMed] [Google Scholar]
- 50.Eswar N et al. (2006) Comparative protein structure modeling using Modeller. Curr Protoc Bioinform 15(1):5.6. 1–5.6. 30 [DOI] [PMC free article] [PubMed] [Google Scholar]
- 51.Hanwell MD et al. (2012) Avogadro: an advanced semantic chemical editor, visualization, and analysis platform. J Cheminform 4(1):17. [DOI] [PMC free article] [PubMed] [Google Scholar]
- 52.Cances E, Mennucci B, Tomasi J (1997) A new integral equation formalism for the polarizable continuum model: theoretical background and applications to isotropic and anisotropic dielectrics. J Chem Phys 107(8):3032–3041 [Google Scholar]
- 53.Richeldi L et al. (2014) Efficacy and safety of nintedanib in idiopathic pulmonary fibrosis. N Engl J Med 370(22):2071–2082 [DOI] [PubMed] [Google Scholar]
- 54.Canevari G et al. (2013) Structural insight into maternal embryonic leucine zipper kinase (MELK) conformation and inhibition toward structure-based drug design. Biochemistry 52(37):6380–6387 [DOI] [PubMed] [Google Scholar]
- 55.Klaeger S et al. (2017) The target landscape of clinical kinase drugs. Science 358(6367):eaan4368. [DOI] [PMC free article] [PubMed] [Google Scholar]
- 56.Qi R et al. (2018) Elucidating the phosphate binding mode of PBP: the critical effect of buffer solution. J Phys Chem B 122(24):6371–6376 [DOI] [PMC free article] [PubMed] [Google Scholar]
- 57.Laskowski RA et al. (2011) LigPlot+: multiple ligand-protein interaction diagrams for drug discovery. J Chem Inf Model 51(10): 2778–2786 [DOI] [PubMed] [Google Scholar]
Associated Data
This section collects any data citations, data availability statements, or supplementary materials included in this article.


