

Abstract
Nanosized cell-derived membrane vesicles are increasingly recognized as therapeutic vehicles and high-potential biomarkers for several diseases. Currently available methods allow bulk analysis of vesicles but are not suited for accurate quantification and fail to reveal phenotypic heterogeneity in membrane vesicle populations. For such analyses, single vesicle-based, multiparameter, high-throughput methods are needed. We developed a fluorescence-based, high-resolution flow cytometric method for quantitative and qualitative analysis of nanosized membrane vesicles. Proof of principle was obtained by single-particle analysis of virions and liposomes. Further validation was obtained by quantification of cell-derived nanosized membrane vesicles from cell cultures and body fluids. An important aspect was that the technology was extended to detect specific proteins on individual vesicles. This allowed identification of exosome subsets and phenotyping of individual exosomes produced by dendritic cells (DCs) undergoing different modes of activation. The described technology allows quantitative, multiparameter, and high-throughput analysis of a wide variety of nanosized particles and has broad applications.
From the Clinical Editor
The authors developed a fluorescence-based, high-resolution flow cytometric method for quantitative and qualitative analysis of nanosized cell-derived membrane vesicles that are increasingly recognized both as therapeutic vehicles and high-potential biomarkers for several diseases. A high throughput, easily available, and sensitive detection method such as the one discussed here is a critically important prerequisite for further refinements of this technology.
Key words: Cellular membrane vesicles, Exosomes, Nanovesicles, Microvesicles, Flow cytometry, Dendritic cells, Biomarkers
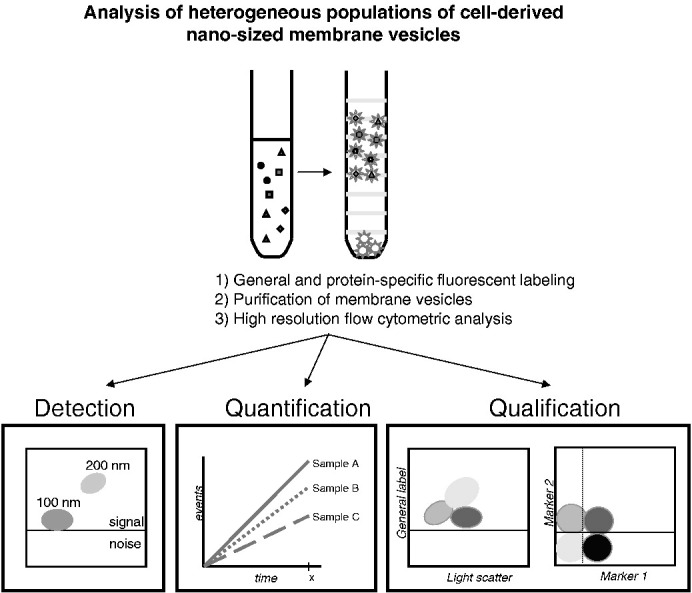
Graphical Abstract
Flow cytometric analysis of heterogeneous populations of cell-derived nanosized membrane vesicles.
Cells release membrane vesicles with specific lipid, protein, and RNA contents.1, 2 Regulated secretion of membrane vesicles and recruitment by target cells have been hypothesized to play a role in many pathophysiological processes.2, 3, 4, 5, 6, 7, 8, 9, 10, 11, 12, 13, 14 Cell-derived membrane vesicles are either shed from the plasma membrane (microparticles/microvesicles, 50–1000 nm) or exocytosed by fusion of multivesicular endosomes with the plasma membrane (exosomes, 50–100 nm).1, 2 The heterogeneity of cell-derived membrane vesicles in body fluids reflects the plethora of cellular origins. The abundance of a specific vesicle type may reflect the health or disease status of the tissue of origin, making these vesicles good candidates for biomarkers for noninvasive detection and monitoring of several diseases.7, 11, 15, 16 Furthermore, exosomes derived from dendritic cells (DCs) or tumor cells have been applied as “cell-free vaccines” in experimental tumor models and clinical trials in cancer patients.8, 17 Conversely, application of tumor exosomes can also result in accelerated tumor growth.18 Both for the development of the biomarker field and for the safe clinical application of membrane vesicles, high-resolution analysis methods are needed for vesicle characterization and/or quality control. Proteomics, western-blotting, and lipidomics have been applied to characterize bulk isolates of membrane vesicles. However, a standardized, multiparameter, high-throughput method is required to analyze individual membrane vesicles and heterogeneity in membrane-vesicle populations. Microscopic analysis revealed that the vast majority of membrane vesicles present in cell culture supernatants or body fluids are significantly smaller than 300 nm.3, 19, 20 Although vesicles as small as 50–100 nm can be accurately visualized and characterized using specific imaging techniques,19, 20, 21, 22 these techniques preclude analysis of the large numbers of vesicles needed to study their quantity and heterogeneity.3, 19 Flow cytometry on the other hand is an ideal technique to simultaneously quantify and qualify high numbers of cells and vesicles with a diameter > 300 nm.23, 24, 25 However, this method falls short for the analysis of smaller membrane vesicles (< 300 nm).26, 27 We here describe a novel high-resolution flow cytometry-based method for fluorescence-based detection of single nanosized particles that can be used for both standardized quantification and multiparameter characterization.
Methods
Cell culture
Bone-marrow-derived DCs were generated from C57BL/6 mice as described,28 with minor modifications. Bone marrow cells were maintained in Iscove's Modified Dulbecco's medium lacking L-glutamine (BioWhittaker, Frederick, Maryland) supplemented with 2 mM Ultraglutamine (BioWhittaker), 10% heat inactivated fetal calf serum (FCS, Sigma-Aldrich, St. Louis, Missouri), 100 IU/mL penicillin and 100 mg/mL streptomycin (Life Technologies, Bleiswijk, The Netherlands), 50 μM β-mercaptoethanol and 30% conditioned medium from GM-CSF producing NIH 3T3 cells (R1). At days 3, 6, and 8, medium was added or replaced. On day 9, nonadherent cells were collected and plated in new dishes with fresh medium. Cells were activated with 10 μg/mL LPS on day 13. Semi-adherent and nonadherent cells were harvested on day 14 and replated for exosome production in medium containing overnight ultracentrifuged (100,000g) FCS and conditioned R1 medium to deplete bovine and R1 cell exosomes. The p53-specific CD4+ T-cell clone, generated in a C57BL/6 p53–/– mouse29 and provided by Prof. C. Melief (Leiden University Medical Center, Leiden, The Netherlands), was cultured as described previously.30 When indicated, DCs were preloaded with 2.5 μM p53 peptide (amino acid 77–96) simultaneous with LPS activation, mixed in a 1:1 ratio with T cells on day 14, and co-cultured for 20 hours. All cultures were maintained at 37°C, 5% CO2. Experiments were approved by the Institutional Ethical Animal Committee at Utrecht University (Utrecht, The Netherlands).
Exosome isolation and labeling
Exosomes were collected from culture supernatants of 3 × 10⁶ DC, 3 × 10⁶ T cells or 3 × 10⁶ DCs co-cultured with 3 × 10⁶ T cells by differential centrifugation as described.3 As a negative control, culture medium that had not been in contact with cells was used. Exosomes were pelleted by ultracentrifugation at 100,000g for 65 minutes in a SW40 rotor (Beckman Coulter Inc., Fullerton, California). Freshly isolated exosomes were resuspended in 20 μl PBS containing 0.2% BSA from a stock solution cleared from aggregates by ultracentrifugation and fluorescently labeled with 7.5 μM PKH67 (Sigma-Aldrich) in an end volume of 200 μl, following the manufacturer's recommendations. For antibody staining, exosomes resuspended in 20 μl PBS/0.2% BSA were incubated with 0.5 μg R-PE-labeled or APC-labeled anti-mouse MHC class II antibody (clone M5/114, eBioscience, San Diego, California), 0.5 μg B-PE-labeled anti-mouse MFG-E8 antibody (clone 2422, MBL, labeled according protocol with B-Phycoerythrin [B-PE] conjugation kit [Innova Biosciences, Cambridge, United Kingdom]) or with similarly labeled isotype controls for 45 minutes at room temperature (18–24°C), after which PKH67 labeling was performed. Exosomes were mixed with 2.5 M sucrose, overlaid with a linear sucrose gradient (2.0–0.4 M sucrose in PBS) and floated into the gradient by centrifugation in a SW40 tube (Beckman) for 16 hours at 192,000g. Gradient fractions were collected from the bottom of the tube, diluted 20-fold with PBS and measured on the flow cytometer. Fraction densities were determined by refractometry.
Flow cytometric analysis of nanosized particles
The BD Influx flow cytometer (Becton Dickinson, Brussels, Belgium) was triggered on the fluorescence signal derived from the fluorescently labeled particles and thresholding was applied on this fluorescence channel. Fluorescence thresholding was based on measuring 0.22 μm filtered PBS, allowing an event rate of ≤ 6 events per second. Light scattering detection was performed in log mode. All relevant BD Influx features and settings are listed in Supplementary Table S1 and full details of experimental procedures are described in Supplementary Methods (available online at http://www.nanomedjournal.com).
When indicated for quantification, serial twofold dilutions of 100-nm fluorescent beads in an input concentration range of 1.64 × 10⁶ to 3.2 × 10³ beads per mL (stock solutions specified by the manufacturer) were mixed with a fixed number (3.8 × 10⁵) of 200-nm fluorescent beads. After measurement (30 seconds), the ratio of 100- and 200-nm beads was calculated. Alternatively, the quantity of particles detected in a fixed timeframe of 30 seconds was determined. The numbers of detected particles in this timeframe were plotted against the dilution factor. Linear regression analysis was performed using Prism (version 3.0, GraphPad Software). The intersample variation was determined by preparing seven individual tubes with identical bead dilutions, after which the mean ± standard deviation (SD) of the number of beads detected in 30 seconds was calculated. The intrasample variation was determined by repeated measurements of the same bead dilution with 30-second time intervals. Between measurements the sample was not removed from the cytometer to prevent volume changes due to fluid back-flush. PE-labeled antibodies were measured by excitation with the 561-nm laser and using a 585/42 band pass filter.
Virus labeling and purification
LR7 cells were maintained as monolayer cultures in Dulbecco modified Eagle medium (DMEM) (BioWhittaker) supplemented with 10% FCS (Bodinco, Alkmaar, The Netherlands), 100 IU of penicillin/mL, and 100 μg of streptomycin/mL (Life Technologies). LR7 cells were inoculated with MHV (strain A59) in Opti-MEM (Invitrogen, Carlsbad, California). At t = 2 hours, 5 μM HR2 peptide was added to prevent syncytia formation.31 At t = 7 hours, cells were fluorescently labeled with 5 μM carboxy-fluorescein succinimidyl ester (CFSE, Invitrogen), according to the manufacturer's recommendations, and incubated for another 2 hours in Opti-MEM containing 10% FCS and 5 μM HR2 peptide. At t = 9 hours, culture medium was harvested and centrifuged for 10 minutes at 1200 rpm and for 15 minutes at 10,000g at 4°C to remove cellular debris. Virions were sedimented through a 20% sucrose cushion (wt/wt) in TN buffer [10 mM Tris pH 7.4, 100 mM NaCl] by ultra-centrifugation at 100,000g for 1.5 hours at 4°C in a Beckman SW40 rotor. Pelleted MHV virions were resuspended in TN buffer and floated by centrifugation to equilibrium density into a 2.0- to 0.4-M sucrose gradient by ultracentrifugation at 100,000g. Different sucrose fractions were collected, diluted 1/10 and analyzed by flow cytometry-based measurements. The infectivity was checked by using the median tissue culture infective dose (TCID50) end-point dilution assay. This assay confirmed that the majority of virus, as detected by flow cytometry-based analysis, was present in the 1.14 g/mL gradient fraction. Virion size was 100 ± 30 nm, as measured by NTA (see below), which is in accordance with previous measurements.32
Liposome preparation
Liposomes were prepared using the lipid film hydration method. Briefly, EPC-35, EPG and cholesterol (molar ratio 2:0.06:1) were dissolved in chloroform:methanol (1:1, v/v) in a round-bottom flask. After evaporation of the solvent under reduced pressure using a rotary evaporator, the lipid film was hydrated with HEPES buffered saline (HBS; 10 mM HEPES, 137 mM NaCl, 1mM EDTA, pH 7.4). For calcein-labeled liposomes, lipid films were hydrated with 0.25 mM calceine in HBS. Differently sized liposomes were prepared by 10 extrusions through 100- or 400-nm polycarbonate membranes (Nuclepore, Whatman, Clifton, New Jersey) using a Lipex high-pressure extruder (Northern Lipids, Vancouver, Canada). Sized liposomes were dialyzed in 10,000 MWCO Slide-A-Lyzer Dialysis Cassettes (Thermo Scientific, Bremen, Germany) against HBS for at least 3 days with regular exchange of HBS. Liposome sizes were 95 ± 26 nm or 123 ± 45 nm, as measured by Nanoparticle Tracking Analysis (NTA) (see below).
NTA
For nanoparticle (NP) size determination, the Brownian motion of the particles was followed using the NanoSight LM10SH (NanoSight, Amesbury, United Kingdom), equipped with a 532-nm laser. Samples were introduced into the sample chamber and measured for 120 or 150 seconds at 20°C with manual shutter and gain adjustments. The data were captured and analyzed using NTA 2.0 Build 0252 software (NanoSight). Indicated sizes and SDs are averages of at least three individual measurements. At least 2000 tracks of individually traced particles were detected in total.
Isolation and labeling of vesicles from seminal fluid
Human semen was obtained after informed consent from vasectomized men following a postoperative period of > 3 months. Residual cells were removed by centrifugation at 3000g for 10 minutes. Supernatants were pooled from 5–7 donors per batch, diluted 1:1 in PBS and cleared of large particles by centrifuging twice at 10,000g for 20 minutes. Remaining small membrane vesicles were pelleted at 100,000g for 1 hour in an SW28 rotor (Beckman). The pellet was resuspended in PBS and 3% samples were stained with PKH67 as described above. Vesicles were loaded on top of a linear sucrose gradient (2.0–0.4 M sucrose in PBS) in a SW40 tube (Beckman) and centrifuged for 16 hours at 192,000g. Sucrose gradient fractions were diluted 1:1000 in PBS before flow cytometry-based analysis.
SDS-PAGE and immunoblotting
Sucrose gradient fractions were diluted with PBS and centrifuged for 60 minutes at 100,000g using a SW60 rotor (Beckman). The pellets were solubilized in nonreducing SDS-PAGE sample buffer and separated by 12.5% SDS-PAGE. For western blotting, proteins were transferred to PVDF membranes (Millipore, Bedford, Massachusetts), which were blocked in PBS containing 5% (w/v) nonfat dry milk (Protifar plus; Nutricia, Zoetermeer, The Netherlands) and 0.1% (v/v) Tween-20, and immunolabeled with mouse anti-human CD9 (clone HI9a; Santa Cruz Biotechnology, Santa Cruz, California). Horseradish peroxidase-conjugated rabbit anti-mouse (Pierce, Rockford, Illinois) was used as secondary antibody and detected using Supersignal west pico chemiluminescent substrate (Pierce).
Results
Flow cytometry-based detection of nanosized particles
We optimized the configuration of a high-end, but commercially available, flow cytometry system for optical detection of light scatter and fluorescence signals generated by nanosized particles (Supplementary Table S1). For cells and particles larger than 500 nm the amount of light scattered at small angles (0.5–15 degrees), i.e., forward scatter (FSC), is commonly used as a rough indication of their size.26 However, particles with sizes near and below the wavelength of light (NPs) scatter proportionally more light at larger angles (15–150 degrees).26, 27, 33 We have used a flow cytometer equipped with a photomultiplier tube detecting forward scattered light at 2–25 degrees (wide-angle forward scatter detection). We further increased the sensitivity for small particle detection by increasing the minimum detection angle to 14 degrees, resulting in an increased signal-to-noise ratio.27 In addition, we used fluorescence threshold triggering to discriminate fluorescently labeled particles of interest from noise signals (Supplementary Figure S1 A–D). With this set-up, 100- and 200-nm fluorescent beads could be selectively detected above the fluorescence threshold, and we achieved an unprecedented clear wide-angle FSC-based separation of these bead populations (Supplementary Figure S1 C–D). Light scattered at 90 degrees (side scatter, SSC) has also been used for analysis of small particles.34 However, SSC and backward scatter are more sensitive to changes in the geometry and internal structures of small particles.33 More important, we observed that the resolving power (change in light scatter with particle size) of the wide-angle FSC was greater than that of the SSC (Supplementary Figure S1 E). Based on these findings, we selected wide-angle FSC for relative sizing of nanosized particles.
Until now, high-throughput methods for absolute quantification of nanosized cellular membrane vesicles were lacking. To determine whether our flow cytometry-based method can be used to quantify nanosized particles, dilutions of 100-nm beads were mixed with a fixed number of 200-nm beads as a reference and measured. The ratio of detected 100- versus 200-nm beads correlated linearly with the dilution factor (R2 = 0.999) with the predicted slope (Figure 1 , A), demonstrating that nanosized particles could be accurately quantified at a large range of concentrations. A disadvantage of using reference beads is that they can stick to the biological NPs of interest. Therefore, as an alternative we used a fixed timeframe for quantification (Figure 1, B). An important finding was that the absolute number of measured 100-nm beads deviated < 10% from the specified number of input beads over a large range of concentrations (Figure 1, B), confirming that the complete population of beads was detected above the fluorescence threshold and that noise signals were eliminated. Using this time-based quantification method, the inter- and intrasample variations were 5.3% and 0.6%, respectively.
Figure 1.

Quantification of nanosized particles by flow cytometric analysis. (A) Serial twofold dilutions of fluorescent 100-nm beads were mixed with a fixed number of fluorescent 200-nm beads. Samples were measured using fluorescence threshold triggering and the absolute numbers of 100-nm and 200-nm beads were analyzed. Expressed is the ratio of 100-nm beads versus 200-nm bead at each dilution (slope -0.9637 ± 0.064, R2 = 0.999, as determined by linear regression). One representative experiment out of three is shown. (B) Serial twofold dilutions of fluorescent 100-nm beads were prepared and measured using fluorescence threshold triggering. The absolute number of beads measured in a fixed time window (30 sec) was plotted against the dilution factor (slope -1.012 ± 0.012, R2 = 1.00, as determined by linear regression). The measured values (♦) are plotted together with the calculated amount of input beads (x) based on the specified concentration of beads in the stock solution. One representative experiment out of three is shown.
Analysis of nanosized virions and liposomes
Next, we analyzed CFSE-labeled mouse hepatitis coronavirus, representing a homogeneous population of membrane-enveloped NPs, and differently sized calcein-labeled liposome preparations. To determine their size with an independent method, we used NTA. Virions were 100 ± 30 nm (corroborating previous data32), and liposome preparations I and II were 95 ± 26 nm and 123 ± 45 nm, respectively (Figure 2 , C, G). Using our flow cytometry approach, CFSE-labeled mouse hepatitis coronavirus could be clearly discerned based on fluorescence, and the wide-angle FSC level was in the range of the 100-nm fluorescent beads (Figure 2, A, B). In addition, the calcein-labeled liposomes were clearly detected above the fluorescence threshold (Figure 2, D, E), and the largest liposome preparation showed a slightly increased wide-angle FSC level. In comparison with 100-nm beads and the virions, the liposomes displayed a relatively low wide-angle FSC value (Figure 2, F). This finding is most likely due to the low refractive index of these liposome preparations, indicating that particle composition also influences wide-angle FSC levels. Although the light scattering values cannot be used for absolute sizing, we conclude that wide-angle FSC can be used for approximate sizing, as well as for relative sizing of nanosized membrane particles and vesicles with a comparable composition.
Figure 2.

Analysis of nanosized virions and liposomes. (A-B, D-F) Flow cytometric analysis of CFSE-labeled mouse hepatitis virions (MHV) and calcein-labeled liposome preparations I and II using fluorescence threshold triggering. Wide-angle FSC levels were compared with those of 100- and 200-nm fluorescent beads as indicated. (C, G) Virions and liposomes were sized by NTA.
Flow cytometric analysis of nanosized membrane vesicles from cell culture supernatant and body fluid
To analyze nanosized membrane vesicles (exosomes) secreted by in vitro cultured cells, we developed a labeling method to obtain brightly fluorescent exosomes free of unbound dye. Exosomes secreted by murine DCs were isolated from cell culture supernatant by differential centrifugation, fluorescently labeled with PKH67 and floated by centrifugation to equilibrium density into a sucrose gradient.30 This experimental set-up (Figure 3 , A) ensured separation of labeled exosomes from unbound dye or aggregates thereof that severely hamper exosome measurements. We found that the vast majority (84 ± 4%; mean ± SD of four individual experiments) of DC vesicles equilibrated at sucrose densities of 1.11–1.18 g/mL (Figure 3, B), corresponding to the representative density range of exosomes.1 An important finding was that the entire population of fluorescently labeled DC-exosomes (pool of densities 1.11–1.18 g/mL) was detected above the fluorescence threshold, indicating that the labeling approach was sufficient to visualize the vast majority of exosomes (Figure 3, C). The size distributions of these DC exosomes as determined by wide-angle FSC level (Figure 3, D) and NTA (Figure 3, E) were comparable.
Figure 3.

Flow cytometric analysis of exosomes from cell culture supernatant. (A) Schematic diagram of the method developed to quantify and characterize cellular membrane vesicles by flow cytometric analysis. Exosomes were isolated from culture supernatants of LPS-activated DC cultures by differential centrifugation. Pelleted (100,000g) exosomes were fluorescently labeled with PKH67 and loaded at the bottom of a sucrose gradient, after which the vesicles were floated to equilibrium by ultracentrifugation. Sucrose gradient fractions were analyzed using a threshold on PKH67 fluorescence. (B) Time-based quantification of fluorescent membrane vesicles detected in collected gradient fractions. Indicated are the numbers of events measured in 30 sec. One representative experiment out of five is shown. (C) Dot plot of wide-angle FSC versus PKH67 fluorescence of DC exosomes pooled from 1.11–1.18 g/mL fractions. (D) Histogram indicating the wide-angle FSC of DC exosomes relative to the scatter levels of 100- and 200-nm beads. (E) Exosome size was determined by NTA. The mean size of these DC exosomes was estimated to be 83 ± 47 nm.
We next applied our method to the detection and quantification of nanosized membrane vesicles in a body fluid. We selected human seminal fluid that contains vesicles derived from various cell types, e.g., from prostate epithelial cells (prostasomes35). Using western blotting, we found that in sucrose gradients the exosomal marker CD9 migrated to densities of 1.09–1.17 g/mL (Figure 4 , A). Quantification by time-based flow cytometric analysis demonstrated that the vesicles distributed in a manner similar to that of CD9 (Figure 4, B), indicating the suitability of this method to detect nanosized membrane vesicles in body fluids.
Figure 4.

Detection and quantification of human seminal fluid nanosized membrane vesicles by flow cytometric analysis. Membrane vesicles were isolated from seminal fluid, fluorescently labeled with PKH67, loaded onto a sucrose gradient and centrifuged to equilibrium density. One representative experiment out of two independent experiments is shown. (A) Gradient fractions were analyzed for the presence of CD9 by western blotting. (B) Sucrose gradient fractions were analyzed using a threshold on PKH67 fluorescence. Time-based (30 sec) quantification of fluorescent membrane vesicles (black bars) detected in different gradient fractions and dot plot of wide-angle FSC versus PKH67 fluorescence representing fluorescent vesicles pooled from fractions with densities of 1.09–1.17 g/mL. As a control for unbound dye aggregates, PKH67 dye-only without membrane vesicles was loaded onto a sucrose gradient (gray bars).
Flow cytometric characterization of exosome subsets
Next, we applied fluorescent antibody staining for phenotypic characterization of individual exosomes in heterogeneous populations using our murine DC-T cell co-culture system.30 Quantitative analysis of exosomes derived from DC-T cell co-culture revealed that the number of exosomes increased 2.1 ± 0.5-fold (mean ± SD of four individual experiments) during cognate DC-T cell interaction (Figure 5 , A). This finding can be explained either by T cell-induced secretion of DC exosomes30 and/or the additional presence of T cell exosomes.36 To discriminate between T cell- and DC-derived exosomes, DC exosomes were in addition to PKH67 also selectively labeled with fluorescently labeled antibodies against MHC class II (MHCII). MHCII is incorporated into DC exosomes30, 37 but is absent on mouse T cells and T cell-derived exosomes. MHCII stained vesicles were detected in those sucrose fractions containing DC exosomes (Figure 5, B), with signals well above isotype control antibody staining (Figure 5, B, C). The MHCII staining levels of DC exosomes were variable. Vesicles floating at a relative high density (1.18 g/mL) contained the highest amount of MHCII (Figure 5, B). Besides MHCII-positive exosomes, MHCII-negative vesicles also were observed (Figure 5, C). This suggests that DC can also secrete vesicles that contain little or no MHCII. Exosomes derived from murine T cells were all negative for MHCII (Figure 5, C). In DC-T cell co-culture supernatants, both MHCII-positive and MHCII-negative populations of exosomes were found (Figure 5, C). In comparison with DC cultures, the relative amount of MHCII-negative exosomes was increased in DC-T cell co-cultures, indicating a contribution of T cell exosomes.
Figure 5.

Flow cytometric characterization of exosome subsets. Exosomes were isolated from culture supernatants of murine DC, T cell or DC-T cell co-cultures. (A) Time-based quantification of fluorescent exosomes detected in different gradient fractions. Indicated are the numbers of events measured in 30 sec. One representative experiment out of four is shown. (B) Exosomes from LPS-activated DC cultures were additionally stained with R-PE-labeled anti-MHCII (black bars) or isotype control (gray bars) antibodies. Indicated are the geometric mean fluorescence intensities of events measured in each of the gradient fractions. One representative experiment out of three is shown. (C) Dot plots representing PKH67 and anti-MHCII-R-PE or isotype control antibody-labeled exosomes (pools of 1.11–1.18 g/ml sucrose fractions) derived from T cell cultures (left), LPS-activated DC cultures (middle) or DC/LPS-T cell co-cultures (right). One representative experiment out of three is shown. (D) Dot plots representing PKH67 and anti-MHCII (APC-labeled) / anti-MFG-E8 (B-PE-labeled) double-labeled exosomes or corresponding isotype control labeled exosomes derived from nonactivated or LPS-activated DC cultures.
To further test the sensitivity of our method to reveal conditional phenotypic changes of exosomes, we performed a double labeling for MHCII and milk-fat globule-EGF factor 8 (MFG-E8; a protein described to be present on DC exosomes1) and compared exosomes produced by LPS-activated with nonactivated murine DCs. Based on the combined analysis of MFG-E8 and MHCII, different exosome subsets could be distinguished in both populations of DC exosomes (Figure 5, D). MHCII staining was higher on LPS-activated DC exosomes in comparison with nonactivated DC exosomes. In contrast, exosomes derived from nonactivated DC contained higher levels of MFG-E8 in comparison with LPS-activated DC exosomes, as had previously been suggested based on western blot analysis.38 These data demonstrate that subtle changes in the molecular make-up of a subset of nanosized membrane vesicles can be analyzed with our method.
Discussion
Biomarker profiling of cellular membrane vesicles and quality control of exosome-based vaccines depend heavily on accurate methods to analyze the quantity and phenotype of these vesicles. However, current methods fall short in the identification and characterization of individual membrane vesicles and vesicle subsets in heterogeneous populations. For the larger membrane vesicles in human blood (> 300 nm), FSC-based flow cytometric analysis appeared to be a reproducible method for high-throughput, multiparameter analysis at the particle level.23, 24, 25 , 39 However, the majority of secreted membrane vesicles in body fluids are in the nanoscale size range (50–100 nm),19 which cannot be visualized by conventional FSC-based analysis.23, 24, 25 Techniques that allow phenotypic analysis of individual nanosized membrane vesicles, including immunoelectron microscopy and atomic force microscopy, preclude analysis of large numbers of vesicles needed to study their quantity and heterogeneity.3, 19 Recently, NTA has been described as a method to analyze cell-derived membrane vesicles.21 Although NTA is a powerful method for size analysis, quantitative measurements are less precise in samples containing differently sized vesicles21 and the number of parameters that can be analyzed simultaneously is limited. These limitations pose a disadvantage for the analysis of biological fluids containing many different types of cellular membrane vesicles. We here described a novel flow cytometry-based method allowing simultaneous high-throughput quantitative analysis and multiple-parameter phenotyping of individual nanosized membrane vesicles. This methodology proved suitable for the accurate and absolute quantification of nanosized particles over a wide range of concentrations, setting the stage for its applicability in biomarker analysis. Importantly, we demonstrated that antibody-mediated detection of multiple specific proteins on individual membrane vesicles allowed discrimination of phenotypically different vesicle subsets.
Several features of the selected high-end flow cytometer contributed to the high sensitivity of fluorescence and light scatter detection. First, the selected BD Influx flow cytometer, like some other new generation flow cytometers,23 uses wide-angle FSC instead of the conventional FSC (< 15 degrees) to improve small-particle detection. Second, the BD Influx is fitted with a high-performance photomultiplier tube instead of a photodiode (used in other flow cytometers) for detection of FSC signals. Third, we used fluorescence threshold triggering, which was crucial to distinguish nanosized fluorescently labeled particles of interest from noise signals with overlapping light scattering properties. Importantly, the sensitivity by which the BD Influx detected fluorescently labeled membrane vesicles above the threshold was higher in comparison with other flow cytometers, such as the BD FACSCanto II and the Beckman Coulter Gallios, making it better suited for accurate quantification and characterization of complete vesicle populations. Because our method is based on both optimized wide-angle FSC detection and fluorescence thresholding, the exact lower detection limit for the described technology not only depends on the size of the particles but also on the brightness of labeling, allowing the detection of the entire population above the fluorescence threshold. There are two important advantages of using a labeling method for indiscriminative detection of the entire membrane vesicle population above the fluorescence threshold. First, particles of interest can be accurately quantified because all noise signals are eliminated. Second, by combining the general fluorescent labeling with labeling for a specific marker, vesicle subsets can be identified and related to the entire membrane vesicle population. To analyze fluorescently labeled membrane vesicles, removal of unbound soluble and aggregated dye is very important. Simple washing by sedimentation through ultracentrifugation was not efficient to remove dye aggregates, which appeared above the fluorescence threshold with scatter levels just below those of 100-nm beads. Density gradient ultracentrifugation was therefore crucial to separate the vesicles from unbound dye and simultaneously allowed the identification of membrane vesicles subsets with distinct buoyant densities.
Accurate and standardized quantification and detailed phenotypic analysis of (subsets of) membrane vesicles is important for biomarker profiling and therapeutic applications. We here demonstrated that our method allows accurate and absolute quantification of nanosized particles over a wide range of concentrations. Furthermore, we showed proof of principle that specific proteins can be detected on individual exosomes using fluorescent antibodies. In addition, we showed the suitability of this method for liposome and virion analyses. Therefore, this method opens new avenues for NP analysis in the fields of medicine, virology, and nano-drug development.
Acknowledgments
We thank M. de Boer-Brouwer and M. van Steenbergen for excellent technical assistance and N.P.H. van Adrichem and M. van Wijnen (Meander Medical Center, Amersfoort, The Netherlands) for providing seminal fluid samples. We thank Drs R. Wubbolts and M. Nolte for critical reading of the manuscript.
Footnotes
No conflict of interest was reported by the authors of this article.
Supplementary data to this article can be found online at doi:10.1016/j.nano.2011.09.006.
Appendix A. Supplementary data
The following is the Supplementary data to this article.
Wauben Suppl material Nanomedicine
Wauben Supplementary Table S1
Wauben Suppl Figure 1
References
- 1.Thery C., Ostrowski M., Segura E. Membrane vesicles as conveyors of immune responses. Nat Rev Immunol. 2009;9:581–593. doi: 10.1038/nri2567. [DOI] [PubMed] [Google Scholar]
- 2.Cocucci E., Racchetti G., Meldolesi J. Shedding microvesicles: artifacts no more. Trends Cell Biol. 2009;19:43–51. doi: 10.1016/j.tcb.2008.11.003. [DOI] [PubMed] [Google Scholar]
- 3.Raposo G., Nijman H.W., Stoorvogel W., Liejendekker R., Harding C.V., Melief C.J. B lymphocytes secrete antigen-presenting vesicles. J Exp Med. 1996;183:1161–1172. doi: 10.1084/jem.183.3.1161. [DOI] [PMC free article] [PubMed] [Google Scholar]
- 4.Puddu P., Puddu G.M., Cravero E., Muscari S., Muscari A. The involvement of circulating microparticles in inflammation, coagulation and cardiovascular diseases. Can J Cardiol. 2010;26:140–145. doi: 10.1016/s0828-282x(10)70371-8. [DOI] [PMC free article] [PubMed] [Google Scholar]
- 5.Chironi G.N., Boulanger C.M., Simon A., Dignat-George F., Freyssinet J.M., Tedgui A. Endothelial microparticles in diseases. Cell Tissue Res. 2009;335:143–151. doi: 10.1007/s00441-008-0710-9. [DOI] [PubMed] [Google Scholar]
- 6.Nomura S. Dynamic role of microparticles in type 2 diabetes mellitus. Curr Diabetes Rev. 2009;5:245–251. doi: 10.2174/157339909789804404. [DOI] [PubMed] [Google Scholar]
- 7.Clayton A., Mason M.D. Exosomes in tumour immunity. Curr Oncol. 2009;16:46–49. doi: 10.3747/co.v16i3.367. [DOI] [PMC free article] [PubMed] [Google Scholar]
- 8.Escudier B., Dorval T., Chaput N., Andre F., Caby M.P., Novault S. Vaccination of metastatic melanoma patients with autologous dendritic cell (DC) derived-exosomes: results of the first phase I clinical trial. J Transl Med. 2005;3:10. doi: 10.1186/1479-5876-3-10. [DOI] [PMC free article] [PubMed] [Google Scholar]
- 9.Nolte-'t Hoen E.N., Buschow S.I., Anderton S.M., Stoorvogel W., Wauben M.H., Activated T. cells recruit exosomes secreted by dendritic cells via LFA-1. Blood. 2009;113:1977–1981. doi: 10.1182/blood-2008-08-174094. [DOI] [PubMed] [Google Scholar]
- 10.Morelli A.E., Larregina A.T., Shufesky W.J., Sullivan M.L., Stolz D.B., Papworth G.D. Endocytosis, intracellular sorting, and processing of exosomes by dendritic cells. Blood. 2004;104:3257–3266. doi: 10.1182/blood-2004-03-0824. [DOI] [PubMed] [Google Scholar]
- 11.Beyer C., Pisetsky D.S. The role of microparticles in the pathogenesis of rheumatic diseases. Nat Rev Rheumatol. 2009;6:21–29. doi: 10.1038/nrrheum.2009.229. [DOI] [PubMed] [Google Scholar]
- 12.Sullivan R., Saez F., Girouard J., Frenette G. Role of exosomes in sperm maturation during the transit along the male reproductive tract. Blood Cells Mol Dis. 2005;35:1–10. doi: 10.1016/j.bcmd.2005.03.005. [DOI] [PubMed] [Google Scholar]
- 13.Kim S.H., Lechman E.R., Bianco N., Menon R., Keravala A., Nash J. Exosomes derived from IL-10-treated dendritic cells can suppress inflammation and collagen-induced arthritis. J Immunol. 2005;174:6440–6448. doi: 10.4049/jimmunol.174.10.6440. [DOI] [PubMed] [Google Scholar]
- 14.Zhang H.G., Grizzle W.E. Exosomes and cancer: ae newly described pathway of immune suppression. Clin Cancer Res. 2011 doi: 10.1158/1078-0432.CCR-10-1489. [DOI] [PMC free article] [PubMed] [Google Scholar]
- 15.Mathivanan S., Simpson R.J. ExoCarta: A compendium of exosomal proteins and RNA. Proteomics. 2009;9:4997–5000. doi: 10.1002/pmic.200900351. [DOI] [PubMed] [Google Scholar]
- 16.Keller S., Ridinger J., Rupp A.K., Janssen J.W., Altevogt P. Body fluid derived exosomes as a novel template for clinical diagnostics. J Transl Med. 2011;9:86. doi: 10.1186/1479-5876-9-86. [DOI] [PMC free article] [PubMed] [Google Scholar]
- 17.Chaput N., Taieb J., Schartz N., Flament C., Novault S., Andre F. The potential of exosomes in immunotherapy of cancer. Blood Cells Mol Dis. 2005;35:111–115. doi: 10.1016/j.bcmd.2005.05.009. [DOI] [PubMed] [Google Scholar]
- 18.Iero M., Valenti R., Huber V., Filipazzi P., Parmiani G., Fais S. Tumour-released exosomes and their implications in cancer immunity. Cell Death Differ. 2008;15:80–88. doi: 10.1038/sj.cdd.4402237. [DOI] [PubMed] [Google Scholar]
- 19.Yuana Y., Oosterkamp T.H., Bahatyrova S., Ashcroft B., Garcia Rodriguez P., Bertina R.M. Atomic force microscopy: a novel approach to the detection of nanosized blood microparticles. J Thromb Haemost. 2010;8:315–323. doi: 10.1111/j.1538-7836.2009.03654.x. [DOI] [PubMed] [Google Scholar]
- 20.Gyorgy B., Modos K., Pallinger E., Paloczi K., Pasztoi M., Misjak P. Detection and isolation of cell-derived microparticles are compromised by protein complexes resulting from shared biophysical parameters. Blood. 2011;117:e39–48. doi: 10.1182/blood-2010-09-307595. [DOI] [PubMed] [Google Scholar]
- 21.Dragovic R.A., Gardiner C., Brooks A.S., Tannetta D.S., Ferguson D.J., Hole P. Sizing and phenotyping of cellulars vesicles using Nanoparticle Tracking Analysis. Nanomedicine. 2011 doi: 10.1016/j.nano.2011.04.003. [DOI] [PMC free article] [PubMed] [Google Scholar]
- 22.Filipe V., Hawe A., Jiskoot W. Critical evaluation of Nanoparticle Tracking Analysis (NTA) by NanoSight for the measurement of nanoparticles and protein aggregates. Pharm Res. 2010;27:796–810. doi: 10.1007/s11095-010-0073-2. [DOI] [PMC free article] [PubMed] [Google Scholar]
- 23.Lacroix R., Robert S., Poncelet P., Kasthuri R.S., Key N.S., Dignat-George F. Standardization of platelet-derived microparticle enumeration by flow cytometry with calibrated beads: results of the International Society on Thrombosis and Haemostasis SSC Collaborative workshop. J Thromb Haemost. 2010;8:2571–2574. doi: 10.1111/j.1538-7836.2010.04047.x. [DOI] [PubMed] [Google Scholar]
- 24.Orozco A.F., Lewis D.E. Flow cytometric analysis of circulating microparticles in plasma. Cytometry A. 2010;77:502–514. doi: 10.1002/cyto.a.20886. [DOI] [PMC free article] [PubMed] [Google Scholar]
- 25.Freyssinet J.M., Toti F. Membrane microparticle determination: at least seeing what's being sized! J Thromb Haemost. 2010;8:311–314. doi: 10.1111/j.1538-7836.2009.03679.x. [DOI] [PubMed] [Google Scholar]
- 26.Shapiro H.M. 4th ed. Wiley Liss; New York: 2003. Practical Flow Cytometry. [Google Scholar]
- 27.Steen H.B. Flow cytometer for measurement of the light scattering of viral and other submicroscopic particles. Cytometry A. 2004;57:94–99. doi: 10.1002/cyto.a.10115. [DOI] [PubMed] [Google Scholar]
- 28.Lutz M.B., Kukutsch N., Ogilvie A.L., Rossner S., Koch F., Romani N. An advanced culture method for generating large quantities of highly pure dendritic cells from mouse bone marrow. J Immunol Methods. 1999;223:77–92. doi: 10.1016/s0022-1759(98)00204-x. [DOI] [PubMed] [Google Scholar]
- 29.Lauwen M.M., Zwaveling S., de Quartel L., Ferreira Mota S.C., Grashorn J.A., Melief C.J. Self-tolerance does not restrict the CD4+ T-helper response against the p53 tumor antigen. Cancer Res. 2008;68:893–900. doi: 10.1158/0008-5472.CAN-07-3166. [DOI] [PubMed] [Google Scholar]
- 30.Buschow S.I., Nolte-'t Hoen E.N., van Niel G., Pols M.S., ten Broeke T., Lauwen M. MHC II in dendritic cells is targeted to lysosomes or T cell-induced exosomes via distinct multivesicular body pathways. Traffic. 2009;10:1528–1542. doi: 10.1111/j.1600-0854.2009.00963.x. [DOI] [PubMed] [Google Scholar]
- 31.Bosch B.J., van der Zee R., de Haan C.A., Rottier P.J. The coronavirus spike protein is a class I virus fusion protein: structural and functional characterization of the fusion core complex. J Virol. 2003;77:8801–8811. doi: 10.1128/JVI.77.16.8801-8811.2003. [DOI] [PMC free article] [PubMed] [Google Scholar]
- 32.Barcena M., Oostergetel G.T., Bartelink W., Faas F.G., Verkleij A., Rottier P.J. Cryo-electron tomography of mouse hepatitis virus: insights into the structure of the coronavirion. Proc Natl Acad Sci U S A. 2009;106:582–587. doi: 10.1073/pnas.0805270106. [DOI] [PMC free article] [PubMed] [Google Scholar]
- 33.Kerker M., Chew H., McNulty P.J., Kratohvil J.P., Cooke D.D., Sculley M. Light scattering and fluorescence by small particles having internal structure. J Histochem Cytochem. 1979;27:250–263. doi: 10.1177/27.1.438501. [DOI] [PubMed] [Google Scholar]
- 34.van Gaal E.V., Spierenburg G., Hennink W.E., Crommelin D.J., Mastrobattista E. Flow cytometry for rapid size determination and sorting of nucleic acid containing nanoparticles in biological fluids. J Control Release. 2010;141:328–338. doi: 10.1016/j.jconrel.2009.09.009. [DOI] [PubMed] [Google Scholar]
- 35.Sahlen G.E., Egevad L., Ahlander A., Norlen B.J., Ronquist G., Nilsson B.O. Ultrastructure of the secretion of prostasomes from benign and malignant epithelial cells in the prostate. Prostate. 2002;53:192–199. doi: 10.1002/pros.10126. [DOI] [PubMed] [Google Scholar]
- 36.Blanchard N., Lankar D., Faure F., Regnault A., Dumont C., Raposo G. TCR activation of human T cells induces the production of exosomes bearing the TCR/CD3/zeta complex. J Immunol. 2002;168:3235–3241. doi: 10.4049/jimmunol.168.7.3235. [DOI] [PubMed] [Google Scholar]
- 37.Stoorvogel W., Kleijmeer M.J., Geuze H.J., Raposo G. The biogenesis and functions of exosomes. Traffic. 2002;3:321–330. doi: 10.1034/j.1600-0854.2002.30502.x. [DOI] [PubMed] [Google Scholar]
- 38.Segura E., Amigorena S., Thery C. Mature dendritic cells secrete exosomes with strong ability to induce antigen-specific effector immune responses. Blood Cells Mol Dis. 2005;35:89–93. doi: 10.1016/j.bcmd.2005.05.003. [DOI] [PubMed] [Google Scholar]
- 39.Zwicker J.I. Tissue factor-bearing microparticles and cancer. Semin Thromb Hemost. 2008;34:195–198. doi: 10.1055/s-2008-1079260. [DOI] [PubMed] [Google Scholar]
Associated Data
This section collects any data citations, data availability statements, or supplementary materials included in this article.
Supplementary Materials
Wauben Suppl material Nanomedicine
Wauben Supplementary Table S1
Wauben Suppl Figure 1