

Abstract
In this study, we found that 74 patients with severe acute respiratory syndrome (SARS) exhibited a rapid, dramatic decrease in numbers of circulating myeloid and plasmacytoid dendritic cells (mDCs and pDCs) during the first 2 weeks of illness (5.3- and 28.4-fold reductions for mDCs and pDCs compared with 25 healthy individuals, respectively), with slow return to normal cell numbers during convalescence (weeks 5–7 of illness on average). In addition, numbers of circulating CD4 and CD8 T cells exhibited milder reductions (2.1- and 1.8-fold at week 1) and earlier return to normal at a mean of weeks 3 and 4, respectively. A significant inverse correlation was found between numbers of DC and T-cell subsets and high-dose steroid treatment. Our novel findings thus suggest that the acute SARS-coronavirus infection probably contributes to the initial reduction of DC and T-cell subsets in blood, and that high-dose steroid administration may subsequently exacerbate and prolong low expression of the cell subsets. These findings will aid the framing of further studies of the immunopathogenesis of SARS.
Keywords: SARS, Myeloid dendritic cells, Plasmacytoid dendritic cells, Coronavirus, Steroid
Introduction
The worldwide outbreak of severe acute respiratory syndrome (SARS) led to 8098 cases and 774 deaths in 26 countries during the first half year of 2003 [1]. Beijing, the region most affected by the epidemic, reported 2521 cases and 191 deaths [2]. Shortly after the description of this new viral disease, a novel infectious coronavirus (SARS-CoV) was identified as its pathogenic agent. Clinical observation has revealed that hematological changes in peripheral blood and acute lung injury are the major clinical characteristics of SARS. A marked lymphocytopenia occurred in most patients during the acute phase of SARS, with CD4 and CD8 T-cell subsets particularly affected, and the degree of reduction of circulating T lymphocyte counts was found to be associated with disease severity, indicating that host immune functional changes are involved in the initiation and progression of SARS [3], [4], [5], [6]. Although acute lung injury and hematological manifestations have been observed in patients with SARS, the mechanisms underlying for pathogenesis of SARS-CoV infection are not yet understood.
Dendritic cells (DCs) have been demonstrated to function in orchestrating the immune response against invading pathogens including bacteria, parasites, and viruses [7], [8], [9]. Although DCs include multiple subsets, human peripheral blood DCs can be principally grouped into at least two distinct subsets, myeloid dendritic cells (mDCs) and plasmacytoid dendritic cells (pDCs), on the base of their lineages and phenotypic and functional differences [8]. In general, human mDCs are well-equipped to induce Th1 polarization via production of interleukin (IL)-12 or tumor necrosis factor (TNF)-α when properly stimulated. pDCs are characterized by their distinct capacity to produce large amounts of type I IFN in response to virus [10], [11]. However, the functions of each DC subset are flexible in vivo and vary according to their state of activation and the nature of the maturation stimuli given to DCs [12]. Recent clinical studies by our and other laboratories have demonstrated numerical decrease and functional impairment of both mDC and pDC subsets in blood of patients with chronic viral infections, resembling those caused by human immunodeficiency virus (HIV) [13], [14], hepatitis C virus (HCV) [15], and hepatitis B virus (HBV) [16], [17]. Moreover, pDC counts decrease in parallel with the progression of HIV-related disorders [14]. Currently, whether DCs participate in SARS is still unclear, since there is a paucity of clinical data concerning DCs in patients with this condition [18].
Early evidence suggested that the acute lung injury in SARS patients is a characteristic pathological alteration that may be induced by inflammatory and immune cells, as well as the cytokines and chemokines they release [19]. Steroid treatment is believed to play an immunosuppressive role and to confer clinical benefits in the treatment of SARS, though randomized clinical trials to support its clinical efficacy are not available. To investigate the role of DCs in the immune pathogenesis of SARS-CoV infection and the effect of steroids on DCs in SARS patients, we serially examined circulating mDC and pDC subsets, as well as CD4 and CD8 T cells in 74 SARS patients who received steroid treatment. In addition, we screened the expression of SARS-CoV receptor angiotensin-converting enzyme 2 (ACE2) on both peripheral DC and lymphocyte populations, and examined associations between DC number and specific antibody generation.
Materials and methods
Subjects and samples
Seventy-four patients with SARS enrolled in this study were all hospitalized in our unit from March 5th to July 31st of 2003. Clinical diagnoses were made on the basis of the Interim Standard for Clinical Diagnosis of Infectious Atypical Pneumonia issued by the Office of the Chinese Ministry of Health on 4 May 2003, and met the case definitions of SARS recommended by World Health Organization (WHO) [20]. Among these patients, thirty-one are males and forty-three are females. Five patients died from the disease. Average age of patients was 34.6 ± 13.4 years old. All patients had a high fever (≥38) before receiving steroid treatment, and all had mild or severe progressive consolidation change on serial chest radiographs in one or both sides of lungs during the first week of illness. Pneumonia severity was marked as mean chest radiograph score calculated on the basis of average percentage of area manifesting the ground glass opacification, consolidation, or nodular shadow in each lung with a maximal score of 10 (equivalent to 100% area involved). The overall chest radiographic score was the summation of scores from both lungs, with a total score of 20 [21].
Heparinized fresh peripheral blood samples were obtained from the patients weekly if possible. There were 260 blood samples in total availably used for examination of DC and T-cell subsets in our study. Most of the patients began to receive the analyses of peripheral DCs and T-cell subsets at 3.8 ± 2.2 days since the disease onset. Twenty-five blood samples from healthy donors were recruited as controls. Plasma samples were isolated from the peripheral blood through centrifugation and stored at −70°C for detection of SARS-CoV RNA, cytokines, and specific antibody. The study protocol was approved by the Ethics Committee of our unit, and written informed consent was obtained from each subject.
Treatment protocol of steroids
All patients received ribavirin and steroid combination therapy. Therapeutic dose of methylprednisolone includes ≤40 mg/day, 80–160 mg/day, or ≥240 mg/day (intravenously once a day) based on the clinical manifestation, radiograph deterioration, PO2 decrease, high fever, and ventilation of patients. The timing to commence corticosteroid and ribavirin therapy varied for each individual patient. Except for 16 patients, steroid treatment was started at the first week after the onset of their illness. The total dose of steroid administration each day was divided twice daily, through i.v. In addition, when SARS individuals had no fever and dyspnea, and the chest radiography was greatly improved, the dose of steroid was gradually reduced and finally withdrew if possible.
Quantification of peripheral DC and T-cell subsets
For analysis of DC subsets, heparinized fresh peripheral blood were added into 4 tubes, all incubated with a mixed lineage cocktail of fluorescein isothiocyanate (FITC)-conjugated monoclonal antibodies (mAbs) (including CD3, CD14, CD16, CD19, CD20, and CD56 mAbs) and PerCP-conjugated anti-HLA-DR mAb. Phycoerythrein (PE)-conjugated mAbs against CD11c, CD123, or the isotypes (BD PharMingen, San Diego, CA) were separately added into each tube. The tubes were incubated for 20 min at 4°C. Afterwards, 2 ml of FACS™ lysing solution (BD PharMingen) was added and samples were incubated at room temperature for 10 min in the dark. After having been washed twice with PBS, cells were fixed in 1% of paraformaldehyde and three-color flow cytometric analysis was performed using FACSCalibur (Becton Dickinson, San Jose, CA). Circulating mDCs were defined as lineage− HLA-DR+CD11c+, and pDCs was defined as lineage− HLA-DR+CD123+ (Fig. 1 ). The percentage and absolute numbers of mDCs and pDCs were calculated on the basis of total peripheral lymphocyte and monocyte absolute counts, as determined by an automated differential blood count.
Fig. 1.

Identification of myeloid and plasmacytoid dendritic cells (mDCs and pDCs) by flow cytometric analysis. Fresh peripheral blood mononuclear cells (PBMC) were gated from total peripheral leukocytes based on their forward and side scatter (R1). PerCP-HLA-DR+ and FITC-lineage− (CD3−CD14−CD16−CD19−CD20−CD56−) cells (R2) from PBMC were identified as mDCs for PE-CD11c+ subpopulation (R3) and pDCs for PE-CD123+ subpopulation (R4), respectively.
CD4 and CD8 T cells were analyzed with a SimultestTM IMK-Lymphocyte kit (BD Biosciences, San Jose, CA). In brief, heparinized fresh peripheral blood cells were separately incubated with mAbs of FITC-conjugated anti-CD45 and PE-conjugated anti-CD14, or FITC-conjugated anti-CD3 and PE-conjugated anti-CD4 or anti-CD8. The incubation was kept for 20 min at 4°C, followed by lysis of red blood cells, washing and fixation of staining cells as mentioned above. Lymphocyte population gating was performed according to the manufacturer's instructions.
Screening ACE2 expression on the DC and T lymphocytes
Peripheral blood mononuclear cells (PBMC) were incubated with optimal biotinylated goat-anti-human ACE-2 ectodomain antibody (R&D, Minneapolis, MN) at room temperature for 1 h. After washing twice with PBS, cells were divided into separate tubes, individually incubated with PE- or FITC-conjugated mAbs of CD3, CD4, CD8, CD16, CD56 (BD PharMingen), and BDCA1 (CD1c) or BDCA2 (CD303) (Miltenyi Biotec, Gladbach, Germany) together with complementary FITC- or PE-conjugated streptavidin (R&D) at 4°C for 30 min in the dark. Afterwards, cells were washed and fixed for analysis as aforementioned. Vero E6 and Hela cells were used for positive and negative controls for ACE2 staining, respectively.
Detection of SARS-CoV RNA in plasma
The method, as employed in our previous study, is based on publication with modification [22], [23], [24]. In brief, RNA was extracted directly from plasma using the QIAamp Viral RNA Mini Kit (Qiagen, Hilden, Germany) according to the manufacturer's instruction. The viral RNA was amplified through nested reverse-transcription polymerase chain reaction (RT-PCR), using two pairs of primers (outer sense/antisense primers: 5′-ATGAATTACCAAGTCAATGGTTAC-3′/5′-CATAACCAGTCGGTACAGCTA-3′; inner sense/antisense primers: 5′-GAAGCTATTCGTCACGTTCG-3′/CTGTAGAAAATCCTAGCTGGAG-3′). The products were analyzed by electrophoresis in 2.5% agarose gel containing 0.5 μg/ml of ethidium bromide. The viral sequence was confirmed by DNA sequence analysis.
Detection of anti-SARS-CoV antibody
Plasma anti-SARS-CoV IgG antibody was detected according to the instruction of commercially available enzyme-linked immunosorbent assay (ELISA) kit (Huada-Jibiai Biotech, Beijing). Indirect assay was employed by the kit using culture-obtained SARS-CoV antigen for the capture of antibody. OD value ≥0.105 was judged as positive.
Statistical analysis
All data were analyzed using SPSS software (SPSS Inc., Chicago, Illinois). Statistical significance of difference between the 2 groups was determined by applying an unpaired Student's t test. Spearman correlation analysis was performed between numbers of the DC or T-cell subsets and steroid dosage administrated 1 day before sampling. P value of less than 0.05 is considered as a significant difference.
Results
Dynamic changes in circulating DC and T-cell subsets in SARS patients
A combination of several markers was used to define mDCs (lineage−, HLA−DR+, and CD11c+) and pDCs (lineage−, CD11c−, HLA−DR+, and CD123+) in blood [8], [9], as shown in Fig. 1. Mean numbers of peripheral mDCs and pDCs in SARS patients were significantly reduced at week 1 (patients vs. healthy controls, 4.94 ± 5.0/μl vs. 11.9 ± 2.5/μl for mDCs, P < 0.01; and 3.14 ± 2.84/μl vs. 8.8 ± 4.7/μl for pDCs, P < 0.01), and rapidly decreased to minimum levels at week 2 of illness (2.24 ± 4.38/μl and 0.31 ± 0.59/μl for mDCs and pDCs, respectively). At this point, the reduction was 5.3-fold for mDCs and 28.4-fold for pDCs compared with healthy controls. Numbers of both mDCs and pDCs then gradually increased and reached normal levels at a mean of week 6 for mDCs and week 7 for pDCs after the onset of illness, respectively (Fig. 2A). In addition, prolongation of the period with decreased number of DCs was observed in some SARS patients with critical status continuing to weeks 7–10 of illness. In our units, there were 16 patients not receiving steroid treatment in the first week of illness, who also exhibited decreased numbers of circulating mDCs (7.5 ± 3.3/μl vs. 11.9 ± 2.5/μl, P < 0.01) and pDCs (5.7 ± 3.1/μl vs. 8.8 ± 4.7/μl, P < 0.05, respectively) compared with healthy controls, but higher amounts of both mDCs and pDCs than the patients with steroid treatment (Fig. 3A).
Fig. 2.

Dynamic changes in circulating mDCs and pDCs, CD4 and CD8 T cells in patients with severe acute respiratory syndrome. The profiles represent changes in absolute number of mDCs and pDCs (A), CD4 T and CD8 T cells (B) in 74 hospitalized patients. *P < 0.01, P < 0.05 as compared with 25 healthy controls; Mean values in peripheral blood of healthy controls are 11.9 ± 2.5/μl for mDCs (A, horizontal solid line), 8.8 ± 4.7/μl for pDCs (A, horizontal dashed line), 664.2 ± 300.8/μl for CD4 T (B, horizontal solid line), and 532.6 ± 275.4/μl for CD8 T cells (B, horizontal dashed line), respectively. n indicates the number of SARS patients examined each week. Values are expressed as means with standard deviations.
Fig. 3.

Comparisons of amounts of peripheral DC subsets (A) and T-cell subsets (B) between the healthy controls (yellow column) and SARS patients with (blue column) and without steroid treatment (red column). n indicates the number of SARS patients examined. Values are expressed as means with standard deviations. *P < 0.05, **P < 0.01.
Although SARS patients had similar peripheral leukocyte counts, but with a broader range of variation (7.52 ± 5.32 × 10⁹/l) compared with healthy controls (6.06 ± 1.57 × 10⁹/l) in the first week of illness, lymphocytopenia was observed in all of them at that time, and in 44 cases lymphocyte count was less than 40% of average level of the healthy controls. Mean numbers of circulating CD4 and CD8 T cells in patients were 309.8 ± 110.2/μl and 302.8 ± 126.4/μl, respectively, at week 1 of illness, with 2.1- and 1.8-fold reductions, respectively, compared with healthy controls (664.2 ± 300.8/μl for CD4 T cells and 532.6 ± 275.4/μl for CD8 T cells). Afterwards, numbers of both CD4 and CD8 T cells progressively increased to reach normal levels by week 3 and week 4 of illness, respectively (Fig. 2B). For the16 patients not receiving steroid treatment in the first week of illness, CD4 T cells (321.6 ± 116/μl vs. 664.2 ± 300.8/μl, P < 0.05) and CD8 T cells (316 ± 108.9/μl vs. 532.6 ± 275.4/μl, P < 0.05) were also significantly lower compared with healthy controls. In addition, though the patients with steroid therapy exhibited slight lower amounts of T-cell subsets that those without steroid therapy, there was no difference between the two groups (Fig. 3B).
Reductions of amounts of mDCs and pDCs inversely correlated with steroid administration
To evaluate the effect of steroid treatment on circulating DC and T-cell subsets, patients were categorized into three groups based on doses of steroid treatment regimens (≤40 mg/day, 80–160 mg/day, or ≥240 mg/day). Peripheral mDCs, pDCs, CD4, and CD8 T-cell numbers were monitored weekly for each individual. Considering the delay in effect of steroids, the dose administered 1 day before sampling was used in analysis. As shown in Fig. 4 , steroid administration was inversely correlated with absolute numbers of both circulating DC and T-cell subsets. In general, patients in the group receiving higher doses of steroid had lower numbers of circulating mDCs, pDCs, CD4, and CD8 T cells and slower restoration of cell numbers to normal levels than patients in the group receiving lower doses of steroid. A significant inverse correlation between steroid dosage and numbers of cells in DC subsets was observed from week 2 after the onset of illness. This correlation was sustained throughout the course of steroid administration for the subjects examined. By contrast, though a significant inverse correlation was also observed between steroid dosage and numbers of CD4 and CD8 T cells, the duration of decrease in numbers of cells in T-cell subsets was shorter. In addition, no clear correlation was observed between the changes in numbers of cells of DC or T-cell subsets and ribavirin treatment in our study.
Fig. 4.

Comparison of circulating dendritic and T-cell numbers among patients receiving different doses of steroid (≤40 mg/day, 80–160 mg/day, and ≥240 mg/day). The data are from 74 patients with SARS. Comparison was performed for numbers of circulating mDCs (A), pDCs (B), CD4 T cells (C), and CD8 T cells (D) each week throughout the course of illness. The upper table indicates the numbers of SARS patients examined for different groups receiving a given dose of steroid treatment (≤40 mg/day, 80–160 mg/day, and ≥240 mg/day) each week. In the lower figure panel, values are expressed as means topped by standard deviations. Spearman correlation analyses were performed between cell number and steroid dosage administered one day before sampling. The coefficients (R) and P values (P) are listed for each group in the panels underneath the figure.
DC and T-cell subsets do not express surface ACE2
Cells stained with antibodies to ACE2 and specific CD markers (see Materials and methods) were employed for flow cytometric analysis. The screening results showed that, with the exception of the positive control Vero E6 cells, all blood cells tested including those of the DC and T-cell subsets were negative for surface expression of ACE2 (data not shown).
Association of reduction of DC amount with generation of anti-SARS-CoV antibody
In our study, 19 SARS patients were weekly monitored for peripheral DC subsets and anti-SARS-IgG antibody throughout the course of disease. To investigate whether the dynamic changes in the DC subsets were associated with antibody response, the 19 patients were artificially divided into 2 groups: a DC-high group (n = 7) and a DC-low group (n = 12) on the basis of the restoration of both mDC and pDC numbers in the convalescent phase (week 5 to week 7). Patients were assigned into the DC-high group if the numbers of both mDCs and pDCs, at least, reached higher than the mean value of the healthy controls during this period. Otherwise, patients were assigned into the DC-low group. In this way, both groups had similar DC counts over the initial 4 weeks of illness, but the DC-high group had an earlier increase and full restoration of DC numbers (Figs. 5A and B). As shown in Fig. 5C, the DC-high group had a better IgG anti-SARS-CoV antibody response than the DC-low group, suggesting that persistence of reduction of both mDC and pDC subsets might have affected the generation of the specific antibody in SARS-CoV infection, as previously speculated [7], [25].
Fig. 5.

Analysis of association of myeloid dendritic cell subsets (mDCs or pDCs) with specific antibody profiles. Patients with SARS were divided into a DC-high group (n = 7) and DC-low group (n = 12) based on dynamic changes in circulating DC subsets. In the convalescent phase of illness, the DC-high group exhibited earlier increase and full restoration of cell number than the DC-low group (A and B). Plasma IgG antibody against SARS-CoV was monitored weekly as shown by the average optical density (OD) for each group determined by ELISA (C). OD value ≥0.105 was considered positive. Data are expressed as means topped by standard deviations.
Longitudinal observation of 6 representative individuals with SARS
To determine profiles of DC and T-cell subset numbers, clinical status, steroid and ribavirin administration, as well as viral RNA and specific antibody status overall, we selected 6 representative individual cases of SARS who were examined for these parameters throughout the course of SARS. As shown in Fig. 6 , the administration of steroid often can attenuate high fever and decrease the high body temperature. Patient 1 had a normal body temperature on day 8 because he had received the high-dose steroid treatment (160–480 mg/day) since the 6th day of disease (time was showed in the first line in upper table). Patient 2 also received steroid therapy (80–160 mg/day) beginning on second day of illness and had a normal body temperature on the 5th day when very lower levels of mDCs and pDCs were analyzed. Patient 5 had a similar condition like patients 1 and 2. Fig. 6 also displayed that SARS-CoV RNA and specific antibody were detectable in plasma from all of these patients (coexistence of viral RNA and antibody was observed in patients 2 and 5). Five patients (1, 2, 3, 4, and 5) were clinically in critical status and one case (patient 6) was in general (non-critical) status. Patient 1 (51 years old, male) and patient 2 (73 years old, male) exhibited extreme decrease in circulating numbers of the DC and T-cell subsets throughout high-dose steroid treatment. Both succumbed to SARS because of development of severe immune suppression or impairment, which favored multiple organ failure and development of aspergillosis, as previously reported [26]. Patients 3, 4, 5, and 6, who survived, also had low peripheral cell expression when receiving high-dose steroid treatment, but this change was reversible during convalescent phase with reduction or suspension of steroid administration.
Fig. 6.
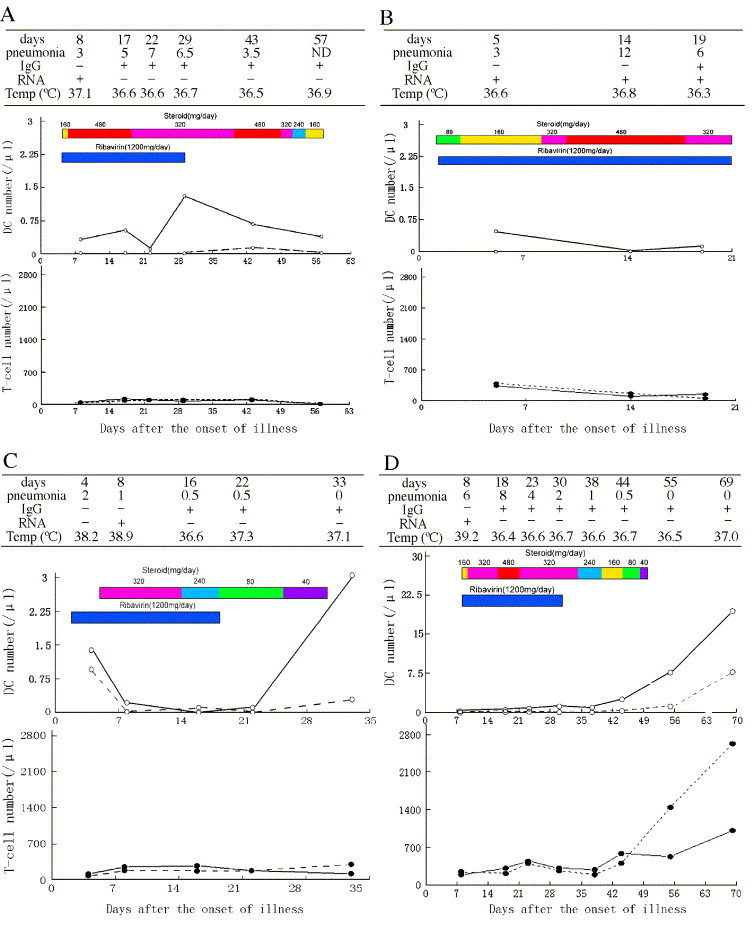
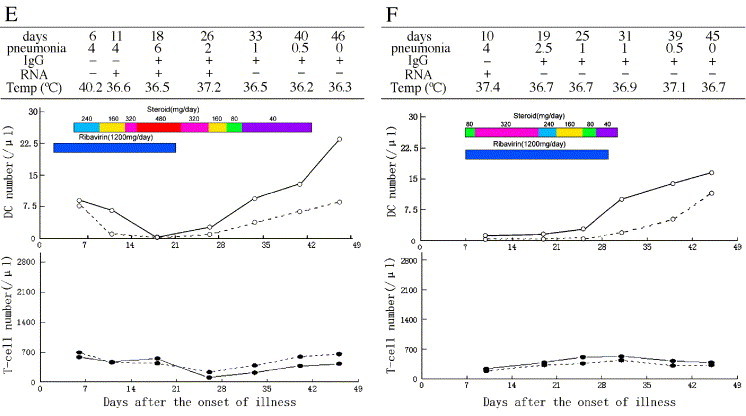
Longitudinal observation of 6 representative SARS patients over the course of illness. For each of 6 patients with SARS, the upper table shows the severity of pneumonia, detection of SARS coronavirus RNA, specific IgG antibody in plasma, and body temperature recorded on different days. The lower figure shows dynamic alterations in numbers of circulating mDCs, pDCs, CD4, and CD8 T-cell subsets as well as the doses (each being represented by given color) of steroid and ribavirin administered. y axis of DCs calibration is 0–3/μl for patient 1–3 and 0–30/μl for patient 3–6, respectively. The severity of pneumonia is marked as mean chest radiograph score with a maximum score of 10 for pathology in each lung (a total score of 20 for pathology in both lungs) according to Ho et al. [21]. Findings for each patient are detailed in Results.
Discussion
SARS is an acute self-limited disease. Its clinical progression is mostly uniform, with a tri-phasic pattern, which includes an active viral replication phase (1st–8th day of illness), immune storm or lung damage phase (8th–15th), and convalescent phase (roughly after the 16th day), though these three phases probably overlap [3], [27]. In our study, longitudinal observation demonstrated for the first time a rapid, dramatic decline and sustained period of low levels of peripheral subsets of both mDCs and pDCs. We simultaneously observed a significant but reversible decrease in both CD4 and CD8 T-cell populations, consistent with previous reports [4], [5]. SARS is characterized by a peak in viral load in respiratory secretions around the 10th day of illness, with subsequent decrease [27]. Our findings showed that peak reduction of DC subsets often occurred around the 12th–15th day of disease and partly overlapped with the lung damage phase. Since 16 patients with SARS were not administered steroid in week 1 of illness, the initial reduction of both DC and T-cell subsets may have been due mainly to acute SARS-CoV infection.
Previous reports suggested that SARS-CoV infection probably induced mild immunosuppression, and that immune function was further suppressed by high-dose steroid treatment [26], [28]. However, it is still unclear how the human immune system is impaired in SARS infection. Our findings showed amounts of DCs and T cells were inversely correlated with intensity of high-dose steroid treatment in SARS patients (Fig. 4, Fig. 6), though our data should be interpreted with caution (see below). Notably, the DC subsets in blood exhibited significant delay in restoration to normal number compared with clinical recovery and resolution of pulmonary damage in our study. In addition, our findings suggest that lower counts of mDC and pDC subsets may be associated with poor prognosis in some patients, as in a previous study of low CD4 and CD8 lymphocyte counts [27]. It is likely that use of steroid at high doses (≥160 mg/day) over 2–3 weeks further exacerbated and prolonged the decrease in numbers of pDCs and mDCs in SARS patients. Therefore, long-term use of high-dose steroid therapy is potentially risky, especially for SARS patients in critical status who have other conditions like diabetes and heart disease. Compared with the mDCs and T-cell subsets, pDCs exhibited a greater decrease and slower restoration of number, suggesting at a minimum that circulating pDCs are likely to be more sensitive to steroid administration, as described by Shodell et al. [29], [30]. In addition to direct effects of SARS-CoV infection, the following mechanisms may have accounted for the reduction of circulating mDCs, pDCs, and T-cell subsets in SARS patients: (1) Steroid treatment may induce apoptosis of activated T cells [31] and T-lymphocyte movement out of the intravascular compartment [32]. In particular, the decrease of DC subsets might have been caused by preferential trafficking and recruitment of these cells into the pathologically pulmonary tissue sites from naturally circulating blood as reported in tuberculosis [33]. (2) Glucocorticoids may suppress differentiation and maturation of DC subsets, induce their apoptosis and tissue sequestration singly or together [34], [35], [36], [37].
Some viruses may directly infect immunocytes and cause impairment of the cell populations, as occurs in HCV infection [38]. However, it is still unclear how SARS-CoV impairs the human immune system in the pathogenesis of SARS-CoV infection. SARS-CoV replication was observed in PBMC [39], and mDCs are able to interact with S protein and to bind virus [40]. Even though ACE2 is the functional receptor for SARS-CoV [41], our findings further demonstrated lack of ACE2 expression on human DC subsets and T lymphocytes, consistent with previous findings [42]. It is thus unlikely that the decreases in numbers of circulating DC and T-cell subsets in vivo are due to direct injury by SARS-CoV infection of these cells through ACE2 molecules. In addressing this issue, some investigators have recently reported that SARS-CoV may infect macrophages through cellular phagocytosis, and enter mDCs through viral binding to surface DC-SIGN receptors [43] or other unclear mechanisms since DCs rarely express DC-SIGN in vivo [44]. Recent studies have shown that viral infection usually induces the production of large amounts of IFN-α by pDCs, as a host defense against virus [14], [45]. However, we found a significantly lower level of plasma IFN-α (161.09 ± 132.69 pg/ml) in 85.7% patients in the acute phase of SARS illness than in healthy controls (867.18 ± 306.50 pg/ml) [46]. This finding accords with the observed reduction of pDC number, but the precise relationship between these remains to be clarified.
In this study, we were unable to design a randomized controlled investigation during an emergency associated with a SARS outbreak. The limited availability of clinical specimens restricted the sample size in some groups, and functional analysis of mDCs and pDCs was insufficient. It is thus difficult to conclude with certainty that the observed reduction of DC subset numbers was entirely the result of steroid treatment. On the other hand, our clinical observations indeed suggest that dose of steroid does impact numbers of DC as well as T-cell subsets, since most of the SARS patients, both those in non-critical and critical status, exhibited further reduction of cell number soon after receiving steroid therapy (Fig. 4).
Previous studies have reported that both mDC and pDC subsets may affect the production of antibody [25], [47], [48]. In this study, we observed the interesting finding that SARS patients with faster restoration of mDC and pDC subsets in peripheral blood had a better antibody response to SARS-CoV than patients with slower restoration of mDC and pDC subsets. However, this finding should be interpreted with caution, since use of high-dose steroid was more common in critical cases. Whether this finding is directly associated with impairment of mDCs and pDCs remains to be clarified.
In conclusion, we observed for the first time a dramatic but reversible decrease in circulating subsets of mDCs and pDCs in SARS patients. In addition, our findings suggest that acute SARS-CoV infection may contribute to the rapid initial reduction of both circulating mDCs and pDCs. Subsequently, steroid administration, particularly at high doses over weeks, probably exacerbated and prolonged the decrease in numbers of DC subset as well as T-cell subsets. These findings will be of use in framing further studies of the immunopathogenesis of SARS.
Acknowledgments
This work was supported by grants from the National Key Basic Research Program of China (2001CB51003), the Sino-UK Collaboration Foundation for SARS Immunopathogenesis Study (No. H030230100130), and the Beijing Natural Science Foundation (No. 7034051).
References
- 1.World Health Organization. Summary of probable SARS with onset of illness from 1 November 2002 to 31 July 2003. 2004; Available at: http://www.who.int/csr/sars/country/table2004_04_21/en/. Accessed 8 May 2004.
- 2.Liang W.N., Mi J., Information Branch Joint Leadership Group of SARS Prevention and Control in Beijing Epidemiological features of severe acute respiratory syndrome in Beijing. Zhonghua Liu Xing Bing Xue Za Zhi. 2003;24:1953–1966. [PubMed] [Google Scholar]
- 3.Peiris J.S., Chu C.M., Cheng V.C., Chan K.S., Hung I.F., Poon L.L., Law K.I., Tang B.S., Hon T.Y., Chan C.S., Chan K.H., Ng J.S., Zheng B.J., Ng W.L., Lai R.W., Guan Y., Yuen K.Y., HKU/UCH SARS Study Group Clinical progression and viral load in a community outbreak of coronavirus-associated SARS pneumonia: a prospective study. Lancet. 2003;361:1767–1772. doi: 10.1016/S0140-6736(03)13412-5. [DOI] [PMC free article] [PubMed] [Google Scholar]
- 4.Wong R.S., Wu A., To K.F., Lee N., Lam C.W., Wong C.K., Chan P.K., Ng M.H., Yu L.M., Hui D.S., Tam J.S., Cheng G., Sung J.J. Haematological manifestations in patients with severe acute respiratory syndrome: retrospective analysis. BMJ. 2003;326:1358–1362. doi: 10.1136/bmj.326.7403.1358. [DOI] [PMC free article] [PubMed] [Google Scholar]
- 5.Cui W., Fan Y., Wu W., Zhang F., Wang J.Y., Ni A.P. Expression of lymphocytes and lymphocyte subsets in patients with severe acute respiratory syndrome. Clin. Infect. Dis. 2003;37:857–859. doi: 10.1086/378587. [DOI] [PMC free article] [PubMed] [Google Scholar]
- 6.National Research Project for SARS, Beijing Group The involvement of natural killer cells in the pathogenesis of severe acute respiratory syndrome. Am. J. Clin. Pathol. 2004;121:507–511. doi: 10.1309/WPK7Y2XKNF4CBF3R. [DOI] [PMC free article] [PubMed] [Google Scholar]
- 7.Carbone F.R., Heath W.R. The role of dendritic cell subsets in immunity to viruses. Curr. Opin. Immunol. 2003;15:416–420. doi: 10.1016/s0952-7915(03)00074-8. [DOI] [PubMed] [Google Scholar]
- 8.Liu Y.J. Dendritic cell subsets and lineages, and their functions in innate and adaptive immunity. Cell. 2001;106:259–262. doi: 10.1016/s0092-8674(01)00456-1. [DOI] [PubMed] [Google Scholar]
- 9.Gerosa F., Baldani-Guerra B., Nisii C., Marchesini V., Carra G., Trinchieri G. Reciprocal activating interaction between natural killer cells and dendritic cells. J. Exp. Med. 2002;195:327–333. doi: 10.1084/jem.20010938. [DOI] [PMC free article] [PubMed] [Google Scholar]
- 10.Cella M., Facchetti F., Lanzavecchia A., Colonna A. Plasmacytoid dendritic cells activated by influenza virus and CD40L drive a potent TH1 polarization. Nat. Immunol. 2000;1:305–310. doi: 10.1038/79747. [DOI] [PubMed] [Google Scholar]
- 11.Liu Y.J. IPC: professional Type 1 interferon-producing cells and plasmacytoid dendritic cell precursors. Annu. Rev. Immunol. 2005;23:275–306. doi: 10.1146/annurev.immunol.23.021704.115633. [DOI] [PubMed] [Google Scholar]
- 12.Langenkamp A., Messi M., Lanzavecchia A., Sallusto F. Kinetics of dendritic cell activation: impact on priming of TH1, TH2 and nonpolarized T cells. Nat. Immunol. 2000;4:311–316. doi: 10.1038/79758. [DOI] [PubMed] [Google Scholar]
- 13.Donaghy H., Gazzard B., Gotch F., Patterson S. Dysfunction and infection of freshly isolated blood myeloid and plasmacytoid dendritic cells in patients infected with HIV-1. Blood. 2003;101:4505–4511. doi: 10.1182/blood-2002-10-3189. [DOI] [PubMed] [Google Scholar]
- 14.Soumelis V., Scott I., Gheyas E., Bouhour D., Cozon G., Cotte L., Huang L., Levy J.A., Liu Y.J. Depletion of circulating natural type 1 interferon-producing cells in HIV-infected AIDS patients. Blood. 2001;98:906–912. doi: 10.1182/blood.v98.4.906. [DOI] [PubMed] [Google Scholar]
- 15.Anthony D.D., Yonkers N.L., Post A.B., Asaad R., Heinzel F.P., Lederman M.M., Lehmann P.V., Valdez H. Selective impairments in dendritic cell-associated function distinguish hepatitis C virus and HIV infection. J. Immunol. 2004;172:4907–4916. doi: 10.4049/jimmunol.172.8.4907. [DOI] [PubMed] [Google Scholar]
- 16.Beckebaum S., Cicinnati V.R., Dworacki G., Muller-Berghaus J., Stolz D., Harnaha J., Whiteside T.L., Thomson A.W., Lu L., Fung J.J., Bonham C.A. Reduction in the circulating pDC1/pDC2 ratio and impaired function of ex vivo-generated DC1 in chronic hepatitis B infection. Clin. Immunol. 2002;104:138–150. doi: 10.1006/clim.2002.5245. [DOI] [PubMed] [Google Scholar]
- 17.Duan X.Z., Wang M., Li H., Zhuang H., Xu D., Wang F.S. Decreased frequency and function of circulating type 2 precursor dendritic cells (pDC2) in hepatitis B virus infected humans. J. Clin. Immunol. 2004;24:637–646. doi: 10.1007/s10875-004-6249-y. [DOI] [PubMed] [Google Scholar]
- 18.Zhang Z., Wang F.S., Zhao M., Liu J.C., Xu D., Jin L., Chen J.M., Wang M., Chu F.L. Characterization of peripheral dendritic cell subsets and its implication in patients infected with severe acute respiratory syndrome. Zhonghua Yi Xue Za Zhi. 2004;84:22–26. [PubMed] [Google Scholar]
- 19.Nicholls J.M., Poon L.L., Lee K.C., Ng W.F., Lai S.T., Leung C.Y., Chu C.M., Hui P.K., Mak K.L., Lim W., Yan K.W., Chan K.H., Tsang N.C., Guan Y., Yuen K.Y., Peiris J.S. Lung pathology of fatal severe acute respiratory syndrome. Lancet. 2003;361:1771–1778. doi: 10.1016/S0140-6736(03)13413-7. [DOI] [PMC free article] [PubMed] [Google Scholar]
- 20.Zou Z., Yang Y., Chen J., Xin S., Zhang W., Zhou X., Mao Y., Hu L., Liu D., Chang B., Chang W., Liu Y., Ma X., Wang Y., Liu X. Prognostic factors for severe acute respiratory syndrome: a clinical analysis of 165 cases. Clin. Infect. Dis. 2004;38:483–489. doi: 10.1086/380973. [DOI] [PMC free article] [PubMed] [Google Scholar]
- 21.Ho J.C., Ooi G.C., Mok T.Y., Chan J.W., Hung I., Lam B., Wong P.C., Li P.C., Ho P.L., Lam W.K., Ng C.K., Ip M.S., Lai K.N., Chan-Yeung M., Tsang K.W. High-dose pulse versus nonpulse corticosteroid regimens in severe acute respiratory syndrome. Am. J. Respir. Crit. Care Med. 2003;168:1449–1456. doi: 10.1164/rccm.200306-766OC. [DOI] [PubMed] [Google Scholar]
- 22.Drosten C., Gunther S., Preiser W., van der Werf S., Brodt H.R., Becker S., Rabenau H., Panning M., Kolesnikova L., Fouchier R.A., Berger A., Burguiere A.M., Cinatl J., Eickmann M., Escriou N., Grywna K., Kramme S., Manuguerra J.C., Muller S., Rickerts V., Sturmer M., Vieth S., Klenk H.D., Osterhaus A.D., Schmitz H., Doerr H.W. Identification of a novel coronavirus in patients with severe acute respiratory syndrome. N. Engl. J. Med. 2003;348:1967–1976. doi: 10.1056/NEJMoa030747. [DOI] [PubMed] [Google Scholar]
- 23.Xu D., Zhang Z., Wang F.S. SARS-associated coronavirus quasispecies in individual patients. N. Engl. J. Med. 2004;350:1366–1367. doi: 10.1056/NEJMc032421. [DOI] [PubMed] [Google Scholar]
- 24.Xu D., Zhang Z., Chu F., Li Y., Jin L., Zhang L., Gao G.F., Wang F.S. Genetic variation of SARS coronavirus in Beijing hospital. Emerg. Infect. Dis. 2004;10:789–794. doi: 10.3201/eid1005.030875. [DOI] [PMC free article] [PubMed] [Google Scholar]
- 25.Jego G., Palucka A.K., Blanck J.P., Chalouni C., Pascual V., Banchereau J. Plasmacytoid dendritic cells induce plasma cell differentiation through type I interferon and interleukin 6. Immunity. 2003;19:225–234. doi: 10.1016/s1074-7613(03)00208-5. [DOI] [PubMed] [Google Scholar]
- 26.Wang H., Ding Y., Li X., Yang L., Zhang W., Kang W. Fatal aspergillosis in a patient with SARS who was treated with corticosteroids. N. Engl. J. Med. 2003;349:507–508. doi: 10.1056/NEJM200307313490519. [DOI] [PubMed] [Google Scholar]
- 27.Peiris J.S., Yuen K.Y., Osterhaus A.D., Stohr K. The severe acute respiratory syndrome. N. Engl. J. Med. 2003;349:2431–2441. doi: 10.1056/NEJMra032498. [DOI] [PubMed] [Google Scholar]
- 28.Wang F.S., Chu F.L., Jin L., Li Y.G., Zhang Z., Xu D., Shi M., Wu H., Mounds J.M. Acquired but reversible loss of erythrocyte complement receptor 1 (CR1, CD35) and its longitudinal alteration in patients with severe acute respiratory syndrome. Clin. Exp. Immunol. 2005;139:112–119. doi: 10.1111/j.1365-2249.2005.02681.x. [DOI] [PMC free article] [PubMed] [Google Scholar]
- 29.Shodell M., Siegal F.P. Corticosteroids depress IFN-alpha-producing plasmacytoid dendritic cells in human blood. J. Allergy Clin. Immunol. 2001;108:446–448. doi: 10.1067/mai.2001.117928. [DOI] [PubMed] [Google Scholar]
- 30.Shodell M., Shah K., Siegal F.P. Circulating human plasmacytoid dendritic cells are highly sensitive to corticosteroid administration. Lupus. 2003;12:222–230. doi: 10.1191/0961203303lu362xx. [DOI] [PubMed] [Google Scholar]
- 31.Brunetti M., Martelli N., Colasante A., Piantelli M., Musiani P., Aiello F.B. Spontaneous and glucocorticoid-induced apoptosis in human mature T lymphocytes. Blood. 1995;86:4199–4205. [PubMed] [Google Scholar]
- 32.Yang M., Li C.K., Li K., Hon K.L., Ng M.H., Chan P.K., Fok T.F. Hematological findings in SARS patients and possible mechanisms. Int. J. Mol. Med. 2004;14:311–315. [PubMed] [Google Scholar]
- 33.Uehira K., Amakawa R., Ito T., Tajima K., Naitoh S., Ozaki Y., Shimizu T., Yamaguchi K., Uemura Y., Kitajima H., Yonezu S., Fukuhara S. Dendritic cells are decreased in blood and accumulated in granumloma in tuberculosis. Clin. Immunol. 2002;105:296–303. doi: 10.1006/clim.2002.5287. [DOI] [PubMed] [Google Scholar]
- 34.Moser M., de Smedt T., Sornasse T., Tielemans F., Chentoufi A.A., Muraille E., van Mechelen M., Urbain J., Leo O. Glucocorticoids down-regulate dendritic cell function in vitro and in vivo. Eur. J. Immunol. 1995;25:2818–2824. doi: 10.1002/eji.1830251016. [DOI] [PubMed] [Google Scholar]
- 35.Brokaw J.J., White G.W., Baluk P., Anderson G.P., Umemoto E.Y., McDonald D.M. Glucocorticoid-induced apoptosis of dendritic cells in the rat tracheal mucosa. Am. J. Respir. Cell Mol. Biol. 1998;19:598–605. doi: 10.1165/ajrcmb.19.4.2870. [DOI] [PubMed] [Google Scholar]
- 36.Sacedon R., Vicente A., Varas A., Jimenez E., Munoz J.J., Zapata A.G. Glucocorticoid-mediated regulation of thymic dendritic cell function. Int. Immunol. 1999;11:1217–1224. doi: 10.1093/intimm/11.8.1217. [DOI] [PubMed] [Google Scholar]
- 37.Piemonti L., Monti P., Allavena P., Sironi M., Soldini L., Leone B.E., Socci C., Di Carlo V. Glucocorticoids affect human dendritic cell differentiation and maturation. J. Immunol. 1999;162:6473–6481. [PubMed] [Google Scholar]
- 38.Eisen-Vandervelde A.L., Yao Z.Q., Hahn Y.S. The molecular basis of HCV-mediated immune dysregulation. Clin. Immunol. 2004;111:16–21. doi: 10.1016/j.clim.2003.12.003. [DOI] [PubMed] [Google Scholar]
- 39.Li L., Wo J., Shao J., Zhu H., Wu N., Li M., Yao H., Hu M., Dennin R.H. SARS-coronavirus replicates in mononuclear cells of peripheral blood (PBMCs) from SARS patients. J. Clin. Virol. 2003;28:239–244. doi: 10.1016/S1386-6532(03)00195-1. [DOI] [PMC free article] [PubMed] [Google Scholar]
- 40.Yang Z.Y., Huang Y., Ganesh L., Leung K., Kong W.P., Schwartz O., Subbarao K., Nabel G.J. pH-dependent entry of severe acute respiratory syndrome coronavirus is mediated by the spike glycoprotein and enhanced by dendritic cell transfer through DC-SIGN. J. Virol. 2004;78:5642–5650. doi: 10.1128/JVI.78.11.5642-5650.2004. [DOI] [PMC free article] [PubMed] [Google Scholar]
- 41.Li W., Moore M.J., Vasilieva N., Sui J., Wong S.K., Berne M.A., Somasundaran M., Sullivan J.L., Luzuriaga K., Greenough T.C., Choe H., Farzan M. Angiotensin-converting enzyme 2 is a functional receptor for the SARS coronavirus. Nature. 2003;426:450–454. doi: 10.1038/nature02145. [DOI] [PMC free article] [PubMed] [Google Scholar]
- 42.Ding Y., He L., Zhang Q., Huang Z., Che X., Hou J., Wang H., Shen H., Qiu L., Li Z., Geng J., Cai J., Han H., Li X., Kang W., Weng D., Liang P., Jiang S. Organ distribution of severe acute respiratory syndrome (SARS) associated coronavirus (SARS-CoV) in SARS patients: implications for pathogenesis and virus transmission pathways. J. Pathol. 2004;203:622–630. doi: 10.1002/path.1560. [DOI] [PMC free article] [PubMed] [Google Scholar]
- 43.Chan V.S., Poon L.L., Zheng B., Chen Y.X., Nicholls J., Khoo U.S., Altmeyer R., Ding Y.Q., Wang X., Xu X., Tam P.K., Peiris J.S., Lin C.L. 8th International Symposium on Dendritic Cells, 17–21 October, 2004 Brugge, Belgium. 2004. SARS coronavirus binding to DC-SIGN of dendritic cells enhances apoptosis of activated T cells and could contribute to T cells depletion in SARS infection; p. 148. [Google Scholar]
- 44.Turville S.G., Cameron P.U., Handley A., Lin G., Pohlmann S., Doms R.W., Cunningham A.L. Diversity of receptors binding HIV on dendritic cell subsets. Nat. Immunol. 2002;3:975–983. doi: 10.1038/ni841. [DOI] [PubMed] [Google Scholar]
- 45.Jones B.M., Ma E.S., Peiris J.S., Wong P.C., Ho J.C., Lam B., Lai K.N., Tsang K.W. Prolonged disturbance of in vitro cytokine production in patients with severe acute respiratory syndrome (SARS) treated with ribavirin and steroids. Clin. Exp. Immunol. 2004;135:467–473. doi: 10.1111/j.1365-2249.2003.02391.x. [DOI] [PMC free article] [PubMed] [Google Scholar]
- 46.Wang M., Wang F.S., Xu D., Zhang Z., Jin L., Chen J.M. Dynamic changes in perifheral blood lymphocyte and plasma cytokine levels in patients with sever acute respiratory syndrome (SARS) Jie Fan Jun Yi Zue Za Zhi. 2003;28:994–997. [Google Scholar]
- 47.Berney C., Herren S., Power C.A., Gordon S., Martinez-Pomares L., Kosco-Vilbois M.H. A member of the dendritic cell family that enters B cell follicles and stimulates primary antibody responses identified by a mannose receptor fusion protein. J. Exp. Med. 1999;190:851–860. doi: 10.1084/jem.190.6.851. [DOI] [PMC free article] [PubMed] [Google Scholar]
- 48.de Garcia V.C., Gulbranson-Judge A., Khan M., O'Leary P., Cascalho M., Wabl M., Klaus G.G., Owen M.J., MacLennan I.C. Dendritic cells associated with plasmablast survival. Eur. J. Immunol. 1999;29:3712–3721. doi: 10.1002/(SICI)1521-4141(199911)29:11<3712::AID-IMMU3712>3.0.CO;2-P. [DOI] [PubMed] [Google Scholar]