

Abstract
Tumour-infiltrating lymphocytes are associated with a survival benefit in several tumour types and with the response to immunotherapy1–8. However, the reason some tumours have high CD8 T cell infiltration while others do not remains unclear. Here we investigate the requirements for maintaining a CD8 T cell response against human cancer. We find that CD8 T cells within tumours consist of distinct populations of terminally differentiated and stem-like cells. On proliferation, stem-like CD8 T cells give rise to more terminally differentiated, effector-molecule-expressing daughter cells. For many T cells to infiltrate the tumour, it is critical that this effector differentiation process occur. In addition, we show that these stem-like T cells reside in dense antigen-presenting-cell niches within the tumour, and that tumours that fail to form these structures are not extensively infiltrated by T cells. Patients with progressive disease lack these immune niches, suggesting that niche breakdown may be a key mechanism of immune escape.
In many cancers, tumour-infiltrating CD8 T cells predict patient survival and response to immunotherapy1–8. These observations raise a fundamental question about the immune response to cancer and why some tumours have high CD8 T cell infiltration while others do not. A logical assumption has been made that T cell exhaustion drives a decline in the T cell response. T cell exhaustion has been extensively described in viral infections, in which persistent antigen exposure reduces the ability of the CD8 T cells to proliferate and kill target cells9,10. Acquisition of checkpoint molecules that inhibit T cell function are a hallmark of this exhausted state, and blockade of molecules such as PD-1 can rescue exhausted cells in these models11,12. Supporting the idea that T cell exhaustion is a factor that limits T cell function in cancer, many reports have found that T cells in tumours express high levels of these checkpoint molecules, and blockade of PD-1 and CTLA-4 are among the most successful treatments for many cancers13–17. However, the model of persistent antigen exposure driving T cell decline does not explain why some patients have a strong T cell response to their tumour for decades, or why patients with controlled disease may have many CD8 T cells that are phenotypically exhausted. Here we investigate the CD8 T cell response to human tumours to better explain the mechanisms that control the magnitude of the T cell response to cancer.
TCF1+ CD8 T cells reside in tumours
On the basis of the observation that CD8 infiltration into tumours predicts survival and response to immunotherapy in other cancers1–7,18,19, we measured this parameter in a cohort of patients with kidney cancer. To quantitate CD8 infiltration, tumour tissue was collected from patients undergoing surgery and analysed by flow cytometry (Extended Data Fig. 1a). CD8 T cell infiltration ranged from 0.002% to over 20% of the total tumour cells (Fig. 1a). For patients with disease at any stage, having less than 2.2% CD8 T cell infiltration predicted four-fold more rapid progression after surgery (hazard ratio (HR) = 3.84, P < 0.01) (Fig. 1b, Extended Data Figs 1b–e, 2a, b). CD8 T cell infiltration did not correlate with clinical parameters such as disease stage or patient age (Extended Data Fig. 2c–k), suggesting that other biological mechanisms control the degree of T cell infiltration into tumours.
Fig. 1. The anti-tumour T cell response is supported by a stem-like CD8 T cell, which gives rise to terminally differentiated CD8 T cells in the tumour.
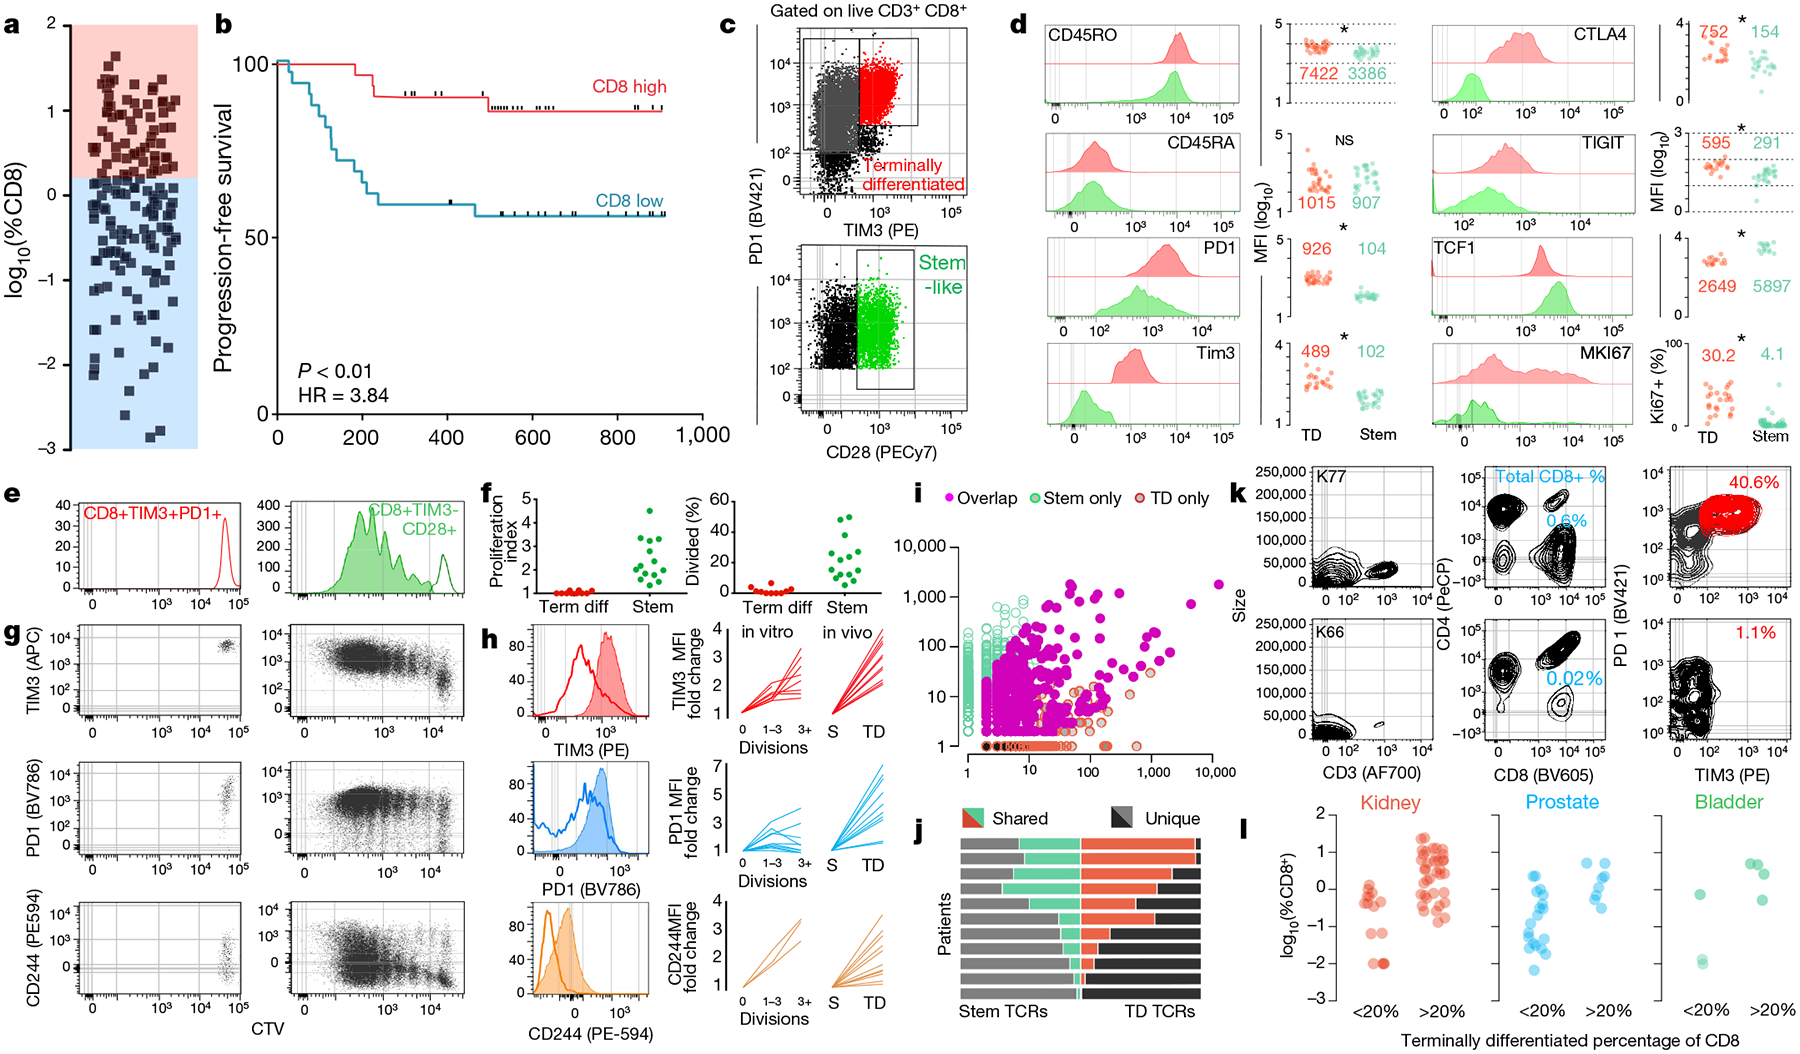
a, Proportion of CD8 T cells in kidney tumours shown as percent of total cells (n = 68). b, Disease progression after surgery in patients with kidney cancer stratified into high or low CD8 T cell infiltration (±2.2%) based on optimal cut methods. Time to progression is the number of days from surgery until death or progression by RECIST criteria (n = 66). c, Gating strategy to identify intra-tumoral CD8 T cell populations. Populations shown are gated on live, CD3+ and CD8+. d, Expression (mean fluorescence intensity (MFI)) of activation markers, checkpoint molecules and transcription factors by TIM3+ and TIM3− CD28+ subsets, gated as in c. e, f, Stem-like (TIM3−CD28+) and terminally differentiated (TIM3+) populations were sorted from kidney tumours, labelled with CellTrace violet, and cultured with anti-CD3/anti-CD28 beads and 10 U ml−1 of IL-2 for 4–5 days. Proliferation index and percentage of cells divided is shown. g, h, Expression of TIM3, PD-1 and CD244 after cells undergo proliferation. Summary plots from in vitro activation experiments compared to fold change in MFI observed between the populations in vivo. i, TCR repertoires of stem-like and terminally differentiated T cells sorted as shown in Extended Data Fig. 4. TCR clones are represented by the number of reads detected in either T cell population. j, TCR repertoire overlap between stem-like and terminally differentiated T cells. The proportion of the detected TCR repertoire in each patient that is unique to each population or shared between the two is shown. k, l, Generation of checkpoint-high cells correlates with total T cell infiltration. Patients were classified as having a low (<20%) or high (>20%) fraction of TIM3+ terminally differentiated cells. Data show sample patients (k), and summary data in kidney (n = 49), prostate (n = 28) and bladder tumours (n = 8) (l).
Reasoning that the composition of the tumour-infiltrating CD8 T cells might offer insight into the mechanisms controlling - cell infiltration, we analysed expression of checkpoint molecules, co-stimulatory molecules and important transcription factors in tumour-infiltrating CD8 T cells. We detected a distinct population of cells that resembled exhausted CD8 cells by their expression of high levels of checkpoint molecules, TIM3, PD-1, CTLA4 and TIGIT (Fig. 1c, d, Extended Data Fig. 3a, b). We also identified a population of cells with low checkpoint molecule expression, but high expression of co-stimulatory molecule CD28 and transcription factor TCF1 (encoded by TCF7) (Fig. 1c, d, Extended Data Fig. 3a, b). TCF1 is a critical transcription factor that defines a stem-like T cell population in chronic murine lymphocytic choriomeningitis virus (LCMV) infection20–22. Of note, others have described a TCF1+ CD8 T cell population in human and mouse tumours that correlates with response to PD-1 blockade22–27. To functionally characterize the TCF1+ and checkpoint-high populations of CD8 T cells in tumours, checkpoint-high cells (PD-1+, TIM3+) and stem-like cells (TCF1+TIM3−CD28+) were sorted from tumours, labelled with CellTrace Violet, and incubated with anti-CD3/CD28 stimulation beads. The TCF1+TIM3−CD28+ stem-like population consistently proliferated in response to bead stimulus, whereas the checkpoint-high population lacked proliferative potential (Fig. 1e, f). Of note, after division, the stem-like T cells upregulated PD-1, TIM3 and CD244 to a similar level seen in vivo and downregulated TCF1, acquiring the phenotype of the checkpoint-high population (Fig. 1g, h, Extended Data Fig. 3c–f). Together, these data suggest that TIM3− CD28+ T cells possess a stem-like capability; they can proliferate and give rise to more terminally differentiated, checkpoint-molecule-expressing T cells.
To further investigate the relationship between the intra-tumoral stem-like and terminally differentiated CD8 T cells, we examined the T cell receptor (TCR) repertoires of each population in 11 tumour samples. We found that TCRs significantly overlapped between the stem-like and terminally differentiated cell populations in all patients examined, suggesting a clonal relationship between these populations (Fig. 1i, j, Extended Data Fig. 4h). In two patients from whom we recovered samples from distant sites within the same tumour, we found a high degree of TCR overlap between the stem-like and terminally differentiated populations at all locations (Extended Data Fig. 4g). These data are in contrast to reports finding that the CD39− population of tumour-infiltrating lymphocytes (TILs) are unrelated to tumour antigens, and instead support a model of T cell differentiation whereby stem-like T cells within the tumour are the precursors to the terminally differentiated CD8 T cell population28.
We next assessed how the composition of CD8 T cells in the tumour related to total T cell infiltration. Highly infiltrated tumours consistently had a distinct population of TIM3+ cells, which resemble phenotypically exhausted CD8 T cells, whereas poorly infiltrated tumours rarely had these cells (Fig. 1k, Extended Data Fig. 3g). The same relationship was evident in prostate and bladder tumours as well, where poorly infiltrated tumours contained few TIM3+ terminally differentiated cells (Fig. 1l). In poorly infiltrated tumours, the stem-like CD8 T cell population is consistently detectable at very low numbers (Extended Data Fig. 3h) but does not appear to be induced to differentiate into the TIM3+ cells (Fig. 1k, l, Extended Data Fig. 3g). These data suggest that the magnitude of the T cell response within a tumour is related to the ability of many terminally differentiated cells to be generated by the stem-like TCF1+ T cell population.
Transcription and epigenetics of CD8 T cell subsets
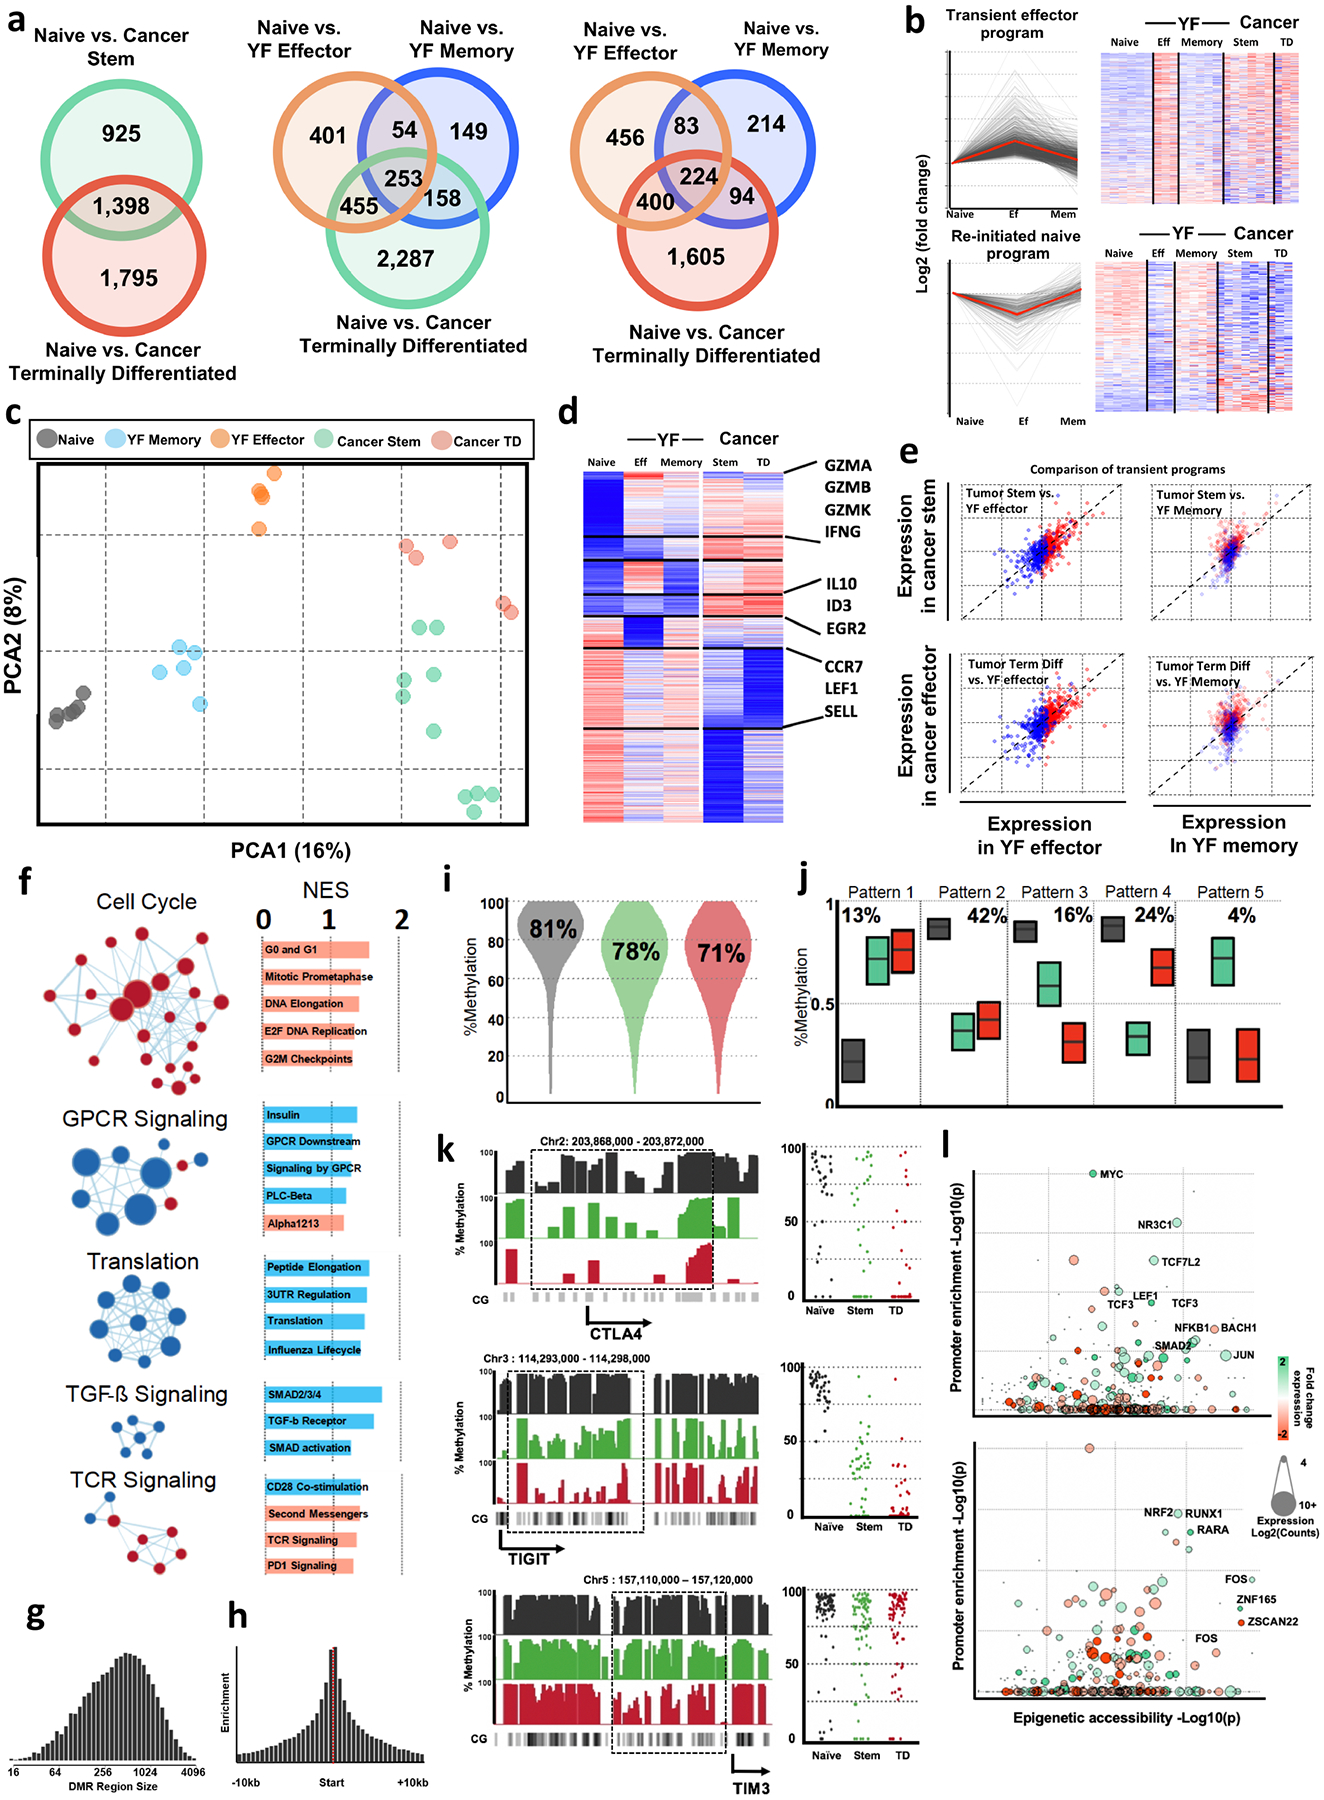
To further investigate the terminally differentiated and stem-like T cell populations in tumours, we performed RNA-sequencing (RNA-seq) on these populations. The terminally differentiated cells expressed more checkpoint molecules and much higher levels of granzymes and perforin (Fig. 2a). In contrast, TCF1+ stem-like CD8 T cells had higher levels of genes involved in survival such as IL7R and IL2RA (CD25), as well as co-stimulatory molecules such as CD28, CD226 and CD2 (Fig. 2a). We also compared these populations to stem-like and terminally differentiated CD8 T cell subsets previously described in murine chronic viral infection (that is, LCMV)20. Gene set enrichment (GSEA) found that the genes expressed by tumour-infiltrating populations were highly enriched with the analogous cell population described in LCMV (Fig. 2b). We compared these subsets to human effector and memory subsets, and both populations were more similar to the effector cells than memory29 (Extended Data Fig. 5a–e). These transcriptional data suggest key functional differences between the TCF1+ stem-like and TIM3+ terminally differentiated T cell subsets within human tumours, and that these functions appear to be similar to what has been described in stem and terminally differentiated CD8 T cells in mice.
Fig. 2. Stem-cell differentiation to the terminally differentiated state is associated with transcriptional and epigenetic changes.
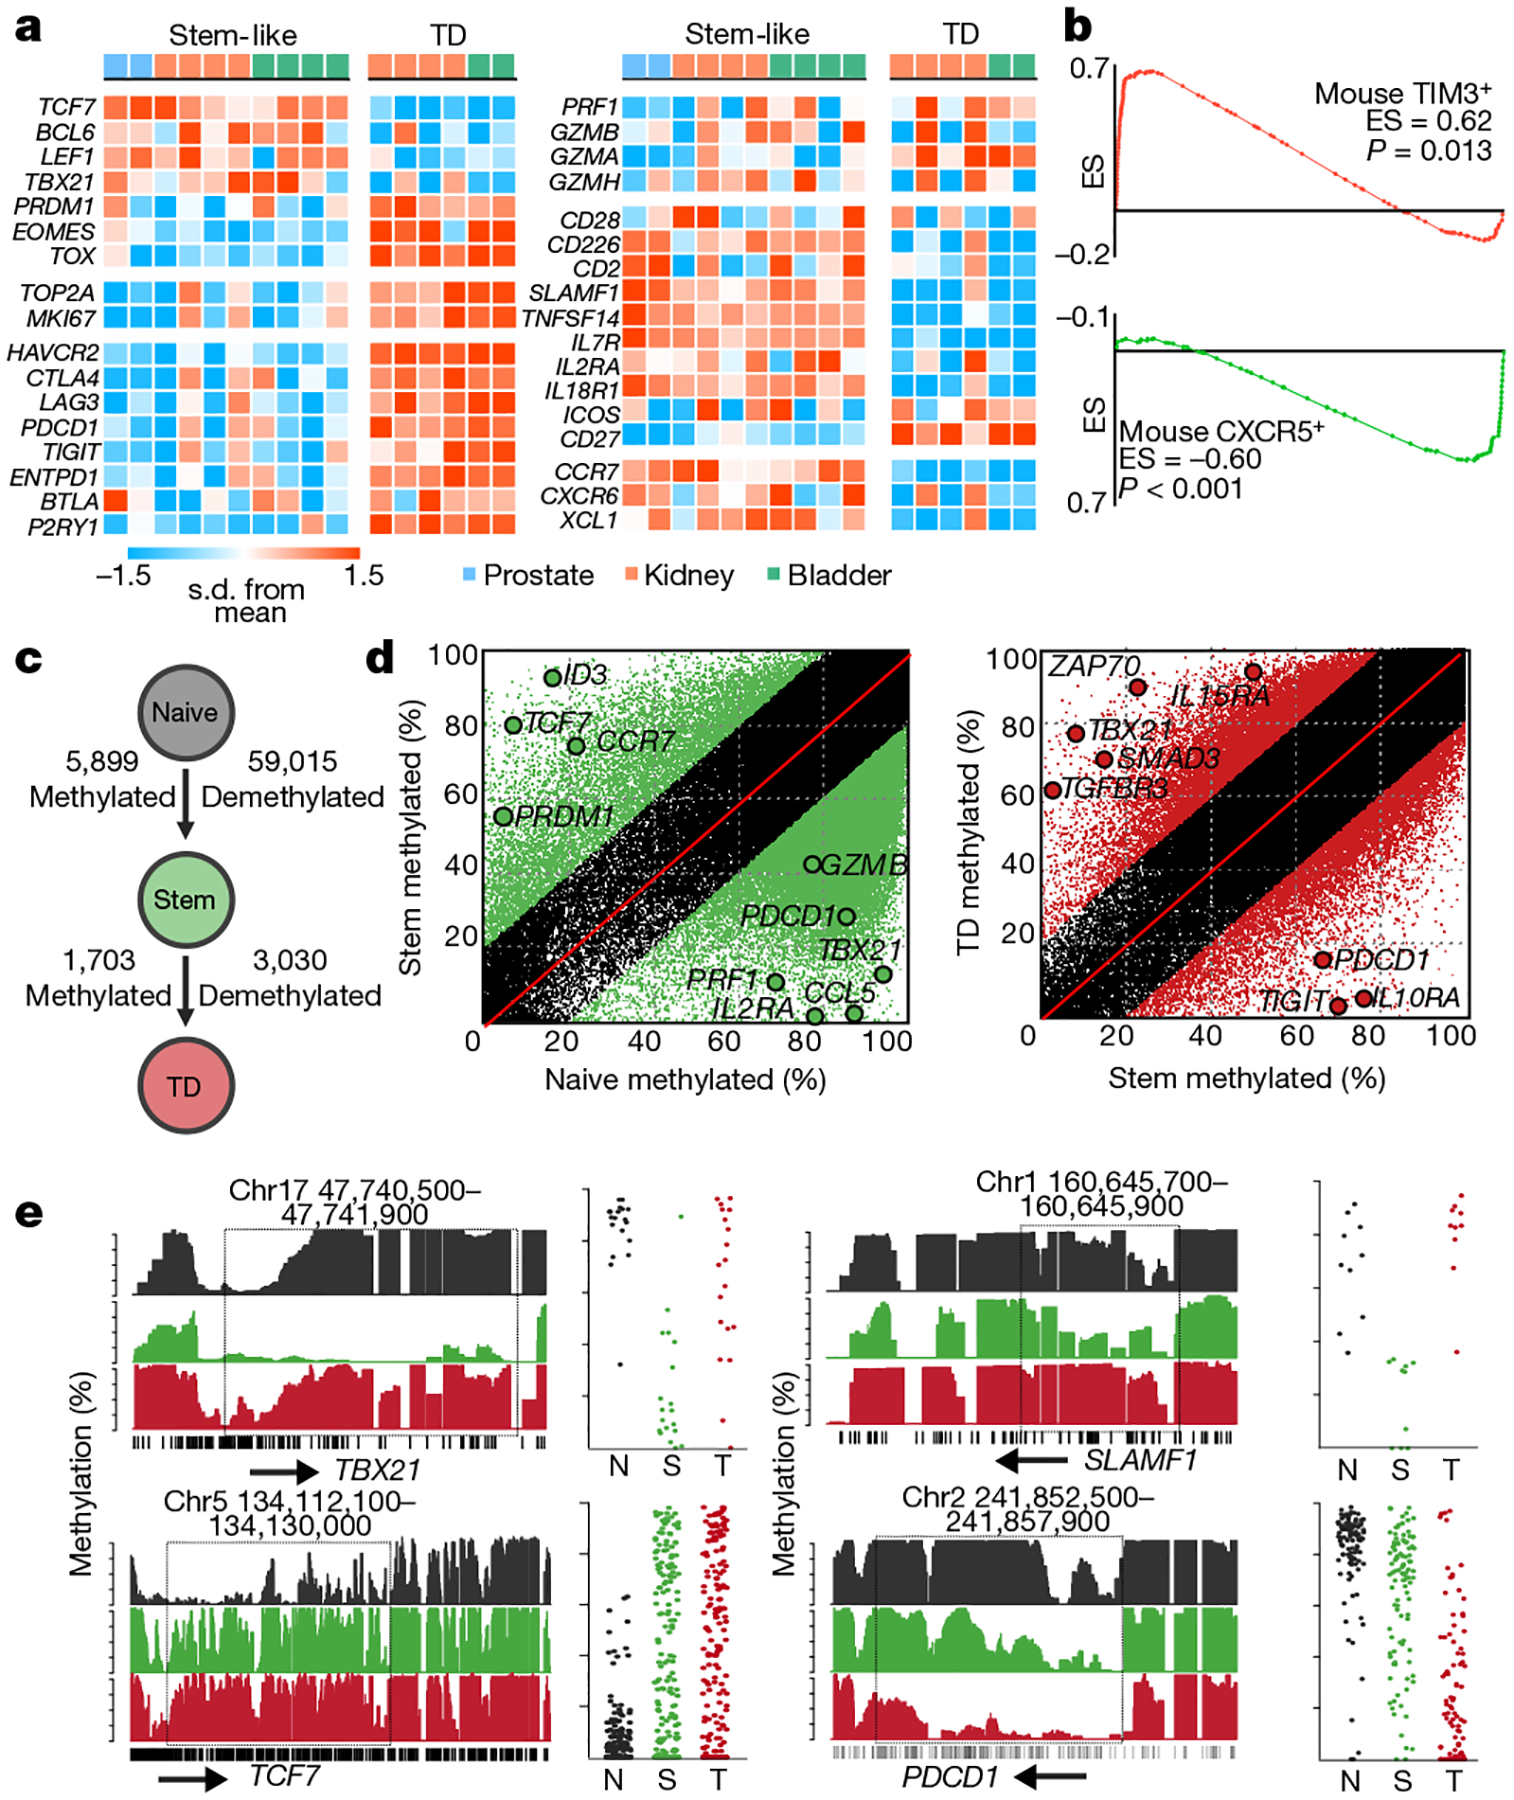
a, Heat map of transcription factors, proliferation-related genes, checkpoint molecules, cytotoxic molecules, co-stimulatory molecules, survival genes and migration and adhesion genes. Figure shows the z-scored data. TD, terminally differentiated. b, GSEA comparison to mouse CXCR5+ and TIM3+ subsets of CD8 T cells. Gene sets were created from CXCR5 stem-like and TIM3+ exhausted CD8 subsets from LCMV infection. Plots show enrichment score (ES) against genes upregulated (red) and downregulated (green) in mice. c, Summary of the number of epigenetic changes occurring as CD8 T cells undergo differentiation. Illustration shows the number of DNA methylation changes occurring as cells differentiate. d, Green regions show methylated and demethylated regions as cells transition from naive to stem-like cells, and red shows these events as cells transition from stem-like to terminally differentiated. e, Specific epigenetic changes near important differentially expressed genes. Histograms show the total methylation from 0–100% in regions near important genes. Highlights show significantly differentially methylated regions. Dot plots show the methylation of each CpG motif within this highlighted domain.
To understand how epigenetic mechanisms affect the different functions of these subsets, we performed whole-genome DNA methylation analysis. As T cells underwent transition from naive cells to the stem-like and terminally differentiated states, demethylation events outweighed methylation events approximately 9 to 1 (Fig. 2c, d, Extended Data Fig. 5g–j). These epigenetic changes occurred near key genes involved in differentiation such as TCF7, TBX21, PDCD1 and many other checkpoint molecules (Fig. 2e, Extended Data Fig. 5k) Together these data highlight that two key functional characteristics of T cells – proliferative potential and cell killing – are compartmentalized into two distinct populations, and these functions are tightly regulated by transcriptional and epigenetic mechanisms to ensure that cells perform as required.
TCF1+ CD8 T cells reside in APC niches
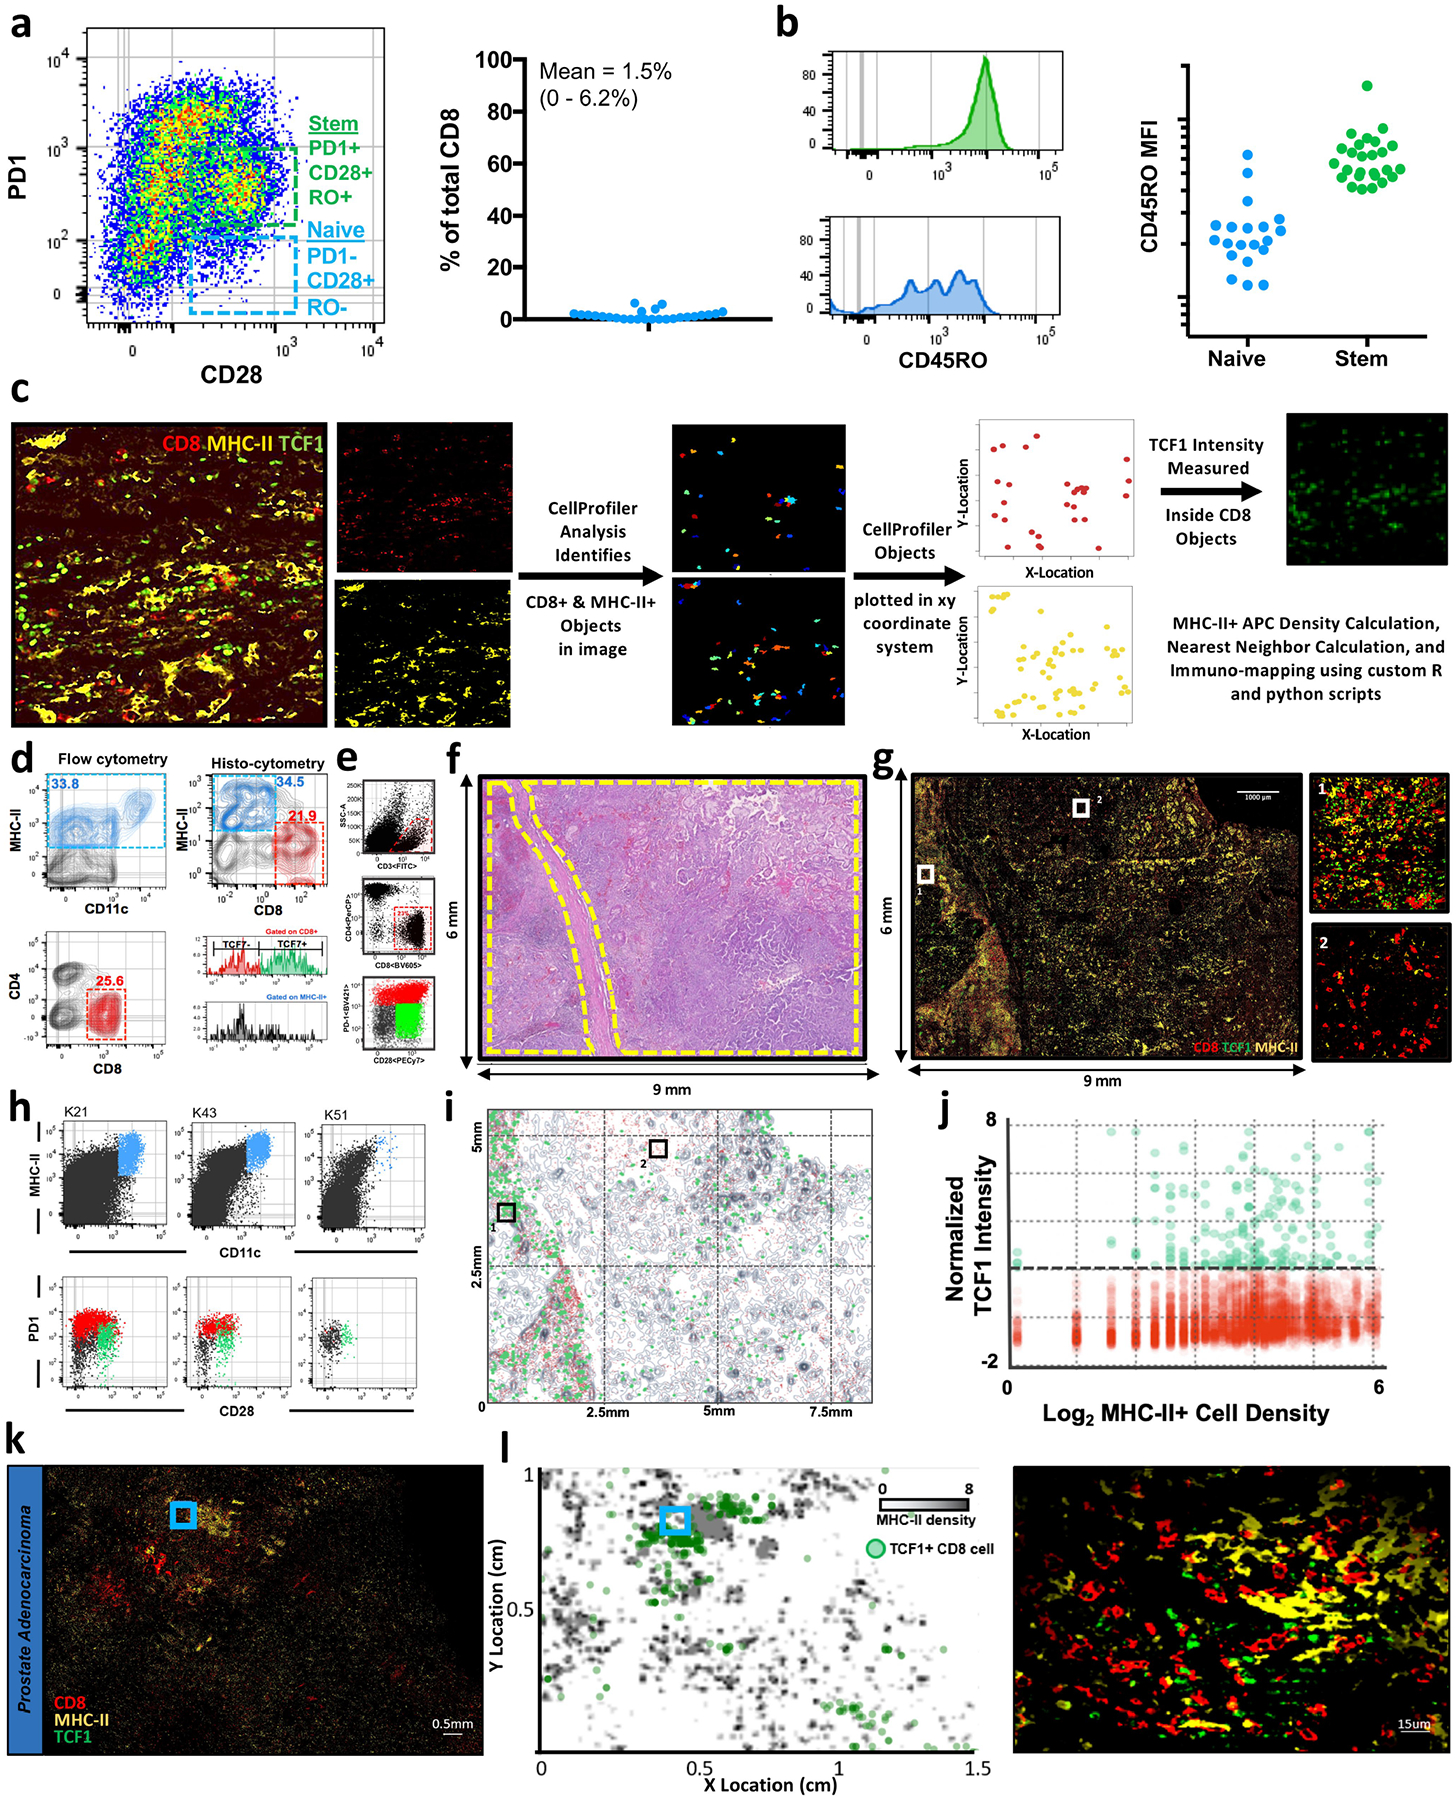
Our finding of a stem-like CD8 T cell population within the tumour, rather than in lymphoid tissue, is unexpected. In mouse models of chronic infection, analogous TCF1+ stem-like T cells are found only in lymphoid tissue20,21. Thus, having identified these stem-like cells in tumour tissue, we reasoned that a lymphoid-like microenvironment within the tumour may support their survival in the tumour. We measured tumour-infiltrating antigen-presenting cell (APC) populations (Fig. 3a). This revealed a highly significant correlation – across kidney, prostate and bladder tumours – between the presence of dendritic cells and the number of stem-like CD8 T cells in the tumour (Fig. 3b, Extended Data Fig. 6h). The percentage of macrophages present did not correlate with the presence of TCF1+ CD8 T cells or the number of CD8 T cells (Fig. 3b). We then used immunofluorescence staining to determine the spatial relationship between APCs and stem-like CD8 T cells (Fig. 3c, d, Extended Data Fig. 6c–d). TCF1+ CD8 T cells were only found in regions with aggregations of major histocompatibility complex II (MHC-II)+ cells greater than 5 cells per 10,000 μm2 (Fig. 3e, f). In contrast, the TCF1− population was distributed across the tissue with no preference for APC dense zones (Fig. 3f). We expanded this analysis to large sections of tumour tissue and found that tumours had many regions with dense APC zones, and the stem-like CD8 cells preferentially resided there (Extended Data Fig. 6e–j). When we looked at prostate and bladder tumours, TCF1+ CD8 cells were also found in dense APC zones (Fig. 3g, Extended Data Fig. 6k, l). Lastly, we found a significant correlation (P < 0.05, R2 = 0.73) between the number of TCF1+ CD8 T cells in a tumour and the proportion of the tumour with sufficient APC density to support stem-like cells (Fig. 3g). This suggests that APC dense regions serve as an intra-tumoral niche for stem-like CD8 T cells, which sustain the terminally differentiated T cell population and thus of the anti-tumour immune response.
Fig. 3. APCs form a supportive, intra-tumoral niche for TCF1+ stem-like CD8 T cells.
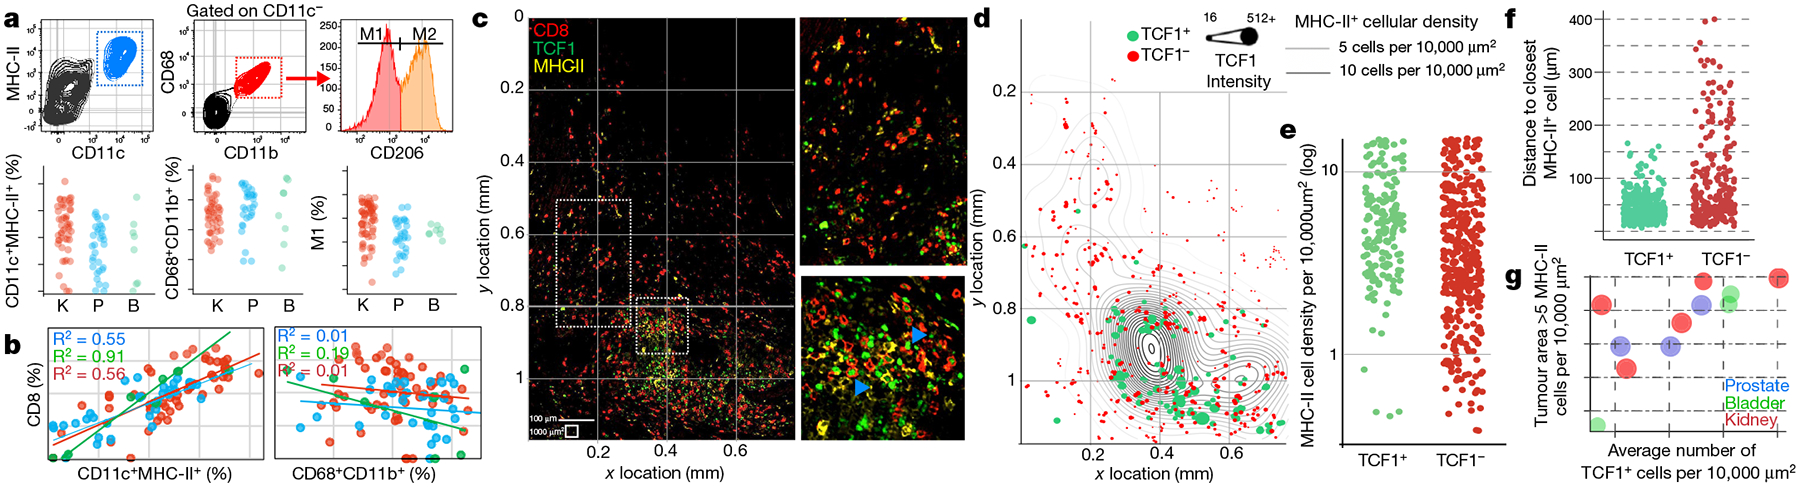
a, Identification of APC subsets in kidney (red, n = 53), bladder (green, n = 7) and prostate tumours (blue, n = 33). b, Correlation between CD8 T cells and APC populations. Percentage of total cells in the tumour that were CD8+ T cells and dendritic cells (CD11c+MHC-II+) or macrophages (CD68+CD11b+) in patients from a. Spearman correlation coefficient is shown. c, Immunofluorescence for MHC-II staining identifies APCs, whereas CD8 and TCF1 identify stem-like and terminally differentiated CD8 T cell populations in a representative patient with kidney cancer. Insets show regions highlighted in the larger image. Blue arrows denote examples of TCF1+ CD8 T cells. d, Cellular spatial relationship map. After acquiring XY coordinates of MHC-II+ cells, MHC-II cellular density was calculated (number of MHC-II+ cells per 10,000 μm2). XY location of CD8 T cells are overlaid with MHC-II density contour. CD8 cells were designated TCF1 positive or negative using histo-cytometry (Extended Data Fig. 6). e, MHC-II cellular density surrounding TCF1+ or TCF1− subsets. MHC-II density at the corresponding XY coordinates of each CD8 T cell is shown. f, Distance between CD8 T cells and the closest MHC-II+ cell. g, Numerous regions of high MHC-II density correlates within increased number of TCF1+ cells in multiple tumour types. y axis shows proportion of the tumour with MHC-II density >5 MHC-II+ cells per 10,000 μm2, with average number of TCF1+ CD8 T cells in the tumour on the x axis.
We next assessed whether these antigen-presenting niches were similar to tertiary lymphoid structures (TLS) previously described in other cancer types30,31. These structures were macroscopically visible with haemotoxylin and eosin staining in 5 out of 33 patients, with densely packed mononuclear cells compartmentalized and usually found outside the tumour border (Extended Data Fig. 7a, b). The presence of TLS did not correlate with CD8 T cell infiltration (Extended Data Fig. 7f–h). Visualized using immunofluorescence, TLS were predominantly very densely packed MHC-II+ cells, interspersed with few CD8 T cells (Extended Data Fig. 7d). On comparison to human tonsil tissue, these TLS much more closely resembled B cell follicles, which is consistent with several other reports30–32 (Extended Data Fig. 7c, d). In comparison, the antigen-presenting niches populated by TCF1+ CD8 T cells were predominantly found inside the stromal barrier of the tumour (Extended Data Fig. 7b). Of interest, these nests containing TCF1+ CD8 T cells closely resembled the extrafollicular regions of lymphoid tissue where T cells reside — moderately densely arranged APCs packed with many TCF1+ CD8 T cells (Extended Data Fig. 7c, e). In addition, we found a significantly higher level of blood and lymphatic endothelial cells (CD31+PDPN–, CD31+PDPN+, respectively) in tumours with CD8 infiltration, and these vessels were often closely associated with dense regions of T cell infiltration (Extended Data Fig. 8). Together these findings highlight key features of the CD8 T cell response to cancer. Regions exist in tumours that resemble a T cell zone of lymphatic tissue. These regions contain the TCF1+ CD8 T cells that seem to only reside in close proximity to APCs, and the generation of these immune niches is correlated to lymphatic and blood vessel infiltration into the tumour.
Loss of APC niche during immune escape
We next examined how the immune niche differs between patients with controlled disease after surgery compared to those whose tumours escaped immune control and rapidly progressed. We imaged large regions of tumour tissue from 26 patients with kidney cancer at the time of surgery to understand how the presence of immune niches in the tumour might correlate with disease progression (see Extended Data Fig. 9a for patient characteristics). Immunofluorescence quantification of CD8 T cells strongly correlated with flow cytometry quantification of CD8 T cell infiltration (Extended Data Fig. 9b, c). Across around 100,000 20× fields of view in these 26 samples, regardless of the level of CD8 T cell infiltration in the patient, we could generally identify a few dense regions of MHC-II where TCF1+ CD8 T cells resided (Fig. 4a–d). Most importantly, patients with controlled disease had significantly more of these dense regions (Fig. 4e, f). On stratifying patients above or below the median MHC-II density, we found that patients with low MHC-II+ cell density experience significantly impaired progression-free survival (Fig. 4g, P = 0.04, HR = 3.157). These factors were independent of PD-L1 expression in the tumour, which had no correlation to the level of CD8 or survival of patients (Extended Data Fig. 10). Importantly, when we specifically studied patients with stage III disease, around 50% of whom progress after surgery, there were >10-fold fewer immune niches in patients who progressed (Extended Data Fig. 9e–g). Patients with progressive disease also had lower proportions of MHC-II+ dense, CD8+ dense, and shared MHC-II+ and CD8+ dense regions in their tumour (Fig. 4h, i, Extended Data Fig. 9h, i), suggesting that for tumours to evade destruction by CD8 T cells, they must either prevent formation of intra-tumoral immune niches or find ways to destroy them.
Fig. 4. Loss of APC niche is associated with impaired CD8 T cell response and disease progression.
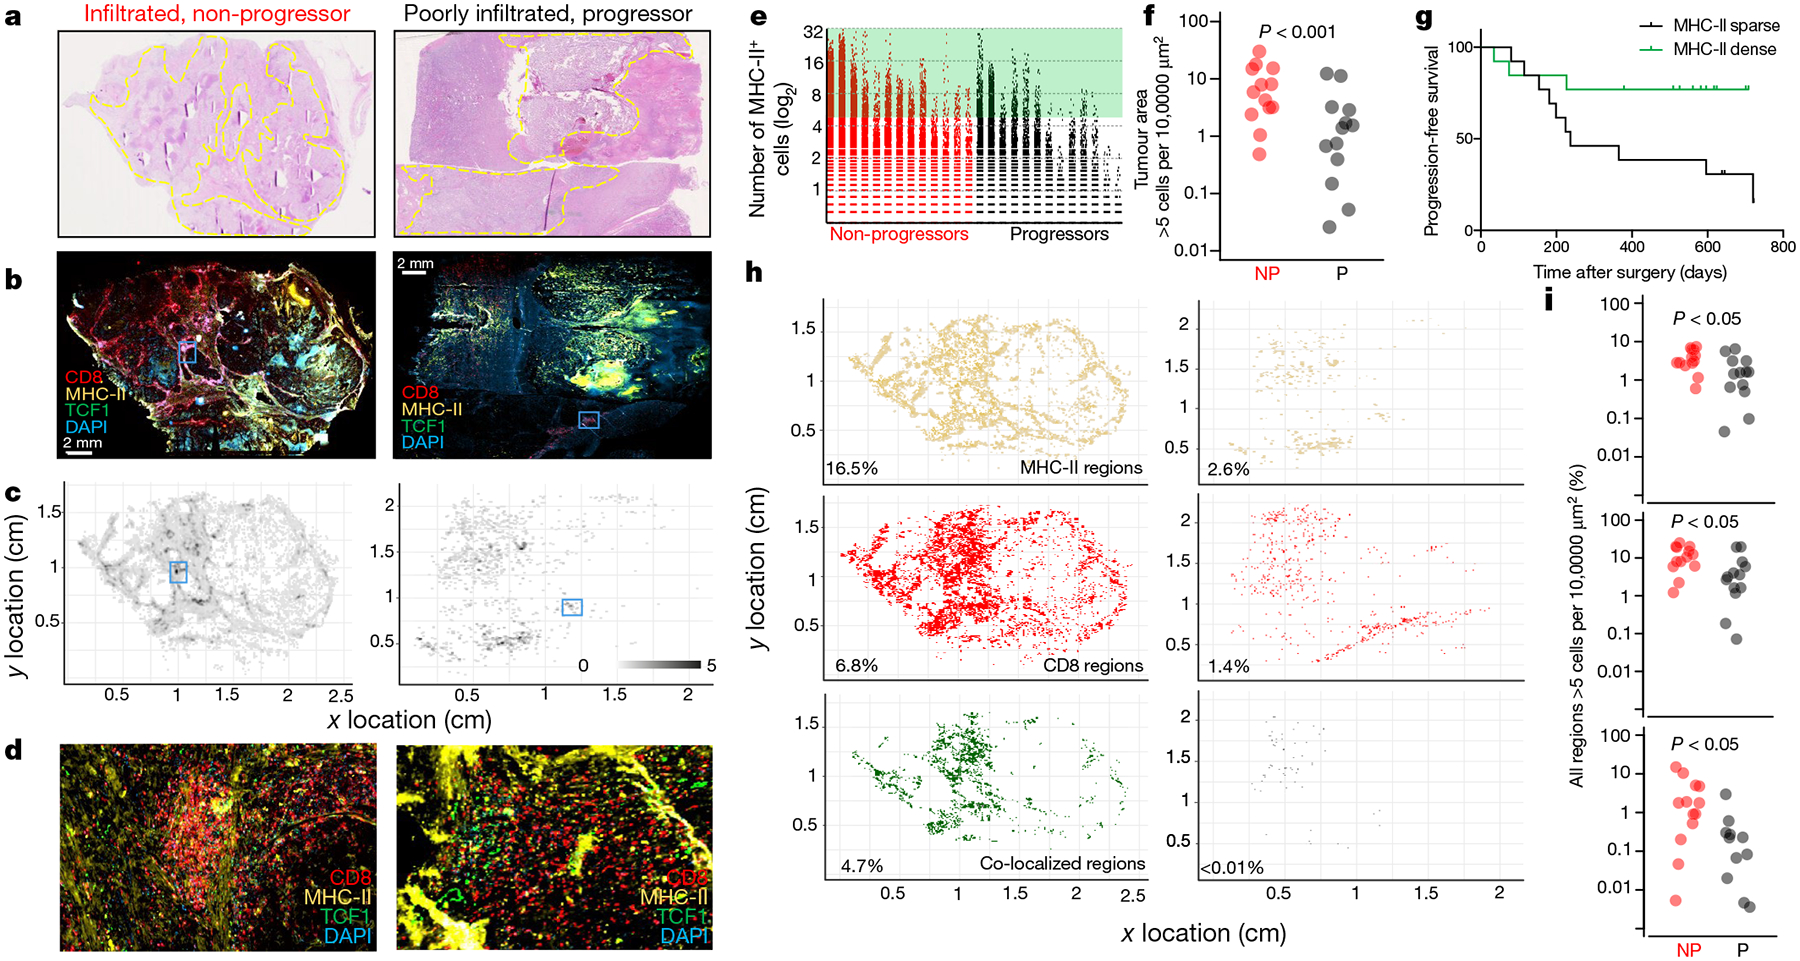
a–d, Patients with dense T cell infiltration and no disease progression (red, left) and one with poor T cell infiltration and progressive disease (grey, right). a, Haematoxylin and eosin whole-slide images. Tumour is outlined in yellow. b, Whole-slide immunofluorescence images. MHC-II (yellow), TCF1 (green), CD8 (red) and DAPI (blue). c, Immunomap of APC density in tumours from b constructed as in Fig. 3 and Extended Data Fig. 7. d, Insets show highlighted regions from b and c, illustrating regions of high MHC-II+ density and stem-like T cell infiltration in kidney tumours. e, Comparison of the number of MHC-II+ cells per 300 μm × 300 μm field in patients with (n = 13) and without (n = 13) progressive disease. f, Comparison of the proportion of tumour area with >5 MHC-II+ cells per 10,000 μm2 between patients with and without progressive disease. Mann–Whitney test result is shown. g, Patients with high MHC-II+ cell density had improved progression free survival. log-rank statistical analysis yields P = 0.04 and HR = 3.226. h, Immunomaps illustrating regions of MHC-II+ cell density (yellow), CD8+ cell density (red) or shared density (green) in tumours from a–d. i, Patients without progressive disease have more areas where the density of MHC-II+ cells (top), CD8+ cells (middle) or MHC-II+ and CD8+ cells (bottom) exceeds 5 cells per 10,000 μm2.
Discussion
In this study, we sought to understand the mechanisms controlling CD8 T cell infiltration into human tumours. We found that tumour-infiltrating T cells are comprised of two functionally distinct subsets, a TCF1+ stem-like CD8 T cell population, and their progeny, a clonally related terminally differentiated population that express high levels of checkpoint molecules. These terminally differentiated cells fit the traditional definition of an exhausted CD8 T cell; they do not proliferate in response to re-stimulation and express high levels of checkpoint molecules. However, the presence of this terminally differentiated cell population positively correlates with the total number of tumour-infiltrating T cells and protection from disease progression. These observations are not well explained by a model of T cell exhaustion whereby continuous antigen exposure leads to accumulation of checkpoint molecules, resulting in a decline of the T cell response. Based on the functional characteristics we defined in these two cell populations and on the clonal relationship between stem-like and terminally differentiated cells, we propose that the stem-like CD8 T cell acts as a precursor to generate a terminally differentiated effector population, which is in agreement with other previous studies22–27. In this model, the stem-like cells require a region within the tumour that resembles the T cell zone of secondary lymphatic tissues, made up of dense areas of antigen-presenting cells. An unanswered question in this model is how stem-like CD8 T cells originate in the tumour. Previous studies have shown that CD8 T cells in tissue-draining lymph nodes are transcriptionally and phenotypically similar to the stem-like CD8 T cell described in chronic LCMV infection, suggesting this may be the source of the stem-like cells in tumours33.
On the basis of this model, we propose that the decline of the T cell response in human cancer is not caused by accumulation of checkpoint-expressing exhausted CD8 T cells or overexpression of PD-L1 in the tumour, but by the failure of stem-like CD8 T cells to be sufficiently stimulated by an antigen-presenting-cell niche to continuously produce terminally differentiated CD8 T cells in the tumour. Furthermore, the scarcity of these niches in tumours that rapidly progress after surgery suggests that tumours may be interfering with the formation or continued maintenance of immune niches and that this may be a novel mechanism of immune evasion requiring further investigation.
Online content
Any methods, additional references, Nature Research reporting summaries, source data, extended data, supplementary information, acknowledgements, peer review information; details of author contributions and competing interests; and statements of data and code availability are available at https://doi.org/10.1038/s41586-019-1836-5.
Methods
Sample collection, preparation and storage
Patients were recruited in accordance with an approved IRB protocol, and all patients provided informed consent. Patient tumour samples were collected immediately after undergoing partial or radical nephrectomy or prostatectomy or undergoing transurethral resection of a bladder tumour (TURBT). Samples for flow cytometric analysis were harvested in Hank’s Balanced Salt Solution, minced into small pieces, digested using Liberase enzyme cocktail, and homogenized using a MACS Dissociator. Single cell suspensions were obtained, RBC ACK lysed, and stored at −80 °C in freezing media for batch analysis. Samples for immunofluorescence analysis were formaldehyde fixed and embedded in paraffin blocks by Emory Pathology. Unstained and haematoxylin/eosin stained sections of FFPE blocks were obtained from Emory Pathology.
Statistical analysis
Patients were selected to have at minimum 365 days of follow up. Follow up time was calculated as the number of days from the date of surgery to an event or to censorship. Progression and death were classified as events. Patients who had not progressed or are not deceased were censored, and the number of days is calculated from the date of surgery to 9 May 2018. Investigators were not blinded during outcome assessment. Statistical analysis was conducted using GraphPad Prism or using SAS Version 9.4 and SAS macros developed by the Biostatistics and Bioinformatics Shared Resource at Winship Cancer Institute. The significance level was set at P < 0.05. Descriptive statistics for each variable were reported. The univariate association with percentage of CD8 T cells was carried out by ANOVA/Kruskal–Wallis test for categorical covariates and by Pearson correlation coefficient for numerical covariates. The univariate association of each covariate with PFS was tested by proportional hazard model with hazard ratio and its 95% confidence interval being reported. We examined a possible nonlinear relationship between a continuous percentage of CD8 T cells and PFS through a martingale residual plot and identified an optimal cut-off value of percentage of CD8 T cells that maximizes the separation between the two groups by a bias adjusted log rank test34,35. The method enables the estimation and evaluation of the significance of the cut-off value and also is adjusted for the bias created by the data driven searching process. The optimal cut-off value was found to be 2.2% (Extended Data Fig. 1b & 1c). Using this same 2.2% cut-off for CD8 infiltration in patients with more aggressive, non-metastatic disease (T3N0M0), less CD8 T cell infiltration predicted a sixfold more rapid progression (Extended Data Fig. 1d). CD8 T cell infiltration also significantly predicted progression amongst patients categorized as high-risk by a conventional prognostic scoring system (SSIGN) (Extended Data Fig. 1e). Statistical methods were not used to pre-determine number of patients included.
Flow cytometry
Single cell suspensions from human tumours were stained with antibodies listed in Supplementary Information Table 1. Live/dead discrimination was performed using fixable Near-IR Dead Cell Stain Kit (Invitrogen). Samples were acquired with a Becton Dickinson LSRII and analysed using FlowJo. For intracellular staining, cells were fixed and permeabilized using the FOXP3 Transcription Factor Staining Buffer Set (eBioscience).
Proliferation assays
CD8 T cells subsets were sorted from tumours and labelled with Cell trace violet (Thermo) according to manufacturer’s instruction. Cells were incubated with anti-CD3/anti-CD28 T cell activation beads (Miltenyi) at a ratio of 1 bead to 2 T cells in U-bottom plates. 10 U ml−1 of human IL-2 (Peprotech) was included in culture media (RPMI + 10% FBS). After 4 days, cells were analysed by flow cytometry for proliferation and expression of various proteins. Proliferation index was assessed using FlowJo.
In vitro assays
Stem-like and terminally differentiated CD8 T cells were sorted from human tumours and incubated with T cell culture media (RPMI + 10%FBS) supplemented with human IL-2 (10 IU ml−1) in U-bottom plates. After 3 days, cells were analysed by flow cytometry for expression of various proteins.
TCR sequencing
Single cell suspensions from human tumours were stained with antibodies listed in Supplementary Information Table 1. Live/dead discrimination was performed using fixable Near-IR Dead Cell Stain Kit (Invitrogen). Populations of interest were isolated using a Becton Dickinson FACS Aria II Cell Sorter. Gating is shown in Extended Data Fig. 4a, c. DNA was isolated using a Qiagen AllPrep DNA/RNA Micro Isolation Kit. TCR sequencing was performed by Adaptive Biotechnologies Immunoseq technologies. TCR Sequencing analysis was performed using custom R scripts. The number of TCRs detected and degree of overlap detected was highly subject to the number of cells collected, highlighting the need to sufficiently sample the pools of cells to accurately understand the clonal relationship between them (Extended Data Fig. 4e, f).
To determine if there was significant overlap between populations, we first calculated the contamination of each population with the other so we could determine if overlap in TCRs could be explained by the contamination rate. To determine the overlap between the stem and terminally differentiated cells due to biological and technical variance, flow cytometry data was fit using an EM mixing model36. The characteristics of these fitted models are shown in Extended Data Fig. 4b. Shown on the plot are 80% and 95% confidence intervals for each population and the approximate position of gates used to sort populations. We then placed gates where we had for the sort and asked the question of what proportion of the cells in that gate were derived from the target and contaminating population. This contamination rate is highly subject to the ratio of the two populations. In our 2 most extreme patients shown in Extended Data Fig 4e, if 93% of the cells are the stem-like population, the contamination rate in the TD population is as high as 14%.
Extended Data Figure 4b shows how the purity changes as the ratio of stem to terminally differentiated cells changes. The two most extreme samples are highlighted on the figure to show what the inferred proportion of each population is in the sorted cells. In addition, we added 5% to this number for each sample to account for additional contamination from the sorting procedure. The summary of this analysis is included in Extended Data Fig. 4h.
To identify significance of TCR overlap we used the purity calculated for each patient we tested if the relative frequency of each TCR could be explained by contamination. For each specific TCR that was detected in both populations, we tested two hypotheses. First, can the number of a particular TCR in the stem-like population be accounted for by contamination from the TD cell population, and conversely, can the same TCR in the TD population be accounted for by contamination from the stem-like population. This was achieved by assuming each TCR detected in a sample was a Bernoulli trial with a probability of occurring equal to the expected frequency of the TCR due to contamination. For example, we assumed that if a TCR was found at a frequency of 10% in the stem population, and the inferred overlap into the TD was 10%, it would contaminate the terminally differentiated cells at a frequency of 1%. If we collected 1000 total TCRs for a particular sample, and detected 10 of this specific TCR, the probability of detecting at least this many TCRs due to this 1% contamination rate would be given by:
The general formula for testing if the overlap in the terminally differentiated population is caused by contamination from the stem-like cells is given by:
Where k = number of the specific TCR detected in the terminally differentiated population; P = frequency of the specific TCR in the stem population x contamination rate; n = total number of TCRs detected in a sample.
We applied this analysis to every TCR collected that had overlap detected and tested the converse hypothesis that the fraction of stem-like TCRs detected could be accounted for by contamination from the terminally differentiated cells. If both tests were under 0.05, we rejected the hypothesis that the overlap was caused by contamination. Figure 1l highlights the proportion of TCRs in each sample that meet these criteria. The supplementary table (Extended Data Fig. 4h) provided has these values used for every TCR and the P value calculated.
To identify significance of TCR overlap, we assumed 90% purity and conducted a Fisher’s exact test to test the hypothesis that the TCR overlap we detected could be explained by this contamination rate. To determine the probability that an overlap could have been detected given the number of cells recovered, we fit an exponential distribution of the observed stem and effector TCR clone frequency (shown in Extended Data Fig. 4b). We then used a bootstrapping approach to randomly sample the same number of TCRs from these two distributions as cells we had collected. We repeated this 1,000 times. If a 20% overlap was not detected at least 80% of the time, the sample was considered underpowered to detect an overlap. Analysis of the TCRs found that the TCR repertoires showed a high degree of immunodominance, where the ten most dominant clones account for 55% of the terminally differentiated repertoire and for 31% of the stem-like repertoire, indicating an expansion against a narrow range of antigens in the tumours (Extended Data Fig. 4d).
RNA sequencing and analysis
RNA was isolated from FACS sorted cells using QIAGEN All-prep kit. RNA was prepared using Contech SmartSeq2 (Bladder samples) or Nugen Ovation (Prostate, Kidney samples) library prep kits. Prostate and Kidney samples were sequenced at HudsonAlpha on a Hiseq25000, Bladder samples were sequenced at the Emory Yerkes Genomics Core on a HiSeq1000. Data was normalized and differential expression of genes identified using DESeq237. Raw fastq files and analysis of RNA-seq is uploaded to GEO under identifier GSE140430.
DNA-methylation analysis
Whole-genome DNA methylation was performed using the Illumina TruSeq DNA Methylation Kit. Sequence data was aligned using Bismark38, and data was analysed using custom R and Python scripts which are available upon request. Briefly, individual significantly differentially methylated CpG motifs were identified by Fisher’s exact test. Continuous regions of differentially methylated CpGs were identified by finding regions where at least 6 out of 10 CpGs in a continuous stretch were differentially methylated. These regions were then collapsed and analysed as single ‘differentially methylated regions’ (DMRs). Differentially expressed regions were identified as those that had a p value less than 1 × 10⁻⁴ by Fisher’s exact test and were at least 20% different to the comparison sample. Transcription factor binding enrichment analysis was also conducted, identifying TCF4, TCF7L2, and MYC as enriched in the stem-like cells and E2F, NRF2, and SP1 in the terminally differentiated cells (Extended Data Fig. 5l). Whole-genome DNA methylation data are uploaded to GEO under identifier GSE140430.
Deparaffinization and antigen retrieval
Sections were deparaffinized in successive incubations with xylene and decreasing concentrations (100, 95, 75, 50, 0%) of ethanol. Antigen retrieval was achieved using either Abcam 100× Citrate Antigen Retrieval Buffer (pH = 6.00) for 20 min at 100 °C, followed by 20 min at ambient temperature or Abcam 100× TrisEDTA Antigen Retrieval Buffer (pH = 9) heated to 115 °C under high pressure. Sections were then washed in either a solution of 10 mM glycine and 0.2% sodium azide in phosphate buffered saline or PBS + 0.1% Tween20 before antibody staining.
Immunofluorescence antibody staining
Sections were blocked for 15–30 min with a 5% goat serum, 1% bovine serum albumin blocking solution containing 10 mM glycine and 0.2% sodium azide or PBS + 0.1% Tween20. Sections were then stained with appropriate primary and secondary antibodies. Primary antibodies were used at a concentration of 1:100 and incubated for 1 h at room temperature. Secondary antibodies were used at a concentration of 1:250 and incubated for 30 min at room temperature. Detailed information about antibodies used is listed in Supplementary Information Table 2.
PD-L1 staining and scoring
FFPE slides for 45 patients were stained using Agilent Biotechnologies PD-L1 IHC (clone 22C3 pharmDx) Staining Kit by Emory Pathology Laboratories. Clinical-grade scoring of PD-L1 status was performed by two board-certified pathologists at Emory University Hospital. Slides with 1–49% of tumour cells expressing PD-L1 were scored ‘positive-low,’ slides with 50+% of tumour cells expressing PD-L1 were scored ‘positive-high,’ and slides with <1% of tumour cells expressing PD-L1 were scored ‘negative.’
Image capture and analysis
We selected a fluorophore panel which allowed for simultaneous visualization of three targets and a nuclear stain (DAPI). For images shown in Fig. 3, we used a Leica SP8 confocal microscope with a motorized stage for tiled imaging, and a 40x, 1.3NA, 0.24 mm WD oil immersion objective was used, allowing for highly resolved, smoothly tiled images. Fluorophores were excited with the 496, 561, and 594 laser lines or with a multiphoton Coherent Chameleon Vision II laser, tuned to 700 nm (DAPI). Emission-optimized wavelength ranges informed specific detector channels, which were used to detect fluorescence. Leica LASX software was used to create a maximum projection image, allowing us to obtain large tiled images regardless of a varying focal plane across each tissue section. For images shown in Fig. 4, we used a Zeiss Z.1 Slide Scanner equipped with a Colibri 7 Flexible Light Source. Zeiss ZenBlue software was used for post-acquisition image processing. For brightfield imaging, slides were scanned using a Hamamatsu’s Nanozoomer slide scanner.
CellProfiler, a free, open-source software for image analysis, was used for subsequent image manipulations. CellProfiler was used to define ‘primary objects’ within images, based upon user-defined parameters (diameter, fluorescence intensity, object clumping, etc.). We used this technique to define DAPI ‘primary objects’ (that is, all cells) and MHC+ ‘primary objects’ (that is, defining antigen presenting cells). We also used this technique to define CD8+ ‘primary objects,’ which we then used to create ‘secondary objects’ by extending the border of each object by 1 pixel in all directions. These CD8+ ‘secondary objects’ were used to define CD8+ T cells. Detailed review of parameters used to MHC-II+ antigen presenting cells and CD8+ T cells can be found in Supplementary Information Table 3. We then used CellProfiler to measure the intensity of TCF1 staining intensity in each CD8+ T cell object. Data exported from the CellProfiler pipeline included XY location of CD8+ objects, MHC-II+ objects, and mean intensity of TCF1 staining in CD8+ T cell objects. The remainder of image analysis was carried out using custom R and python scripts. MHC-II density and distance to nearest MHC-II+ neighbour were calculated in custom python scripts.
In order to determine the area of tissue necessary to be sampled to obtain an accurate and quantitative assessment of the CD8 T cell infiltration into tumours, large slide scanned images were dissected into areas the approximate size of a 20× field of view. Increasing number of random fields of view were sampled from images and the percent of cells that were CD8 positive by immunofluoresence correlated to FACS from the corresponding sample. The estimated number of 20× fields of view necessary to obtain an accurate assessment of level of CD8 T cell infiltration is 171 fields of view (Extended Data Fig. 9d). Histo-cytometric analysis approach employed similar to that reported previously39.
Reporting summary
Further information on research design is available in the Nature Research Reporting Summary linked to this paper.
Data availability
Raw fastq files and associated RNA and whole genome bisulphite sequencing have been uploaded to the NCBI Gene Expression Omnibus (GEO) database under identifier GSE140430. Other relevant data are available from the corresponding author upon reasonable request.
Code availability
Custom code for RNA-seq, whole genome methylation, and quantitative immunofluorescence are available from the corresponding author upon reasonable request.
Extended Data
Extended Data Fig. 1. Description of statistics and sub-group analyses of progression-free survival.
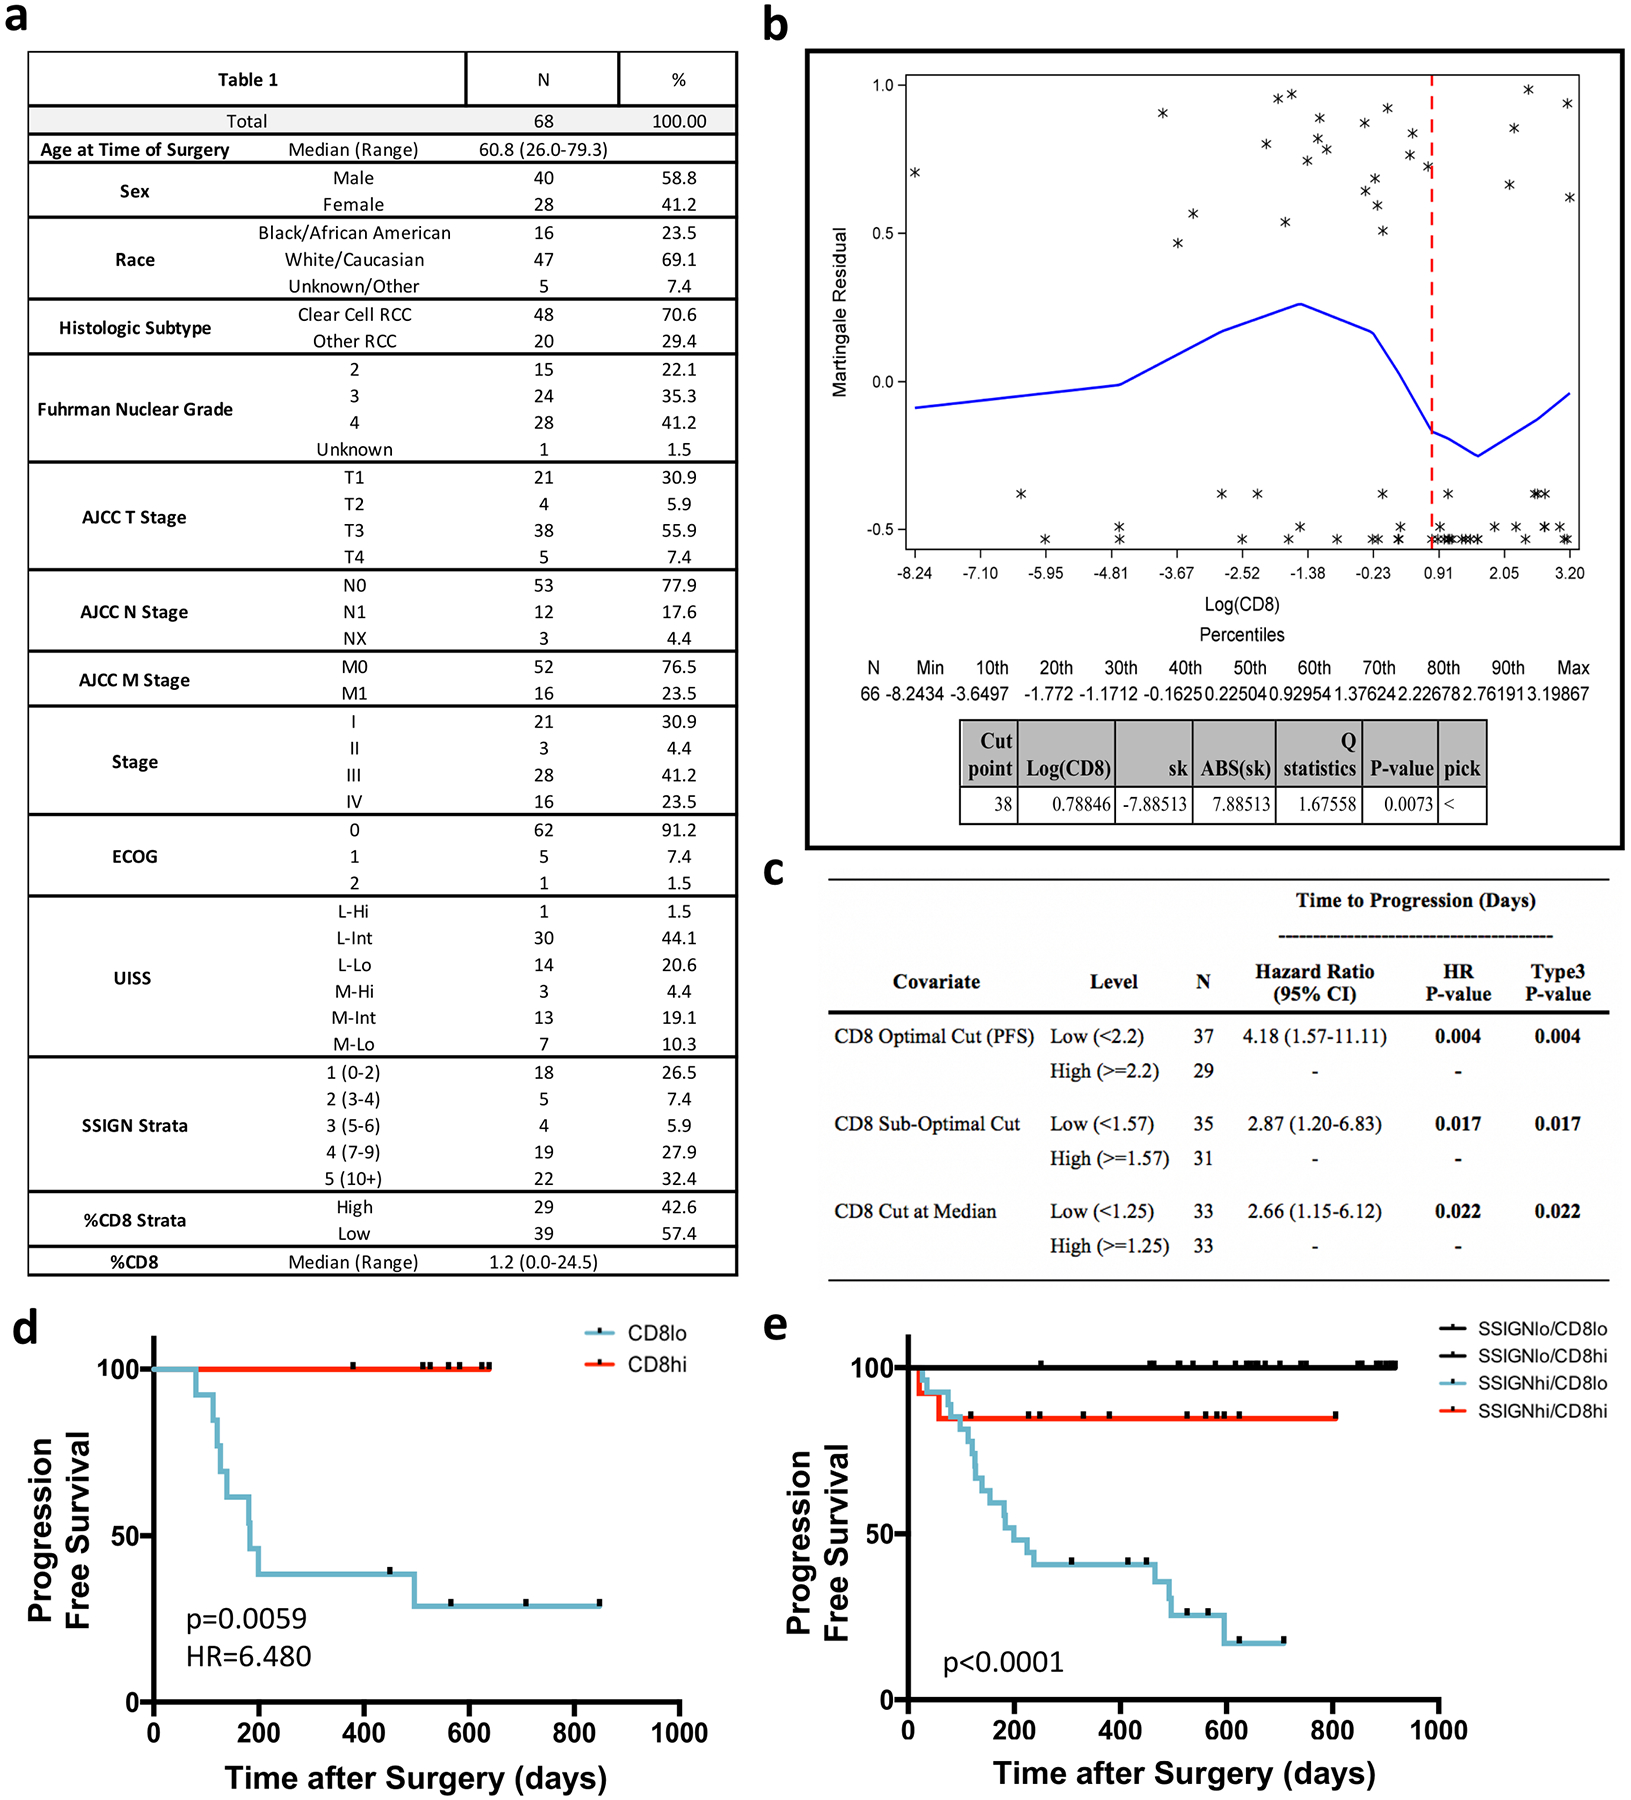
a, Descriptive statistics. Table details the demographic, disease stage, disease characteristic and immune infiltrate breakdown of the cohort of patients with kidney cancer. b, Martingale residual plot illustrating discovery of 2.2% CD8 ‘optimal cut’. c, Comparison of optimal cut, sub-optimal cut and median cut. d, CD8 T cell infiltration predicts time to progression in stage III (T3N0M0) patients. Patients were stratified into high (>2.2% CD8) or low (<2.2% CD8) based on the optimal cut identified in a cohort of all-stage patients. CD8hi, n = 13; CD8lo, n = 7. P = 0.0059, HR = 6.480, as determined using log-rank test. e, CD8 T cell infiltration significantly improves prognostication in patients with kidney cancer with high SSIGN (size, stage, grade, necrosis) scores. P ≤ 0.0001, as determined using log-rank test. Patients were were stratified into low (scores 1–6) and high (scores >6) SSIGN score groups and into low (<2.2% CD8) and high (>2.2% CD8) T cell infiltration. SSIGNloCD8lo: n = 11, SSIGNloCD8hi: n = 16, SSIGNhiCD8lo, n = 28, SSIGNhiCD8hi, n = 13.
Extended Data Fig. 2. CD8 T cell infiltration is associated with improved survival and is independent of standard risk assessment tools, tumour features and patient demographics.
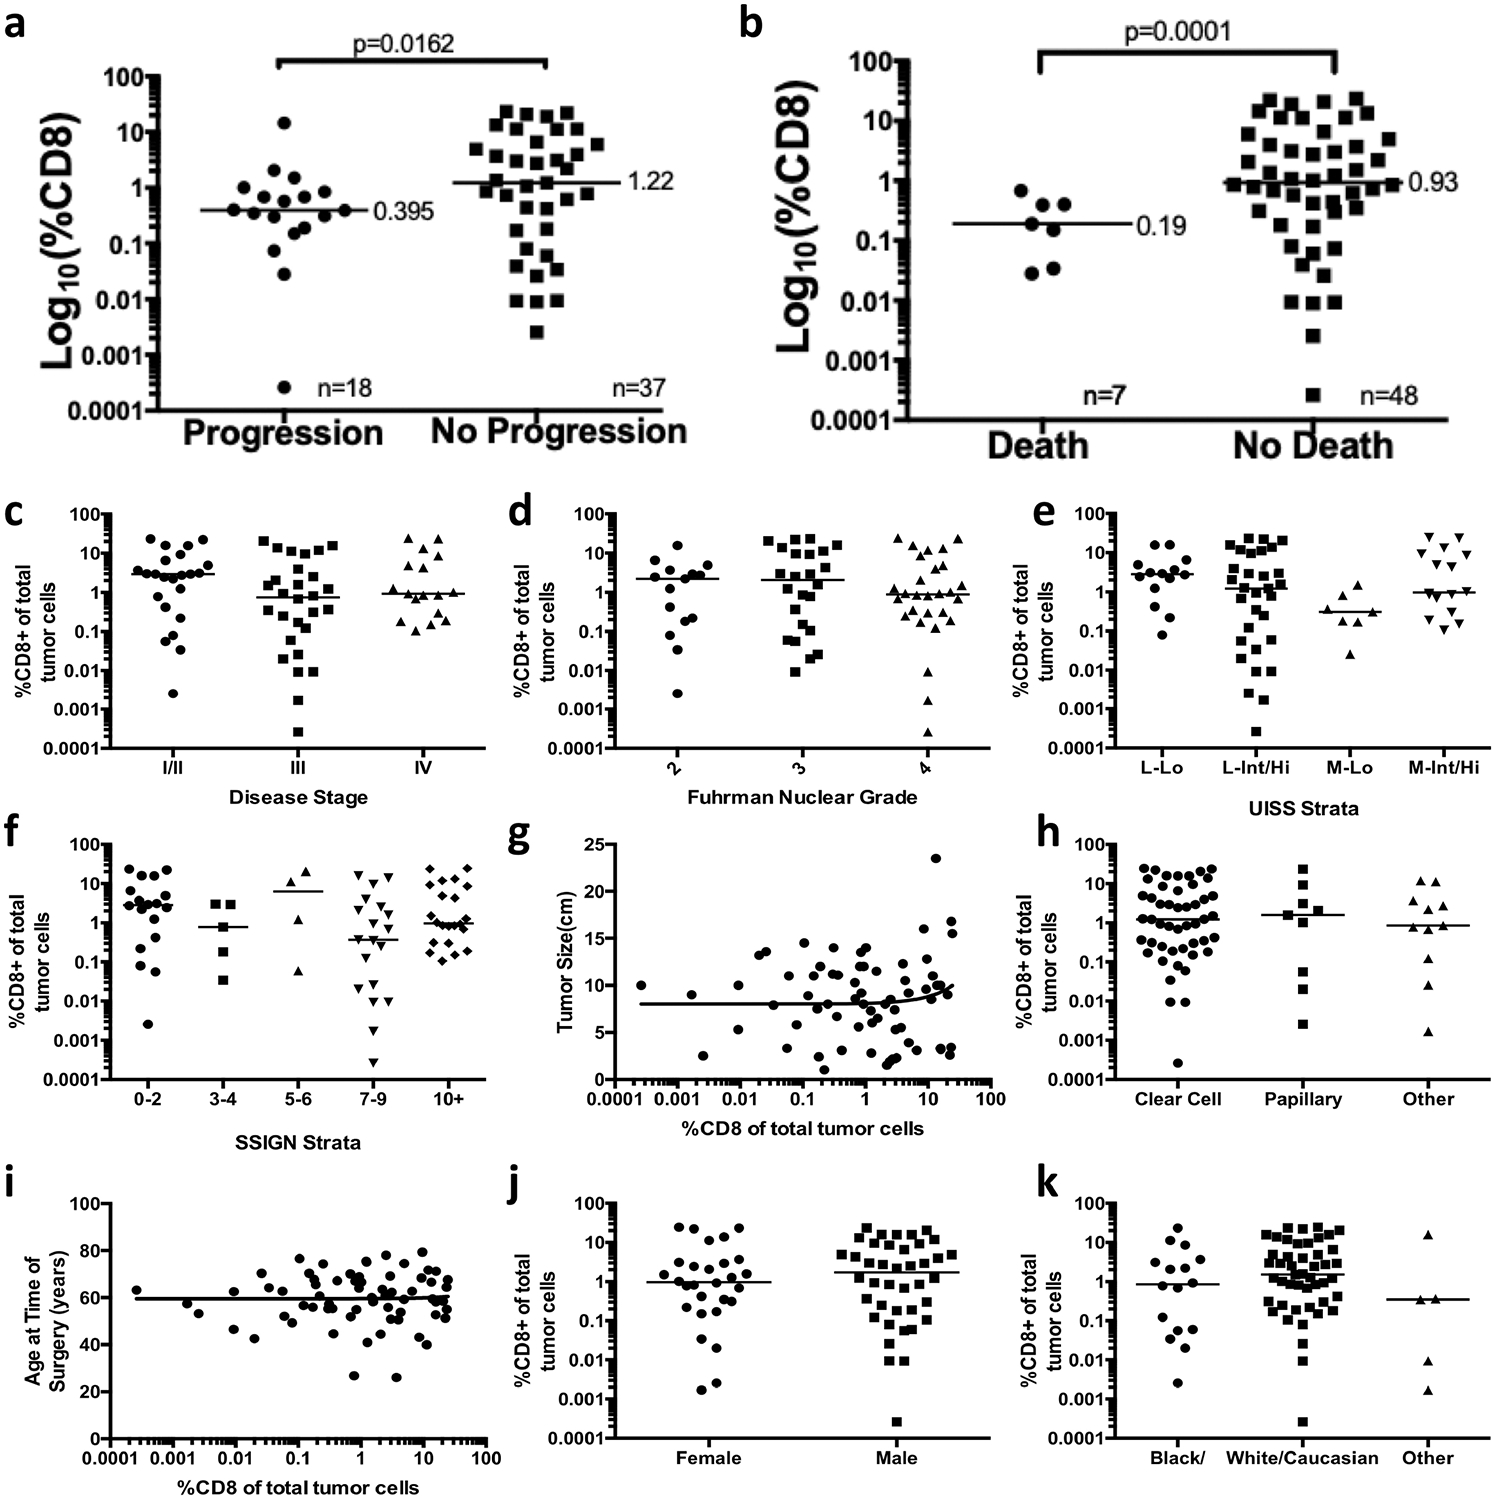
a, b, Proportion of CD8 T cells in the tumours of patients that progress or die after surgery as compared to those without disease progression (a) or death (b). c, Disease stage, P = 0.6. d, Fuhrman nuclear grade, P = 0.4. e, UISS groups, P = 0.3. f, SSIGN groups, P = 0.3. g, Maximum tumour size in one dimension, in centimetres, R = 0.01, P = 0.3. h, Histologic subtype, P = 0.7. i, Patient age at the time of surgery, in years, R = 0.001, P = 0.9. j, Patient sex, P = 0.8. k, Patient race/ethnicity, P = 0.7. Median value is shown for a–f, h and j–k.
Extended Data Fig. 3. Flow cytometric comparison and in vitro functional studies of stem-like and terminally differentiated CD8 T cells.
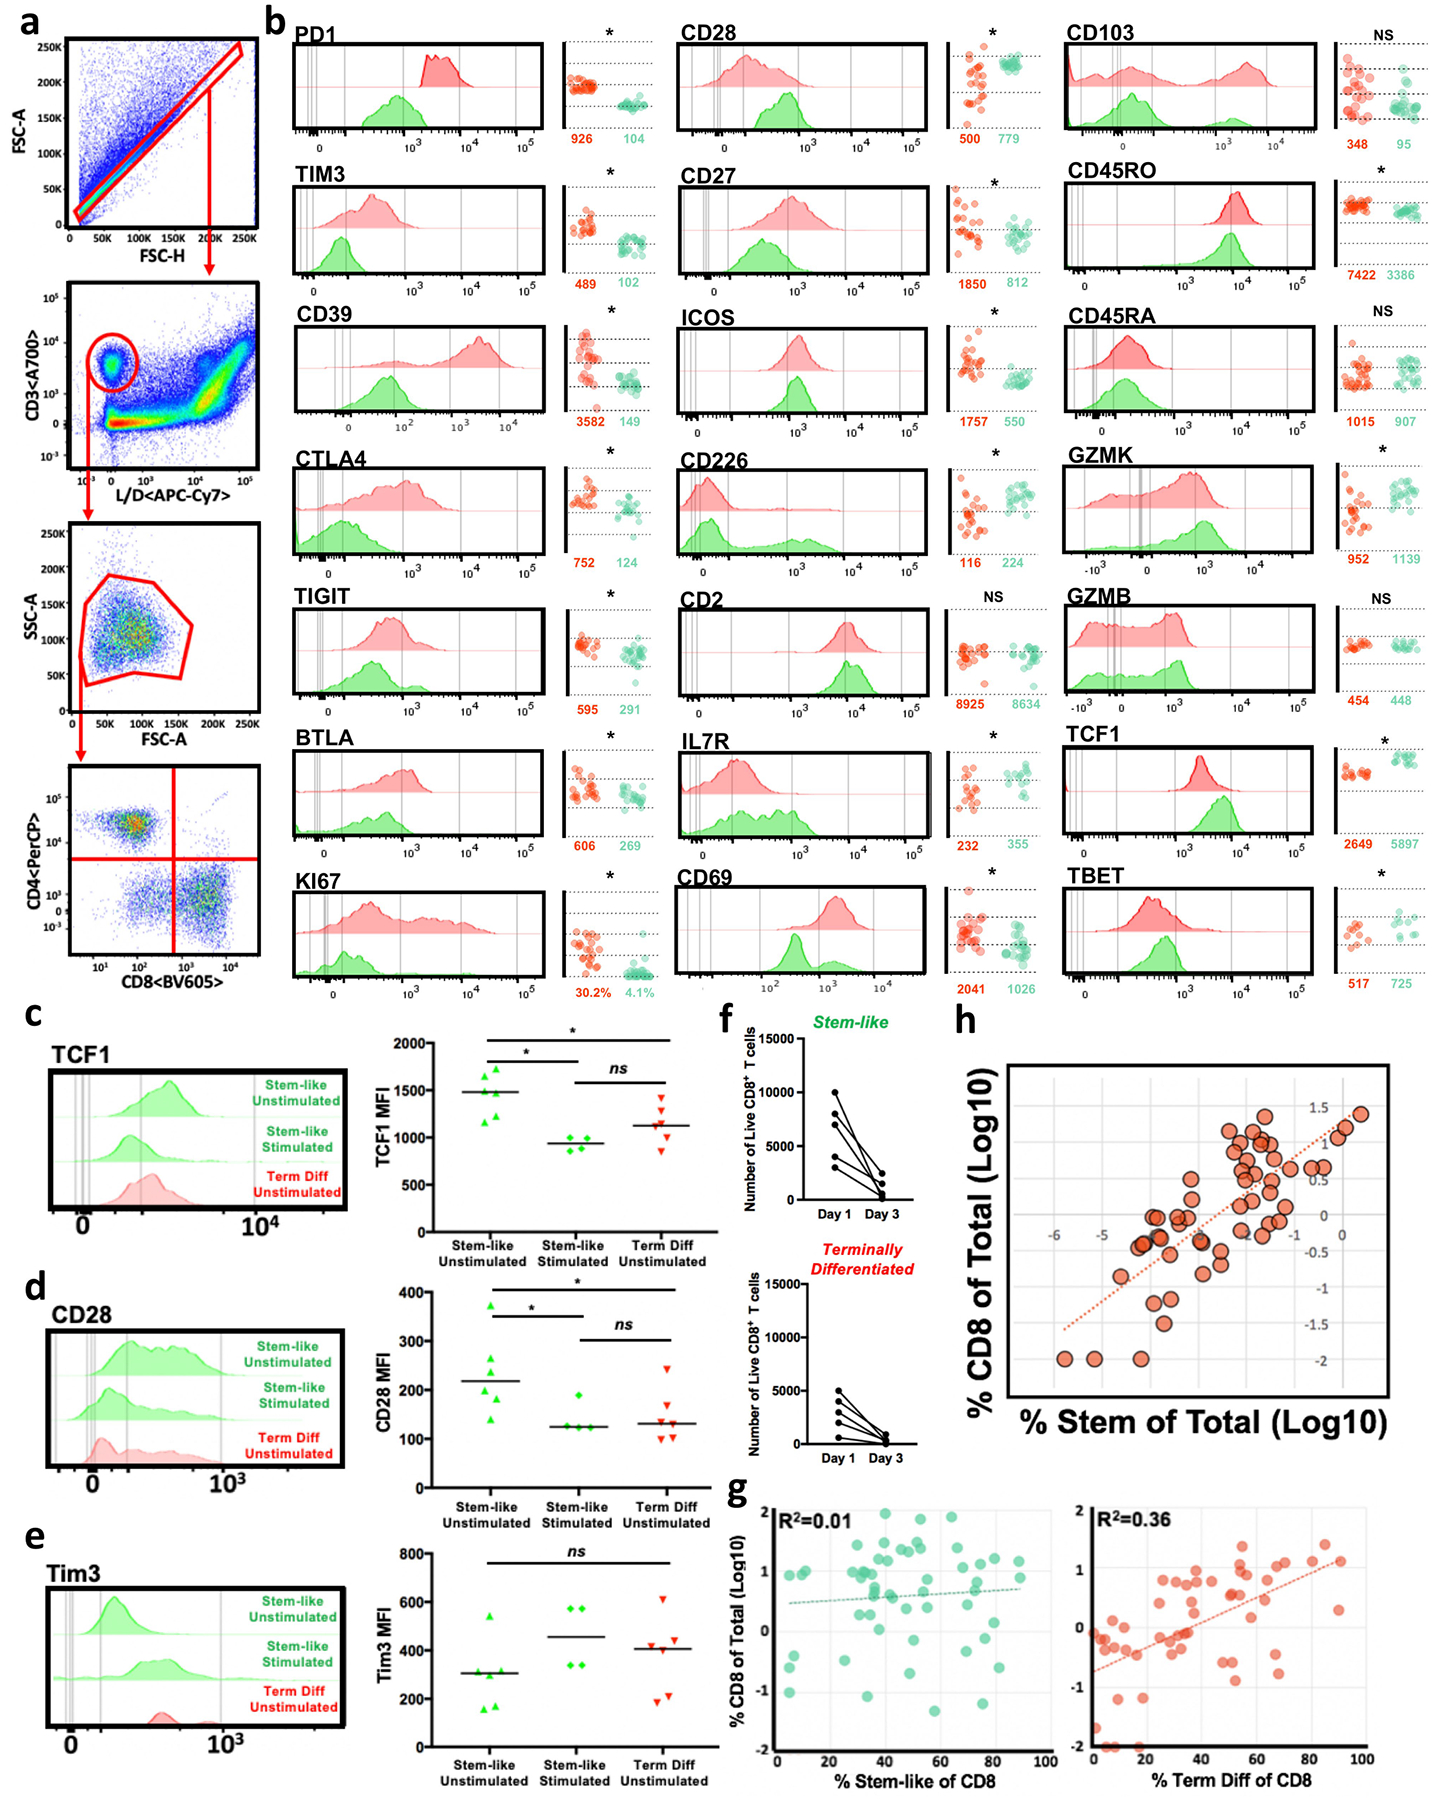
a, Flow cytometry gating scheme. FSC-A and FSC-H are used to select for singlets. Live (APC–Cy7 negative) CD3+ events are then selected from this population of singlets. Lymphocytes are selected from this live CD3+ population on the basis of FSC-A and SSC-A, and CD4+ and CD8+ T cell populations are selected from the lymphocyte population. b, Expression of various molecules by stem-like (green) and terminally differentiated (red) CD8 T cells in human tumours measured by flow cytometry. c–e, Expression of TCF1 (c), CD28 (d) and TIM3 (e) as measured by flow cytometry, by stem-like and terminally differentiated CD8 T cells isolated from patients with kidney cancer (n = 6) and cultured in vitro for 3 days with 10 U of IL-2 and with (stimulated) or without (unstimulated) anti-CD3/CD28/CD2 bead stimulation at a 1:1 ratio. Median value is shown. f, Number of live stem-like and terminally differentiated intra-tumoral CD8+ T cells after 3 days of in vitro culture in IL-2 supplemented media. Live/dead staining was used to determine the proportion and number of live CD8 T cells by flow cytometry. g, Composition of the CD8 T cell compartment. In 60 human kidney cancer patients, proportion of CD8 T cells that are stem-like cells (PD-1+CD28+TIM3−) correlates with total T cell infiltration (%CD8 T cells of total cells), while proportion of terminally differentiated cells (PD-1+TIM3+) does not. h, Percentage of total CD8 T cells correlates with the percentage of total cells that are stem-like CD8 T cells.
Extended Data Fig. 4. TCR sequencing analysis for stem-like and terminally differentiated CD8 T cells.
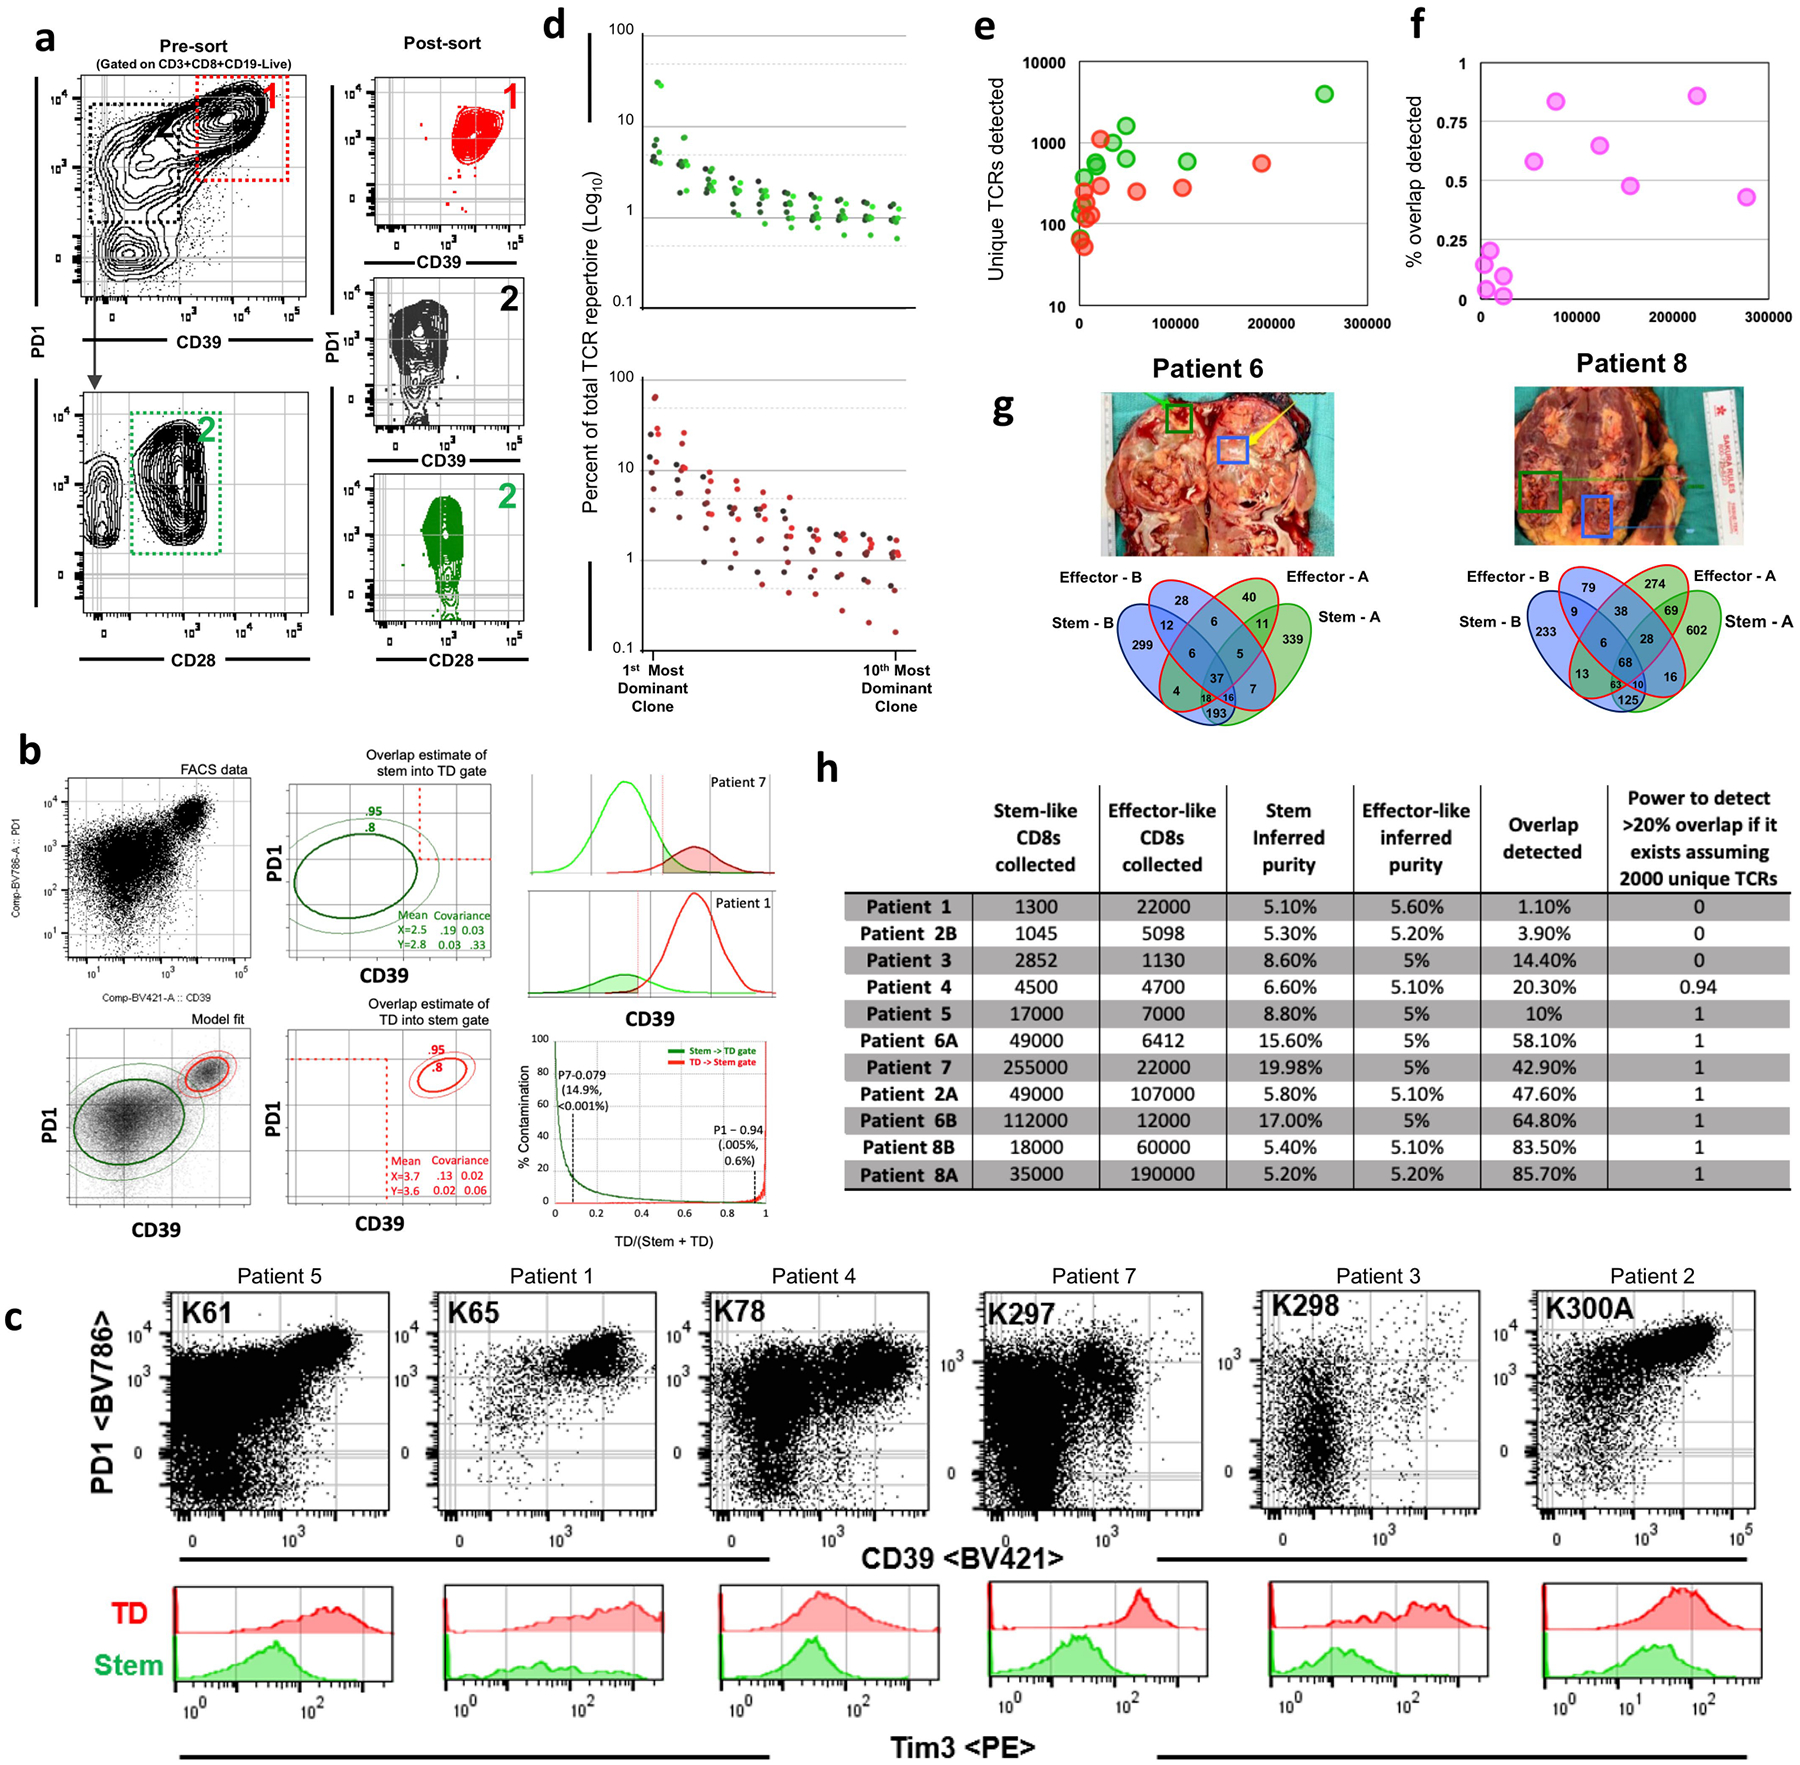
a, Gating scheme for fluorescence activated cell sorting of cell populations for stem-like and terminally differentiated cell populations from human kidney tumours. Terminally differentiated cells1 are PD-1-high and CD39+. Stem-like cells3 are PD-1+CD39−CD28+. b, Estimation of population overlap. PD-1 and CD39 expression by flow cytometry was modelled using a two-population Gaussian mixing model. The amount of each population falling within each sorting gate based on the relative proportions of the populations was determined and used to calculate whether TCRs found in both populations could be accounted for by contamination. c, Pre-sort flow cytometry plots for patients sorted for TCR sequencing. d, Ranking of stem-like (green) and terminally differentiated (red) TCR clones from most to 10th most dominant clone by percent of total TCR repertoire (log10). e, Number of unique TCR clones detected in stem-like (green) and terminally differentiated (red) cell populations as a function of number of cells collected. f, Percentage of overlap detected as a function of number of cells collected. g, Tumour samples were taken from two physically distant sites within the same tumour and stem-like and terminally differentiated cells were sorted from each and TCR sequenced. Venn diagrams illustrate unique TCRs found between stem-like populations in sites A and B, between terminally differentiated populations in sites A and B, and between location mismatched stem-like and terminally differentiated populations (for example, stem-like-A/terminally differentiated-B, stem-like-B/terminally differentiated-A), in addition to overlap between stem-like and terminally differentiated T cell populations within a single site. h, Table indicating the number of stem-like and terminally differentiated T cells collected, inferred purity of each population, percent overlap detected calculated by the number of TCRs detected in either sample divided by the total TCRs in both samples, and the power to detect >20% overlap (assuming 2,000 unique TCRs per sample) for each patient sample.
Extended Data Fig. 5. Transcriptional and epigenetic analysis of T cell subsets in tumours.
a, Comparison of differentially expressed genes between human cancer and viral specific CD8 T cell subsets. RNA-seq from cancer subsets compared to RNA-seq data collected from yellow fever (YF) antigen specific CD8 T cells (GSE100745) during effector (14 days post-vaccination) and memory (4+ years post-vaccination) time points. The number of differentially expressed genes (DEG) versus naive CD8 T cells was determined using DESeq2. Venn diagrams show number of DEG shared or unique between viral and cancer subsets. Although the cancer subsets of T cells share many genes with the YF specific cells, there are also many distinct genes only expressed in cancer T cell subsets. b, DEGs were clustered using cluster affinity search technique (CAST). Clusters with greater than 5% of total genes are shown. Heat map shows z-score of averages from each group. c, Principal component analysis of T cell subsets form cancer and viral-specific CD8 T cells, performed on genes that were differentially expressed in any group versus naive cells. d, Comparison of cancer subsets to transient effector programs found in YF specific T cells. Previously we have identified transient gene expression signatures that are expressed in YF-specific effector cells, but return to a naive state after antigen is cleared. These genes not expressed in memory or naive cells are highly expressed in both cancer subsets suggesting a similarity to an effector cell. e, Pairwise comparison of transient effector program genes between effector and cancer subsets shows the relationship of this subset of genes re-initiated program (blue) and the transient effector program (red) compared between YF and cancer subsets. Dotted 45-degree line represents equal fold change versus a naive CD8 T cell in cancer and yellow fever cells. f, GSEA and network analysis of pathways associated with differentiation. Gene set enrichment performed with GSEA and visualized with Cytoscape. The most significant networks are shown. Red indicates enrichment of nodes in terminally differentiated T cells, while blue shows enrichment in stem-like T cells. g, Histogram shows the distribution of the continuous region size of DMRs. h, Histograms show the relative frequency of DMRs within 10kb of transcription start sites. i, Global changes in methylation. Violin plots show the distribution of total methylation within identified DMRs in naïve, stem-like, and terminally differentiated cells. j, DMR patterns of differentiation. DMRs identified in Fig. 2d were clustered using CAST. Box plots show the interquartile range and mean of DMRs in each cluster by cell type k, Histograms show the total methylation from 0–100% in regions near important genes. Dot plots show the methylation of each CpG motif within highlighted regions of interest. l, Transcriptionally active transcription factors have over-represented binding in epigenetically modified regions of chromatin. Plots show the enrichment of transcription factor binding sites within differentially methylated regions in each cell type on the x-axis, and the y-axis shows the enrichment of transcription factor binding sites within the promoters of differentially expressed genes. Colour of dots represents the relative expression in stem-like (green) or terminally differentiated (red) cells, and the size of the dot is proportional to total expression of the transcription factor.
Extended Data Fig. 6. Quantitative immunofluorescence analysis of tumour immune infiltration.
a, Flow cytometry data illustrating the number of naive cells present intra-tumorally. Left, representative patient. Right, summary data. b, Comparative amounts of CD45RO expression on naive and stem-like intra-tumoral CD8 T cells. c, Workflow for immunofluorescence imaging analysis and immuno-map creation. Single channel immunofluorescence images are imported into CellProfiler. CD8+ and MHC-II+ objects are identified in the respective channel images. The XY location of each CD8+ and MHC-II+ object is exported. The TCF1 staining intensity is measured inside the CD8+ objects. These parameters are used to calculate MHC-II+ density, measure the distance from each CD8+ object to its nearest MHC-II+ neighbour, and to finally create immuno-maps for immunofluorescence images. d, Histo-cytometric analysis of tumour infiltrating immune populations. Location and fluorescence intensity of CD8+ and MHC-II+ cells were determined using CellProfiler. After image compensation, CD8+ and MHC-II+ cells were gated. TCF1 intensity of each cell is shown on histograms for each population below. Comparison of flow cytometry data from the same patient sample is also shown. e, Patients with kidney cancer with high CD8 infiltration determined by flow cytometry. Patients that were determined to have high CD8 infiltration by flow cytometry were selected for analysis by immunofluorescence. f, Haematoxylin and eosin stains of human kidney tumour. Selected slides from human kidney tumour shown in part e, to be highly infiltrated by T cells. Regions of tumour tissue are highlighted in yellow. g, Immunofluorescence imaging of kidney tumour. Selected tumours shown to be highly infiltrated by T cells. Tumour section was stained for MHC-II to identify antigen-presenting cells, and CD8 and TCF1 to identify stem-like and terminally differentiated CD8 T cell populations. Insets shows zoomed regions highlighted in the larger image. h, Dendritic cells populations, stem-like, and terminally differentiated CD8 T cells in three representative kidney cancer patients. i, Cellular spatial relationship map (middle) analysis and construction conducted as in Fig. 3e. j, CD8 expression of TCF1 preferentially occurs in dense APC zones. Amount of TCF1 expressed in each CD8 T cell graphed against the density of MHC-II around each T cell (MHC-II+ cells per 10,000 μm2). k, l, TCF1+ CD8 T cells are localized near dense MHC-II regions in other cancers. Prostate and bladder tumours were imaged for CD8, MHCII and TCF1. Regions of dense MHC-II aggregates are shown in grey and the location of TCF1+ CD8 T cells in green (l).
Extended Data Fig. 7. Comparison of tertiary lymphoid structures and antigen-presenting niches in kidney tumours.
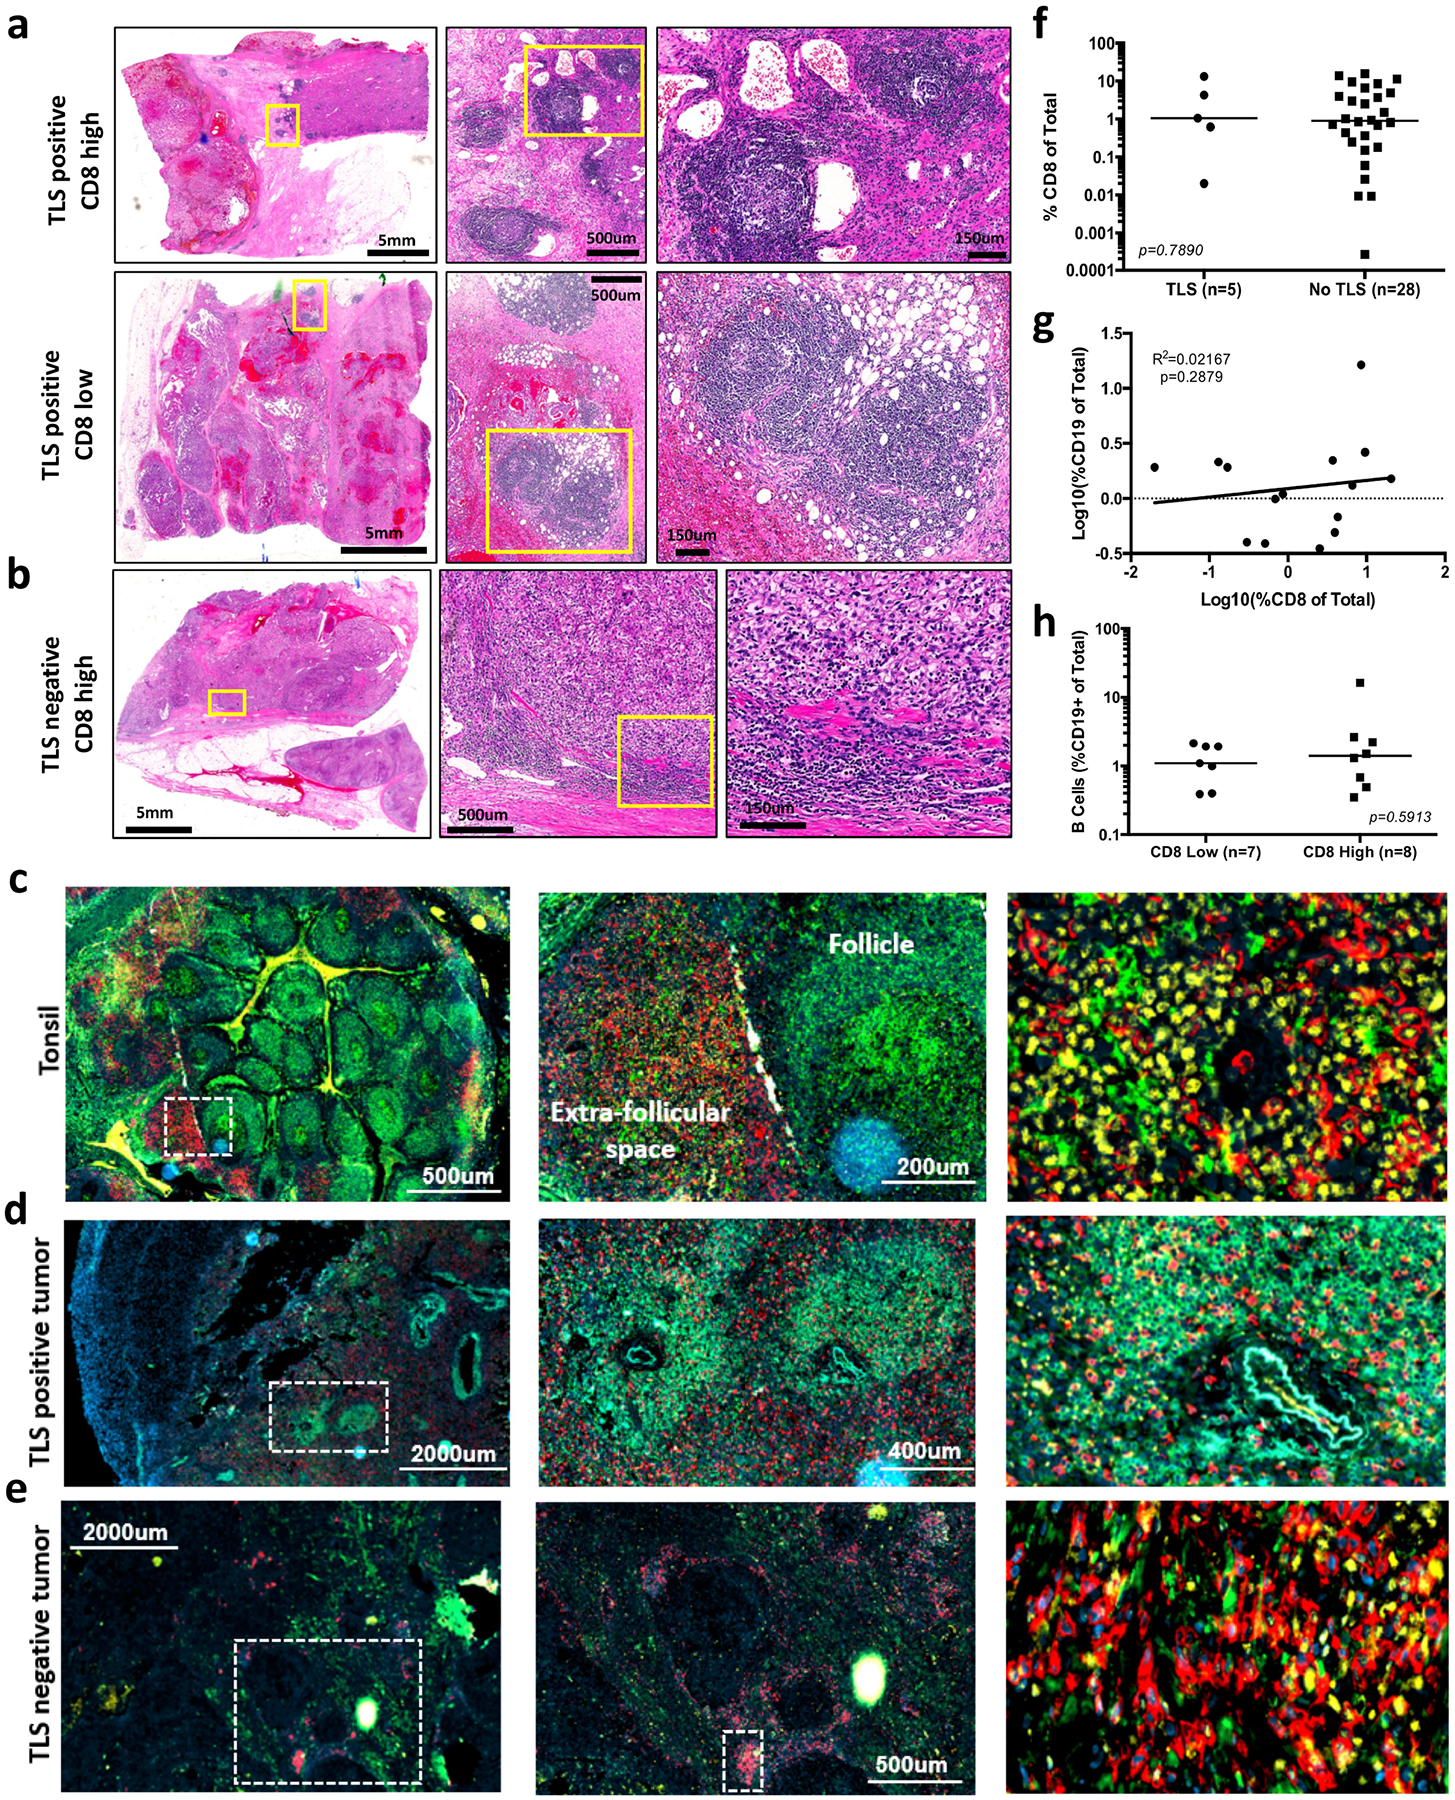
a, Haematoxylin and eosin slides highlighting tertiary lymphoid structures (TLS) in kidney tumours with high (top) and low (bottom) CD8 T cell infiltration. Yellow boxes highlight areas shown in zoomed insets. b, Haematoxylin and eosin slide showing dense immune infiltration in a tumour with high CD8 T cell infiltration but lacking presence of TLS. Yellow boxes highlight areas shown in zoomed insets. c, Immunofluorescence staining illustrating organizational structure of human tonsil. CD8 staining is shown in red, MHC-II in green, TCF1 in yellow and DAPI (nuclei) in blue. White box highlights zoomed area shown in inset. Follicle and extrafollicular space shown as labelled. T cell zone shown in rightmost panel. d, Immunofluorescence staining illustrating tumour TLS. CD8 staining is shown in red, MHC-II staining in green and DAPI staining of nuclei in blue. White box highlights zoomed area shown in inset. Follicle and extrafollicular space shown as labelled. e, Immunofluorescence staining illustrating dense immune infiltration in TLS negative kidney tumour. CD8 staining is shown in red, MHC-II in green, TCF1 in yellow and DAPI in blue. White box highlights zoomed area shown in inset. Follicle and extrafollicular space shown as labelled. f, There is no significant difference in CD8 T cell infiltration between kidney tumours with and without TLS. CD8 T cell infiltration measured by flow cytometry and shown as percentage of CD8+ of total cells. Statistical analysis resultant from Mann–Whitney test is shown. g, Lack of correlation between proportion of CD8 T cells and CD19+ B cells in tumours. Linear regression results P = 0.6006 with R2 = 0.02167. h, B cell infiltration between tumours with high or low CD8 T cell infiltration was not significantly different. B cell infiltration is shown as the percentage of CD19+ B cells of total cells. Statistical analysis resultant from Mann–Whitney test is shown. Median value shown in f and h.
Extended Data Fig. 8. Highly infiltrated kidney tumours are well vascularized and contain lymphatic vessels.
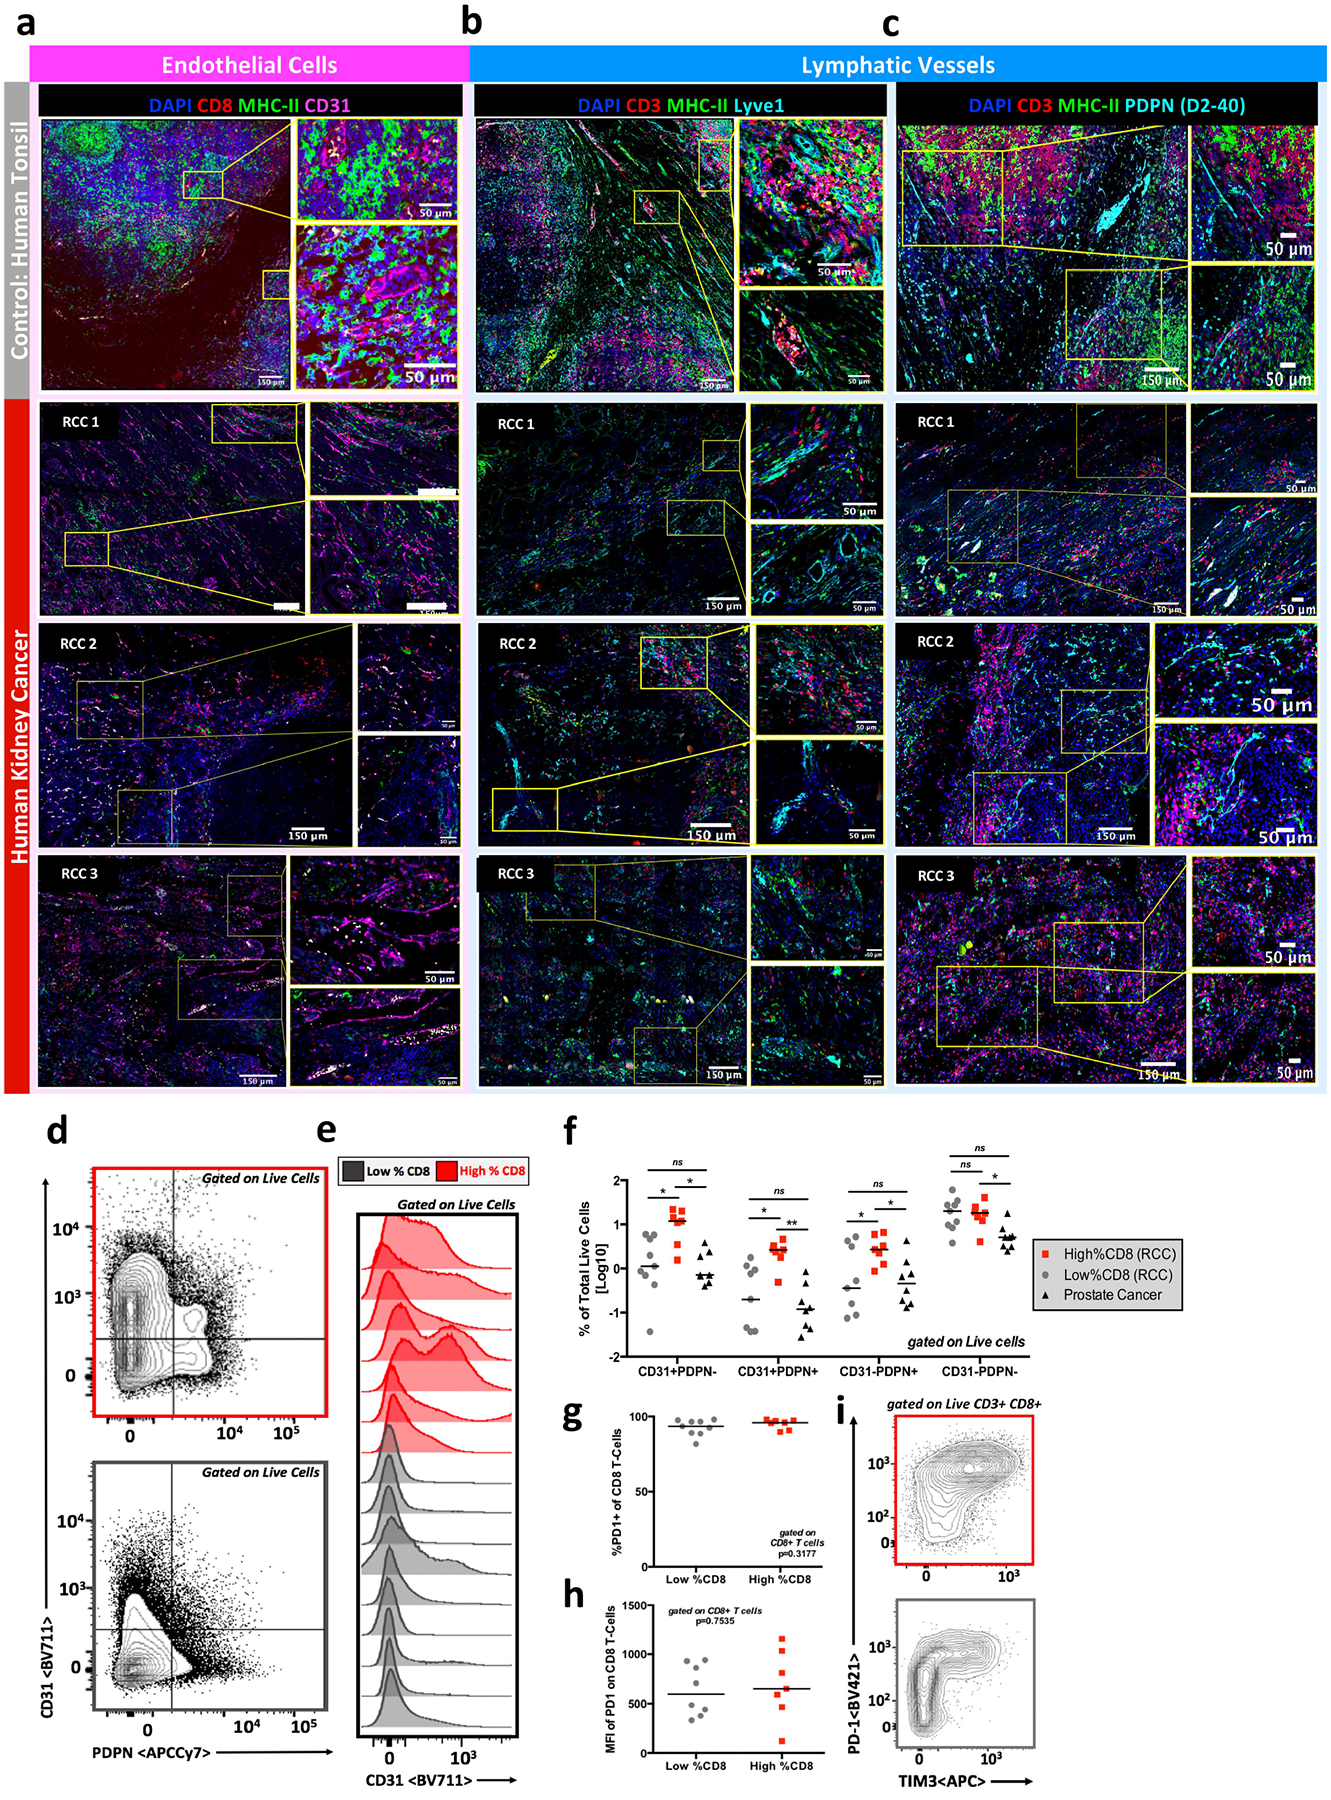
a, Immunofluorescence staining of human tonsil and highly T cell infiltrated human kidney tumours showing tissue vascularization. Formalin-fixed paraffin embedded tissue was stained for CD8 (T cells), MHC-II (antigen-presenting cells), CD31 (endothelial cells) and DAPI (nuclei). b, c, Immunofluorescence staining of human tonsil and highly T cell infiltrated kidney tumours showing presence of lymphatics via Lyve1 (b) and Podoplanin/D2–40 (c). Formalin-fixed paraffin embedded tissue was stained for CD3 (T cells), MHC-II (antigen presenting cells), Lyve 1 or Podoplanin/D2–40 (lymphatics) and DAPI (nuclei). d, Flow cytometry analysis shows tumour vascularization in highly (red) and poorly (grey) infiltrated kidney tumour. Tumours were stained using antibodies listed in Supplementary Table 2, collected on a Becton Dickinson LSR-II, and analysed using FlowJo. e, Histogram of flow cytometry analysis showing increased CD31 staining in highly T cell-infiltrated kidney tumours (red) as compared to poorly infiltrated tumours (grey). Analysis completed as described in d. f, Summary data of flow cytometry analysis showing differences in vascularization between highly (red) and poorly (grey) T cell infiltrated kidney tumours and prostate tumours (black). Analysis completed as described in d. g, h, Tumour-infiltrating T cells are PD-1+. Flow cytometry analysis showing T cells infiltrating kidney tumours are PD-1+, suggesting the cells are not naive and present due to blood contamination and showing that the MFI of PD-1 on tumour-infiltrating T cells is not significantly different between highly (red) and poorly (grey) infiltrated tumours. i, Representative flow cytometry plots showing PD-1 and TIM3 expression on tumour infiltrated T cells in highly (red) and poorly (grey) infiltrated tumours. Populations shown are gated on live, CD3+CD8+ cells. Median value shown in f–h.
Extended Data Fig. 9. Descriptive statistics and quantitative immunofluorescence analyses of human kidney tumours.
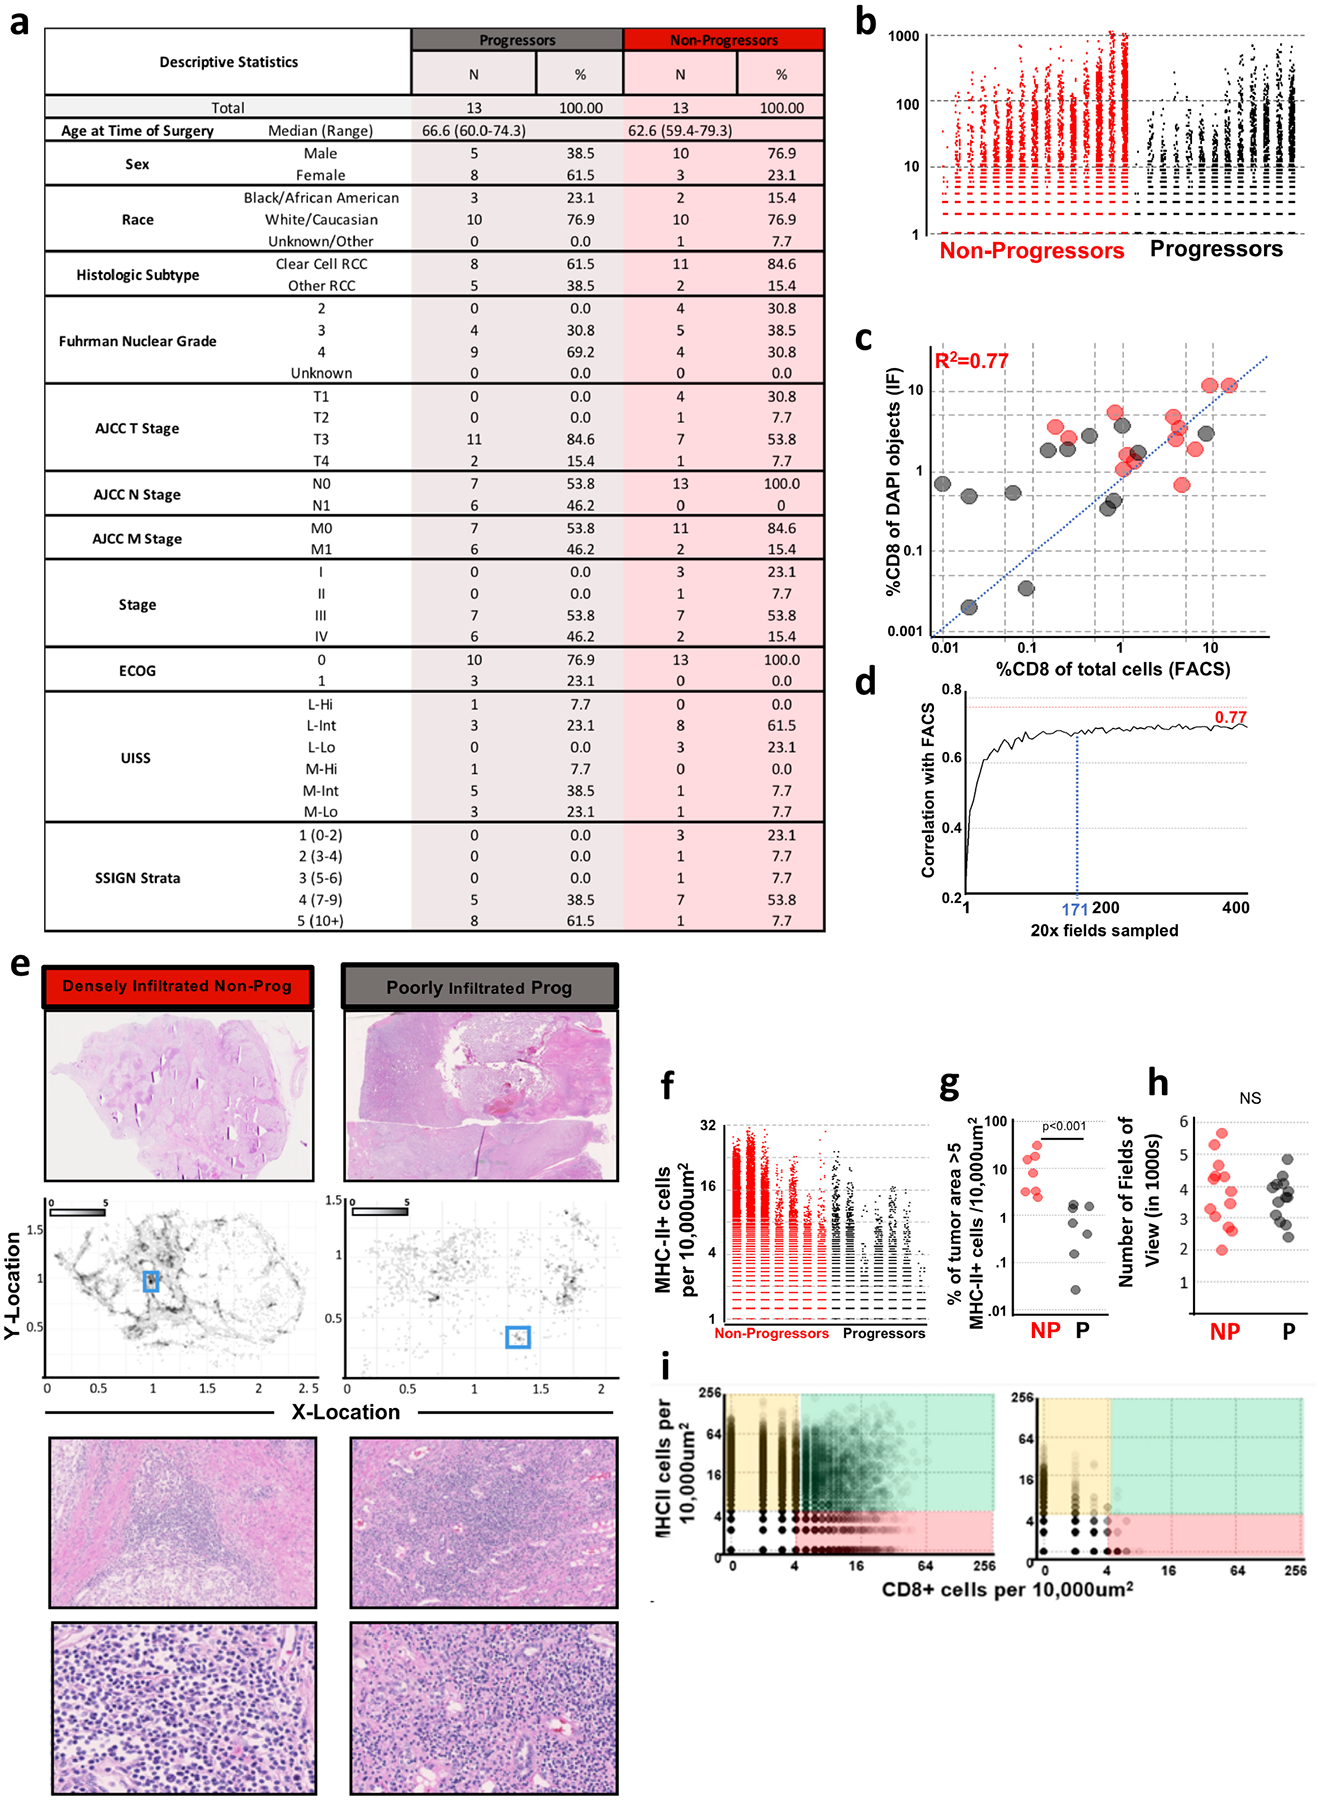
a, Descriptive table enumerating patient characteristics of patients with kidney cancer, with and without progressive disease. b, Comparison of the number of CD8+ cells per 300 μm × 300 μm field in patients with and without progressive disease. The number of CD8+ cells per 300 μm × 300 μm field were enumerated using the methods outlined in Extended Data Fig. 6. c, The correlation between enumeration of CD8 T cells by flow cytometry and by immunofluorescence. On the x axis, CD8 T cells are measured as a proportion of total cells. On the y axis, CD8 T cells are measured as a proportion of total DAPI objects detected in the tumour section. d, Estimated number of 20× fields of view necessary to obtain an accurate assessment of level of CD8 T cell infiltration is 171 fields of view. Increasing number of random fields of view were sampled from images and the percent of cells that were CD8 positive by IF correlated to FACS from the corresponding sample. e, Histological comparison of patients with kidney cancer shown in Fig. 4 — a patient with kidney cancer with dense T cell infiltration and no disease progression (red, left) and a patient with kidney cancer with poor T cell infiltration and progressive disease (grey, right). f, Comparison of the number of MHC-II+ cells per 300 μm × 300 μm field in stage III (T3N0M0) patients with and without progressive disease. The number of MHC-II+ cells per 300 μm × 300 μm field were enumerated using the methods outlined in Extended Data Fig. 6. g, Comparison of the proportion of tumour area with greater than 5 MHC-II+ cells per 10,000 μm2 between stage III (T3N0M0) patients with and without progressive disease. Statistical analysis resultant from Mann–Whitney test is shown. h, No significant difference in number of fields of view sampled between patients with and without progressive disease was detected. i, Density of MHC-II+ APCs and CD8 T cells in densely (left) or poorly (right) infiltrated kidney tumours. x-axis shows the number of CD8+ cells per 10,000 μm2. y-axis shows the number of MHC-II+ cells per 10,000 μm2. Regions of predominantly MHC-II+ cells are highlighted in yellow, regions of predominantly CD8+ cells in red, and regions of shared MHC-II+ cells and CD8+ cells in green.
Extended Data Fig. 10. Comparison of densely and poorly infiltrated kidney tumours by PDL-1 staining and by quantitative immunofluorescence.
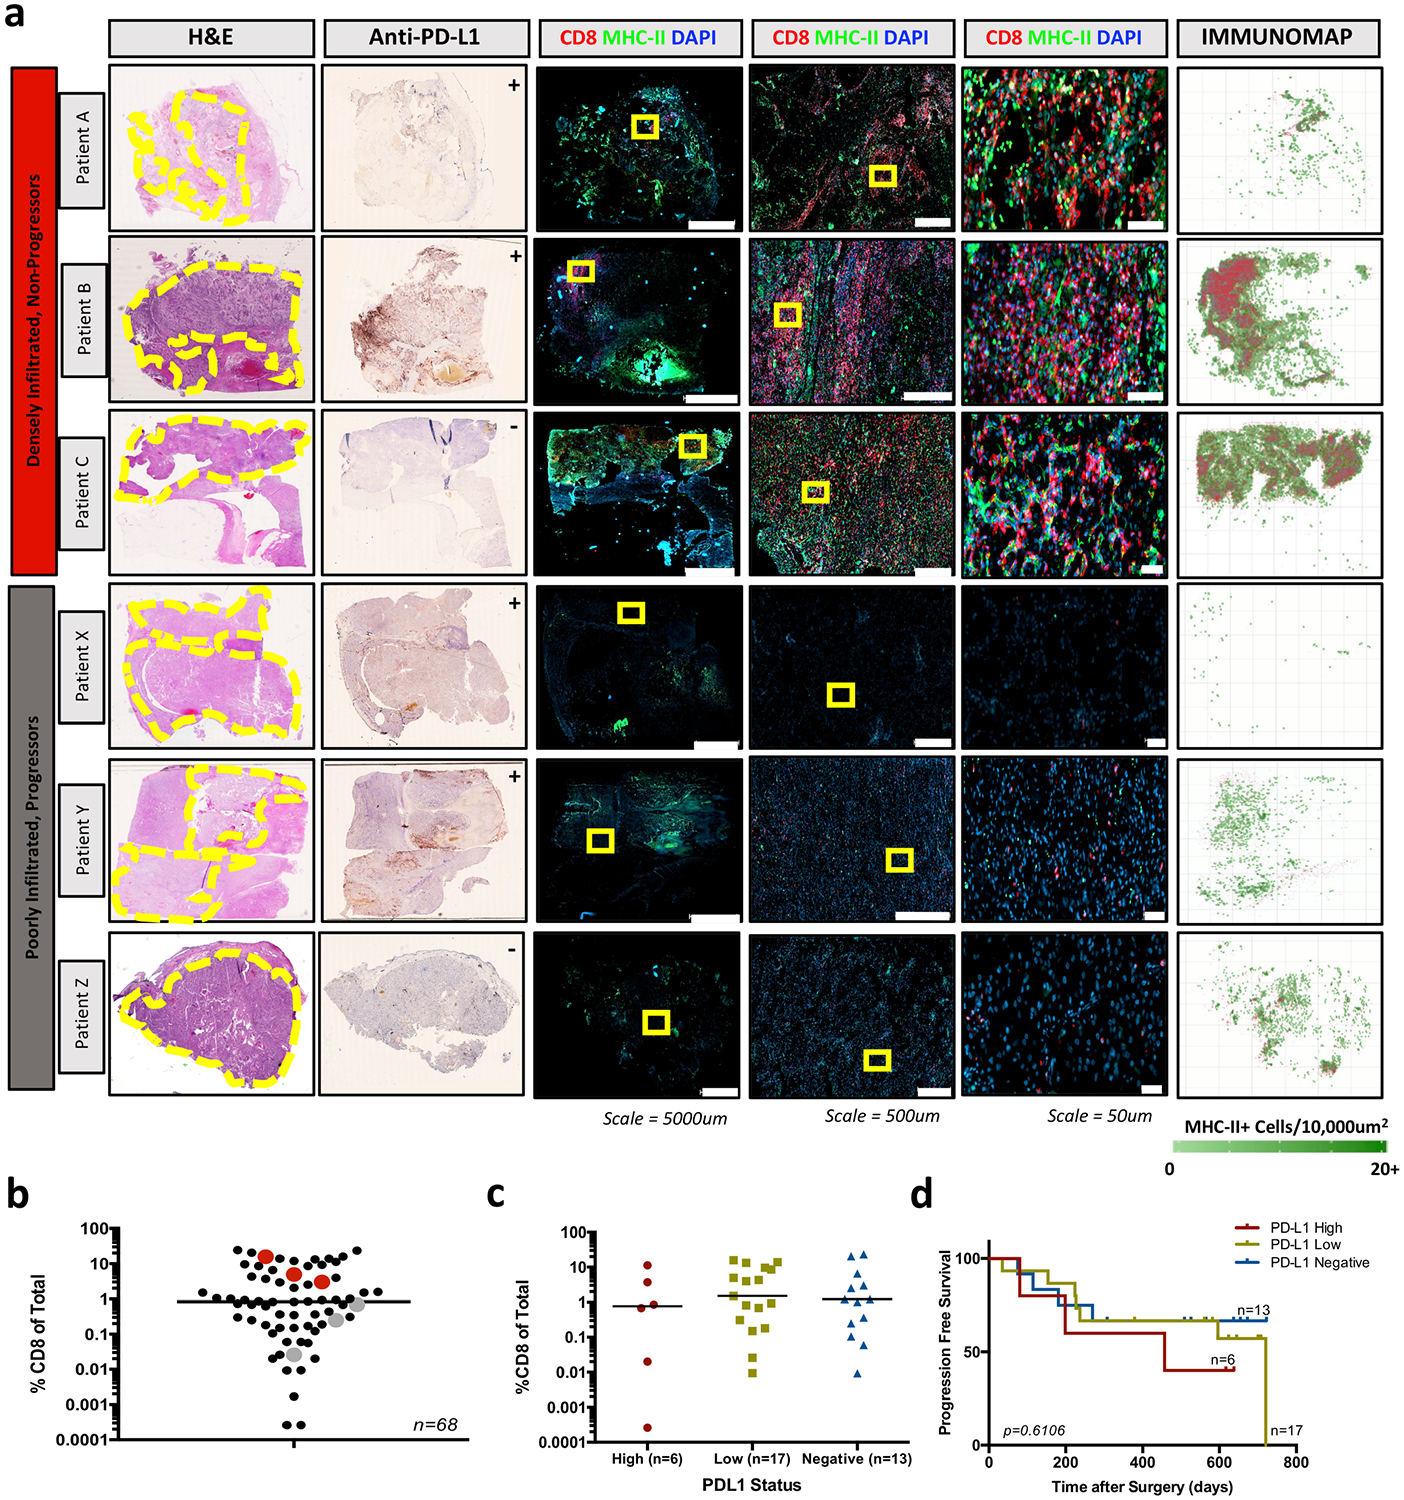
a, Representative patients with densely infiltrated and poorly infiltrated kidney tumours whose disease has not progressed or has progressed, respectively. Whole-slide scans are shown for haematoxylin and eosin, anti-PD-L1, and immunofluorescence (CD8, MHC-II, DAPI) stains, with zoomed insets of immunofluorescence data. Yellow circles highlight the location of tumour tissue on the haematoxylin and eosin slide. Yellow boxes highlight the areas shown in the zoomed insets of immunofluorescence images. Immunofluorescence data are quantitatively analysed and mapped to show the density of MHC-II+ cells and the XY location of CD8+ T cells in the rightmost panel. Anti-PD-L1 scans are marked as ++ (positive-high), + (positive-low), or − (negative), as scored by board-certified pathologists. b, Patients in a are highlighted in red (highly infiltrated, non-progressors) and grey (poorly infiltrated, progressors) to show the percentage of CD8 T cell infiltration by flow cytometry. c, PD-L1 staining was scored by board-certified pathologists as positive-high, positive-low and negative. There is no significant difference between the percent CD8 T cell infiltration amongst these categories by ANOVA with Holm–Sidak correction. Median value shown. d, Progression free survival for patients with positive-high (PD-L1 high), positive-low (PD-L1 low), and negative (PD-L1 negative) kidney tumours. There was no significant difference in progression-free survival between the groups by Mantel–Cox log rank test (P = 0.6106) or by log rank test for trend (P = 0.3374).
Supplementary Material
Acknowledgements
This work was supported by funding from the Prostate Cancer Foundation, Swim Across America, the James M. Cox Foundation and James C. Kennedy, pilot funding from the Winship Cancer Institute supported by the Dunwoody Country Club Senior Men’s Association, and NCI grants 1-R00-CA197891 (H.K.) and U01-CA113913 (M.G.S.). We recognize Adaptive Biotechnologies for providing laboratory services as a part of an educational grant award. We would like to acknowledge the Yerkes NHP Genomics Core which is supported in part by NIH P51 OD011132, the Emory Flow Cytometry Core supported by the National Center for Georgia Clinical & Translational Science Alliance of the National Institutes of Health under award number UL1TR002378, the Intramural Research Program of the NIH, National Cancer Institute and the Emory University Integrated Cellular Imaging Microscopy Core of the Winship Cancer Institute of Emory University and NIH/NCI under award number 2P30CA138292-04.
Footnotes
Competing interests The authors declare no competing interests.
Publisher’s note Springer Nature remains neutral with regard to jurisdictional claims in published maps and institutional affiliations.
Supplementary information is available for this paper at https://doi.org/10.1038/s41586-019-1836-5.
References
- 1.Galon J et al. Type, density, and location of immune cells within human colorectal tumors predict clinical outcome. Science 313, 1960–1964 (2006). [DOI] [PubMed] [Google Scholar]
- 2.Pagès F et al. Effector memory T cells, early metastasis, and survival in colorectal cancer. N. Engl. J. Med 353, 2654–2666 (2005). [DOI] [PubMed] [Google Scholar]
- 3.Peranzoni E et al. Macrophages impede CD8 T cells from reaching tumor cells and limit the efficacy of anti-PD-1 treatment. Proc. Natl Acad. Sci. USA 115, E4041–E4050 (2018). [DOI] [PMC free article] [PubMed] [Google Scholar]
- 4.Azimi F et al. Tumor-infiltrating lymphocyte grade is an independent predictor of sentinel lymph node status and survival in patients with cutaneous melanoma. J. Clin. Oncol 30, 2678–2683 (2012). [DOI] [PubMed] [Google Scholar]
- 5.Savas P et al. Single-cell profiling of breast cancer T cells reveals a tissue-resident memory subset associated with improved prognosis. Nat. Med 24, 986–993 (2018). [DOI] [PubMed] [Google Scholar]
- 6.Herbst RS et al. Predictive correlates of response to the anti-PD-L1 antibody MPDL3280A in cancer patients. Nature 515, 563–567 (2014). [DOI] [PMC free article] [PubMed] [Google Scholar]
- 7.Tumeh PC et al. PD-1 blockade induces responses by inhibiting adaptive immune resistance. Nature 515, 568–571 (2014). [DOI] [PMC free article] [PubMed] [Google Scholar]
- 8.Eroglu Z et al. High response rate to PD-1 blockade in desmoplastic melanomas. Nature 553, 347–350 (2018). [DOI] [PMC free article] [PubMed] [Google Scholar]
- 9.Gallimore A, Dumrese T, Hengartner H, Zinkernagel RM, Rammensee H-G Protective immunity does not correlate with the hierarchy of virus-specific cytotoxic T cell responses to naturally processed peptides. J. Exp. Med 187, 1647–1657 (1998). [DOI] [PMC free article] [PubMed] [Google Scholar]
- 10.Zajac AJ et al. Viral immune evasion due to persistence of activated T cells without effector function. J. Exp. Med 188, 2205–2213 (1998). [DOI] [PMC free article] [PubMed] [Google Scholar]
- 11.Wherry EJ et al. Molecular signature of CD8+ T cell exhaustion during chronic viral infection. Immunity 27, 670–684 (2007). [DOI] [PubMed] [Google Scholar]
- 12.Barber DL et al. Restoring function in exhausted CD8 T cells during chronic viral infection. Nature 439, 682–687 (2006). [DOI] [PubMed] [Google Scholar]
- 13.Gros A et al. PD-1 identifies the patient-specific CD8+ tumor-reactive repertoire infiltrating human tumors. J. Clin. Invest 124, 2246–2259 (2014). [DOI] [PMC free article] [PubMed] [Google Scholar]
- 14.Topalian SL et al. Safety, activity, and immune correlates of anti-PD-1 antibody in cancer. N. Engl. J. Med 366, 2443–2454 (2012). [DOI] [PMC free article] [PubMed] [Google Scholar]
- 15.Brahmer JR et al. Safety and activity of anti-PD-L1 antibody in patients with advanced cancer. N. Engl. J. Med 366, 2455–2465 (2012). [DOI] [PMC free article] [PubMed] [Google Scholar]
- 16.Hodi FS et al. Improved survival with ipilimumab in patients with metastatic melanoma. N. Engl. J. Med 363, 711–723 (2010). [DOI] [PMC free article] [PubMed] [Google Scholar]
- 17.Ahmadzadeh M et al. Tumor antigen-specific CD8 T cells infiltrating the tumor express high levels of PD-1 and are functionally impaired. Blood 114, 1537–1544 (2009). [DOI] [PMC free article] [PubMed] [Google Scholar]
- 18.Mlecnik B et al. Integrative analyses of colorectal cancer show immunoscore is a stronger predictor of patient survival than microsatellite instability. Immunity 44, 698–711 (2016). [DOI] [PubMed] [Google Scholar]
- 19.Tosolini M et al. Clinical impact of different classes of infiltrating T cytotoxic and helper cells (TH1, TH2, Treg, TH17) in patients with colorectal cancer. Cancer Res. 71, 1263–1271 (2011). [DOI] [PubMed] [Google Scholar]
- 20.Im SJ et al. Defining CD8+ T cells that provide the proliferative burst after PD-1 therapy. Nature 537, 417–421 (2016). [DOI] [PMC free article] [PubMed] [Google Scholar]
- 21.He R et al. Follicular CXCR5-expressing CD8+ T cells curtail chronic viral infection. Nature 537, 412–416 (2016). [DOI] [PubMed] [Google Scholar]
- 22.Utzschneider DT et al. T cell factor 1-expressing memory-like CD8+ T cells sustain the immune response to chronic viral infections. Immunity 45, 415–427 (2016). [DOI] [PubMed] [Google Scholar]
- 23.Brummelman J et al. High-dimensional single cell analysis identifies stem-like cytotoxic CD8+ T cells infiltrating human tumors. J. Exp. Med 215, 2520–2535 (2018). [DOI] [PMC free article] [PubMed] [Google Scholar]
- 24.Sade-Feldman M et al. Defining T cell states associated with response to checkpoint immunotherapy in melanoma. Cell 175, 998–1013 (2018). [DOI] [PMC free article] [PubMed] [Google Scholar]
- 25.Siddiqui I et al. Intratumoral Tcf1+PD-1+CD8+ T cells with stem-like properties promote tumor control in response to vaccination and checkpoint blockade immunotherapy. Immunity 50, 195–211 (2019). [DOI] [PubMed] [Google Scholar]
- 26.Kurtulus S et al. Checkpoint blockade immunotherapy induces dynamic changes in PD-1–CD8+ tumor-infiltrating T cells. Immunity 50, 181–194 (2019). [DOI] [PMC free article] [PubMed] [Google Scholar]
- 27.Miller BC et al. Subsets of exhausted CD8+ T cells differentially mediate tumor control and respond to checkpoint blockade. Nat. Immunol 20, 326–336 (2019). [DOI] [PMC free article] [PubMed] [Google Scholar]
- 28.Simoni Y et al. Bystander CD8+ T cells are abundant and phenotypically distinct in human tumour infiltrates. Nature 557, 575–579 (2018). [DOI] [PubMed] [Google Scholar]
- 29.Akondy RS et al. Origin and differentiation of human memory CD8 T cells after vaccination. Nature 552, 362–367 (2017). [DOI] [PMC free article] [PubMed] [Google Scholar]
- 30.Dieu-Nosjean MC, Goc J, Giraldo NA, Sautès-Fridman C & Fridman WH Tertiary lymphoid structures in cancer and beyond. Trends Immunol. 35, 571–580 (2014). [DOI] [PubMed] [Google Scholar]
- 31.Sautès-Fridman C, Petitprez F, Calderaro J & Fridman WH Tertiary lymphoid structures in the era of cancer immunotherapy. Nat. Rev. Cancer 19, 307–325 (2019). [DOI] [PubMed] [Google Scholar]
- 32.Silina K et al. Germinal centers determine the prognostic relevance of tertiary lymphoid structures and are impaired by corticosteroids in lung squamous cell carcinoma. Cancer Res. 78, 1308–1320 (2017). [DOI] [PubMed] [Google Scholar]
- 33.Miron M et al. Human lymph nodes maintain TCF-1hi memory T cells with high f unctional potential and clonal diversity throughout life. J. Immunol 201, 2132–2140 (2018). [DOI] [PMC free article] [PubMed] [Google Scholar]
- 34.Mandrekar J, Cha S Cutpoint determination methods in survival analysis using SAS2003. SAS https://support.sas.com/resources/papers/proceedings/proceedings/sugi28/261-28.pdf (2003). [Google Scholar]
- 35.Contal C & O’Quigley J An application of changepoint methods in studying the effect of age on survival in breast cancer. Comput. Stat. Data Anal 30, 253–270 (1999). [Google Scholar]
- 36.Scrucca L, Fop M, Murphy TB & Raftery AE mclust 5: clustering, classification and density estimation using gaussian finite mixture models. R J. 8, 289–317 (2016). [PMC free article] [PubMed] [Google Scholar]
- 37.Love MI, Huber W & Anders S Moderated estimation of fold change and dispersion for RNA-seq data with DESeq2. Genome Biol. 15, 550 (2014). [DOI] [PMC free article] [PubMed] [Google Scholar]
- 38.Krueger F & Andrews SR Bismark: a flexible aligner and methylation caller for bisulfiteseq applications. Bioinformatics 27, 1571–1572 (2011). [DOI] [PMC free article] [PubMed] [Google Scholar]
- 39.Gerner MY, Kastenmuller W, Ifrim I, Kabat J & Germain RN Histo-cytometry: a method for highly multiplequantitative tissue imaging analysis applied to dendritic cell subset microanatomy in lymph nodes. Immunity 37, 364–376 (2012). [DOI] [PMC free article] [PubMed] [Google Scholar]
Associated Data
This section collects any data citations, data availability statements, or supplementary materials included in this article.
Supplementary Materials
Data Availability Statement
Raw fastq files and associated RNA and whole genome bisulphite sequencing have been uploaded to the NCBI Gene Expression Omnibus (GEO) database under identifier GSE140430. Other relevant data are available from the corresponding author upon reasonable request.