

Abstract
TiO2 photocatalysts were prepared and coated on surfaces. Ultrathin TiO2 coatings were obtained by wash-coating and screen-printing techniques. The latter provides films of excellent adhesion that could tolerate washing under water jet. The scratch-proof coatings were characterized, and X-ray diffraction (XRD), atomic force microscopy (AFM) and N2 physisorption indicated that the addition of polyethylene glycol (PEG) not only improved the coating properties of TiO2 but also served as poragen to produce high surface area, mesoporous TiO2. The coated TiO2 displayed better activity than the commercial P25 TiO2 for photocatalytic oxidation of ethylene, ethanol, acetaldehyde, isopropanol and acetone. The catalyst also exhibited excellent bactericidal, fungicidal and virucidal activities against a wide variety of Gram-positive and Gram-negative bacteria, fungal spores and T2 bacterial phage. A simple photoreactor with tangential air flow was designed and tested in a chamber, before incorporating in a prototype air purifier. The study showed that there is good agreement between laboratory catalyst reaction data (i.e., 110 mmol h−1 for acetone) and the prototype test results (69 mmol h−1).
Keywords: Photocatalytic oxidation, VOCs, Antimicrobial, Air purification, Indoor air
1. Introduction
People often spent more than eighty percent of their time indoor and the indoor environment has an important impact on people's health and well-being [1]. There are extensive reports on the exposures and health impacts of various indoor air pollutants [2], [3], [4], [5]. Studies have shown that human exposures to indoor pollutants that exceed outdoor level by 2–5 times are not uncommon and in some situation, indoor pollution level can reach 100 times that of the outdoor [6]. A single exposure to high level indoor air pollution can cause headache and nausea, skin and eye irritations, respiratory difficulty, fatigue and even death for the case of carbon monoxide [6], while chronic exposure to indoor pollutants such as radon, environmental tobacco smoke (ETS), VOCs, particulates and bioaerosols can result in asthma, cancer, developmental defects and delays in children and weakening of the cardiovascular system in the elderly [7]. Thus, poor indoor air quality poses a greater risk to pregnant women, young children and elderly person.
Poor indoor air quality costs the state of California an estimated US$ 45 billion a year from medical expenses, health valuation on premature death and loss of productivity [8]. An improvement of indoor air quality in the United States of America is expected to save between US$ 7 and US$ 75 billion from lower health cost and absenteeism [9]. Even in the sparsely populated Australia, poor indoor air pollution is reported to cost AUD$ 12 billion annually [10]. Hong Kong, like most Asian cities is densely populated with more than 7 million people living on less than 1100 km2 of land. The narrow roads and tall, high-rise buildings trap pollution resulting in poor air quality. This directly affects the indoor air quality, which is far more complex and dynamics due to its sensitivity to human habit. A recent study by Chau et al. [11] investigated the health benefit from indoor air quality improvements in Hong Kong residence and concluded that the use of air cleaners provided the greatest annual health benefit.
A majority of air purifiers is based on filtration and adsorption technologies to remove airborne particulates, bioaerosols and malodors. Heterogeneous photocatalytic oxidation (PCO) has been investigated for decades and is considered an attractive technology for treatment of organic air pollutants (i.e., VOCs and malodors) and disinfection of airborne microorganisms at room conditions [12], [13], [14], [15], [16], [17], [18]. Ultraviolet (UV) light is generally used as the light source in the PCO processes, but new generation of visible-light active TiO2 are also showing great promise [19], [20]. The most common approach is to coat the catalytic materials (usually nano-TiO2) on substrates to increase the irradiated area [21], [22], [23], [24], [25]. TiO2 coating is therefore important to PCO performance. Coating delamination also poses a risk to environment and health [26], [27], [28], [29]. This work reports the preparation of nanostructured TiO2 coating by screen-printing method to obtain scratch-proof photoactive TiO2 coatings on surface. Tests on VOC removal and antimicrobial properties (bacteria and fungi) of the coatings made by screen-printing and wash-coating methods were performed in both laboratory and prototype air purifier.
2. Experimental methods
2.1. Material preparation and coating
The TiO2 preparation and coating are summarized in Scheme 1 . A 28 ml solution of 1 M titanium isopropoxide (TIP, 98%, ACROS) in 2-propanol (IPA, 99.8%, BDH) was added dropwise to a 72 ml of deionized and distilled water under vigorous mixing. The resulting suspension was stirred for an hour at room temperature for complete hydrolysis of TIP (step 1, Scheme 1). The solution was slowly heated to 343 K and 1 M HNO3 was added to give a [H+]/[Ti4+] = 0.4. The peptization was carried out for 2 h, before cooling to room temperature to obtain a clear TiO2 sol (step 2, Scheme 1) [30], [31]. Polyethylene glycol (PEG, ACROS, a.m.u. = 400) was added to the sol under vigorous mixing to obtain a coating sol sample (Sol A). A coating paste (Paste A) was obtained by evaporating the solvents (i.e., H2O and trace IPA) at 338 K. Coating precursor (Sol B) was also prepared by suspending commercial Degussa TiO2-P25 powder and HNO3 (1.6 M) in a 50 ml of deionized and distilled water with [H+]/[Ti4+] ratio of 1 via ultrasonication. Powders of TiO2 sol (steps 2′ and 2″, Scheme 1) and Paste A (step 5′, Scheme 1) were prepared for analysis.
Scheme 1.

Schematic diagram of TiO2 preparation and coating procedures.
Stainless steel (SS-304BA) and aluminum (Al-6061) plates were cut into 210 mm × 300 mm rectangular pieces. The plates were cleaned with detergent and rinsed with water followed by ethanol and acetone to remove dirt and contaminants. The TiO2 was coated on the plates by wash-coating and screen-printing methods. The plate was placed horizontally in enough Sol A solution to cover its surface. The deposited layer of TiO2 was dried and then calcined in air at 723 K for an hour (wash-coating method, step 4′, Scheme 1). Sol B was also wash-coated on the plates, dried and heated to 473 K for an hour. A thin layer of paste was coated on the plates by screen-printing (step 5, Scheme 1). A scrapper controlled by an automated system was positioned at the upper edge of the paste and a constant force was applied as the scrapper was dragged from the top edge to the lower edge of the surface. The coated plates were calcined in air at 723 K for an hour.
2.2. Material characterization
The powder and coated samples were examined by atomic force microscope (AFM, Nanoscope IIIα) and scanning electron microscope (SEM, JEOL 6300F), and analyzed by X-ray diffraction (XRD, Philips PW1830), micro-Raman spectroscopy (Renishaw RM3000) and nitrogen physisorption (Coulter SA3100). The size, morphology and aggregation of deposited TiO2 sol was investigated by AFM. The TiO2 sol was deposited on a freshly cleaved mica and dried at room temperature. The sample was imaged by Nanoscope IIIα AFM under tapping mode and using a 130 μm J-scanner and silicon cantilever tips (nanosensors). The greater roughness of the stainless steel and aluminum substrates used for the coated samples preclude the use of AFM and the samples were examined by SEM. Samples were cut from the coated plate, mounted on aluminum holders using conducting adhesive, sputter-coated with a thin layer of gold (Edwards Scancoat Six), and imaged at an accelerating voltage of 10 keV.
The X-ray diffraction of the powder and coated samples was conducted at a scan rate of 0.05° using a CuKα X-ray source with a graphite monochromator. The weight fraction of the different TiO2 phases was calculated from the integrated peak intensity and the crystal size was estimated from Scherrer equation. The Raman spectra of the samples were recorded using a Renishaw RM3000 micro-Raman system equipped with an Olympus BH-2 microscope. The spectral resolution was set approximately at 1.0 cm−1 and the spot size at about two micrometer in diameter. The excitation source used was an Argon laser operating at 514.5 nm with an output power of 25 mW. The nitrogen physisorption of the powder samples was carried out in a Coulter SA 3100 to determine the specific surface area, pore size distribution and pore volume. The sample's specific surface area was calculated based on the Brunauer, Emmett, and Teller (BET) theory and the mesopore volume and its distribution were calculated using the Barrett, Joyner, and Halenda (BJH) theory from the desorption isotherm.
2.3. Photocatalytic and antimicrobial properties of TiO2-coated plates
The photocatalytic oxidation (PCO) of hydrocarbon (i.e., ethylene (99.9%)) and volatile organic compounds (i.e., ethanol (99.9%, Merck), acetaldehyde (99.5%, Aldrich), isopropanol (99.8%, Mallinckrodt) and acetone (99.5%, Labscan)) were carried out in a stainless steel photoreactor described in prior works [32], [33]. The flat, rectangular photoreactor measured 578 mm × 113 mm and contained inlet and outlet ports, a recess for the catalyst plate (25 mm × 25 mm) and two sets of machined baffles. A 6.25 mm thick Pyrex glass top-cover creates a narrow rectangular channel (2 mm deep × 112 mm wide) for gas flow. Hydrocarbon gas was metered by an electronic mass flow controller and mixed with synthetic air to give a 400 sccm reactant mixture containing 240 ppm hydrocarbon. Liquid VOC was delivered by a syringe pump (kdScientific 1000) at a 0.01 ml h−1 to a constant temperature heat exchanger and mixed with 400 sccm synthetic air before entering the photoreactor. The 25 mm2, TiO2-coated plate was placed 322 mm downstream from the gas inlet and after steady-state, the catalyst plate was illuminated by five fluorescent black lamps (6 W, BLB Sankio Denki) placed 10 mm above the reactor window. The outlet gas composition was monitored by a gas chromatograph (HP 6890) equipped with thermal conductivity and flame ionization detectors and a GS-GASPRO capillary column (0.32 mm × 30 m). The gases used in the GC are helium (UHP, CW), hydrogen (UHP, HKO) and synthetic air (HP, HKSP).
Antimicrobial tests were carried out for bacteria, fungi and bacterial phage in a class II biological safety cabinet. The “antibacterial-drop test” [34] was adopted and modified for the bactericidal, fungicidal and virucidal tests. Bacteria including Bacillus cereus, Bacillus subtilis, Escherichia coli, Neisseria sicca, Pseudomonas aeruginosa, Serratia marcescens and Staphylococcus epidermidis were cultivated in standard nutrient broth at 310 K to their exponential growth phase. The bacteria were harvested and the concentration was adjusted to 103–104 ml−1. A 500 μl of the bacteria suspension was placed on the 25 mm × 25 mm, TiO2-coated plate and air dried in a Class II biological safety cabinet to reduce the water content and increase the area of contact between the bacteria and coated plate surface. After drying for an hour, the plates were irradiated with UV lamp for a total dosage of 5 J cm−2. Triplicate samples were tested and two sets of controls (i.e., dark and uncoated plate) were used. Viable bacteria were recovered by gently washing the plate with 500 μl sterile nutrient broth and an aliquot was inoculated onto a fresh nutrient agar plate. The number of viable bacteria colonies were enumerated after the plate was incubated at 310 K for 24 h.
Fungi colonies, including Penicillum chrysogenum, Cladosporiun sp. and Asperigillus niger, were cultivated on the malt extract agar plates for a week and the spores were harvested by slight agitation in sterilized distilled water. The spores were counted with a hemacytometer and the initial spore concentration for testing was adjusted to 103–104 ml−1. The plates were challenged with 500 μl fungal spores and irradiated with UV dosage of 5 J cm−2. The viable fungi were recovered by washing with sterile water. An aliquot was inoculated onto a malt extract agar plate and cultured for 5 days at 301 K. The stock of T2 phage was maintained by culturing the phage with its host, E. coli cells. The phage was recovered after the virucidal test by washing the plate with E. coli cell suspension. The washing was placed in an agar plate, cultured at 310 K for 24 h and the phage plaques were counted and the final concentration calculated.
2.4. Performance of a prototype PCO-based air purifier system
Two pieces of 210 mm × 300 mm TiO2-coated stainless steel plates (Paste A, screen-printed) were machined to form mating halves of a cylinder with a diameter of 134 mm and length of 300 mm. A single UV lamp (8 W, 30 cm long) was inserted in the center of the cylinder and irradiated a TiO2-coated area of about 1100 cm2. A slot was cut near one end of the cylinder and a fan was mounted to circulate the air through the assembly as shown in Fig. 1 a. A total VOC sensor (ppb RAE) monitors the VOC level in the chamber along with the electrochemical VOC gas sensors (Figaro TGS 2620) and temperature/humidity sensors (Honeywell HIH-3605-A) placed in the chamber and at the inlet and outlet of the assembly. The chamber was first cleaned and then purged with compressed air for at least an hour. Baseline measurements were made before introducing VOC into the chamber. The VOC was fed to the chamber by bubbling a sidestream of air into a series of three bubblers kept in a constant temperature bath, two containing the liquid VOC (i.e., acetone) and the last packed with glass beads. This ensured that the air is saturated with the organic vapor before dilution into the main air stream entering the chamber to give a VOC level of 4–10 ppm. After equilibration, the fan and UV lamp were turned on, and the temperature, humidity and VOC concentration were monitored with time. The experimental run often lasted for sixteen hours and the VOC removal rate was calculated from the data. The quantum efficiency is calculated as the number of VOC removed via photochemical process divided by the number of photons absorbed in the same interval.
Fig. 1.

(a) TiO2-coated plate assembly; (b) prototype air purifier; (c) schematic diagram of the air duct system used for VOC testing.
The chamber tested PCO assembly unit shown in Fig. 1a was incorporated in a prototype air purifier unit provided by Chiaphua Industries Ltd. HK as shown in Fig. 1b. The VOC remediation was tested for ethanol and acetone at ambient temperatures (ca. 298 K) and humidity (ca. 60% R.H.). The VOC liquid was evaporated and mixed with air inside the air duct before entering the prototype air purifier at an air flow of 120 m3 h−1. The temperature (National Semiconductor LM35 DZ), humidity (Honeywell HIH-3605-A) and VOC (Figaro TGS 2620) sensors were strategically located at the entrance and exit of the air purifier and the air temperature, humidity and VOC concentration were collected each second using PICO software. A digital multi-gas monitor (Bruel & Kjaeror 1302) measured the outlet and ambient CO2 level. The VOC removal rate was calculated from the difference in VOC concentration at the inlet and outlet of the air purifier.
The bioaerosol removal rate was measured for natural bioaerosol (i.e., airborne bacteria and fungi). The measurements were made at the University student canteen during the peak lunch hours when the average bioaerosol loading reaches 800 CFU m−3. The bioaerosol consists mostly of environmental microorganisms such as Micrococcus sp., S. epidermidis, Cladosporium sp., Penicillum sp. and yeast. Two bioaerosol impactors (single-stage) with pump (Model 1631-107B-G557X) were used in the experiment. TSA and MEA plates were used for sampling of airborne bacteria and fungi, respectively. One bioaerosol impactor was located near the air inlet of the air purifier and the other at the exit. The sampling of the inlet and outlet air was conducted simultaneously at a sampling rate of 28.3 L min−1 for 10 min, and three sampling runs were performed for bacteria and three for fungi.
3. Results and discussion
Indoor air pollutants consist of particulates, bioaerosols and gaseous pollutants (i.e., VOCs, CO, CO2) and are known to adversely impact health and comfort [35]. An on-site survey of forty-four residential households in Hong Kong was conducted during the summer (June–August) and winter (November–December) periods of 2003 immediately after the outbreak of the severe acute respiratory syndrome (SARS) coronavirus. The surveyed homes are apartment flats with floor areas ranging from 35 to 170 m2 and are located in high-rise public and private residential buildings that are typical for Hong Kong. Several of the air contaminants listed in Table 1 was monitored on a 24-h basis and the mean results were reported. The concentrations of VOCs were determined in accordance to USEPA TO-17 method and the airborne bacteria were measured according to the ACGIH guidelines for bioaerosol assessment.
Table 1.
Indoor air quality survey of domestic household in Hong Kong during the months following the outbreak of the severe acute respiratory syndrome (SARS) in 2003.a
| Pollutants | IAQOb excellent class | 1999c |
2003 |
|
|---|---|---|---|---|
| July–October | Summer | Winter | ||
| RSP (μg/m3) | <20 | 150 | 67 | 76 |
| Carbon dioxide (ppm) | <2000 | 580 | 461 | 567 |
| Formaldehyde (μg/m3) | <30 | 14 | 77 | 14 |
| Benzene (μg/m3) | 4.7 | 0.3 | 4.8 | |
| Ethyl benzene (μg/m3) | 2.6 | 1.8 | 6.5 | |
| Toluene (μg/m3) | 52.1 | 19.7 | 17.4 | |
| Xylenes (μg/m3) | 8.4 | 6.4 | 12.5 | |
| Tetrachloroethylene (μg/m3) | 2.5 | 5.4 | 9.8 | |
| Bacteria | <500 | 730 | 134 | 796 |
IAQ was conducted by Acron International Technology Ltd. under innovation technology fund contract.
Guidance notes for the management of indoor air quality in offices and public places, Hong Kong Environmental Protection Department, The Government of HKSAR.
Living room data from Ref. [36].
The mean total VOC level exceeds 100 μg m3 for both summer and winter, but the composition of the pollutant varies. An inordinate high level of formaldehyde was detected during the summer months and was attributed to the more frequent use of commercial disinfectants and cleanser in households following the SARS outbreak. This could explain the low bacteria count of the bioaerosol samples obtained during this period. The formaldehyde returned to normal level during the winter months when anxiety about SARS abated. This is also reflected by an increase in the mean level of airborne bacteria during the winter, however lower ventilation and frequent indoor activities (i.e., higher CO2) also contribute to the overall increase in indoor bioaerosol. The results of the winter survey is more in-line with the earlier study conducted in 1999 by Lee et al. [36]. The particulate (RSP), formaldehyde and bacteria levels in both 1999 and 2003 winter surveys exceed the Hong Kong Environmental Protection Department IAQ Excellent Class Standard of 20 μg m3, 30 μg m3 and 500 CFU m3, respectively. Prior works by the authors showed that various nanostructured TiO2 photocatalyst is effective against a wide range of organic pollutants including aromatic and chlorinated hydrocarbons and could be optimized to curtail the formation of undesired byproducts [37], [38], [39], [40], [41]. The nanostructured TiO2 can also inactivate Gram-positive and Gram-negative bacteria [41], [42], [43], [44].
3.1. Nanostructured TiO2 and coatings
The titania powder obtained from vacuum drying of the TiO2 sol (step 2′, Scheme 1) consisted of 3 nm anatase TiO2 according to X-ray diffraction. This indicates that acid peptization did not only produce smaller sol, but also transformed the titanium hydroxide [TiOx(OH)y, x = 2–0, y = 4 − 2x] into 3 nm-sized, anatase TiO2. The particle size obtained from the diffraction peak broadening is consistent with the AFM result shown in Fig. 2a. The sol deposited on the atomically smooth surface of the freshly cleaved mica appears as round clusters embedded in larger aggregates. The addition of PEG polymer to the sol (Sol A) prevented aggregation as shown in Fig. 2b and improved the particle dispersion through steric stabilization [45], but did not affect the particle size. Fig. 2c compares the nitrogen sorption isotherms for the TiO2 powders obtained from TiO2 sol (step 2′′) and Paste A (step 5′, Scheme 1). Both samples display a type IV isotherm that indicates the presence of framework-confined mesopores. The absence of a sharp rise in nitrogen uptake near the saturation pressure (i.e., P/P 0 = 1) means that there are few macropores in the samples [46]. In addition to being a stabilizer, the PEG also acted as poragen and the TiO2 prepared from Paste A displayed larger surface area (235.7 m2 g−1) and pore volume (0.3 cm3 g−1) than sample obtained from the titania sol without PEG. The latter had a surface area and pore volume of 105.9 m2 g−1 and 0.1 cm3 g−1, respectively.
Fig. 2.

AFM images of (a) TiO2 sol, (b) Sol A deposited on cleaved mica and (c) N2 physisorption isotherms of powders of TiO2 sol and Sol A.
Fig. 3a shows a high magnification picture of TiO2-coated plate prepared from Sol A by wash-coating method. It is clear that a thin uniform layer of TiO2 was obtained following air calcination. The X-ray diffraction in Fig. 3c detects only the support indicating that wash-coating produced an ultrathin coating on the plate. The micro-Raman spectroscopy is a sensitive surface technique and Fig. 4 shows the sample displays three weak bands at 400 cm−1, 500 cm−1 and 630 cm−1 corresponding to anatase [47]. An average TiO2 crystal size of ∼8 nm was estimated from the Raman peak broadening (14 cm−1) according to the procedure described by Iida et al. [48]. The commercial Degussa P25 TiO2 was used for comparison. Although the primary particles of P25 are smaller than 100 nm, they form large agglomerate [49] resulting in thick and uneven coating on the plate surface as shown in Fig. 3b. The thick coating displays X-ray diffraction peaks corresponding to anatase and rutile TiO2 [50] as shown in Fig. 3c. Diffraction peaks from the substrate are not detected, a further indication of thick coating. Unlike the plate coated from Sol A (Fig. 3a), the adhesion of the coating is poor and the deposited TiO2 are easily delaminated.
Fig. 3.

SEM photos of (a) Sol A, (b) Sol B wash-coated plates and (c) X-ray diffraction of the coated plates.
Fig. 4.
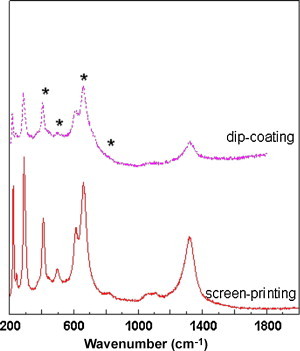
Raman spectra of TiO2 coatings prepared by wash-coating and screen-printing methods.
TiO2-coated plates were prepared from Paste A by screen-printing method are shown in Fig. 5 . The method is simple and easy to automate, and could coat large area of plates with uniform layer of TiO2. Fig. 5a shows a piece of stainless steel plate coated with TiO2 following air calcination. The Raman analysis indicates pure anatase TiO2 phase with crystal size of ∼7 nm (Fig. 4). A high magnification picture of the TiO2-coated stainless steel in Fig. 5b shows that TiO2 are uniformly deposited on the surface and form a dense surface coating layer as shown in Fig. 5b inset. The adhesion of TiO2 prepared by the wash-coating and screen-printing methods were examined by subjecting the coated plates to a water jet (0.25 L/s, 10 min). No detectable loss in mass was observed for by the screen-printed samples and 10–20% loss was detected for the wash-coated samples. Table 2 summarizes the properties of TiO2 coating prepared by different methods. In fact, the PEG polymer in Sol A and Paste A prevented aggregation and improved surface coating allowing deposition of an ultrathin and strongly adhered layer of TiO2.
Fig. 5.

(a) Optical microscope and (b) scanning electron microscope pictures of TiO2 coating prepared by the screen-printing method.
Table 2.
The properties of TiO2 coating prepared by different methods.
| Coating method | Coating precursor | Weight added (g cm−2) | Thickness | Surface morphology |
|---|---|---|---|---|
| Wash-coating | P25 | 2.2 × 10⁻⁴ | Thick | Uneven |
| Wash-coating | Sol A | 4.8 × 10⁻⁵ | Thin | Uniform |
| Screen-printing | Paste A | 3.2 × 10⁻⁵ | Thin | Dense and uniform |
3.2. Photocatalytic and antimicrobial properties of TiO2-coated plates
The photocatalytic activity of TiO2-coated plates prepared from Sol A and Sol B by wash-coating method was investigated in the laboratory photoreactor. The reaction rate was determined for ethylene, ethanol, acetaldehyde, 2-propanol and acetone at room temperature under flow conditions. Fig. 6a plots the steady-state conversion rates of the hydrocarbon and VOCs in dry synthetic air. The reaction rates obtained for samples coated from Sol A are higher than Sol B (P25-TiO2) coated plates, and varies depending on the organic pollutants. The TiO2-coated plate from Sol A is effective against ethylene, ethanol, acetaldehyde and acetone. The gas chromatograph did not detect any byproducts and complete mineralization was obtained, except for 2-propanol from which a 10–20% is converted to acetone. The P25-TiO2 coated plate display low conversion rates and aldehydes were detected in reactor exit. These data indicate that the prepared TiO2 has better PCO performance than that of commercial P25-TiO2 sample.
Fig. 6.

Plots of steady-state PCO conversion rates of (a) hydrocarbon and VOCs for wash-coated plates of Sol A and Sol B, and (b) wash-coated and screen-printed TiO2 plates with washings.
The effects of coating process on TiO2 adhesion and PCO performance were investigated. Fig. 6b plots the PCO reaction rates of acetone on TiO2-coated plates prepared by wash-coating of Sol A and screen-printing of Paste A. After each reaction runs that lasted for 8 h, the plates were removed from the reactor and subjected to a jet of compressed water (0.25 L/s) for 10 min. The plate was dried and returned to the photoreactor and its photocatalytic activity was re-measured. The TiO2-plate prepared by wash-coating suffered an immediate loss in activity after the first washing (Fig. 6b), while the screen-printed plate maintained its activity even after the third wash. It is generally accepted that the hydroxyl radicals (•OH) and superoxide (O2 −) species generated by UV light react and convert adsorbed organic molecules into CO2 and H2O [12]. Therefore, the loss of TiO2 catalyst from poor adhesion (i.e., wash-coated TiO2) led to eventual decrease in PCO activity (Fig. 6b). The release of TiO2 also poses a threat to environment and health [26], [27], [28], [29].
The antimicrobial activity of screen-printed TiO2 plates was tested for bacteria, fungi and bacteriophage. Gram-positive bacteria including B. cereus, B. subtilis and S. epidermidis and Gram-negative bacteria including E. coli, N. sicca, P. aeruginosa and S. marcescens were tested. Table 3 shows that except for N. sicca, better than ninety eight percent reduction in viable cells were obtained for the rest of the test bacteria under 5 J cm2 UV dosage. The TiO2-coated plates kept in the dark are inactive as shown in Table 3, so are the uncoated plates irradiated by UV. The UV-irradiated TiO2-coated plates were also effective against P. chrysogenum and Cladosporiun sp. with better than 98% reduction, while a more modest reduction of 83% was obtained for A. niger. The 4 log reduction or 99.99% inactivation of bacteria phage T2 is obtained over the irradiated TiO2-coated plates. These data showed that current TiO2-coated plates have marked germicidal function under UV illumination. Hydroxyl radicals (•OH) and superoxide (O2 −) are also believed to be responsible for the germicidal activity of UV irradiated TiO2 photocatalyst [51], [52]. Cho et al. [51] reported a strong correlation between the inactivation of E. coli and the amount of generated •OH radical. Kashige et al. [52] were able to show that for bacterial phage inactivation starts with the denaturing of the capsid protein by the •OH radical followed by the damage of the phage DNA within.
Table 3.
Inactivation of microorganisms in contact with TiO2-coated aluminum plate.a
| Microorganisms | Inactivation |
|
|---|---|---|
| Darkb | UV-irradiatedc | |
| Bacteria (∼104 CFU ml−1) | ||
| Bacillus cereus | 3.9 | >99.9 |
| Bacillus subtilis | 8.7 | 99.4 |
| Escherichia coli | 15.0 | 99.9 |
| Neisseria sicca | 13.2 | 62.6 |
| Pseudomonas aeruginosa | – | 99.9 |
| Serratia marcescens | – | 98.8 |
| Staphylococcus epidermidis | 13.5 | 99.9 |
| Fungi (∼104 CFU ml−1) | ||
| Penicillum chrysogenum | 13.0 | 98.1 |
| Cladosporiun sp. | 23.6 | >99.9 |
| Aspergillus niger | – | 83.5 |
| Bacteria phage (∼103 CFU ml−1) | ||
| Bacteria phage T2 (DNA virus) | Nil | >99.9 |
Samples prepared from Paste A by screen-printing method.
The number of P. aeruginosa, S. marcescens and A. niger was higher than the control. No experiment was done on phages for coated sample in the dark.
The inactivation data were measured at a UV dosage of 5 J cm−2.
3.3. Performance of a prototype PCO-based air purifier system
The majority of commercial air purifies uses adsorbent materials that require routine replacements to treat gaseous pollutants and malodors, thus incurring additional cost and generating adsorbent wastes. Heterogeneous photocatalytic oxidation has been studied for decades and is considered to be an attractive technology for treatment of organic pollutants in air [12], [39]. The TiO2 is a widely used photocatalyst, being highly efficient and stable as well as safe and inexpensive. The TiO2-coated plate assembly shown in Fig. 1a was tested in a closed chamber to verify the PCO performance of large TiO2 coating. A tangential air flow was used to achieve a higher mass transfer rate, but at an increased pressure drop as shown by the 3-dimensional, computational fluid dynamics model in Fig. 7a. The VOC concentration (i.e., acetone) in the chamber was monitored with time and plotted in Fig. 7b. The chamber displays a leak rate (i.e., natural decay) of ca. 30 ppb h−1 from an initial acetone concentration of ca. 9000 ppb. The leaks occurred at the chamber seals, which were replace after every ten runs. The chamber was allowed to equilibrate before the UV lamp is turned on. The tests performed on TiO2-coated plates prepared by wash-coating of Sol A and screen-printing of Paste A show both assemblies have similar high PCO activities (ca. 4000 ppb h−1 or 69 mmol h−1) and quantum efficiencies (79%). The experimental results were less than the theoretical conversion rate of 110 mmol h−1 from model calculation assuming ideal reactor conditions due to a lower mass transfer rate. However, the removal rate of 69 mmol h−1 from tangential flow was significantly higher compared to straight flow that had a measured conversion rate of 25 mmol h−1 (and quantum efficiency is 29%). The screen-printed plates were able to maintain a reaction rate of 55–78 mmol h−1 even after repeated washing.
Fig. 7.

(a) Computational fluid dynamics calculation of airflow in the TiO2-coated plate assembly shown in Fig. 1a, and (b) plots of acetone concentration in the test chamber during the PCO operation.
The screen-printed TiO2-coated plate assembly (Fig. 1a) was incorporated in a prototype air purifier shown in Fig. 1b and tested for VOC and bioaerosol removal. The tests were carried out at ambient temperature and conditions. Acetone and ethanol were evaporated and guided to the inlet of the air purifier using an air duct channel shown in Fig. 1c. The VOC concentration at the inlet and outlet were monitored during the 72 h experimental run, and the removal rate was calculated at steady-state. Acetone removal rate of 48 mmol h−1 was recorded at inlet acetone concentration of 10 ppm with a conversion of about 70% with complete mineralization. This conversion rate is comparable to the results of the chamber tests in Fig. 7b. The prototype removed ethanol at a rate of 23 mmol h−1 and formed CO2 at a rate of 37.8 mmol h−1, indicating that greater than 80% of the reacted ethanol converted to CO2. Tests performed on natural bioaerosol shows 36% reduction in viable bacteria and 60% reduction in fungi at the air purifier exit. The reduction was modest compared to the “antibacterial-drop test” results in Table 3. This could be explained by the fact that in natural aerosols, microorganisms are carried by inanimate hosts such as liquid droplets and particulates that afford some degree of protection to the microorganisms. The coated plates were swabbed after the experiment and the results show that no viable microorganisms survived on the surfaces indicating the TiO2-coated plates have good antimicrobial properties.
4. Concluding remarks
This work reports the preparation and coating of TiO2 photocatalyst with the objective of developing a practical PCO-based air purifier for indoor air. The TiO2 coating must display excellent adhesion to prevent the loss of catalyst during operation that could lead to lower performance and avoid health and environmental hazards posed by the released catalysts. A scratch-resistant coating was developed based on screen-printing technique. The polymer paste contains non-toxic PEG polymer to improve coating properties and serve as poragen to enhance the surface area and mesopore volume of the coated TiO2. The coating process is solvent-free, clean and applicable to most surfaces. A more quantitative measurement of film adhesion would be important for coating optimization. The PCO reaction study showed that the new TiO2 coatings are generally more active than the commercial P25 TiO2, however the reaction rates vary depending on the organic molecules. Reactions for pollutant mixture at environmentally relevant concentrations level (i.e.,<1 ppm) and humidity would provide better measure of the catalyst performance in indoor air. An unconventional approach was adopted in the design of the air purifier. Unlike traditional air purifiers that are designed to accommodate air purification technologies around an air handling system, the PCO reaction chamber was designed first and tested, before the air handling system was designed around the chamber. Thus, allowing us to optimize the PCO performance of the air purifier. This general approach is applicable to other environmental catalysts [53], [54], [55], [56], [57].
Acknowledgements
The authors would like to thank the financial supports from the Hong Kong Research Grant Council, the Hong Kong Innovation and Technology Commission and Chiaphua Industries Limited, Hong Kong. We are also grateful to Anthony Ng for testing the PCO performance.
References
- 1.United States Environmental Protection Agency and the United States Consumer Product Safety Commission Office of Radiation and Indoor Air (6604J), EPA Document #402-K-93-007, 1995.
- 2.Spengler J.D., Samet J.M., McCarthy J.F. McGraw-Hill; New York: 2001. Indoor Air Quality Handbook. [Google Scholar]
- 3.World Health Organization (WHO), Indoor air pollutants: exposure and health effects, EURO Reports and Studies 78 (1983).
- 4.Samet J.M., Spengler J.D. Johns Hopkins University Press; Baltimore: 1991. Indoor Air Pollution: A Health Perspective. [Google Scholar]
- 5.Raw G.J. HMSO; London: 1992. Sick Building Syndrome: A Review of the Evidence on Causes and Solutions, Health and Safety Executive Research Report No. 42/1992. [Google Scholar]
- 6.United States Environmental Protection Agency, Office of Radiation and Indoor Air (6601), EPA Document #400-R-92-012, 1993.
- 7.U.S. Environmental Protection Agency Office of Air and Radiation (6609J). EPA 402-K-01-003, October 2001.
- 8.California Air Resources Board, California Environmental Protection Agency, Indoor Air Pollution in California, Pursuant to Health and Safety Code §39930, February 2005.
- 9.Mendell M.J., Fisk W.J., Kreiss K., Levin H., Alexander D., Cain W.S., Girman J.R., Hines C.J., Jensen P.A., Milton D.K., Rexroat L.P., Wallingford K.M. Improving the health of workers in indoor environments: priority research needs for a national occupational research agenda. Am. J. Public Health. 2002;92:1430–1440. doi: 10.2105/ajph.92.9.1430. [DOI] [PMC free article] [PubMed] [Google Scholar]
- 10.S.K. Brown, Beating the $12 Billion Cost of Polluted Air, Media Release, Commonwealth Scientific and Industrial Research Organization (CSIRO), (1998) Ref 98/55.
- 11.Chau C.K., Hui W.K., Tse M.S. Valuing the health benefits of improving indoor air quality in residences. Sci. Total Environ. 2008;394:25–38. doi: 10.1016/j.scitotenv.2008.01.033. [DOI] [PubMed] [Google Scholar]
- 12.Mills A., LeHunte S. An overview of semiconductor photocatalysis. J. Photochem. Photobiol. A: Chem. 1997;108:1–35. [Google Scholar]
- 13.Mo J., Zhang Y., Xu Q., Lamson J.J., Zhao R., Zhao R. Photocatalytic purification of volatile organic compounds in indoor air: a literature review. Atmos. Environ. 2009;43:2229–2246. [Google Scholar]
- 14.Wang S., Ang H.M., Tade M.O. Volatile organic compounds in indoor environment and photocatalytic oxidation: state of the art. Environ. Intern. 2007;33:694–705. doi: 10.1016/j.envint.2007.02.011. [DOI] [PubMed] [Google Scholar]
- 15.Maira A.J., Yeung K.L., Soria J., Coronado J.M., Belver C., Lee C.Y., Augugliaro V. Gas-phase photo-oxidation of toluene using nanometer-size TiO2 catalysts. Appl. Catal. B. 2001;29:327–336. [Google Scholar]
- 16.Bhatkhande D.S., Pangarkar V.G., Beenackers A.A.C.M. Photocatalytic degradation for environmental applications—a review. J. Chem. Technol. Biotechnol. 2002;77:102–116. [Google Scholar]
- 17.Kim B., Kim D., Cho D., Cho S. Bactericidal effect of TiO2 photocatalyst on selected food-borne pathogenic bacteria. Chemosphere. 2003;52:277–281. doi: 10.1016/S0045-6535(03)00051-1. [DOI] [PubMed] [Google Scholar]
- 18.Yu J.C., Lin J., Yip H., Wong P.K. Photocatalytic activity, antibacterial effect, and photoinduced hydrophilicity of TiO2 films coated on a stainless steel substrate. Environ. Sci. Technol. 2003;37:2296–2301. doi: 10.1021/es0259483. [DOI] [PubMed] [Google Scholar]
- 19.Yang X.X., Cao C., Erickson L., Hohn K., Maghirang R., Klabunde K. Synthesis of visible-light-active TiO2 based photocatalysts by carbon and nitrogen doping. J. Catal. 2008;260:128–133. [Google Scholar]
- 20.Hamal D., Klabunde K.J. Synthesis, characterization, and visible light activity of new nanoparticle photocatalysts based on silver, carbon, and sulfur doped TiO2. J. Colloid Interface Sci. 2007;311:514–522. doi: 10.1016/j.jcis.2007.03.001. [DOI] [PubMed] [Google Scholar]
- 21.Rodriguez P., Meille V., Pallier S., Sawah M.A.A. Deposition and characterisation of TiO2 coatings on various supports for structured (photo)catalytic reactors. Appl. Catal. A: Gen. 2009;360:154–162. [Google Scholar]
- 22.Taranto J., Frochot D., Pichat P. Photocatalytic treatment of air: comparison of various TiO2, coating methods, and supports using methanol or n-octane as test pollutant. Ind. Eng. Chem. Res. 2009;48(13):6229–6236. [Google Scholar]
- 23.Pan J.H., Lee W.I. Selective control of cubic and hexagonal mesophases for titania and silica thin films with spin-coating. New J. Chem. 2005;29:841–846. [Google Scholar]
- 24.Yates H.M., Nolan M.G., Sheel D.W., Pemble M.E. The role of nitrogen doping on the development of visible light-induced photocatalytic activity in thin TiO2 films grown on glass by chemical vapour deposition. J. Photochem. Photobiol. A: Chem. 2006;179:213–223. [Google Scholar]
- 25.Sarantopoulos C., Puzenat E., Guillard C., Herrmann J.-M., Gleizes A.N., Maury F. Microfibrous TiO2 supported photocatalysts prepared by metal–organic chemical vapor infiltration for indoor air and waste water purification. Appl. Catal. B: Environ. 2009;91:225–233. [Google Scholar]
- 26.Gewin V. Nanotech's big issue. Nature. 2006;443(7108):137–1137. doi: 10.1038/443137a. [DOI] [PubMed] [Google Scholar]
- 27.Shimada M., Wang W.N., Okuyama K., Myojo T., Oyabu T., Morimoto Y., Tanaka I., Endoh S., Uchida K., Ehara K., Sakurai H., Yamamto K., Nakanishi J. Development and evaluation of an aerosol generation and supplying system for inhalation experiments of manufactured nanoparticles. Environ. Sci. Technol. 2009;43:5529–5534. doi: 10.1021/es9008773. [DOI] [PubMed] [Google Scholar]
- 28.Oberdörster G., Elder A., Rinderknecht A. Nanoparticles and the brain: cause for concern. J. Nanosci. Nanotechnol. 2009;9(8):4996–5007. doi: 10.1166/jnn.2009.gr02. [DOI] [PMC free article] [PubMed] [Google Scholar]
- 29.Oberdörster G., Oberdörster E., Oberdörster J. Nanotoxicology: An emerging discipline evolving from studies of ultrafine particles. Environ. Health Perspect. 2005;113(7):823–839. doi: 10.1289/ehp.7339. [DOI] [PMC free article] [PubMed] [Google Scholar]
- 30.Anderson M.A., Gieselmann M.J., Xu Q. Titania and alumina ceramic membranes. J. Membr. Sci. 1988;39:243–258. [Google Scholar]
- 31.J.H. Gu, PhD Thesis, Dalian Institute of Chemical Physics, CAS (1999).
- 32.Maira A.J., Yeung K.L., Lee C.Y., Yue P.L., Chan C.K. Size effects in gas-phase photo-oxidation of trichloroethylene using nanometer-sized TiO2 catalysts. J. Catal. 2000;192:185–196. [Google Scholar]
- 33.Maira A.J., Lau W.N., Lee C.Y., Yue P.L., Chan C.K., Yeung K.L. Performance of a membrane-catalyst for photocatalytic oxidation of volatile organic compounds. Chem. Eng. Sci. 2003;58:959–962. [Google Scholar]
- 34.Trapalis C.C., Keivanidis P., Kordas G., Zaharescu M., Crisan M. Szatvanyi, TiO2(Fe3+) nanostructured thin films with antibacterial properties. Thin Solids Films. 2003;433:186–190. [Google Scholar]
- 35.Obee T.N., Brown R.T. TiO2 photocatalysis for indoor air applications—effects of humidity and trace contaminant levels on the oxidation rates of formaldehyde, toluene and 1,3-butadiene. Environ. Sci. Technol. 1995;29:1223–1231. doi: 10.1021/es00005a013. [DOI] [PubMed] [Google Scholar]
- 36.Lee S.C., Li W.-M., Ao C.-H. Investigation of indoor air quality at residential homes in Hong Kong—case study. Atmos. Environ. 2002;36:225–227. [Google Scholar]
- 37.Yeung K.L., Maira A.J., Stolz J., Hung E.W.C., Ho N.K.C., Wei A.-C., Soria J., Chao K.-J., Yue P.-L. Ensemble effects in nanostructured TiO2 used in the gas-phase photooxidation of trichloroethylene. J. Phys. Chem. B. 2002;106:4608–4616. [Google Scholar]
- 38.Yeung K.L., Yau S.T., Maira A.J., Coronado J.M., Soria J., Yue P.L. The influence of surface properties on the photocatalytic activity of nanostructured TiO2 The influence of surface properties on the photocatalytic activity of nanostructured TiO2. J. Catal. 2003;219:107–116. [Google Scholar]
- 39.Cao S.L., Yao N., Yeung K.L. Synthesis of freestanding silica and titania-silica aerogels with ordered and disordered mesopores. J. Sol–Gel Sci. Technol. 2008;46:323–333. [Google Scholar]
- 40.Yao N., Cao S.L., Yeung K.L., Mesoporous TiO2–SiO2 aerogels with hierarchal pore structures. Micropor. Mesopor. Mater. 2009;117:570–579. [Google Scholar]
- 41.Cao S.L., Yeung K.L., Kwan J.K.C., To P.M.T., Yu S.C.T. An investigation of the performance of catalytic aerogel filters. Appl. Catal. B. 2009;86:127–136. [Google Scholar]
- 42.Yeung K.L., Leung W.K., Yao N., Cao S.L. Reactivity and antimicrobial properties of nanostructured titanium dioxide. Catal. Today. 2009;143:218–224. [Google Scholar]
- 43.Liu L.F., Barford J., Yeung K.L., Si G. Non-UV based germicidal activity of metal-doped TiO2 coating on solid surfaces. J. Environ. Sci.-China. 2007;19:745–750. doi: 10.1016/s1001-0742(07)60124-7. [DOI] [PubMed] [Google Scholar]
- 44.Liu L.F., Barford J., Yeung K.L. Non-UV germicidal activity of fresh TiO2 and Ag/TiO2. J. Environ. Sci.-China. 2009;21:700–706. doi: 10.1016/S1001-0742(08)62327-X. [DOI] [PMC free article] [PubMed] [Google Scholar]
- 45.Brinker C.J., Scherer G.W. Academic Press Inc.; Harcourt Brace Jovanovich: 1990. Sol–Gel Science the Physicals and Chemistry of Sol–Gel Processing. [Google Scholar]
- 46.Gregg S.J., Sing K.S.W. second ed. Academic Press; New York: 1982. Adsorption, Surface Area and Porosity. [Google Scholar]
- 47.Nyquist R., Kagel R., Putzig C., Leugers M. Academic Press; 1996. Handbook of Infrared and Raman Spectra of Inorganic Compounds and Organic Salts. [Google Scholar]
- 48.Iida Y., Furukawa M., Aoki T., Sakai T. Raman spectrum of ultrafine anatase powders derived from hydrolysis of alkoxide. Appl. Spectrosc. 1998;52:673–678. [Google Scholar]
- 49.Ohno T., Sarukawa K., Tokieda K., Matsumura1 M. Morphology of a TiO2 photocatalyst (Degussa, P-25) consisting of anatase and rutile crystalline phases. J. Catal. 2001;203:82–86. [Google Scholar]
- 50.Larson S.A., Widegren J.A., Falconer J.L. Transient studies of 2-propanol photocatalytic oxidation on titania. J. Catal. 1995;157:611–625. [Google Scholar]
- 51.Cho M., Chung H., Choi W., Yoon J. Linear correlation between inactivation of E. coli and OH radical concentration in TiO2 photocatalytic disinfection. Water Res. 2004;38:1069–1077. doi: 10.1016/j.watres.2003.10.029. [DOI] [PubMed] [Google Scholar]
- 52.Kashige N., Kakita Y., Nakashima Y., Miake F., Watanabe K. Mechanism of the photocatalytic inactivation of Lactobacillus casei phage PL-1 by titania thin film. Curr. Microbiol. 2001;42:184–189. doi: 10.1007/s002840010201. [DOI] [PubMed] [Google Scholar]
- 53.Cao S., Yeung K.L., Yue P.L. Preparation of freestanding and crack-free titania–silica aerogels and their performance for gas phase, photocatalytic oxidation of VOCs. Appl. Catal. B. 2007;68:99–108. [Google Scholar]
- 54.Cao S., Yeung K.L., Yue P.L. An investigation of trichloroethylene photocatalytic oxidation on mesoporous titania–silica aerogel catalysts. Appl. Catal. B. 2007;76:64–72. [Google Scholar]
- 55.Ho K.Y., Yeung K.L. Properties of TiO2 support and the performance of Au/TiO2 catalyst for CO oxidation reaction. Gold Bull. 2007;40:15–30. [Google Scholar]
- 56.Ho K.Y., Yeung K.L. Effects of ozone pretreatment on the performance of Au/TiO2 catalyst for CO oxidation reaction. J. Catal. 2006;242:131–141. [Google Scholar]
- 57.Li Y., Leung W.K., Yeung K.L., Lau P.S., Kwan J.K.C. A multilevel antimicrobial coating based on polymer-encapsulated ClO2. Langmuir. 2009;25:13472–13480. doi: 10.1021/la901974d. [DOI] [PubMed] [Google Scholar]