

Abstract
Background: Dissecting the complex genetic basis of hypertrophic cardiomyopathy (HCM) may be key to both better understanding and optimally managing this most prevalent genetic cardiovascular disease. An array-based resequencing (ABR) assay was developed to facilitate genetic testing in HCM.
Methods: An Affymetrix resequencing array and a single long-range PCR protocol were developed to cover the 3 most commonly affected genes in HCM, MYH7 (myosin, heavy chain 7, cardiac muscle, beta), MYBPC3 (myosin binding protein C, cardiac), and TNNT2 [troponin T type 2 (cardiac)].
Results: The assay detected the underlying point mutation in 23 of 24 reference samples and provided pointers toward identifying a G insertion and a 3-bp deletion. The comparability of array-based assay results to conventional capillary sequencing was ≥99.9%. Both techniques detected 1 heterozygous variant that was missed by the other method.
Conclusions: The data provide evidence that ABR can substantially reduce the high workload previously associated with a genetic test for HCM. Therefore, the HCM array could facilitate large-scale studies aimed at broadening the understanding of the genetic and phenotypic diversity of HCM and related cardiomyopathies.
Hypertrophic cardiomyopathy (HCM)1 is a primary disease of the heart muscle that can lead, at the extreme end of a broad clinical spectrum, to sudden cardiac death. HCM is considered to be a family of disorders with a high degree of genetic and phenotypic heterogeneity(1). HCM can be subdivided on the basis of genetic findings into myofilament (“sarcomeric”) HCM, Z-disc HCM, calcium-handling HCM, and metabolic HCM, depending on which component of the molecular motor of the heart is affected. The prevalence of mutations in the 3 most frequently affected genes (MYH7, MYBPC3, and TNNT2) ranges from 26% to 56% in different international cohorts(2). Genetic testing in HCM has a demonstrated value in establishing a correct diagnosis, and such testing has also helped disclose genotype–phenotype relationships, which have in turn been used to refine the diagnostic algorithm. For example, recent work by Binder and coworkers suggests that patients with reverse septal curvature should first be screened for mutations affecting the myofilament(3). Despite recent technological improvements, comprehensive genetic screening for mutations in 25 possibly affected genes remains a major challenge, especially in the context of large genetic clinical studies aimed at assessing the genetic etiology of HCM. We therefore performed a proof-of-principle experiment that investigated whether high-density oligonucleotide microarrays can be used to detect heterozygous mutations by means of parallel resequencing of multiple genes in multiple samples.
Materials and Methods
array design
The HCM1 custom resequencing array was designed according to the CustomSeq™ Resequencing array design guide (Affymetrix). In brief, reference sequences for the genes MYH72 (myosin, heavy chain 7, cardiac muscle, beta), MYBPC3 (myosin binding protein C, cardiac), and TNNT2 [troponin T type 2 (cardiac)] were downloaded from the NCBI GenBank in FASTA format to generate a so-called “sequence file.” Sequencher™ software (version 4.5; Gene Codes Corporation) was used to select the gene fragments to be sequenced. Fragments usually consisted of a single exon plus 100 bp of the 2 flanking introns, although 2 or more exons were combined in a single fragment when the intron size was ≤200 bp. The name of the reference sequence, the start and end positions of the fragments (relative to the reference sequence), and their first and last 4 nucleotides were compiled in an “instruction file.” The final design of the HCM1 array consisted of 27, 24, and 16 fragments of genes MYH7, MYBPC3, and TNNT2, respectively, and covered all exons (as defined by the respective mRNAs: MYH7, NM_000257; MYBPC3, NM_000256; TNNT2, X74819), as well as 500 bp of the 5′ upstream regions (as defined by genomic sequences NT_026437, NT_009237, and NT_004487 for MYH7, MYBPC3, and TNNT2, respectively).
resequencing probes and principle
The information contained in the instruction and sequence files was used by Affymetrix in the design of a large panel of 25mer oligonucleotide probes for sequencing both strands of the 3 genes in parallel by means of comparative hybridization. Each individual nucleotide of both the sense and antisense DNA strands was interrogated with 4 25mer probes that differed only with respect to the central position (A, C, G, and T). The principle of array-based resequencing (ABR) is illustrated in Fig. 1 . The 4 probes of each “quartet” were synthesized “on chip” adjacent to each other in separate 25-μm fields. We used 90 arrays, each of which was capable of sequencing 27 048 bp (exons and splice sites, 11 477 bp). In addition, the array contained probes that perfectly matched several insertions and deletions known to be associated with HCM.
Figure 1.
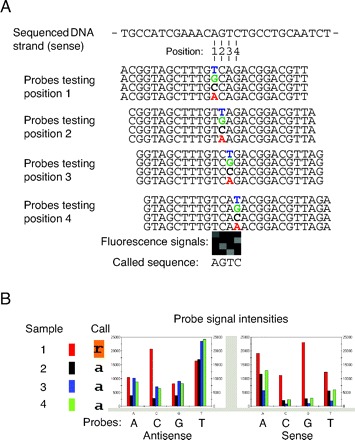
Array-based resequencing.
(A), Principle of the method. Shown are the probe sets needed to sequence a stretch of 4 bases in the sense strand of a gene. Note that the 4 probes (25mers) of each set differ only in the central position. Wild-type target DNA preferentially binds to the perfectly matched oligonucleotide probe, whereas hybrids with a single mismatch are efficiently abrogated with stringent washing procedures. The 16 probes shown were “tiled” in distinct fields of the array, for which fluorescence signals are shown. Four squares of a column correspond to a probe set testing 1 position. (B), Detection of a heterozygous missense mutation. Target DNA from 4 patients (samples 1–4) was hybridized to separate arrays. The figure shows the signal intensities of all probes interrogating the position MYBPC3 c.706A. Sample 1 (red columns) shows additional peak signal intensities for the G and C probes (sense and antisense strand, respectively), indicative of an A>G transition (call R).
dna isolation
Before blood samples were collected, the details of both the test procedure and the general implications of genetic testing were explained to the patients, and informed consent was obtained. All blood samples had been referred to the Heart and Circulation Institute for detection of HCM-causing mutations. Approval of the Institutional Review Board was not required. Total genomic DNA was isolated from peripheral blood lymphocytes with the EZ1 DNA Blood Kit and the BioRobot EZ1 (Qiagen).
array-based resequencing
We covered the 3 genes MYH7, MYBPC3, and TNNT2 with 9 PCR products (subsequently referred to as “amplicons”) that were generated in 7 individual and 1 duplex reaction (see Table 1 in the Data Supplement that accompanies the online version of this article at http://www.clinchem.org/content/vol54/issue4 for details of the PCR reactions). The amplicons were quantified with Quant-iT™ PicoGreen® dsDNA Reagent (Invitrogen). Equimolar amounts of the 9 amplicons for 1 DNA sample (i.e., 1 patient) were pooled, the amplicon pool was concentrated with the QIAquick PCR purification Kit (Qiagen), and the concentration of the DNA was measured by ultraviolet absorption spectroscopy. DNA fragmentation, labeling, hybridization, washing, and staining of the arrays were carried out according to the GeneChip® CustomSeq™ Resequencing Array Protocol Version 2.0 (Affymetrix; additional protocol information can be found at http://www.affymetrix.com/support/downloads/manuals/customseq_protocol.pdf). In brief, the pooled DNA was digested to generate fragments approximately 50 bp in size, which were then labeled through terminal transfer of biotinylated deoxynucleotides. Three micrograms of the resulting “target DNA” was then hybridized to the probe array overnight with tetramethylammonium chloride to counteract sequence-dependent differences in the melting temperatures of probe/target DNA hybrids. Hybridization was followed by a 2-step wash protocol, after which target DNA fragments remained preferentially bound to the probes with a full sequence match of 25 bp, whereas probe/target DNA hybrids with a mismatch in the central position were abrogated. Finally, the arrays were stained and scanned with the GeneChip® 3000 Scanner (Affymetrix). Affymetrix GCOS 1.4 and GSEQ 4.0 software (default settings) were used to process the raw data into nucleotide sequences. To identify a sequenced base, the software compared the signal intensities of the 4 fields that represent 1 probe “quartet.” A base was unequivocally identified (“called”) when the signal intensities from both the sense and antisense probe quartets fit the same out of 4 homozygous or 6 heterozygous models (A, C, G, T, A/C, A/G, A/T, C/G, C/T, G/T). An ambiguous site, for which the signals from one or both DNA strands did not fit one of these models, was called “N”.
automated capillary sequencing
Individual exons and intron flanks of the genes MYH7, MYBPC3, and TNNT2 were amplified from the same DNA samples used to generate the target DNA for ABR. GoTaq® Flexi DNA Polymerase (Promega) was used in conjunction with a single PCR protocol consisting of 1 cycle of 4 min at 94 °C; 40 cycles of 30 s at 94 °C, 30 s at 60 °C, and 60 s at 72 °C; and 1 cycle of 10 min at 72 °C. Proprietary methods were developed to run all post-PCR sequencing steps on a MICROLAB STAR IVD liquid-handling robot (Hamilton). We used AMPure® and CleanSEQ® reagent sets (Agencourt) for PCR product and sequencing reaction cleanup, respectively, and we used the GenomeLab™ DTCS Quick Start Kit (Beckman Coulter) for dye terminator cycle sequencing. Sequencing products were separated in a 33-cm, 8-capillary array on a CEQ 8000 instrument (Beckman Coulter). For heterozygote detection, the percentage of average peak spacing, the height ratio, and the sensitivity were set to 90%, 30, and 0.75, respectively. Alignments of forward and reverse sequencing traces were visually inspected with Sequence Investigator software (Beckman Coulter).
Results
As the first step toward validation of the ABR assay, we analyzed 10 previously uncharacterized DNA samples from HCM patients by using conventional automated capillary sequencing (ACS) and the HCM1 array in parallel (Table 1 ). Four putative disease-causing single-nucleotide variants (SNVs) were detected by both methods, whereas a 3-bp deletion (MYH7 c.2539_2541del) was detected only by ACS (ACS and HCM1 array detection rates, 50% and 40%, respectively). An ambiguous call (N) was assigned on average to 1 360 of the 27 048 bp interrogated on each array (mean N call rate, 5%). Most Ns (95%) recurred in various samples and were found in runs of ≥2 Ns, an observation suggestive of genomic regions with poor hybridization characteristics(4) where heterozygous mutations are unlikely to be detected. Notably, about three quarters of all Ns fall into intronic sequences. The mean call rate of the coding regions (plus splice sites) was therefore greater than that of the entire array (97.5% vs 95%). When focusing on the exons and splice sites, we observed a mean of 26 nonrecurrent Ns (single Ns) per array, which had to be reviewed carefully so as to not overlook missense and splice site mutations (see below). Of the 125 heterozygous sites (65 different SNVs) that we identified in the 10 samples by ACS, a single site remained undetected in the array-based assay; the reference base was called. Conversely, the array detected a single heterozygous mutation that was missed by conventional sequencing because the mutant signal fell below the threshold of 30% of the wild-type signal in both the sense and antisense strands. False-positive calls were found exclusively within runs of recurrent Ns, which were not considered in calculations of assay comparability.
Table 1.
Call rate and correctness of the HCM1 resequencing array.
| Sample No. | Call rate, %1 | Correctness, %2 | Discordant calls, n3 | ||
|---|---|---|---|---|---|
| Heterozygote | Homozygote | ||||
| 1 | 96 (98) | 100 | 0 | 0 | |
| 2 | 95 (98) | 100 | 0 | 0 | |
| 3 | 95 (98) | 100 | 0 | 0 | |
| 4 | 94 (97) | 100 | 0 | 0 | |
| 5 | 94 (97) | >99.9 | 1 | 0 | |
| 6 | 94 (97) | 100 | 0 | 0 | |
| 7 | 96 (98) | 100 | 0 | 0 | |
| 8 | 96 (98) | >99.9 | 1 | 0 | |
| 9 | 96 (98) | 100 | 0 | 0 | |
| 10 | 95 (97) | 100 | 0 | 0 | |
Percentage of resequenced bases that were unambiguously identified. The call rate for the coding portion (plus splice sites) of each array is given in parentheses.
The percentage of correctly called bases (as evaluated by ACS) with respect to the total number of bases called (excluding ambiguous calls).
Two heterozygous sites were overlooked, one by ACS and one by the HCM1 array.
To further assess the sensitivity of the array-based assay, we tested 25 previously characterized HCM samples in 2 independent experimental series (see Table 2 in the online Data Supplement). These DNAs harbored a total of 24 SNVs, 1 compound genotype (see below), 2 deletions (3 bp and 25 bp), and 1 insertion of a single nucleotide. Of the 24 SNVs, 21 SNVs in experiment 1 and 21 in experiment 2 were automatically detected by the GSEQ software with the default analysis settings. One SNV in experiment 1 and 2 SNVs in experiment 2 produced a single-N call, i.e., an ambiguous call in a position with high-confidence base assignment in all of the other samples; however, visual inspection of the probe-intensity windows clearly confirmed the presence of a heterozygous mutation. The polymorphism c.706 A>G (p.Ser236Gly) was correctly identified in 1 patient, but it hindered the detection of the adjacent allelic mutation (c.709T>C) in another. Two mutations in experiment 1 and 1 mutation in experiment 2 fell in regions with recurrent Ns and could not be detected. In summary, visual inspection of both the SNV table and the probe-intensity windows of single Ns allowed the detection of 96% of the known SNVs/mutations in experiment 1 and 92% in experiment 2. Of note is that we found 2 mutations that had been overlooked in the previous screening with single-strand conformation polymorphism analysis and subsequent conventional resequencing of suspicious amplicons. The replicate experiments also provided pointers to the G insertion and the 3-bp deletion, which were both detected as a single N (see above), although the exact nature of the mutation could not be deduced from the probe signal intensities.
Finally, we analyzed another 18 consecutive previously uncharacterized HCM samples on HCM arrays. This analysis led to the identification of 7 presumptive causative mutations (detection rate, 39%), 3 of which had been described previously. In total, 13 novel putative mutations were found in this study (Table 2 ).
Table 2.
Novel putative mutations found in this study.1
| No. | Gene | Exon/intron | Mutation2 | Consequence3 |
|---|---|---|---|---|
| 1 | MYH7 | exon 8 | c.641G>A | p.Gly214Asp |
| 2 | MYH7 | exon 8 | c.646C>G | p.Leu216Val |
| 3 | MYH7 | exon 9 | c.776C>A | p.Ala259Glu |
| 4 | MYH7 | exon 10 | c.842G>C | p.Arg281Thr |
| 5 | MYH7 | exon 16 | c.1681G>A | p.Ala561Thr |
| 6 | MYH7 | exon 21 | c.2348G>A | p.Arg783His |
| 7 | MYH7 | exon 27 | c.3346G>A | p.Glu1116Lys |
| 8 | MYH7 | exon 27 | c.3613G>A | p.Glu1205Lys |
| 9 | MYBPC3 | exon 7 | c.709T>C | p.Tyr237His |
| 10 | MYBPC3 | exon 13 | c.932CC>CA | p.Ser311X |
| 11 | MYBPC2 | intron 14 | c.1223+1G>T | splice defect |
| 12 | MYBPC3 | intron 14 | c.1224–19G>A | splice defect |
| 13 | MYBPC3 | intron 31 | c.3330+2T>C | splice defect |
The listed SNVs have not yet been reported in public mutation/SNP databases (http://www.cardiogenomics.org, http://www.hgmd.cf.ac.uk, http://www.ncbi.nlm.nih.gov/SNP/snp_blastByOrg.cgi; all 3 accessed June 2007). These mutations were considered putative disease-causing mutations on the basis of a finding that (a) the affected amino acid was conserved during evolution or (b) a splice site was either created or abolished.
See Materials and Methods for the GenBank entries for the reference sequences to which the nomenclature refers.
As deduced from the DNA alteration.
Discussion
HCM is characterized by a high degree of phenotypic variability among and within affected families, indicating the important role of environmental and modifying genetic factors. Testing of both the causative mutations and the modifying single-nucleotide polymorphisms/SNVs in parallel is therefore thought to improve the predictive value of the genotype(5). High-density oligonucleotide microarrays offer the opportunity to conduct both tests on a single analytical platform. Although single-nucleotide polymorphism arrays have been used extensively, little is known about the sensitivity of mutation detection with ABR(4)(6). Our data suggest that the HCM1 array is an effective alternative to conventional capillary sequencing. Although some insertion/deletion mutations were missed, the array detected almost all of the known missense mutations tested. The 39% detection rate of ABR compares well with the rates reported in recent metaanalyses(2). The missense mutations that were missed fell within G/C-rich regions that might be better resolved by adjusting probe length(7) and by shifting the position of the variable base toward one end of the probe(8). It is worth noting in this context that an N-call rate of 2.5% for the coding sequences represents a considerable limitation of the ABR approach. The high number of Ns is linked to the base-call algorithm that requires unambiguous signals from both DNA strands to be called as either a homozygote or a heterozygote; however, most of the N′s (≥80%) can be resolved by visual inspection of the probe intensities, because either the sense probe or the antisense probe provides clear-cut results. Yet, visual inspection of several hundred N sites per patient is not feasible in routine practice. The development of software optimized for the analysis of resequencing arrays should substantially reduce the number of exons that need to be reassessed by conventional sequencing.
An advantage of the ABR approach is that it allows a sample throughput of approximately 100 patients per technician per month, and it is therefore custom-tailored for large-scale genetic clinical studies. In addition, the array may be used for initial screening in diagnostic laboratories. The low number of PCR reactions needed and the immediate identification of the base change are 2 major advantages of ABR compared with other prescreening techniques, such as denaturing high-performance liquid chromatography(9) and denaturing gradient gel electrophoresis(10). Costly conventional sequencing may thus be confined to those samples that test negative in the array-based prescreening.
Meanwhile, novel array formats are available (50, 100, and 300 kb) that can accommodate both established and candidate cardiomyopathy genes. These tools may help pave the way for incorporating genetic knowledge into clinical practice.
Supplementary Material
Acknowledgments
Grant/Funding Support: None declared.
Financial Disclosures: The study was conducted in the framework of a Translational Medicine Strategic Project Agreement between the Institute of Heart and Circulation Research of the University of Witten/Herdecke (Dortmund, Germany) and Affymetrix (München, Germany).
Acknowledgments: The authors thank Joanne Davies and Hans-Peter Vosberg for critical reading of the manuscript. We also acknowledge the major contributions of Hans-Peter Vosberg during the planning phase of this study. One reviewer provided constructive suggestions that helped considerably in improving the discussion part of the manuscript.
Footnotes
Nonstandard abbreviations: HCM, hypertrophic cardiomyopathy; ACS, automated capillary sequencing; SNV, single-nucleotide variant; ABR, array-based resequencing.
Human genes: MYH7, myosin heavy chain, cardiac muscle, beta; MYBPC3, myosin binding protein C, cardiac; TNNT2, troponin T type 2 (cardiac).
References
- 1.Bos JM, Ommen SR, Ackerman MJ. Genetics of hypertrophic cardiomyopathy: one, two, or more diseases?. Curr Opin Cardiol 2007;22:193-199. [DOI] [PubMed] [Google Scholar]
- 2.Van Driest SL, Ommen SR, Tajik AJ, Gersh BJ, Ackerman MJ. Sarcomeric genotyping in hypertrophic cardiomyopathy. Mayo Clin Proc 2005;80:463-469. [DOI] [PubMed] [Google Scholar]
- 3.Binder J, Ommen SR, Gersh BJ, Van Driest SL, Tajik AJ, Nishimura RA, Ackerman MJ. Echocardiography-guided genetic testing in hypertrophic cardiomyopathy: septal morphological features predict the presence of myofilament mutations. Mayo Clin Proc 2006;81:459-467. [DOI] [PubMed] [Google Scholar]
- 4.Wong CW, Albert TJ, Vega VB, Norton JE, Cutler DJ, Richmond TA, et al. Tracking the evolution of the SARS coronavirus using high-throughput, high-density resequencing arrays. Genome Res 2004;14:398-405. [DOI] [PMC free article] [PubMed] [Google Scholar]
- 5.Ashrafian H, Watkins H. Reviews of translational medicine and genomics in cardiovascular disease: new disease taxonomy and therapeutic implications cardiomyopathies: therapeutics based on molecular phenotype. J Am Coll Cardiol 2007;49:1251-1264. [DOI] [PubMed] [Google Scholar]
- 6.Liu C, Aronow BJ, Jegga AG, Wang N, Miethke A, Mourya R, Bezerra JA. Novel resequencing chip customized to diagnose mutations in patients with inherited syndromes of intrahepatic cholestasis. Gastroenterology 2007;132:119-126. [DOI] [PMC free article] [PubMed] [Google Scholar]
- 7.Southern E, Mir K, Shchepinov M. Molecular interactions on microarrays. Nat Genet 1999;21:5-9. [DOI] [PubMed] [Google Scholar]
- 8.Waldmuller S, Freund P, Mauch S, Toder R, Vosberg HP. Low-density DNA microarrays are versatile tools to screen for known mutations in hypertrophic cardiomyopathy. Hum Mutat 2002;19:560-569. [DOI] [PubMed] [Google Scholar]
- 9.Yu B, Sawyer NA, Caramins M, Yuan ZG, Saunderson RB, Pamphlett R, et al. Denaturing high performance liquid chromatography: high throughput mutation screening in familial hypertrophic cardiomyopathy and SNP genotyping in motor neurone disease. J Clin Pathol 2005;58:479-485. [DOI] [PMC free article] [PubMed] [Google Scholar]
- 10.Zeller R, Ivandic BT, Ehlermann P, Mucke O, Zugck C, Remppis A, et al. Large-scale mutation screening in patients with dilated or hypertrophic cardiomyopathy: a pilot study using DGGE. J Mol Med 2006;84:682-691. [DOI] [PubMed] [Google Scholar]
Associated Data
This section collects any data citations, data availability statements, or supplementary materials included in this article.