

Bead-based assays are a revolutionary new technology for the analysis of large numbers of biomolecules. We present a critical analysis of methods for encoding beads for use in assays.
Abstract
The requirement for analysis of large numbers of biomolecules for drug discovery and clinical diagnostics has driven the development of low-cost, flexible and high-throughput methods for simultaneous detection of multiple molecular targets in a single sample (multiplexed analysis). The technique that seems most likely to satisfy all of these requirements is the multiplexed suspension (bead-based) assay, which offers a number of advantages over alternative approaches such as ELISAs and microarrays. In a bead based assay, different probe molecules are attached to different beads (of a few tens of microns in size), which are then reacted in suspension with the target sample. After reaction, the beads must be identifiable in order to determine the attached probe molecule, and thus each bead must be labelled (encoded) with a unique identifier. A large number of techniques have been proposed for encoding beads. This critical review analyses each technology on the basis of its ability to fulfil the practical requirements of assays, whilst being compatible with low-cost, high-throughput manufacturing processes and high-throughput detection methods. As a result, we identify the most likely candidates to be used for future integrated device development for practical applications.
Insight, innovation, integration
Bead-based assays offer a powerful, flexible and high-throughput approach for analysing the interactions of large numbers of different probe molecules with biological targets, in a single small volume sample (multiplexed assays). Each bead used in an assay is labelled (encoded), in order to identify the probe molecules on its surface. The technique has a number of advantages over alternative methods for studies of protein and DNA interactions, clinical diagnostics and drug discovery. This review critically assesses the large number of innovative bead designs that have been developed, identifying those with the potential for the successful integration of bead encoding, fabrication and biochemistry required to create a reliable, simple and potentially mass-producible high-throughput multiplexed assay technology.
Introduction
Rapid advances in genomics and proteomics have produced demand for high throughput multiplexed analysis of large numbers of biomolecules with applications in medical diagnostics and drug discovery. One example is the requirement for high-throughput immunoassays as more comprehensive, less time consuming and lower sample volume replacements for current lab-based diagnostic tests. Immunoassays require the identification of many different antibodies in biological fluids to identify diseases;1 commonly achieved by using an Enzyme-Linked ImmunoSorbant Assay (ELISA). Traditional ELISAs are large-scale assays, where analysis is performed one antibody at a time. Multiple ELISAs are performed using microtitre plates with between 6 and 1536 wells or reaction vessels of 30–50 μl volume, and a different antigen bound to each well. A separate ELISA is performed in each and the solution colour in each well measured on an automated ‘plate reader’. Multiple assays therefore require relatively large volumes of sample. An ELISA typically detects concentrations of target proteins in the range 1 pg ml−1 to 10 ng ml−1, depending on the particular probe/target combination being used.2
Multiplexed assays offer the potential of performing a large number of different assays all in a single reaction vessel with volume equivalent to a single microtitre plate well (i.e. around 30 μl) therefore using smaller sample volumes than multiple traditional ELISAs. This is particularly important for medical applications involving analysis of samples from patients, in which limited sample quantities are available. A commercially established method for achieving this is the multiplexed ELISA, in which more then one probe molecule (e.g.antigen) is attached to each well of an ELISA plate. The probes are arranged in arrays of spots on the base of the well, with one probe type in each spot. The ELISA proceeds in the traditional manner, producing coloured spots at the location of each probe that bind to a target during the assay. A number of companies have produced multi-well plates containing more than one probe in each well,3–6 including Quansys Biosciences (up to 25 spots per 30 μl well of a 96-well plate), Thermo Scientific (Searchlight Arrays – up to 16 spots per 50 μl well of a 96-well plate), RayBiotech (Quantibody arrays-up to 20 probes per well, each probe in quadruplicate, 16-well glass slide) and CellSignalling Technology (PathScan ELISA – up to 4 probes per well, 96-well plate). Thus the Quansys Biosciences plates probe for 25 targets in a 30 μl sample, rather than the 750 μl required by a traditional ELISA using 25 wells. Sensitivities are typically the same as for equivalent ELISAs.
A method allowing for analysis of a larger number of targets (typically of the order of 104) is the protein microarray, which has been used for multiplexed detection, for example, of cytokines,7Ig-Eantibodies8 and various multiple-sclerosis markers.9 Typically for antibody detection arrays, a glass slide is spotted with a number of different antigens. The entire surface is reacted with an antibody-containing sample and the antibodies in the sample bind only to their corresponding antigens. The signal is read using a fluorescent detectorantibody that binds to all the target antibodies. The fluorescent positions on the plate are automatically identified by analysing an image of the slide, and hence the type and quantity of antibodies present in the sample is identified. An example in which four antigens are reacted with a sample containing two different target antibodies is shown in Fig. 1(A) and (B). Protein-based assays have applications in detecting a variety of markers indicating, for example, viral infection,10,11 cancers12–14 and auto-immune diseases9 in a patient.
Fig1.

Principle of an antibody microarray. (A) Probeantigens corresponding to different target antibodies are attached to a glass slide in an array format. (B) The slide is reacted with a solution containing target antibodies corresponding to two of the antigens. A fluorescent label antibody is then attached to the target antibody, so that the spots containing target become fluorescent, indicating binding. The spatial position of the fluorescent spot identifies the antigen and hence the target antibody.
Microarrays are also routinely used for identification of DNA and RNA fragments in samples. In a similar manner to the immunoassay microarray, fluorescently labeled oligonucleotides hybridize to their complementary sequence on the microarray plate. Typically, DNA assays require a much higher level of multiplexing than immunoassays. These assays have applications in gene expression studies for disease indicators,15,16 and detection of pathogenic DNA in samples.17 Typical sensitivities of microarray-based methods are ∼1 pg ml−1, i.e. similar to ELISAs.
Multiplexed suspension (bead-based) assays
Microarrays suffer from some disadvantages, including slow reaction kinetics,18 problems with localization of the biomolecules bound to the chip (making printing of high-density arrays complex), and inflexibility of probe combinations used in an assay. Recently there has been an interest in developing bead-based assays where micrometre-sized solid particles (beads) are used for attaching probe biomolecules, such as antigens for immunoassays. The probes are attached by reacting different particles (in suspension) with solutions of different probes, thus reducing the problems associated with attaching molecules to microarrays. For a typical assay, a selection of different particles is used, each with a different probes attached. A suspension of such particles is reacted with the sample and the binding measured. Unlike a microarray, where the molecular probe is identified from its location in a matrix, each particle must carry a unique identifier, i.e. a tag or code, as shown in Fig. 2. After reaction every particle is analysed for (a) fluorescence indicating binding of (for example) an antibody and (b) the unique code. The combination of these two allows identification of the probe molecule and therefore the antibodies present in the sample.
Fig2.
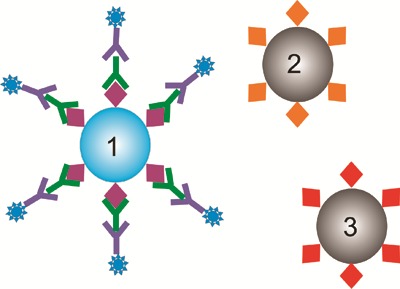
Principle of a bead based assay. The assay proceeds in the same manner as microarray assay, however, instead of the probe molecules being attached to different site on a slide, each probe is attached to a different bead. Since the beads do not have a well defined position, each must have some kind of code which allows it to be identified after the reactions have taken place.
Particles can be analysed in microfluidic systems, providing a high throughput platform, which can be integrated into low-cost devices for biochemical research and point-of-care medical diagnostic applications.19,20 Potentially particles could be directed post analysis into different reaction vessels, for split-and-mix synthesis where molecules such as a peptides or oligonucleotides are progressively and combinatorially synthesized on the beads.21
The number of codes required for a bead-based assay technology depends on the assay; some immunoassays only require the identification of a few tens of antibodies in the sample.18 By contrast, assay studies of biological processes such as gene expression and protein–protein interaction can require very large numbers of codes (around 104–105).15,16 Other assays that involve combinatorial synthesis of large numbers of compounds, such as drug discovery assays, require similarly large numbers of codes.
A microparticle encoding technique must satisfy a number of requirements: It must be machine-readable by non-contact methods; suitable for encoding particles of tens of microns in size; unaffected by the biochemical reactions; robust, with low error rate; able to encode large numbers of particles, each with a unique code; implementable on materials which are compatible with biomolecule attachment and amenable to low-cost mass production (particularly important for diagnostic applications). A large number of techniques have been proposed for encoding beads, some of which have been reviewed elsewhere22,23 and research in this area has been extensive. This review provides an overview of current microparticle encoding techniques and addresses the advantages and disadvantages of the different techniques. Important points to consider when reviewing encoding techniques are; the encoding capacity of each technique (how many molecules may potentially be identified using each technique, which determines the types of assays it can be used for); the simplicity of the manufacturing process (i.e. is it realistically possible to manufacture the number of encoded particles required for a particular assay); the simplicity and accuracy of the reading system; robustness of the technique (i.e. how likely is it that errors occur during code reading); and the compatibility of the technique with other aspects of the assay, in particular the chemical processes involved in molecule binding or synthesis onto the particles, and the method used to indicate binding of target molecules to the microparticle (i.e. whether the particles can actually be used for their suggested applications). An additional consideration is the potential for miniaturization of the entire reading system into an integrated ‘lab-on-a-chip’ device.
Spectral encoding of microparticles
Fluorescence spectrum encoding
The most well established encoding technique is based on spectral encoding; the code is based on the colour and intensity of light emitted from polymer microspheres doped with fluorescent dyes. Typically latex microspheres are soaked in an organic solvent so that they swell, allowing dye molecules to enter the material viapores. When placed in an aqueous solution, the spheres shrink, trapping the dye molecules within the latex. Using a single dye at different concentrations, a multiplexed assay of six different cytokines has been demonstrated.24 The code is determined from the fluorescence intensity of each particle, read using a conventional fluorescence activated flow-cytometer (FACS). A typical statistical analysis of particle fluorescence intensity is presented in the histogram in Fig. 3, demonstrating good separation between six different fluorescence intensities. Each set of beads within a band of fluorescent intensities has a unique code. The main issue with this technology is maintaining a very low coefficient of variation (CV) between sets of beads. Practically there is little scope for increased multiplexing using this single-dye technology without introducing overlap in the populations.
Fig3.

(A) Fluorescence intensities from six beads containing different quantities of a fluorescent dye. The fluorescence intensity of a particular bead constitutes its identifying code (reprinted from ref. 24, copyright 2004, with permission from Elsevier). (B) Absorption spectrum (black points) and emission spectra (coloured points) of six different sized CdSe cored quantum dots. (C) Fluorescence emission from the six dots, showing the QD sizes and corresponding peak emission wavelength (B and C adapted by permission from Macmillan Publishers Ltd: Nature Materials,32 copyright 2005).
An increase in encoding capacity can be obtained by using multiple dyes in different concentration ratios: The number of unique codes available is then equal to XN− 1 (XN if a zero level of all dyes is included), where X is the number of dyes used and N the number of available concentration levels of each individual dye. Beads encoded using this method are used in commercially available bead-based assay instruments, such as Luminex Corporation's xMAP technology.25 This technology uses a proprietary method to uniquely encode each bead with a mixture of two fluorescent dyes, one with a red and one with an infrared emission spectrum. The unique emission spectrum produced by a particular ratio of the two dyes serves as the identification method. The company advertises 100 unique codes available using this method,26 and Luminex beads have successfully been used, for example, to detect 8 different cytokines,27 and 11 single-nucleotide polymorphisms (SNPs) of the gene encoding the human NAT2enzyme.28 The xMAP technology was recently approved by the US Food and Drug Administration for clinical use as part of a system to identify 12 different viruses by analysis of their genetic material.14 A green fluorescent dye is used to indicate binding of a molecule to the microparticles, so as not to interfere with the spectrum of the fluorescent code. Molecular concentration sensitivities are typically in a similar range to an ELISA.18
A similar approach uses semiconductor quantum dots rather than organic fluorophores to encode the microparticles. Encoding is provided by a combination of fluorescent wavelength and intensity, as for the xMAP technology. The quantum dots typically consist of a core of cadmium selenide (CdSe) surrounded by a shell of zinc sulfide (ZnS).29–32 The line-width of the quantum dot emission is generally narrower than organic dyes, and the peak wavelength of the emission can be fine-tuned by varying the radius of the quantum dot (Fig. 3(B) and (C)), potentially providing a large number of individual emission wavelengths for encoding. The excitation spectrum of a quantum dot is very broad29 (see Fig. 3(B), black points), so that all the different sized quantum dots can be excited with a single wavelength. This greatly simplifies the reading optics.
The quantum dots are incorporated into polymer microbeads,30,31,33 or the quantum dots themselves can be functionalized and molecules attached directly to their surface.18 Multiple quantum dots have been embedded into a polymer microparticle in a precisely defined ratio creating a larger number of unique emission spectra.30,31,33 One example is the embedding of quantum dots in polymer microspheres using a so-called “layer-by-layer” approach.30 Layers of quantum dots are deposited alternately with layers of polymer. By using different sized quantum dots in different layers, the relative intensities of various parts of the microsphere emission spectrum can be varied. A combination of intensity and wavelength values provides a large number of codes, for example six different colours with six intensities could give 66− 1 = 46 655 codes.33 The small size of quantum dots means that they can be used inside cells for multiplexed cell analysis.33 Using different ratios of quantum dots, a 10-plex cellular assay was demonstrated, with the authors predicting the possibility of 54− 1 = 624 codes using quantum dots with five different peak-wavelengths in four mixture ratios.30
A significant disadvantage of these purely fluorescence-based technologies is their reliance on the fluorescence intensity of various dye/quantum dot components, which may vary between beads with ostensibly the same code. In particular, the dye-based methods are subject to variability of dye content in the beads, which causes the fluorescence intensity levels to vary. In addition, using many emission wavelengths for encoding may cause interference with the fluorescent dyes used as target binding reporters. The encoding capacity of these techniques is therefore limited to a reasonably small number (∼102–103) of codes.
Multi-wavelength/spatial fluorescence encoding
Bar-coding by control of wavelength and spatial position of a fluorescent dye in a particle has been achieved using particles manufactured from multiple sections of aluminosilicate glass, doped with different rare-earth metal ions.34 The barcodes were manufactured using a ribbon-fibre drawing method. To begin with, square 25 × 25 cm glass blocks were prepared, doped with RE2O3 oxides of the rare-earth elements RE, (where RE is either Dy (dysprosium), Tm (thulium), Tb (terbium) or Ce (cerium)). These particular rare-earths were chosen due to their efficient visible emissions in the aluminosilicate matrix, their overlapping absorption spectra (for excitation purposes), and their non-interference with typical organic fluorescent markers used to indicate binding in a biological assay. Once the glass blocks were cast, they were drawn into 3.5 × 3.5 cm glass canes and multiple canes doped with different glass were assembled in an order that defined a code. The cane assembly was fused in a graphite press at 900 °C, and the whole fused assembly drawn into a ribbon fibre 20 μm thick and 100 μm wide. The ribbon fibre was then cut into 20 μm sections using femtosecond laser pulses of wavelength 800 nm and average power 100 mW.
A false-colour fluorescence image of a selection of the resulting barcodes is shown in Fig. 4(A), together with the fluorescence spectra of each possible barcode element in Fig. 4(B). The number of possible codes using this technique, for a barcode with N elements and C colours, is given by (CN + CN/2)/2 when N is even and (CN + C[N+1]/2)/2 when N is odd. These numbers arise from the number of possible combinations of colours in all positions, taking account of the fact that symmetrical barcodes can be read from either end, as there are no orientation indicators for reading. Using the six positions and four different rare-earth elements shown, the number of non-degenerate combinations (and hence the number of possible unique codes) is (46 + 43)/2 = 2080. The authors also fabricated glasses doped with mixtures of two rare-earth elements; the emission spectrum of the Tm + Dy combination is included in Fig. 4(B). Such two element combinations increase the colour palette to nine and hence the number of codes 265 000. By extending the colour palette to include triple element combinations, the authors claim that >106 codes would be theoretically achievable using this technique. The applicability of these glass micro-barcodes to bead-based assays was shown by the successful demonstration of a 2-plex DNA assay.
Fig4.
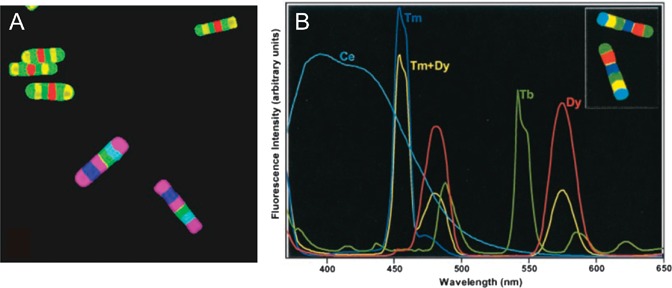
(A) Fluorescence false-colour images of two types of rare-earth doped glass encoded microparticles. (B) Emission spectra of each type of element used to make up the various barcodes (adapted with permission from ref. 34, copyright © 2003, The National Academy of Sciences).
Although the capacity for a large number of codes was demonstrated with this technique, a significant disadvantage is the complex nature of the manufacturing process. A separate fibre ribbon has to be manufactured for each unique code, resulting in a time consuming manufacturing process for the large number of codes required for highly multiplexed assays. The choice of wavelength bands used for the encoding colour palette is also limited by the requirement to keep some spectral windows free for fluorescent target-binding reporters, which could be a problem when extending the technique to the quoted encoding capacities of the order of 106 codes.
Molecular codes: fluorescent DNA and RNA
Recently, a number of technologies have been reported which use DNA and RNA strings (with fluorescent dyes), to act both as an identifying code and binding reporter. The technology developed by Liet al.35 uses Y-shaped DNA strands, two ends of which are labelled with two different fluorescent dyes, which are ligated to form structures containing variable ratios of fluorescent dyes (termed ‘fluorescent DNA nanobarcodes’).
The practical applicability of the fluorescent DNA nanobarcodes was demonstrated in the multiplexed detection of pathogenic DNA. An outline of the procedure is shown in Fig. 5. Biotinylated probeoligonucleotides complementary to the pathogenic DNA sequences of interest were bound to avidin-coated polystyrene beads. The target pathogenic DNA strands were then reacted with a mixture of beads coated with different probe sequences. Fluorescent nanobarcodes attached to oligonucleotides complementary to part of each pathogenic DNA sequence are then hybridised to the target sequences attached to the bead. Each bead to which a target is bound now has a particular combination of fluorescent dyes attached, the fluorescence spectrum of which indicates the DNA sequence on its surface. The assay demonstrated was a 4-plex assay for the detection ofDNA sequences from the pathogenic organisms B. anthracis, Francisella tularensis, Ebola virus and SARS coronavirus. The beads were successfully decoded using two-colour flow-cytometry.
Fig5.

Schematic of the procedure for immobilization of probeoligonucleotides to polystyrene beads, followed by hybridization to target DNA and nanobarcode reporter probes (reprinted by permission from Macmillan Publishers Ltd: Nature Biotechnology,35 copyright 2005).
The encoding capacity of this encoding technique, as for the Luminex beads, depends on the number of dyes used and the number of possible ratios of these dyes. The number of possible dye ratios is limited by the number of Y-DNA branches that can be incorporated into one nanobarcode. Using three different dyes, the authors quote approximately 300 possible unique codes, comparable to other fluorescent-dye based methods.
NanoString Technologies Inc. reported a similar encoding technology based on strings of RNA sequences labelled with fluorescent dyes.36 This technology works by attaching a single-strand of DNA to the target molecule. Hybridised to this DNA strand are a number of segments of RNA, each with a fluorescent dye attached. The combination of the emission spectra of the dyes attached to each RNA segment, together with each dye's position along the strand constitutes the code. The principle was demonstrated for an mRNA expression assay.36 The mRNA strands under investigation are bound to a biotinylated capture probe, and the fluorescent RNA-encoded reporter probes complementary to mRNA sequences of interest are added, and bind to the corresponding complementary mRNA (see Fig. 6(A)). The biotinylated capture probes are attached to a streptavidin coated slide (Fig. 6(B)), and an electric field applied to stretch out the reporter probes along a pre-defined direction for reading. Biotinylated oligonucleotides are added which are complementary to the repeats at the 5′ end of the reporter probes, and thus bind, allowing the 5′ end of the reporter probes to bind to the surface of the streptavidin coated slide. This locks the reporter probes in position after the electric field is turned off. The slides are removed and examined in a fluorescence microscope. Microscope images of the fluorescent reporters (Fig. 6(C)) are analysed for the position and spectrum of each fluorescent segment by scanning along the alignment direction, thus decoding each reporter probe. The demonstrated limit of detection was in the range 0.1–0.5 fM.
Fig6.

Process for binding and readout of NanoString barcodes. (A) Capture probes and reporter probes are reacted with a sample and bind to complementary RNA strands. (B) The biotinylated capture probes are immobilized on a streptavidin coated slide. The reporter probes are all aligned in the same direction by an electric field, and fixed to the slide via short biotinylated RNA strands. (C) Fluorescence microscope images are analyzed along the alignment direction to readout the codes (adapted by permission from Macmillan Publishing Ltd: Nature Biotechnology,36 copyright 2008).
The number of fluorescent segments that can be resolved depends on their size. The minimum segment length is determined by the resolution of the optical system used to read the code. The code segments used in the demonstrated mRNA study were 900 bases long; 7 segments were used to make a complete code, with a choice of four different fluorescent dyes. The encoding capacity of the technology in this form is therefore 47 = 16 384 codes; the technology has a relatively large encoding capacity, approaching that of the graphical bead-based methods which are considered in subsequent sections of this review. The gene expression assay was successfully demonstrated using 524 unique codes (a 524-plex assay).
A significant advantage of the DNA/RNA-based methods over other fluorescence-based methods is that the code is also the binding reporter, removing any incompatibility problems between binding reporter fluorescence and code fluorescence. A significant disadvantage, however, would appear to be the chemical complexity of preparing the codes and the various other components of the assay, especially in the case of the colour-coded RNAprobes.
Raman spectrum encoding
A number of chemical encoding technologies have been developed based on Raman spectroscopy. The first of these used aggregates of silver nanoparticles with organic molecules chosen for their specific Raman spectra,37 termed ‘Composite Organic–Inorganic Nanoparticles (COINs)’. The particles are manufactured by placing seed silver nanoparticles in a solution of silver nitrate and a Raman label, Fig. 7(A). The silver particles grow in the solution and aggregate with the Raman labels to form the COINs, as shown in the TEM images of Fig. 7(B). Raman spectroscopy of the COINs reveals particular dominant peaks, whose Raman shift depends on the particular organic Raman label used (Fig. 7(C)). The silver nanoparticles enhance these peaks via Surfaced-Enhanced Raman Scattering (SERS), a phenomenon where Raman signals from molecules in close proximity to rough metal surfaces are increased. Inclusion of more than one organic Raman label results in a larger number of dominant peaks, allowing more codes to be created (Fig. 7(D)). The authors claim that with 50 Raman labels, and Raman-shift peaks separated by 15 cm−1, millions of different codes are possible. Antibodies were conjugated to the COINs by adsorption, and a 2-plex sandwich immunoassay detecting IL-2 and IL-8 was demonstrated. The demonstrated sensitivity was ∼1 pg ml−1, similar to competing technologies. While large numbers of codes are claimed using this technique, it appears that the spectra of the COINs become more complex (i.e. contain more unwanted features) as more dyes are used and depend very strongly on the concentration of the labels. It is therefore unlikely that very large numbers of codes (∼106) could be produced whilst maintaining robust error free readout.
Fig7.
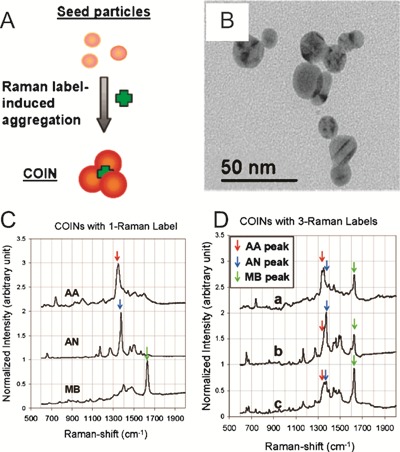
(A) Aggregation of silver seed nanoparticles and Raman labels in silver nitrate produce composite organic–inorganic nanoparticles shown in the TEM in (B). (C) Raman spectra of the COINs, showing particular dominant peaks, whose Raman shift depends on the particular organic Raman label used. The dominant peak position constitutes the code identifying the COINs. (D) Use of more than one Raman label produces spectra with multiple peaks, the combinations of which allow for increased numbers of codes (adapted with permission from ref. 37, copyright 2005, American Chemical Society).
A method has also been proposed that uses polystyrene beads, in which the styrene monomer is modified with a range of additional chemical groups in order to create unique features in the Raman spectra of the beads.38 Each particular type of styrene monomer is given a binary digit (Fig. 8(A)), and the presence or absence of this monomer results in the assignment of ‘1’ or ‘0’, respectively, to that particular digit. With the 6 different monomers used, up to 26 = 64 beads can be uniquely encoded. To demonstrate the reading of the Raman-encoded beads, beads with 12 unique codes among them were randomly inserted into 100 μm wells patterned by reactive-ion etching into a siliconcarrier. The beads were inserted from a suspension in ethanol, using mechanical assistance to force beads into the wells. An area of 48 beads was scanned using 110 μm steps over the carrier (see Fig. 8(B)) taking a Raman spectrum at each step. Each bead was uniquely associated with a Raman spectrum, as shown by the colour coding associating the beads in Fig. 8(C) with the spectra in Fig. 8(D). A deconvolution algorithm identifies which styrene monomers' signature peaks are present in each spectrum, by comparison against a set of pre-recorded spectra from each type of polystyrene,39 allowing a binary code to be associated with each bead. The deconvolution process took 15 min for the 48 beads, giving a readout rate of approximately three beads per minute. Attachment of peptides to the beads has been demonstrated,39 showing no appreciable effect on Raman spectra, allowing the codes to be read after attachment of molecules the surface of the beads. As for the COIN particles, it is anticipated that intensity variations will cause problems with robust identification of large numbers of codes.
Fig8.
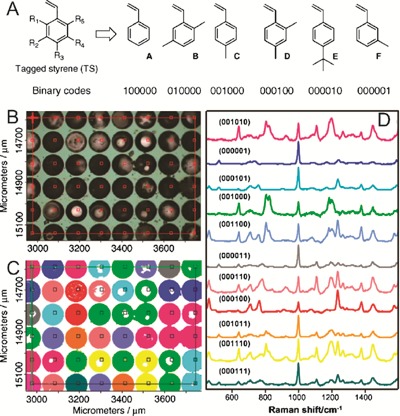
Polystyrene beads fabricated using combinations of different styrene monomers (A) are arranged in wells on a substrate (B), and scanned in steps, taking a Raman spectrum at each step. Each bead (C) is then associated with a particular spectrum (D), as indicated by the corresponding colour codes. Each Raman spectrum constitutes a code identifying a bead (reprinted from ref. 38, copyright 2007, with permission from Elsevier).
A third Raman based method uses a single dye with a characteristic Raman spectrum. The position of the dye along a micron-length wire defines the code.40 Wires are manufactured using a process called ‘on-wire lithography’:41nanowires of nickel with pairs of gold segments (see Fig. 9(A), step 1) are synthesised by electroplating. After removal of the electroplating templates, the wires are deposited randomly on a surface and covered with evaporated silica. After freeing from the surface by sonication, the nickel is etched away leaving arrays of gold nanodisk pairs held together by a silica ‘backbone’ (Fig. 9(A), step 2). Raman-active dyes are then attached to the gold (step 3),40 and the arrays scanned by confocal Raman microscopy, measuring the spectrum between 139 and 2789 cm−1 at each point and integrating the Raman intensity over the whole spectrum to create the pixel intensity. The Raman signal is increased between the gold disk pairs due to the higher dye concentration in these regions, as compared to other areas of the array, resulting in confocal Raman images of the type seen in Fig. 9(B) for the code 11111. The signal between the disk pairs is further enhanced due to surface-enhanced Raman scattering. Disk pairs can be removed from the array to create 0 digits, allowing any 5-bit binary strings to be encoded with this method, as seen for some examples in Fig. 9(C). The encoding capacity of these nano-disk arrays is then 25 = 32 codes. Using this technology, DNA assays have been demonstrated by attaching probeoligonucleotide sequences to the gold disks in place of the simple Raman labels. The probe sequences are then bound to Raman-labelled target DNA sequences at pM concentrations, which produces a visible code. The code thus acts as both binding reporter (via the target Raman labels) and target identifier. The encoding capacity can potentially be increased by using more disks in the array, and using a number of different Raman-active dyes, identified by filtering the Raman images according to the unique Raman properties of each dye. This technique is likely to be reasonably robust, however it is not clear how very large numbers of codes could be manufactured. The complex fabrication process also reduces the throughput for the manufacture of large number of rods, compared to many other encoding methods.
Fig9.
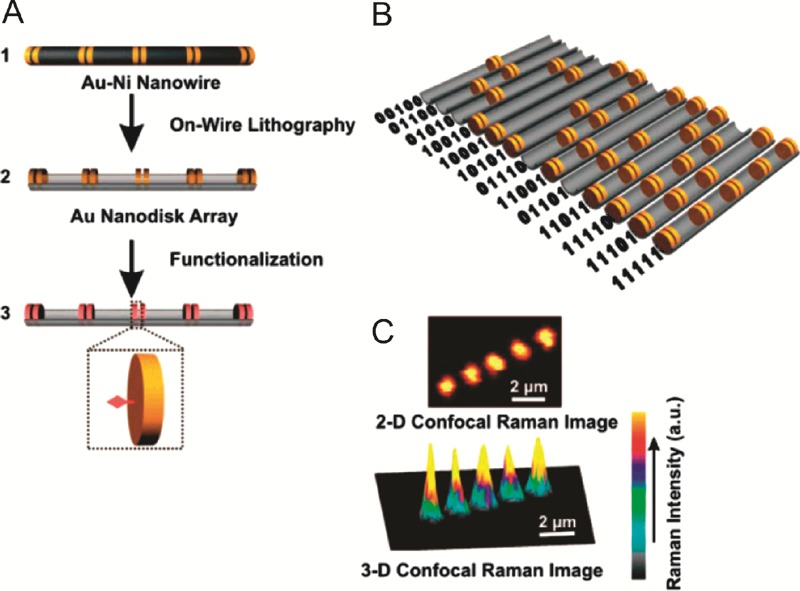
(A) Gold nanodisk arrays are created by electroplating of gold/nickel wires, followed by etching of the nickel to leave the nanodisk arrays. The arrays are functionalized with Raman probes. (B) Binary codes identifying the array are made by arranging sequences of ‘0’ (nanodisk absent) and ‘1’ (nanodisk present). (C) The binary code is read by observing the arrays using confocal Raman spectroscopy (adapted with permission from ref. 40, copyright 2007, American Chemical Society).
Photonic crystal beads
Alternative spectral encoding methods have been proposed, based around structuring beads to produce a unique reflection spectrum42,43 (rather than the emission spectrum of fluorescent dyes). In the first method,42 porous silicon particles were produced by galvanostatic anodic etching of silicon wafers. This etching method involves placing the wafer in an etch cell containing a solution of 48% HF in ethanol, such that it forms the anode of an electric circuit, with a cathode also immersed in the etch solution. A constant current applied to the cell etches the wafer, forming porous silicon. To form encoded particles, a sinusoidally varying current is applied to the etch cell, resulting in particles with a sinusoidal porosity variation. This porosity variation acts as a photonic bandgap material, resulting in a sharp reflectance peak at a certain wavelength, determined by the periodicity of the porosity variation. The period of the porosity variation is determined by the frequency of the current variation in the etch cell. Thus particles with different reflectance peaks can be produced (Fig. 10(A)). The peak reflectance occurs at a certain wavelength, this is used as the code to identify the particle. Multiple current frequencies can be applied to each particle, producing multiple reflectance bands (see Fig. 10(B)), which further extends the number of unique codes available. With the 15 reflectance bands demonstrated, including particles with three periodicities as demonstrated, approximately 500 unique codes could be obtained.
Fig10.

(A) Reflectance spectra of periodically porous silicon photonic crystal microparticles, with different periodicities of porosity variation. (B) In addition to particles with single periodic porosity variations (bottom spectrum), particles with multiple periodicities can be fabricated, allowing for a larger number of codes (reprinted by permission from Macmillan Publishers Ltd: Nature Materials,42 copyright 2002).
A related method,43 uses inverse opaline silica beads patterned with holes moulded from polystyrene sphere templates. The beads are formed by droplet crystallization of a suspension of silicananoparticles and polystyrene spheres in silicone oil. The polystyrene spheres are dissolved, leaving ordered depressions of the order of 200 nm in the surface of a silica bead of around 10 μm diameter. The depressions form a photonic crystal, giving the bead a reflection spectrum with a wavelength peak in a certain bandgap region. The position of this peak constitutes the identifying code, which can be varied by changing the size of the polystyrene spheres used to mould the depressions. Typical reflection spectra for seven different beads are shown in Fig. 11(A). A unique feature of this method over other encoding methods is that the presence of molecules on the bead surface changes the bandgap position, producing a shift in the spectral peak. This method can therefore be used for label-free identification of molecular binding. This was type of assay was demonstrated by attachment of three human tumor markers, antigens CA125, CA19-9 and CEA, to beads with three different reflection spectra. An assay was performed in which the beads were reacted with antibodies to each of the three antigens. The spectra with antigens attached and the shifted spectra after antibody binding are shown in Fig. 11(B). It can be seen that reliable detection is obtained for two of the bead types, although the bead with the shortest wavelength bandgap proves incapable of binding detection. The lowest detectable concentration for CA19-9 was 100 ng ml−1. The demonstrated encoding capacity of six shows this technology to useful only for very low levels of multiplexing, but could find applications as a label-free immunoassay.
Fig11.

(A) Reflection spectra from inverse-opaline photonic beads with seven different pore sizes. (B) Spectral shifts induced in two kinds of beads due to antigen binding, showing label-free binding detection functionality. The third bead has not exhibited this shift (reproduced with permission from ref. 43, copyright Wiley-VCH Verlag GmbH & Co. KGaA).
Goldnanorods
Goldnanorods have been used as supports for molecular immobilization and provide a means of spectral encoding.44 Colloidal suspensions of the nanorods have light absorption bands associated with plasmon resonances along the length and width of the rod; the position of the main absorption band of the suspension varies with the ratio of the length to width (the ‘aspect ratio’) of the rod. Typical absorption spectra for suspensions of rods with various aspect ratios are shown in Fig. 12(A). The position of the main absorption peak acts as the code identifying each type of rod. Mixtures of rod types generate spectra such as those shown in Fig. 12(B), with a peak for each rod type. Molecular binding to the rods causes a red-shift of the absorption peaks, again enabling label-free binding detection. An assay was demonstrated by attachment of three human IgG Fab fragments to rods with three different aspect ratios, followed by mixing with goat anti-human antibodies corresponding to one of the IgG Fabs. The corresponding spectral shift of the peak corresponding to nanorods with one aspect ratio is shown in Fig. 12(B). Similar shifts of the other two principle peaks are produced by addition of antibodies to the other two IgGs. The target concentration sensitivity was shown to be 14 ng ml−1.
Fig12.

(A) Absorbance spectra of suspensions of goldnanorods with various aspect ratios. (B) Absorption spectrum of a suspension containing rods of three different aspect ratio, demonstrating the shift upon detection of a target complementary to probes on one of the rod types (adapted with permission from ref. 44, copyright 2007, American Chemical Society).
The large width of the absorption bands means that, much like the photonic crystal beads, only very few targets can be analysed in a multiplexed fashion, in this case a maximum of four different targets.
Patterned metallic nanowires
Codes have been made from nanowires, manufactured from alternating sections of different metals, where the reflectivity, position and length of the metal sections combine to create codes.45–47 The nanowires are manufactured,46 by electroplating alternating metal layers into an alumina template, a commercially available aluminamembrane with 200 nm diameter pores. Alternating layers of gold and silver were electroplated to the required lengths, producing the code. The nanowires were removed from the template by dissolving the alumina in 3 M sodium hydroxide.
A mixture of wires with different codes is shown in Fig. 13(A). The nanowires are typically 200 nm in diameter and approximately 4.5 μm long. The code on a wire is binary with ‘0’ bits represented by gold stripes of a fixed length and ‘1’ bits by silver stripes of a fixed length.45 The length of a stripe of a particular metal indicates how many of the same bits appear in sequence (e.g.‘11’ will appear as a silver stripe double the length of ‘1’). Readout of the code is accomplished by illuminating the nanowires with light of a wavelength for which one metal has a high reflectivity whilst the other has a low reflectivity. The code is automatically read from microscope images, such as that shown in Fig. 13(A), by analysing the image brightness along the wire's length.
Fig13.

(A) Optical micrograph of encoded metallic nanowires after release from their aluminaelectroplating template (reprinted with permission from ref. 45, copyright AAAS). (B) Optical micrograph of a 3DMS ImageCode. The L-shaped pattern of holes indicate the orientation, and the central holes constitute a binary code. (C) Optical micrograph of a 3DMS FloCode. The pattern of ridges along the edge is a binary code, read by recording the fluctuations of scattered laser light as the particle flows through a laser beam (B and C reprinted with permission from ref. 49. The publisher for this copyrighted material is Mary Ann Liebert, Inc. publishers). (D) Optical micrograph of encoded aluminium rods manufactured by Pronostics Ltd, as used in their UltraPlex system (reproduced courtesy of Pronostics Ltd).
The segment length used for each binary digit shown in Fig. 13(A) was 640 nm, providing seven binary digits for encoding, giving an encoding capacity of 80 unique codes (roughly half that expected from binary considerations, as the particles can be read from either end). The minimum segment length obtainable corresponds to the Rayleigh resolution limit of the microscope system used to read the codes. The authors claim that for reliable readout, the section length needs to be well above this diffraction limit, and give an example of a 6.5 μm wire with 500 nm segments, providing 13 binary digits for encoding, or 4160 unique codes. The nanowires have been functionalized for biochemistry and used to demonstrate a 2-plex immunoassay,45 and a 15-plex SNP assay48 with a sensitivity of 5 nM. These nanowires, like the structurally patterned microparticles discussed in the next section, have the major advantage that the encoding mechanism does not interfere or compete with the fluorescent signal used for reporting molecular binding during an assay.
Structurally patterned microparticles—occlusion codes
One of the earliest forms of encoding particles was based on microstructuring different materials, creating patterns which constitute a code (often binary). The earliest such technology, developed by 3D Molecular Sciences Ltd. (3DMS, Cambridge, UK), involves the patterning of the epoxy photo-polymer SU8.49 They developed two types of code; both defined and patterned using photolithographic selective cross-linking of the SU8. The first type, termed ImageCodes, are designed to be read on a flat plate and are relatively large in size (100 × 100 μm). They are patterned with square arrays of holes, representing binary digits making up a code, Fig. 13(B). The L-shaped pattern of holes around the edge is used to identify the orientation of the particles, and the rest of the holes constitute the code for particle identification. The particles shown in Fig. 13(B) have an encoding capacity of 235≈ 1010 codes. The second type is designed to be read in a more high-throughput, flow-based system. An example is shown in Fig. 13(C). The codes have different patterns of ridges along both edges, constituting a binary code. During reading, the particles flow past a laser beam, and the different ridges modulate the scattered light, which is monitored by a detector. In principle this provides high-speed, automated reading of the code on the particle but this was never demonstrated. The particles shown in Fig. 13(C) have an encoding capacity of 210 = 1024 codes. The attachment of DNA to the flow codes was demonstrated, proving their compatibility with biochemical assays.49
A similar technology is UltraPlex, developed by SmartBead Technologies Ltd. (now Pronostics Ltd.), a spin-out company of the University of Cambridge, UK.22,50 The codes are manufactured from aluminium rods patterned with holes, defined and patterned by photolithography and dry etching. An example of such a code is shown in Fig. 13(D). The company offers a fully automated reaction and reading system for immunoassays, and around 100 000 codes are possible using this technology.
A third encoding technology that uses holes patterned into particles has been demonstrated, where SU8 moulds were used to produce nickel patterned particles51 A layer of SU8 is spun onto glass (coated with a copper sacrificial layer), and the SU8 photolithographically patterned to form square wells (as moulds for the particles) with SU8 pillars to mould the code bits. Nickel and PTFE were electroplated in alternating layers of approximately 6 μm thickness, followed by a chrome adhesion layer and then a gold coating. The SU8 is removed and the finished particles lifted off by etching the copper sacrificial layer. The resulting particles are of dimensions 100 × 200 μm, with an 80 × 50 μm array of up to eight code spots, which are either present (‘1’) or absent (‘0’), creating a binary code, see Fig. 14(A). This particular scheme can encode 28 = 256 different microparticles, although increasing the number of bits would be possible, increasing the encoding capacity codes. The gold layer is used to provide a surface for chemical attachment (via thiols) and the nickel layer supplies mechanical stability. A significant disadvantage of this technique is the complex multi-step manufacturing process, which makes production of very large numbers of particles expensive and time consuming.
Fig14.

(A) Particles moulded in nickel/PTFE/gold using SU8, encoded using patterns of holes depicting a binary code (adapted with permission from ref. 51, copyright 2007, American Chemical Society). (B) Particles with three different codes are coated with IgA, IgG or IgM and a particle with fourth code remain uncoated and are used as a control. (C) A fluorescence image of the particles after reaction reveals little binding of the target analyte to the control particles (B and C reprinted with permission from ref. 52, copyright 2003, Elsevier).
The particles have been successfully used in a 3-plex immunoassay;52Fig. 14(B) and (C). A suspension of particles (with three different codes) have one of three different antibody types (IgA, IgG or IgM) attached to the surface. A control particle with a fourth code has no antibody attached. A fluorescence microscope image of the codes after incubation with antigens corresponding to each antibody is shown in Fig. 14(C). The lack of fluorescence on the control particles shows that little non-specific binding of the targets occurs. A 3-plex oligonucleotide hybridisation assay was also demonstrated.53
Pregibon et al.54 recently demonstrated an encoding technology very similar to the 3DMS ImageCodes. However, a significant difference in their work was the demonstration of encoding, analyte attachment (to the particles) and reading of the codes all within a microfluidic system. The method of manufacturing the encoded microparticles is shown in Fig. 15(A); two streams of the monomers of poly(ethylene glycol) (PEG) flow together down a microfluidic channel, remaining separate due to laminar inside microchannels. One stream contains fluorescently labelled monomers, that form the code region, while the other contains monomers and a biological probe (for example an oligonucleotide) for use in an assay. The particles are defined and patterned using UV light passed through a mask and a reduction lens; regions of high UV intensity polymerize the monomers forming a solid particle from which the un-crosslinked monomer is subsequently rinsed, leaving holes signifying binary ‘1’ digits. The particles, shown in Fig. 15(B), feature a coding region on one half that consists of two orientation-identification elements and 20 digits of a binary code, again present (‘1’) or absent (‘0’) depending on the desired code. The example presented here has the capacity for 220≈ 106 unique codes. The region surrounding the holes representing the code digits is fluorescent, increasing the signal-to-noise ratio and allowing the code to be read simultaneously with the analysis of target attachment. The other half of the particle has the biological probe attached, for use in bead based assays using these particles. The disadvantages of this method are the larger concentrations of probe molecules required to obtain a loading level similar to most other bead-based technologies (around 50 times larger), and the fact that the technology may be problematic for protein assays, because of the potential for UV-induced denaturation of the probes during particle formation.
Fig15.
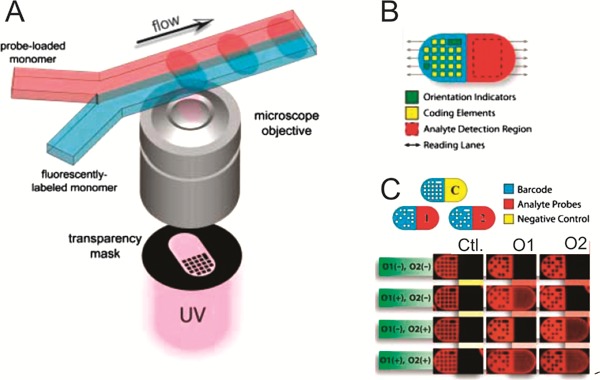
(A) Particles manufactured in-flow from a PEG photopolymer. Two flow streams contain fluorescent labeled PEG for the code section of the particle and PEG with probe attached for the analyte section of the particle. (B) The resulting particles contain a code featuring orientation digits and the code digits themselves, and an analyte region, both of which are read along the lines defined by the arrows. (C) Three types of coded particle, allow the binding of different oligonucleotides O1 and O2 to be compared to a control region Ctl (reprinted with permission from ref. 54, copyright AAAS).
The particles were used for DNA hybridization assays by fabricating three types of particles with different codes; one type with oligonucleotide O1, one type with oligonucleotides O2 and one type with naked PEG containing no oligonucleotide (control), see Fig. 15(C). All three types of particle were reacted with a solution containing no oligonucleotides (O1(−), O2(−)), a solution containing the fluorescently-labelled oligonucleotide to O1 (O1(+), O2(−)), a solution containing the fluorescently-labelled complementary to O2 (O1(+), O2(−)), and a solution containing both fluorescently-labelled complementaries (O1(+), O2(+)). The results are shown in the bottom part of Fig. 15(C): The control ‘Ctl’ shows no increase in fluorescence in the molecular-binding section of the particle, whilst the particles containing O1 and O2 show an increase in fluorescence in the solutions containing their respective complementary oligonucleotides, indicate binding of the complementary oligonucleotides to the particles. This demonstrates the use of the particles in bead based DNA-hybridisation assays. The authors also demonstrate that more than two flow streams can be used to create particles with multiple probes in separate regions.
Two further encoding technologies have recently been developed. They are conceptually similar, and rely on the readout of the reflectance of optical55 or radio-frequency (RF)56 radiation in a flow device. In the first type,55 microbars of silicon 1000 × 500 × 100 μm are defined photolithographically and patterned with wet-etched aluminium stripes to provide a code. Two examples of these microparticles are shown in Fig. 16(A). The codes are read by flowing the particles through a microfluidic system past a 633 nm laser beam focussed to a 50 μm spot. The reflected light from the laser is read by a phototransistor; an example of the signal from the detector for a single particle is shown in Fig. 16(B). The aluminium has a higher reflectivity than the silicon, so that the aluminium areas can be identified from the reflectance readout. The code has 10 bits, giving 210 = 1024 unique codes. The microbars were successfully decoded at flow rates of 10 cm s−1.
Fig16.

(A) Silicon microbars encoded with patterned aluminium. (B) Reflectance traces of 633 nm laser light recorded from flowing silicon microparticles allow successful identification in flow speeds up to 10 cm s−1 (A and B reprinted from ref. 55, copyright 2007, with permission from Elsevier). (C) An SU8 microbar encoded with patterned aluminium. (D) RF reflectance traces allow identification of SU8 bars in flow at similar speeds to that recorded for the silicon bars (C and D reproduced from ref. 56, copyright 2007, RSC).
The second type of flow-read reflectance codes consists of SU8 bars (100 × 20 × 0.3 μm), with embedded aluminium strips, again defined and patterned photolithographically.56 An example of such a code is shown in Fig. 16(C). Particles flow (in a microfluidic system) past a set of radio frequency (RF) generating/detecting electrodes. The reflectance of the RF field is measured, and the aluminium has a greater reflectance compared to the SU8. The aluminium areas are therefore identified from the RF reflectance readout. Typical readouts for the codes ‘1100110011’ and ‘0110110110’ are shown in Fig. 16(D). Such a 10-bit code gives an encoding capacity of 210 = 1024 unique codes, with the authors claiming that decreasing the bit-width by a factor of two is possible giving 220≈106 unique codes. Codes were read at flow velocities of 10 cm s−1 and a single assay in which a fluorescent target antibody was bound to a biotin–strepavidin immobilized probeantibody, has been demonstrated on the particles.
Both of these reflectance based technologies allow for very large encoding capacities, and because of the high contrast ratio between materials (differing reflectivity) the signal-to-noise ratio is very high. However, fabrication is non-trivial; the multi-layer construction of the particles is complex, when compared with majority of other encoding technologies based on structured microparticles.
Another particle-based assay method has recently been demonstrated, which makes us of label-free binding detection viasurface plasmon resonance (SPR), combined with graphically encoded microparticles.57SPR involves the excitation of surface charge oscillations (surface plasmons) on a metal by incident light. To do this the momentum of the light must be made to match that of the surface plasmons using in this case, metal gratings for which light incident at a certain angle to the metal surface normal (the resonance angle) has the correct momentum to excite surface plasmons. The particles are manufactured as shown in Fig. 17(A): First a silicon wafer is etched to form a grating, followed by a second, larger scale etching to form the particle outlines. A PDMS replica is then moulded from the Si, into which a layer of SiO2 is deposited, followed by a thin layer of Cr and finally a gold layer, to form the SPR sensing layer. The particles are released by dissolving the PDMS; an example particle is shown in Fig. 17(B). The triangular notch at the particle's edge is an orientation marker, and square notches represent ‘1’ digits of a binary number. In this case, the number can have 1 digit per side, giving 7 bits and an encoding capacity of 27 = 128 codes. It is clear that at least twice as many digits could be incorporated on the particle, allowing for more than 104 codes. Molecular binding is measured by focussing two laser beams onto the particles, forming a small range of incident light angles close to the surface plasmon resonance angle (Fig. 17(C)), at both positive and negative angles to the grating normal. The reflected light from the laser beam forms an image containing two dark bands at the two resonance angles (Fig. 17(D)): The relative position of these indicates the refractive index of the material above the gold layer, which changes upon molecular binding, thus shifting these dark bands and providing a binding indicator. Binding of 10 μg ml−1 human IgG to protein A immobilized on the particles was demonstrated, and successfully detected by shift of the SPR band. The experiment was, however, conducted using a flow cell with the particles fixed to the bottom throughout the target binding in order to obtain reference SPR band positions with no target bound, and so was not a true suspension assay. Again a disadvantage of this method is the complex particle manufacturing method, however the method demonstrates the potential for label-free highly multiplexed assays.
Fig17.

(A) Process for manufacturing grating-based SPR encoded microparticles (‘graticles’). (B) An example microparticle, showing the orientation marker (triangular notch) and code marks (square notches). (C) Method for readout of the SPR bands to detect molecular binding. (D) SPR image showing the dark bands due to the plasmon absorption, the position of which indicates whether molecules have bound to the particle surface (adapted with permission from ref. 57, copyright 2007, American Chemical Society).
A significant advantage of all these graphical methods of encoding compared with the spectroscopic methods is that the codes are binary. This means that some of the bits can be reserved for error correction, for example parity checking or other error detection methods such as Hamming coding. Hamming coding is a mathematical operation by which a binary string is converted to a longer string containing the original code, plus extra error check digits. This longer code can be converted by a second mathematical operation on reading, to provide information about any errors (incorrect digits) in the code part of the string. This means that errors in the code reading can be identified and either corrected (for up to two errors) or the code rejected (for up to three errors). This makes these encoding methods very robust and allows a degree of tolerance in the reading and manufacturing process, with respect to code distortion, damage or contamination. Furthermore, the capacity of these encoding methods is not restricted by competition with bandwidth from the fluorescent assay binding reporters, unlike the fluorescence-based encoding methods.
Photobleached fluorescent microspheres
A microbead encoding method in which microspheres are patterned without structuring them, involves the writing of patterns by fluorescence photobleaching.58–60 In these papers, 45 μm diameter polystyrene spheres were doped with a specialized fast bleaching green fluorescent dye (N-(7-nitrobenz-2-oxa-1,3-diazol-4-yl)diethyl amine). A code was written by selective bleaching of the dye, using light of wavelength 488 nm from a 30 mW argon-ion laser.48 The laser was deflected by an acousto-optic modulator, raster-scanned over the bead and writing the pattern by selective photobleaching. The code was “read” by illuminating the sphere with lower intensity light of the same wavelength (power level of 30 μW), exciting fluorescence in the non-bleached parts of the sphere, leaving the bleached regions dark. Examples of codes written using this method are shown in Fig. 18. The codes are dark bars whose width and intensity constitute the code elements: partial photo-bleaching can be used to adjust the fluorescence intensity in the code bars. An example of a two-level code (bleached/unbleached) is shown in Fig. 18(A), and a three-level code (bleached/partially bleached/unbleached) is shown in 18(B). Since the codes are written by scanning the laser beam over the sphere, the write time can be minimized by writing only in one dimension, creating what the authors term ‘dot codes’ (Fig. 18(C)). A cross section through this dot code is shown in Fig. 18(D) showing how three bleaching intensity levels can be distinguished. The authors use a rather complex encoding method, based around the possible combinations of width, bleaching intensity and position of the dark bars. Using two intensities and three bar widths, the authors claim an encoding capacity of 4 × 10⁶ unique codes, increasing to 108 with the use of three intensity levels, although it is not clear how these numbers were obtained. Using a binary scheme based on bars of the quoted minimum width (1 μm) and the quoted encoding space (30 μm), would yield 230 = 109 codes, three orders of magnitude higher than the capacity obtained using their scheme.
Fig18.

Codes written into fluorescent microspheres by photobleaching. Codes are written as bars of different width, and may be of two (A) or three (B) intensity levels. Write time is minimized by creating ‘dot codes’ (C), and a cross section through such a dot code (D) indicates the ability to distinguish the three fluorescence levels (adapted by permission from Macmillan Publishers Ltd: Nature Materials,60 copyright 2003).
A significant problem with this technology is that the code appears in a totally random orientation during reading. This problem was solved by incorporating magnetic particles into the particles using a ‘layer-by-layer’ approach.58,59 A layer of poly(allylamine hydrochloride) (PAH) is first deposited on the microspheres, followed by a layer of ferromagnetic chromium dioxide (CrO2) nanoparticles (smaller than 450 nm diameter). Another layer of PAH is deposited to trap the nanoparticles on the surface, followed by more layers for molecular binding. During code writing, a magnetic field is applied to the particles, permanently magnetizing the CrO2nanoparticles. For reading, a weak magnetic field turns the spheres into the correct orientation. Using the layer-by-layer coatings, the encoded microspheres were used in 3-plex immunoassays,59 using a red fluorescent reporter dye that did not interfere with the code fluorescence. The limit of detection was demonstrated to be 16 pg ml−1 for a TNF-α sandwich assay. A disadvantage of this encoding process is the low contrast between bleached and non-bleached parts of the sphere, particularly after coating with magnetic particles, which may cause problems with the robustness of highly multiplexed assays.
Diffractive and holographic encoding
One issue with occlusion-based encoding is that the encoding capacity is limited by the size of the spots and the area of the particle. For example, photolithography is limited to forming ∼5 μm holes in thick (mechanically stable) photoresist, in order to retain good definition and hence good visibility for readout. This leads to very high coding capacities on a ∼100 μm particle, for example 1030 codes formed from a matrix of 10 × 10 5 μm holes, spaced 5 μm apart. However, on a 20 μm particle, only 16 codes are possible. Higher encoding capacities would require smaller holes which would be harder to manufacture and read.
To increase the encoding capacity on small (∼10 μm) particles, a new method has been developed based on detecting the distribution of light diffracted by a miniature grating patterned on or into a microparticle. In the simplest implementation, the pattern on the particle is a miniature diffraction grating a few micrometres in size, where information is encoded in the pitch of the grating, a.61 When the grating is illuminated with light at wavelength λ, for example at normal incidence, a series of diffracted beams at angles α are created, according to the equation a sin α = mλ, where m is an integer known as the order of the diffracted beam. Measurement of the first-order (m = 1) diffracted beam position (with respect to the zero order) gives direct information about the pitch a. More than one grating pitch can be superimposed on a single particle to increase the encoding capacity of this technique. The encoding capacity of this technique depends on the number of diffracted beams n that fit between 0 degrees and the maximum observable diffracted angle, and the number of gratings k superimposed on the particle. The number of available codes c is given by c = n!/[(n−k)!k!]. Using this technique, we estimate that approximately 109 unique codes can theoretically be created from five superimposed gratings on a 100 μm long particle (and around 105 on a 20 μm particle).61 Two sets of gratings in mutually perpendicular directions (a two-dimensional grating) can increase this theoretical capacity to around 1021 codes on a 100 μm particle (around on 1014 on a 20 μm particle).61
A small number of codes can be manufactured by pholithographically patterning diffraction gratings onto SU8 microparticles. Methods for attaching DNA and antibodies to the SU8 particles have been developed;21,62 4-plex immunoassays and 2-plex DNA single point mutation (SNP) analyses were demonstrated using this encoding technology62 with a sensitivity of 5 nM for human IgG/anti-human IgG binding. Much larger numbers of diffractive codes can be manufactured by nano-imprinting into the surface of the particles.63 Diffraction gratings manufactured by this method are shown in the SEM images in Fig. 19(A) and (B), whilst Fig. 19(C) shows the diffraction patterns from an example set of 10 different coded particles with two superimposed gratings. One pitch remains constant, giving a diffracted beam denoted ‘E’, while the other pitch decreases moving from right to left, producing diffracted beams in positions D to N. The particular combination of two beam positions provides a code. Example diffraction patterns from a 2D grating are shown in Fig. 19(D). For a 100 μm particle the practical encoding capacity is around 103 codes for a 1D grating (around 106 codes for a two-dimensional grating) on a 100 μm particle, and around 100 codes on a 20 μm particle (around 104 for a 2D grating). This is much less than theoretically predicted and arises from manufacturing limitations, the practical limits on observable diffracted beam angle and the method used to design the superimposed gratings. However, for smaller particles (∼20 μm in size), this method has a higher encoding capacity than a typical occlusion based method. A significant advantage of this encoding method over others is the simplicity of the detection system: no microscope is required and the diffraction pattern is projected from the particle into the far field. It can be observed and read directly by a CCD/CMOS camera sensor with no intermediate optics. In addition, the code is generated from the periodicity of the structure on the particle surface, making it robust with respect to particle contamination, damage and rotation.61
Fig19.

(A) SEM image of a 2× superimposed encoded tag on an SU8 film nano-imprinted using an electroformed nickel imprint master. (B) A similar tag imprinted onto an SU8 microparticle. (C) Diffraction patterns in air created by nano-imprinted 1D SU8 tags containing two superimposed gratings. Moving from left to right shows how a progressive decrease in the pitch of one of the gratings changes the diffraction pattern. (D) Example diffraction patterns from 2D gratings. (E) An image of the reconstructed diffraction pattern from a hologram written into a 1500 × 500 × 35 μm SU8 particle. Image is contrast enhanced for clarity. (F) A cross section through the unenhanced image showing the pattern signal-to-noise ratio. (G) The Illumina VeraCode Technology in which a glass bead containing an etched hologram is illuminated with a laser beam producing a code image (copyright 2006, Illumina, Inc., reprinted with permission).
An improvement on this method uses a diffractive technique based on writing holograms to encode the particles.64 The holographic method allows a complex diffractive structure to be written into the particles, which can in principle give any arbitrary diffraction pattern upon illumination. Thus the diffracted pattern can be tailored to produce many codes by projecting many diffracted beams within a small angular range and making efficient use of the observable angular space. The pattern may also be in binary form, allowing for error correction. Additionally the potential for writing and rewriting the code on the particles after manufacture increases the flexibility of the technology. The hologram is written into a particle manufactured from SU8 doped with a photochromic diarylethene dye. Writing is performed in a standard Fourier holographic setup64 in which a signal beam patterned with a binary code is focussed onto the dye-doped SU8 and interfered with a reference beam, forming an interference pattern which is recorded into the photochromic dye. Upon illumination of the hologram with a readout beam, the binary code is reconstructed on a CMOS camera sensor surface. An example of a reconstructed code from such a hologram on a particle is shown in Fig. 19(E), together with cross-sections indicating the binary signal to noise ratio (Fig. 19(F)). The top row and leftmost column of the pattern provide a reference frame for code reading, which defines a code grid. The remainder of the pattern constitutes a binary identification code, with bright points on the code grid indicating ‘1’ bits and dark points indicating ‘0’ bits. The example shown has 9 code bits, giving 512 unique codes. Theoretically, around 1024 unique codes could be obtained on a 100 μm particle (and around 4000 codes on a 20 μm particle).64 This number is obtained by calculating the size of the focussed code pattern for a given code-spot spacing, assuming that the entire area of a CMOS sensor is covered by the code reconstructed from the hologram, and assuming a fixed focal length of 25 mm for the writing lens. It is not yet clear how possible it is to obtain these numbers in practice. The holographic method has the advantage over diffraction gratings in that no undesired features appear in the diffraction pattern. The holographic technique does not suffer the same restrictions on encoding capacity as the grating based method. The method still only requires very simple optics for reading, however each particle has to be aligned to the same orientation as during code writing. This is the same problem described for the photobleached fluorescent microspheres,58–61 and could be overcome in a similar manner, by incorporation of magnetic nanoparticles into the SU8. One major advantage of this technique is that the code is non-permanent, it can be written, erased and re-written several times depending on the photochromic dye used.65
A similar method of encoding microparticles with holograms has been commercialized by Illumina, Inc.66 The VeraCode technology makes use of pre-calculated digital holograms etched into cylindrical glass microparticles 240 μm long and 28 μm in diameter. Illumination with a red laser produces a diffraction pattern from the particle of the form shown in Fig. 19(G). This pattern represents a 15-bit binary code, where each bright stripe represents a ‘1’ bit and dark areas of equivalent size to these stripes represent ‘0’ bits. This code pattern allows for 215 = 32 768 codes, although in practice only 384 codes are currently used to indentify the beads: other bits on the code are used for error checking and other purposes such as sample and lab ID. The particles are reacted with the analyte solution in a single well of a standard multi-well plate, and transferred into the Bead Xpress reader, which deposits them into a grooved plate, so that they are aligned for reading. In addition to the red code-readout laser, the particles are also interrogated with a green laser for fluorescent binding indication. The company provides particles with immobilized oligonucleotides for genotyping assays, in addition to carboxylated bead sets for custom probe attachment. Although only a recent introduction to the market, the technology has been usedmple for analysing SNPs indicative of Kawasaki disease.67
Summary and discussion
Suspension assays using encoded microparticles are now in use commercially for assays that require multiplexing in small sample volumes. They have been shown to have molecular concentration sensitivities comparable to both traditional ELISAs and microarrays, making them realistic future candidates for high throughput, low sample volume replacements for theses technologies. The methods used to encode microparticles can be divided into two main technologies: The first is spectroscopic encoding, in which the reflection, fluorescence or Raman spectrum of the particle constitutes the code; the second is graphical (or occlusion) encoding, in which a pattern is encoded on or into a microparticle, and read directly using a microscope with CCD camera and machine vision software, or indirectly by analysis of a diffraction pattern. Some technologies make use of both graphical patterning and spectroscopic information.
Generally, spectroscopic methods have lower encoding capacities, but may often be sufficient for immunoassays. The reliance on signal intensity as a code in highly multiplexed fluorescence-based technologies may lead to errors in reading as the number of codes increases due to variations in spectral intensity. Also the use of fluorescence for biochemical assays is not completely compatible with fluorescent-based encoding. DNA/RNA based fluorescent barcodes solve this compatibility issue by acting as both the code and binding reporter; however the complexity of chemical synthesis and reaction involved in using these codes is increased. Fluorescence based flow-cytometric assay technologies with approximately 100 unique codes are in commercial use,25 demonstrating that they have a promising and well-defined place for reliable assay encoding in applications with low multiplexing requirements, such as many common immunoassays. These methods are however not sufficiently robust to be used in assays involving much more than ∼102 codes, due to intensity variations and the lack of error correction methods in the encoding system. Structured fluorescent codes, such as those based on striped rare earth-doped glasses and dye-labelled RNA strings offer higher multiplexing capabilities, although have increased manufacturing or chemical synthesis complexity, respectively.
Graphical methods offer much higher encoding capacities (of the order of 106 codes on a 100 μm particle). They are very simple to make, are robust and enable error detection mechanisms to be utilized. The encoding capacity depends on the size of the particle and the resolution with which the code elements can be manufactured; using a simple single step lithography technique as for the particles in Fig. 13(B), around 1024 codes could be manufactured on a 200 μm particle. Such large numbers are of little practical use, but provide the necessary redundant bits for robust detection of particle orientation, with detection and correction of read errors. They do not require fluorescence, thereby decoupling the code from the chemical assay readout. An important point is that the manufacture of these codes is trivial, single step photolithography of photo-polymers on wafers is a well-established and high throughput technique. Large numbers of these particles can be quickly, easily and reproducibly manufactured: For example, approximately 1 600 000 particles of 100 μm × 100 μm can be manufactured on a single 6” wafer in one lithography step. The main disadvantage of the graphical methods is that for large encoding capacities, the particles need to be approximately 10 times larger than the spectrally encoded particles (i.e. dimensions of hundreds rather than tens of micrometres). Therefore, highly multiplexed assays require higher sample volumes for reaction than an equivalent number of spectroscopically encoded beads. However, the volumes are still relatively small. For example, assume that the micro-sample volume is 20 times larger than the combined volume of all the particles used in an assay. If the assay uses 10 000 particles, each of 100 μm × 100 μm × 5 μm in size, the solution volume is 10 μl, which can be easily accommodated in a single well of a standard multi-well plate.
Maintaining an adequate signal to noise ratio between ‘1’ and ‘0’ bits often requires either a more complicated manufacturing process, such as incorporation of high reflectivity elements into the microparticles (which increases the complexity of the manufacturing process,35,36), or the use of fluorescent dyes to create a bright background for dark code elements.34,39 However the need for such contrast-enhancing methods could be overcome by use of appropriate image processing techniques during code readout. Physical damage to the particles could also lead to read errors because material is lost or the SNR is increased. In many cases, mis-orientation of the particles could lead to read errors. However binary error correction systems minimise the effect of such errors for assays involving large numbers of codes.
Encoding schemes based on detecting diffraction patterns offer simplified reading systems, as the code is projected from the particle, eliminating the need for microscopy. In addition, the reliance on overall periodicity rather than single features provides an advantage over the graphical encoding methods, in that they have greater resistance to contamination or damage. However, the simple grating-based method has a relatively low realistic encoding capacity of around 103 codes, compared to graphical methods. Encoding schemes based on alternative methods of computer-generating diffractive elements68–70 will allow much increased encoding capacities. Holographic methods offer the promise of extremely high encoding capacities (theoretically around 1024 unique codes on a 100 μm particle), binary encoding of information (with the associated error detection mechanisms), higher signal-to-noise ratio than graphical methods and even re-writing of the code on the particle. These methods, however, require significant development before they can be used reliably in assays.
The graphical binary-encoding methods hold the most promise for future applications in large-scale (>103 targets) assays, particularly because simple low-cost manufacturing processes can be used with polymer materials. The codes could be embossed or manufactured by imprint lithography; the encoding system is very simple and robust (with regards to errors), and very large numbers of codes are possible. Spectroscopic encoding methods will continue to be used in devices at smaller scales because of the simplicity oftection and because these techniques fit with existing well-proven fluorescence detection devices.
Sam Birtwell

Sam Birtwell received his PhD in 2008 from the School of Physics and Astronomy at the University of Southampton, where he worked on diffractive methods for encoding microparticles to be used in suspension assays. He is currently a research fellow in the School of Electronics and Computer Science at the same university. His research interests lie in the development of integrated devices for use in drug discovery and diagnostic applications. His present focus is on the use of microparticles for cell-based drug discovery assays, including development of devices for transport and alignment of particles and cells.
Hywel Morgan

Hywel MorganHywel Morgan received his PhD in 1985 from the University of Wales, and is currently a Professor in the School of Electronics and Computer Science at the University of Southampton. He has broad research interests in microfluidics, micro and nano-fabrication, integrated analytical systems and AC electrokinetics. In 2001 he secured a Royal Society-Leverhulme Senior Research Fellowship and in 2004 he won the Desty award for innovation in separation science. He has published widely, regularly speaks at international conferences and has co-authored a text-book on AC electrokinetics. He is a member of the editorial board of the Journal of Electrostatics, IET Nano-biotechnology and Microfluidics and Nanofluidics.
References
- 1. Kindt T. J., Goldsby R. A. andOsborne B. A.,Immunology,W. H. Freeman and Company,New York, 6th edn,2007. [Google Scholar]
- 2. AbCam ELISA Kits specifications: http://www.abcam.com.
- 3. Quansys Bio multiplex ELISA kit specifications: http://www.quansysbio.com/.
- 4. Pierce multiplex ELISA kit specifications: http://www.piercenet.com/.
- 5. Ray Biotech multiplex ELISA kit specifications:http://www.raybiotech.com/.
- 6. Cell Signalling Technology multiplex ELISA kit specifications: http://www.cellsignal.com/.
- 7. Wiese R., Belosludtsev Y., Powdrill T., Thompson P. and Hogan M., Clin. Chem., 2001, 47, 1451. [PubMed] [Google Scholar]
- 8. Fall B., Eberlein-Konig B., Behrendt H., Niessner R., Ring J. and Weller M., Anal. Chem., 2003, 75, 556. [DOI] [PubMed] [Google Scholar]
- 9. Quintana F. J., Farez M. F., Viglietta V., Iglesias A. H., Merbl Y., Izquierdo G., Lucas M., Basso A. B., Khoury S. J., Lucchinetti C. F., Cohen I. R. and Weiner H. L., Proc. Natl. Acad. Sci. U. S. A., 2008, 105, 18889. [DOI] [PMC free article] [PubMed] [Google Scholar]
- 10. Leffers N., Gooden M., de Jong R., Hoogeboom B., ten Hoor K., Hollema H., Boezen H., van der Zee A., Daemen T. and Nijman H., Cancer Immunol. Immunother., 2009, 58, 449–459. [DOI] [PMC free article] [PubMed] [Google Scholar]
- 11. Li F., Guan Y. and Chen Z., Cell. Mol. Life Sci. (CMLS), 2008, 65, 1007–1012. [DOI] [PMC free article] [PubMed] [Google Scholar]
- 12. Qiu M., Shi Y., Guo Z., Chen Z., He R., Chen R., Zhou D., Dai E., Wang X., Si B., Song Y., Li J., Yang L., Wang J., Wang H., Pang X., Zhai J., Du Z., Liu Y., Zhang Y., Li L., Wang J., Sun B. and Yang R., Microbes Infect., 2005, 7, 882–889. [DOI] [PMC free article] [PubMed] [Google Scholar]
- 13. Ramachandran N., Anderson K. S., Raphael J. V., Hainsworth E., Sibani S., Montor W. R., Pacek M., Wong J., Eljanne M., Sanda M. G., Hu Y., Logvinenko T. and LaBaer J., Proteomics—Clin. Appl., 2008, 2, 1518–1527. [DOI] [PMC free article] [PubMed] [Google Scholar]
- 14. Wu J., Dyer W., Chrisp J., Belov L., Wang B. and Saksena N., Retrovirology, 2008, 5, 24. [DOI] [PMC free article] [PubMed] [Google Scholar]
- 15. Miyazaki K., Yamaguchi M., Imai H., Kobayashi T., Tamaru S., Nishii K., Yuda M., Shiku H. and Katayama N., Blood, 2009, 113, 1071–1074. [DOI] [PubMed] [Google Scholar]
- 16. Wong N., Yeo W., Wong W., Wong N. L., Chan K. Y., Mo F. K., Koh J., Chan S. L., Chan A. T., Lai P. B., Ching A. K., Tong J. H., Ng H., Johnson P. J. and To K., Int. J. Cancer, 2009, 124, 644–652. [DOI] [PubMed] [Google Scholar]
- 17. Palka-Santini M., Cleven B., Eichinger L., Kronke M. and Krut O., BMC Microbiol., 2009, 9, 1. [DOI] [PMC free article] [PubMed] [Google Scholar]
- 18. Pang S., Smith J., Onley D., Reeve J., Walker M. and Foy C., J. Immunol. Methods, 2005, 302, 253. [DOI] [PubMed] [Google Scholar]
- 19. Ligler F. S., Anal. Chem., 2009, 81, 519–526. [DOI] [PMC free article] [PubMed] [Google Scholar]
- 20. Yager P., Domingo G. J. and Gerdes J., Annu. Rev. Biomed. Eng., 2008, 10, 107. [DOI] [PubMed] [Google Scholar]
- 21. Cavalli G., Banu S., Ranasinghe R. T., Broder G. R., Martins H. F. P., Neylon D. C., Morgan H., Bradley M. and Roach P. L., J. Comb. Chem., 2007, 9, 462. [DOI] [PubMed] [Google Scholar]
- 22. Wilson R., Cossins A. R. and Spiller D. G., Angew. Chem., Int. Ed., 2006, 45, 6104. [DOI] [PubMed] [Google Scholar]
- 23. Braeckmans K., DeSmedt S. C., Leblans M., Pauwels R. and Demeester J., Nat. Rev. Drug Discovery, 2002, 1, 447. [DOI] [PubMed] [Google Scholar]
- 24. Morgan E., Varro R., Sepulveda H., Ember J. A., Apgar J., Wilson J., Lowe L., Chen R., Shivraj L., Agadir A., Campos R., Ernst D. and Gaur A., Clin. Immunol., 2004, 110, 252. [DOI] [PubMed] [Google Scholar]
- 25. http://www.luminexcorp.com/technology/index.html.
- 26. Kellar K. and Douglass J., J. Immunol. Methods, 2003, 279, 277. [DOI] [PubMed] [Google Scholar]
- 27. Hurley J., Engle L., Davis J., Welsh A. and Landers J., Nucleic Acids Res., 2004, 32, e186. [DOI] [PMC free article] [PubMed] [Google Scholar]
- 28. http://www.fda.gov/bbs/topics/NEWS/2008/NEW01770.html.
- 29. Jaiswal J. K. and Simon S. M., Trends Cell Biol., 2004, 14, 497. [DOI] [PubMed] [Google Scholar]
- 30. Ma Q., Wang X., Li Y., Shi Y. and Su X., Talanta, 2007, 72, 1446. [DOI] [PubMed] [Google Scholar]
- 31. Mattheakis L. C., Dias J. M., Choi Y., Gong J., Bruchez M. P., Liu J. and Wang E., Anal. Biochem., 2004, 327, 200. [DOI] [PubMed] [Google Scholar]
- 32. Medintz I., Uyeda H., Goldman E. and Mattoussi H., Nat. Mater., 2005, 4, 435. [DOI] [PubMed] [Google Scholar]
- 33. Han M., Gao X., Su J. and Nie S., Nat. Biotechnol., 2001, 19, 631. [DOI] [PubMed] [Google Scholar]
- 34. Dejneka M., Streltsov A., Pal S., Frutos A., Powell C., Yost K., Yuen P., Muller U. and Lahiri J., Proc. Natl. Acad. Sci. U. S. A., 2003, 2, 389. [DOI] [PMC free article] [PubMed] [Google Scholar]
- 35. Li Y., Thi Y. and Luo D., Nat. Biotechnol., 2005, 23, 885. [DOI] [PMC free article] [PubMed] [Google Scholar]
- 36. Geiss G. K., Bumgarner R. E., Birditt B., Dahl T., Dowidar N., Dunaway D. L., Fell H. P., Ferree S., George R. D., Grogan T., James J. J., Maysuria M., Mitton J. D., Oliveri P., Osborn J. L., Peng T., Ratcliffe A. L., Webster P. J., Davidson E. H. and Hood L., Nat. Biotechnol., 2008, 26, 317. [DOI] [PubMed] [Google Scholar]
- 37. Su X., Zhang J., Sun L., Koo T., Chan S., Sundararajan N., Yamakawa M. and Berlin A., Nano Lett., 2005, 5, 49. [DOI] [PubMed] [Google Scholar]
- 38. Bravo-Vasquez J. and Fenniri H., Sens. Actuators, B, 2007, 125, 357. [Google Scholar]
- 39. Fenniri H., Chun S., Ding L., Zyrianov Y. and Hallenga K., J. Am. Chem. Soc., 2003, 125, 10546. [DOI] [PubMed] [Google Scholar]
- 40. Qin L., Banholzer M., Millstone J. and Mirkin C., Nano Lett., 2007, 7, 3849. [DOI] [PMC free article] [PubMed] [Google Scholar]
- 41. Qin L., Park S., Huang L. and Mirkin C., Science, 2005, 309, 113. [DOI] [PubMed] [Google Scholar]
- 42. Cunin F., Schmedake T. A., Link J., Li Y., Koh J., Bhatia S. and Sailor M., Nat. Mater., 2002, 1, 39. [DOI] [PubMed] [Google Scholar]
- 43. Zhao Y., Zhao X., Hu J., Xu M., Zhao W., Sun L., Zhu C., Xu H. and Gu Z., Adv. Mater., 2009, 21, 569. [DOI] [PubMed] [Google Scholar]
- 44. Yu C. and Irudayaraj J., Anal. Chem., 2007, 79, 572. [DOI] [PubMed] [Google Scholar]
- 45. Nicewarner-Pena S., Griffith Freeman R., Reiss B., He L., Pena D., Walton I., Cromer R., Keating C. and Natan M., Science, 2001, 294, 137. [DOI] [PubMed] [Google Scholar]
- 46. Reiss B. D., Griffith Freeman R., Walton I. D., Norton S. M., Smith P. C., Stonas W. G., Keating C. D. and Natan M. J., J. Electroanal. Chem., 2002, 522, 95. [Google Scholar]
- 47. Keating C. D. and Natan M. J., Adv. Mater., 2003, 15, 451. [Google Scholar]
- 48. Sha M., Walton I., Norton S., Taylor M., Yamanaka M., Natan M., Xu C., Drmanac S., Huang S., Borcherding A., Drmanac R. and Penn S., Anal. Bioanal. Chem., 2006, 384, 658. [DOI] [PubMed] [Google Scholar]
- 49. Evans M., Sewter C. and Hill E., Assay Drug Dev. Technol., 2003, 1, 199. [DOI] [PubMed] [Google Scholar]
- 50. http://www.ultraplex.com/.
- 51. Zhi Z., Morita Y., Hasan Q. and Tamiya E., Anal. Chem., 2003, 75, 4125. [DOI] [PubMed] [Google Scholar]
- 52. Zhi Z., Murakami Y., Morita Y., Hasan Q. and Tamiya E., Anal. Biochem., 2003, 318, 236. [DOI] [PubMed] [Google Scholar]
- 53. Zhi Z., Morita Y., Yamamura S. and Tamiya E., Chem. Commun., 20052448. [DOI] [PubMed] [Google Scholar]
- 54. Pregibon D. C., Toner M. and Doyle P. S., Science, 2007, 315, 1393. [DOI] [PubMed] [Google Scholar]
- 55. Hoffmann D., O'Brien, Brennan D. J. and Loughran M., Sens. Actuators, B, 2007, 122, 653. [Google Scholar]
- 56. Wood D., Braun G., Fraikin J., Swenson L. J., Reichb N. O. and Cleland A. N., Lab Chip, 2007, 7, 469. [DOI] [PubMed] [Google Scholar]
- 57. Kastl K., Lowe C. and Norman C., Anal. Chem., 2008, 80, 7862. [DOI] [PubMed] [Google Scholar]
- 58. Derveaux S., De Geest B., Roelant C., Braeckmans K., Demeester J. and De Smedt S., Langmuir, 2007, 23, 10272. [DOI] [PubMed] [Google Scholar]
- 59. Derveaux S., Stubbe B., Roelant C., Leblans M., De Geest B., Demeester J. and De Smedt S., Anal. Chem., 2008, 80, 85. [DOI] [PubMed] [Google Scholar]
- 60. Braeckmans K., De Smedt S. C., Roelent C., Leblans M., Pauwels R. and Demeester J., Nat. Mater., 2003, 2, 169. [DOI] [PubMed] [Google Scholar]
- 61. Birtwell S. W., Galitonov G. S., Zheludev N. I. and Morgan H., Opt. Commun., 2008, 281, 1789. [DOI] [PubMed] [Google Scholar]
- 62. Broder G. R., Ranasinghe R. T., She J. K., Banu S., Birtwell S. W., Cavalli G., Galitonov G. S., Holmes D., Martins H. F. P., Neylon C., Zheludev N., Roach P. L. and Morgan H., Anal. Chem., 2008, 80, 1902. [DOI] [PubMed] [Google Scholar]
- 63. Banu S., Birtwell S., Galitonov G., Chen Y., Zheludev N. and Morgan H., J. Micromech. Microeng, 2007, 17, S116. [Google Scholar]
- 64. Birtwell S. W., Banu S., Zheludev N. I. and Morgan H., J. Phys. D: Appl. Phys., 2009, 42, 055507. [Google Scholar]
- 65. Irie M., Jpn. J. Appl. Phys., 1989, 28, 215. [Google Scholar]
- 66. http://www.illumina.com.
- 67. Kim J., Hong S., Hong Y. M., Kim S., Kang M., Kim K., Seo E., Yoo H., Cheong H., Shin H., Park I. and Lee J., Hum. Immunol., 2008, 69, 867–871. [DOI] [PubMed] [Google Scholar]
- 68. Clark M. and Smith R., Opt. Commun., 1996, 124, 150. [Google Scholar]
- 69. Dammann H. and Klotz E., Opt. Acta, 1977, 24, 505. [Google Scholar]
- 70. Hutchins R., Yang H., Morris J. and Feldman M., Appl. Opt., 1997, 36, 2313. [DOI] [PubMed] [Google Scholar]