Abstract

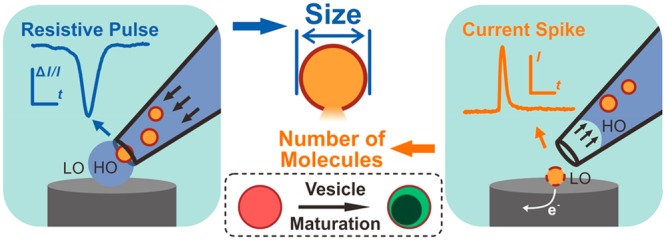
We have developed the means to simultaneously measure the physical size and count catecholamine molecules in individual nanometer transmitter vesicles. This is done by combining resistive pulse (RP) measurements in a nanopore pipet and vesicle impact electrochemical cytometry (VIEC) at an electrode as the vesicle exits the nanopore. Analysis of freshly isolated bovine adrenal vesicles shows that the size and internal catecholamine concentration of vesicles varies with the occurrence of a dense core inside the vesicles. These results might benefit the understanding about the vesicles maturation, especially involving the “sorting by retention” process and concentration increase of intravesicular catecholamine. The methodology is applicable to understanding soft nanoparticle collisions on electrodes, vesicles in exocytosis and phagocytosis, intracellular vesicle transport, and analysis of electroactive drugs in exosomes.
As a crucial organelle to intercellular communication and modulation of above physiological processes, vesicles within multiple cells, like neuronal cells,1−5 beta cells,6−10 hormonal cells,11−15 platelets,16−18 etc., have been investigated in many aspects. Especially, their involvement in molecular release, exocytosis, has attracted great interest and been extensively studied in recent years owing to its importance in many fields such as neuroscience and diabetes.
In recent years, micro-/nano-electrochemical approaches have been developed to realize the quantitative measurement of intravesicular content and real-time monitoring of their release dynamics.19−26 Our group developed a new technique, vesicle impact electrochemical cytometry (VIEC),27−29 providing a highly effective way to quantify the intravesicular electroactive contents, such as catecholamines, inside each single vesicle. However, to the best of our knowledge, the relationship between size and content concentration of individual vesicle, which benefits the deeper understanding of the mechanism of exocytosis, has not yet been disclosed.
Although the intravesicular content of individual vesicles can be obtained by VIEC, it is currently not possible to measure the size relating to each measured vesicle. There are several effective commercial techniques capable of measuring the size of vesicles, such as transmission electron microscopy (TEM),30−33 dynamic light scattering (DLS),34−36 nanoparticle tracking analysis (NTA),37−39 and even flow cytometry;40−42 however, some difficulties still exist. For instance, identifying vesicles from complex cell debris or corresponding their signal to the content quantification method, like VIEC, and none of these can currently be used while simultaneously quantifying the vesicle content.
Among those sizing techniques, the resistive pulse (RP) method43−47 appears compatible with VIEC. With this combination, single vesicles can be manipulated to move one by one across a solid nanopore with varying the pore resistance to measure size, then to impact an electrode surface, release their contents and generate a current transient to quantify the molecular content.
Here we present an effective strategy to combine RP with the VIEC technique to simultaneously measure size and content of isolated nanometer chromaffin vesicles. We then use this to examine the relationship between content concentration and vesicle size.
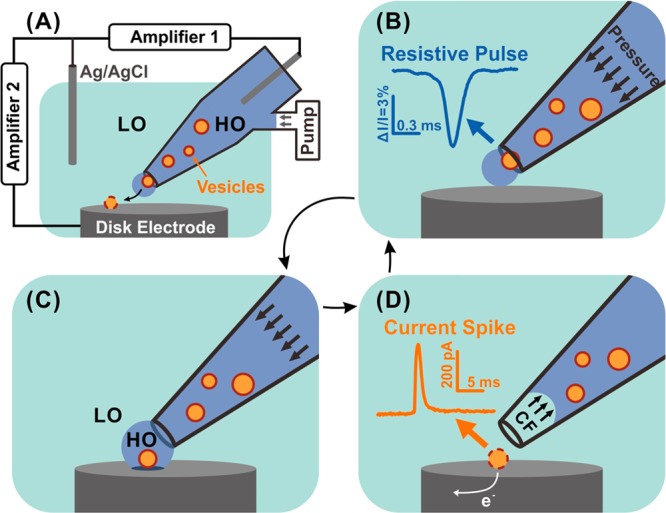
Periodic pressure applied to the nanopipette is used to eject vesicles in solution having a different osmolality inside compared to outside the tip, and the eluting vesicles are then targeted one at a time onto an electrode. Two circuits are used for synchronous recording of the resistive pulses via the nanopipette tip and current spikes with a carbon fiber microdisk electrode at the VIEC electrode (see Figure 1A and details in Supporting Information (SI)). A periodic measurement cycle is used. Application of a pressure pulse (0.5–1 s) is first used to push out a single vesicle and push away nearby bath solution (LO in Figure 1A,C). The ejected solution surrounding the vesicle (HO in Figure 1A,C) has osmolality close to that of the intravesicular lumen to avoid swelling and breaking of vesicles prior to ejection. In the second step, the pressure is stopped (3–5 s) so the external bath solution, whose osmolality is lower than the intravesicular solution, will return to the electrode surface, pushing back the vesicle solution into the nanopipette by capillary force to stop new particles from flowing out. Vesicles that attach to the electrode break in a short time (96% of 340 vesicles open in less than 5 s, see SI, Figure S1). This is facilitated by the low osmolality, and all the intravesicular catecholamine electrooxidized at the electrode producing current spikes that can be quantified. When there is only one resistive pulse and only one current spike appears in one cycle, they can be assumed to come from the same vesicle (this occurs in 3–7% of pulses empirically; the vesicle concentration is kept low enough to minimize pulses ejecting more than one vesicle). This is discussed further in the SI (see Figure S2).
Figure 1.

Schematic of RP-VIEC. (A) electrode configuration for RP-VIEC. Amplifier 1 records the RP at a potential of +13 mV vs Ag/AgCl reference electrode. Amplifier 2 records the current spike for VIEC with electrode potential set to +700 mV vs the same reference electrode. (B–D) Schematics showing a cycle induced by periodic pressure: (B) Pressure is applied to push a vesicle across the nanopore and generate an RP signal. (C) The vesicle attaches on the electrode surface and is surrounded by the outflowing buffer with relatively high osmolality (similar to vesicular lumen). LO, low osmolarity; HO, high osmolality. (D) Suspended pressure results in capillary force (CF) stopping solution outflow. The vesicle on the surface opens by electroporation aided by the relatively low osmolarity of the surrounding solution. Electroactive content of the vesicle is electrooxidized and generates a current spike.
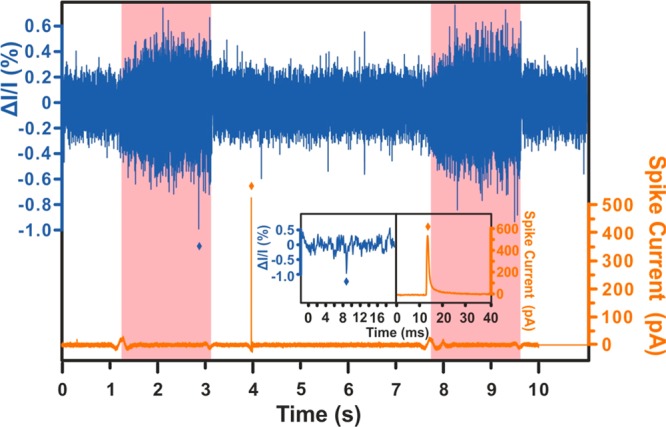
Chromaffin vesicles, containing catecholamines, were isolated from bovine adrenal glands and were investigated after pretreatment through this strategy. After subtracting the baselines in both traces, some examples showing the spike following the RP are observed (see Figure 2 and SI, Figure S2). To analyze the RP signal, an algorithm48 was adopted, and it was used to effectively relate the magnitude of the RP signal to the ratio of the radius of the vesicular particle and the nanopore (see details in SI and Figure S4).
Figure 2.

An example an RP vs VIEC signal. The blue trace is the RP recording and it is shown in the form of normalized current decline, and the orange trace is VIEC and shown as spike current. The data from both traces are processed (raw traces in SI, Figure S3). The inset is the magnification of both signals, including a RP signal and its following VIEC signal (marked with an asterisk for each). The pink zones indicate when the pressure is applied, and white zones indicate when it is stopped. RP spikes in the white zone without corresponding VIEC signals are likely due to dust or other particles that do not impact or create a signal at the electrode and so are not considered.
After estimating the pore size by scanning electron microscopy (see an example in SI, Figure S5), the size of individual vesicle can be calculated. The catecholamine content was evaluated by VIEC as described in the SI. Further, the concentration (C) was calculated by use of individual vesicle radius (r) and vesicular catecholamine content in moles (N), using the equation:
| 1 |
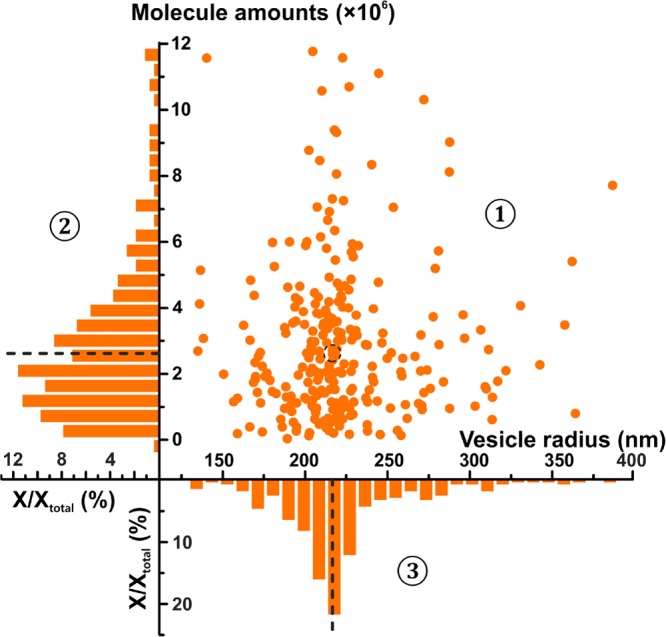
where NA is Avogadro’s number (6.022 × 10²³ mol–1). We collected 278 simultaneous measurements of vesicular catecholamine content and vesicle radius, and these are plotted in Figure 3 with their respective histograms. The median of vesicle radius is 216 nm, with 2.64 × 10⁶ molecules and a calculated concentration of 0.101 M (see the histogram of concentration in SI, Figure S6).
Figure 3.

Statistical distribution of vesicle content versus radius of each individual recorded chromaffin vesicle. The relationship between content versus radius is shown in a scatter plot in part ①; the normalized frequency histograms of content are depicted in part ② and vesicle radius in part ③. Parts ① and ② share the Y-axis, and parts ① and ③ share the X-axis. The dotted lines and circle indicate the median position for each parameter measured.
Notably, our results appear to provide insight into the quantitative aspect of vesicle maturation, especially regarding the dense core within vesicles. The vesicular dense core, consisting of polyanionic protein, is thought to largely complex the catecholamines via electrostatic interaction. We sorted the current transients for VIEC of single vesicles by curve fitting the falling phase (after the peak) of the current spikes.49 The previous theoretical analysis considered only vesicles with dense cores and yet provided a potential framework to explain events that have single versus multiple exponential declines on the falling part of the event. However, as exocytosis is partial,2,50−52 this means that release is more complex with single exponential events for release from the spaces vs double exponential events from both the spaces and the dense core in the vesicle. In VIEC where the entire vesicle content is measured, we interpret events with single exponential to represent immature vesicles (NDCVs). If the falling phase is fit by a single exponential decline, we interpret this to indicate that the vesicle does not have a protein dense core, and a double exponential fit reflects the existence of a dense core. We then classified all the simultaneous measurements of catecholamine amount (VIEC) and radius (RP) for vesicles into two groups via a fit of one or two exponentials in the respective current spike. With the assumptions above, this allowed us to divide spikes into those having dense cores (DCV, n = 150) and those apparently without dense cores (NDCV, n = 128). In SI, Figure S7, we show the statistical distribution of the vesicle radii and their catecholamine concentrations for both groups. The median concentration of the DCVs is higher than the NDCVs (0.116 M for DCVs versus 0.062 M for NDCVs, P < 0.01, see the inset in SI, Figure S7②), and the median radius of the DCVs is slightly smaller (216 nm for DCVs versus 218 nm for NDCVs, P < 0.1, see the inset in SI, Figure S7③). Also, the median catecholamine numbers are higher for DCVs (2.8 × 10⁶ molecules for DCVs versus 2.1 × 10⁶ molecules for NDCVs, P < 0.01, see SI, Figure S8).
DCVs are usually considered to be more mature vesicles than NDCVs. Our results provide a novel perspective on the hypothetical process called “sorting by retention” for protein recycling (see SI, Figure S9)53,54 during vesicle maturation. Briefly, after being formed from the trans-Golgi network and homotypic fusion, immature vesicles will expel those proteins not destined for mature vesicles via budding off of small clathrin-coated vesicles, possibly leading to a slight decrease in vesicle size. Subsequently, the following condensation and acidification of the vesicular lumen will increase the concentration of intravesicular catecholamines as the dense core is formed.55−57 Our data are consistent with this process.
In conclusion, our work presents an effective approach to simultaneously correlate the size of an individual chromaffin vesicle and its intravesicular catecholamine content. By use of the resistive pulses caused by a vesicle exiting a nanopore and then capturing the vesicle on an electrode for analysis, the RP-VIEC approach allows us to examine individual vesicles for size and molecular content and to examine the distribution of these two parameters. Furthermore, with vesicle size and content, we can calculate catecholamine concentration in each vesicle separately and examine its variation, whereas this was only possible for populations of vesicles in previous experiments. Analysis of isolated chromaffin vesicles indicates size and catecholamine concentration are different between DCVs and NDCVs. Thus, this might be a means to provide quantitative information about the vesicle maturation process. The strategy presented here should benefit further investigation of vesicle-related physiology processes, including exocytosis, phagocytosis, intracellular vesicle transport, as well as analysis of electroactive drugs in exosomes.
Acknowledgments
We acknowledge funding from the European Research Council (Advanced Grant), the Knut and Alice Wallenberg Foundation, the Swedish Research Council (VR), and the National Institutes of Health. We acknowledge Dalsjöfors Kött AB (Dalsjöfors, Sweden) for donation of bovine adrenal glands. We also acknowledge Prof. Róbert E. Gyurcsányi and Dr. István Makra for their kindly assistance on the resistive pulse algorithm.
Supporting Information Available
The Supporting Information is available free of charge at https://pubs.acs.org/doi/10.1021/jacs.9b13221.
Experimental details and procedures for vesicles isolation, resistive pulse recording, electrochemical measurements, and data processing (PDF)
The authors declare no competing financial interest.
Supplementary Material
References
- Dürst C. D.; Wiegert J. S.; Helassa N.; Kerruth S.; Coates C.; Schulze C.; Geeves M. A.; Török K.; Oertner T. G. High-Speed Imaging of Glutamate Release with Genetically Encoded Sensors. Nat. Protoc. 2019, 14, 1401–1424. 10.1038/s41596-019-0143-9. [DOI] [PMC free article] [PubMed] [Google Scholar]
- Phan N. T. N.; Li X.; Ewing A. G. Measuring Synaptic Vesicles Using Cellular Electrochemistry and Nanoscale Molecular Imaging. Nat. Rev. Chem. 2017, 1, 0048. 10.1038/s41570-017-0048. [DOI] [Google Scholar]
- Rizo J.; Xu J. The Synaptic Vesicle Release Machinery. Annu. Rev. Biophys. 2015, 44, 339–367. 10.1146/annurev-biophys-060414-034057. [DOI] [PubMed] [Google Scholar]
- Liu C.; Kaeser P. S. Mechanisms and Regulation of Dopamine Release. Curr. Opin. Neurobiol. 2019, 57, 46–53. 10.1016/j.conb.2019.01.001. [DOI] [PMC free article] [PubMed] [Google Scholar]
- Anantharam A.; Kreutzberger A. J. B. Unraveling the Mechanisms of Calcium-Dependent Secretion. J. Gen. Physiol. 2019, 151, 417–434. 10.1085/jgp.201812298. [DOI] [PMC free article] [PubMed] [Google Scholar]
- Vakilian M.; Tahamtani Y.; Ghaedi K. A Review On Insulin Trafficking and Exocytosis. Gene 2019, 706, 52–61. 10.1016/j.gene.2019.04.063. [DOI] [PubMed] [Google Scholar]
- Guest P. C. Biogenesis of the Insulin Secretory Granule in Health and Disease. Adv. Exp. Med. Biol. 2019, 1134, 17–32. 10.1007/978-3-030-12668-1_2. [DOI] [PubMed] [Google Scholar]
- Frank J. A.; Broichhagen J.; Yushchenko D. A.; Trauner D.; Schultz C.; Hodson D. J. Optical Tools for Understanding the Complexity of B-Cell Signalling and Insulin Release. Nat. Rev. Endocrinol. 2018, 14, 721–737. 10.1038/s41574-018-0105-2. [DOI] [PubMed] [Google Scholar]
- Rorsman P.; Ashcroft F. M. Pancreatic β-Cell Electrical Activity and Insulin Secretion: Of Mice and Men. Physiol. Rev. 2018, 98, 117–214. 10.1152/physrev.00008.2017. [DOI] [PMC free article] [PubMed] [Google Scholar]
- Hastoy B.; Clark A.; Rorsman P.; Lang J. Fusion Pore in Exocytosis: More than an Exit Gate? Aβ-Cell Perspective. Cell Calcium 2017, 68, 45–61. 10.1016/j.ceca.2017.10.005. [DOI] [PubMed] [Google Scholar]
- Thorn P.; Zorec R.; Rettig J.; Keating D. J. Exocytosis in Non-Neuronal Cells. J. Neurochem. 2016, 137, 849–859. 10.1111/jnc.13602. [DOI] [PubMed] [Google Scholar]
- Maj M.; Wagner L.; Tretter V. 20 Years of Secretagogin: Exocytosis and Beyond. Front. Mol. Neurosci. 2019, 12, 29. 10.3389/fnmol.2019.00029. [DOI] [PMC free article] [PubMed] [Google Scholar]
- Wightman R. M.; Domínguez N.; Borges R. How Intravesicular Composition Affects Exocytosis. Pfluegers Arch. 2018, 470, 135–141. 10.1007/s00424-017-2035-6. [DOI] [PubMed] [Google Scholar]
- Marengo F. D.; Cárdenas A. M. How Does the Stimulus Define Exocytosis in Adrenal Chromaffin Cells?. Pfluegers Arch. 2018, 470, 155–167. 10.1007/s00424-017-2052-5. [DOI] [PubMed] [Google Scholar]
- Albillos A.; Dernick G.; Horstmann H.; Almers W.; Alvarez de Toledo G.; Lindau M. The Exocytotic Event in Chromaffin Cells Revealed by Patch Amperometry. Nature 1997, 389, 509–512. 10.1038/39081. [DOI] [PubMed] [Google Scholar]
- Sharda A.; Flaumenhaft R. The Life Cycle of Platelet Granules. F1000Research 2018, 7, 236. 10.12688/f1000research.13283.1. [DOI] [PMC free article] [PubMed] [Google Scholar]
- Yadav S.; Storrie B. The Cellular Basis of Platelet Secretion: Emerging Structure/Function Relationships. Platelets 2017, 28, 108–118. 10.1080/09537104.2016.1257786. [DOI] [PMC free article] [PubMed] [Google Scholar]
- Manne B. K.; Xiang S. C.; Rondina M. T. Platelet Secretion in Inflammatory and Infectious Diseases. Platelets 2017, 28, 155–164. 10.1080/09537104.2016.1240766. [DOI] [PMC free article] [PubMed] [Google Scholar]
- Qi C.; Sha Z.; Li X. Electrochemical Analysis of Single Neuronal Vesicles. Chin. J. Anal. Chem. 2019, 47, 1502–1511. 10.19756/j.issn.0253-3820.191443. [DOI] [Google Scholar]
- Hu K.; Li Y.; Rotenberg S. A.; Amatore C.; Mirkin M. V. Electrochemical Measurements of Reactive Oxygen and Nitrogen Species inside Single Phagolysosomes of Living Macrophages. J. Am. Chem. Soc. 2019, 141, 4564–4568. 10.1021/jacs.9b01217. [DOI] [PubMed] [Google Scholar]
- White K. A.; Mulberry G.; Smith J.; Lindau M.; Minch B. A.; Sugaya K.; Kim B. N. Single-Cell Recording of Vesicle Release From Human Neuroblastoma Cells Using 1024-ch Monolithic CMOS Bioelectronics. IEEE T. Biomed. Circ. S. 2018, 12, 1345–1355. 10.1109/TBCAS.2018.2861220. [DOI] [PMC free article] [PubMed] [Google Scholar]
- Barlow S. T.; Louie M.; Hao R.; Defnet P. A.; Zhang B. Electrodeposited Gold On Carbon-Fiber Microelectrodes for Enhancing Amperometric Detection of Dopamine Release From Pheochromocytoma Cells. Anal. Chem. 2018, 90, 10049–10055. 10.1021/acs.analchem.8b02750. [DOI] [PMC free article] [PubMed] [Google Scholar]
- Li X.; Majdi S.; Dunevall J.; Fathali H.; Ewing A. G. Quantitative Measurement of Transmitters in Individual Vesicles in the Cytoplasm of Single Cells with Nanotip Electrodes. Angew. Chem., Int. Ed. 2015, 54, 11978–11982. 10.1002/anie.201504839. [DOI] [PMC free article] [PubMed] [Google Scholar]
- Liu Y.; Li M.; Zhang F.; Zhu A.; Shi G. Development of Au Disk Nanoelectrode Down to 3 Nm in Radius for Detection of Dopamine Release From a Single Cell. Anal. Chem. 2015, 87, 5531–5538. 10.1021/ac5042999. [DOI] [PubMed] [Google Scholar]
- Zhang X.; Oleinick A.; Jiang H.; Liao Q.; Qiu Q.; Svir I.; Liu Y.; Amatore C.; Huang W. Electrochemical Monitoring of ROS/RNS Homeostasis within Individual Phagolysosomes Inside Single Macrophages. Angew. Chem., Int. Ed. 2019, 58, 7753–7756. 10.1002/anie.201902734. [DOI] [PubMed] [Google Scholar]
- Shen M.; Qu Z.; DesLaurier J.; Welle T. M.; Sweedler J. V.; Chen R. Single Synaptic Observation of Cholinergic Neurotransmission on Living Neurons: Concentration and Dynamics. J. Am. Chem. Soc. 2018, 140, 7764–7768. 10.1021/jacs.8b01989. [DOI] [PMC free article] [PubMed] [Google Scholar]
- Li X.; Dunevall J.; Ren L.; Ewing A. G. Mechanistic Aspects of Vesicle Opening during Analysis with Vesicle Impact Electrochemical Cytometry. Anal. Chem. 2017, 89, 9416–9423. 10.1021/acs.analchem.7b02226. [DOI] [PubMed] [Google Scholar]
- Lovrić J.; Najafinobar N.; Dunevall J.; Majdi S.; Svir I.; Oleinick A.; Amatore C.; Ewing A. G. On the Mechanism of Electrochemical Vesicle Cytometry: Chromaffin Cell Vesicles and Liposomes. Faraday Discuss. 2016, 193, 65–79. 10.1039/C6FD00102E. [DOI] [PubMed] [Google Scholar]
- Dunevall J.; Fathali H.; Najafinobar N.; Lovric J.; Wigström J.; Cans A.; Ewing A. G. Characterizing the Catecholamine Content of Single Mammalian Vesicles by Collision–Adsorption Events at an Electrode. J. Am. Chem. Soc. 2015, 137, 4344–4346. 10.1021/ja512972f. [DOI] [PubMed] [Google Scholar]
- Berclaz N.; Müller M.; Walde P.; Luisi P. L. Growth and Transformation of Vesicles Studied by Ferritin Labeling and Cryotransmission Electron Microscopy. J. Phys. Chem. B 2001, 105, 1056–1064. 10.1021/jp001298i. [DOI] [Google Scholar]
- Crawford A. R.; Smith A. J.; Hatch V. C.; Oude Elferink R. P.; Borst P.; Crawford J. M. Hepatic Secretion of Phospholipid Vesicles in the Mouse Critically Depends On Mdr2 Or MDR3 P-glycoprotein Expression. Visualization by Electron Microscopy. J. Clin. Invest. 1997, 100, 2562–2567. 10.1172/JCI119799. [DOI] [PMC free article] [PubMed] [Google Scholar]
- Fertig E. T.; Gherghiceanu M.; Popescu L. M. Extracellular Vesicles Release by Cardiac Telocytes: Electron Microscopy and Electron Tomography. J. Cell. Mol. Med. 2014, 18, 1938–1943. 10.1111/jcmm.12436. [DOI] [PMC free article] [PubMed] [Google Scholar]
- Coldren B.; van Zanten R.; Mackel M. J.; Zasadzinski J. A.; Jung H. From Vesicle Size Distributions to Bilayer Elasticity via Cryo-Transmission and Freeze-Fracture Electron Microscopy. Langmuir 2003, 19, 5632–5639. 10.1021/la034311+. [DOI] [Google Scholar]
- Hallett F. R.; Watton J.; Krygsman P. Vesicle Sizing: Number Distributions by Dynamic Light Scattering. Biophys. J. 1991, 59, 357–362. 10.1016/S0006-3495(91)82229-9. [DOI] [PMC free article] [PubMed] [Google Scholar]
- Pencer J.; Hallett F. R. Effects of Vesicle Size and Shape on Static and Dynamic Light Scattering Measurements. Langmuir 2003, 19, 7488–7497. 10.1021/la0345439. [DOI] [Google Scholar]
- Day E. P.; Ho J. T.; Kunze R. K.; Sun S. T. Dynamic Light Scattering Study of Calcium-Induced Fusion in Phospholipid Vesicles. Biochim. Biophys. Acta, Biomembr. 1977, 470, 503–508. 10.1016/0005-2736(77)90142-0. [DOI] [PubMed] [Google Scholar]
- Pencer J.; Hallett F. R. Effects of Vesicle Size and Shape On Static and Dynamic Light Scattering Measurements. Langmuir 2003, 19, 7488–7497. 10.1021/la0345439. [DOI] [Google Scholar]
- Dragovic R. A.; Southcombe J. H.; Tannetta D. S.; Redman C. W. G.; Sargent I. L. Multicolor Flow Cytometry and Nanoparticle Tracking Analysis of Extracellular Vesicles in the Plasma of Normal Pregnant and Pre-Eclamptic Women. Biol. Reprod. 2013, 89, 1–12. 10.1095/biolreprod.113.113266. [DOI] [PubMed] [Google Scholar]
- Vestad B.; Llorente A.; Neurauter A.; Phuyal S.; Kierulf B.; Kierulf P.; Skotland T.; Sandvig K.; Haug K. B. F.; Øvstebø R. Size and Concentration Analyses of Extracellular Vesicles by Nanoparticle Tracking Analysis: A Variation Study. J. Extracell. Vesicles 2017, 6, 1344087. 10.1080/20013078.2017.1344087. [DOI] [PMC free article] [PubMed] [Google Scholar]
- van der Vlist E. J.; Nolte-’T Hoen E. N. M.; Stoorvogel W.; Arkesteijn G. J. A.; Wauben M. H. M. Fluorescent Labeling of Nano-Sized Vesicles Released by Cells and Subsequent Quantitative and Qualitative Analysis by High-Resolution Flow Cytometry. Nat. Protoc. 2012, 7, 1311–1326. 10.1038/nprot.2012.065. [DOI] [PubMed] [Google Scholar]
- Stoner S. A.; Duggan E.; Condello D.; Guerrero A.; Turk J. R.; Narayanan P. K.; Nolan J. P. High Sensitivity Flow Cytometry of Membrane Vesicles. Cytometry, Part A 2016, 89, 196–206. 10.1002/cyto.a.22787. [DOI] [PubMed] [Google Scholar]
- Morales-Kastresana A.; Telford B.; Musich T. A.; McKinnon K.; Clayborne C.; Braig Z.; Rosner A.; Demberg T.; Watson D. C.; Karpova T. S.; Freeman G. J.; DeKruyff R. H.; Pavlakis G. N.; Terabe M.; Robert-Guroff M.; Berzofsky J. A.; Jones J. C. Labeling Extracellular Vesicles for Nanoscale Flow Cytometry. Sci. Rep. 2017, 7, 1878. 10.1038/s41598-017-01731-2. [DOI] [PMC free article] [PubMed] [Google Scholar]
- Bayley H.; Martin C. R. Resistive-Pulse Sensing From Microbes to Molecules. Chem. Rev. 2000, 100, 2575–2594. 10.1021/cr980099g. [DOI] [PubMed] [Google Scholar]
- van der Pol E.; Coumans F.; Varga Z.; Krumrey M.; Nieuwland R. Innovation in Detection of Microparticles and Exosomes. J. Thromb. Haemostasis 2013, 11, 36–45. 10.1111/jth.12254. [DOI] [PubMed] [Google Scholar]
- Blundell E. L. C. J.; Mayne L. J.; Billinge E. R.; Platt M. Emergence of Tunable Resistive Pulse Sensing as a Biosensor. Anal. Methods 2015, 7, 7055–7066. 10.1039/C4AY03023K. [DOI] [Google Scholar]
- Pan R.; Hu K.; Jiang D.; Samuni U.; Mirkin M. V. Electrochemical Resistive-Pulse Sensing. J. Am. Chem. Soc. 2019, 141, 19555–19559. 10.1021/jacs.9b10329. [DOI] [PubMed] [Google Scholar]
- Liu Y.; Xu C.; Yu P.; Chen X.; Wang J.; Mao L. Counting and Sizing of Single Vesicles/Liposomes by Electrochemical Events. ChemElectroChem 2018, 5, 2954–2962. 10.1002/celc.201800616. [DOI] [Google Scholar]
- Terejánszky P.; Makra I.; Fürjes P.; Gyurcsányi R. E. Calibration-Less Sizing and Quantitation of Polymeric Nanoparticles and Viruses with Quartz Nanopipets. Anal. Chem. 2014, 86, 4688–4697. 10.1021/ac500184z. [DOI] [PubMed] [Google Scholar]
- Oleinick A.; Hu R.; Ren B.; Tian Z.; Svir I.; Amatore C. Theoretical Model of Neurotransmitter Release during in Vivo Vesicular Exocytosis Based on a Grainy Biphasic Nano-Structuration of Chromogranins within Dense Core Matrixes. J. Electrochem. Soc. 2016, 163, H3014–H3024. 10.1149/2.0031604jes. [DOI] [Google Scholar]
- Wu Q.; Zhang Q.; Liu B.; Li Y.; Wu X.; Kuo S.; Zheng L.; Wang C.; Zhu F.; Zhou Z. Dynamin 1 Restrains Vesicular Release to a Subquantal Mode in Mammalian Adrenal Chromaffin Cells. J. Neurosci. 2019, 39, 199–211. 10.1523/JNEUROSCI.1255-18.2018. [DOI] [PMC free article] [PubMed] [Google Scholar]
- Li X.; Dunevall J.; Ewing A. G. Quantitative Chemical Measurements of Vesicular Transmitters with Electrochemical Cytometry. Acc. Chem. Res. 2016, 49, 2347–2354. 10.1021/acs.accounts.6b00331. [DOI] [PubMed] [Google Scholar]
- Shin W.; Ge L.; Arpino G.; Villarreal S. A.; Hamid E.; Liu H.; Zhao W.; Wen P. J.; Chiang H.; Wu L. Visualization of Membrane Pore in Live Cells Reveals a Dynamic-Pore Theory Governing Fusion and Endocytosis. Cell 2018, 173, 934–945. e12 10.1016/j.cell.2018.02.062. [DOI] [PMC free article] [PubMed] [Google Scholar]
- Tooze S. A. Biogenesis of Secretory Granules in the trans-Golgi Network of Neuroendocrine and Endocrine Cells. Biochim. Biophys. Acta, Mol. Cell Res. 1998, 1404, 231–244. 10.1016/S0167-4889(98)00059-7. [DOI] [PMC free article] [PubMed] [Google Scholar]
- Arvan P.; Castle D. Sorting and Storage During Secretory Granule Biogenesis: Looking Backward and Looking Forward. Biochem. J. 1998, 332, 593–610. 10.1042/bj3320593. [DOI] [PMC free article] [PubMed] [Google Scholar]
- Myers M.; Forgac M. Mechanism and Function of Vacuolar Acidification. Physiology 1993, 8, 24–29. 10.1152/physiologyonline.1993.8.1.24. [DOI] [Google Scholar]
- Urbé S.; Dittié A. S.; Tooze S. A. PH-dependent Processing of Secretogranin II by the Endopeptidase PC2 in Isolated Immature Secretory Granules. Biochem. J. 1997, 321, 65–74. 10.1042/bj3210065. [DOI] [PMC free article] [PubMed] [Google Scholar]
- Johnson R. G. J. Accumulation of Biological Amines Into Chromaffin Granules: A Model for Hormone and Neurotransmitter Transport. Physiol. Rev. 1988, 68, 232–307. 10.1152/physrev.1988.68.1.232. [DOI] [PubMed] [Google Scholar]
Associated Data
This section collects any data citations, data availability statements, or supplementary materials included in this article.


