Abstract
The natural like and dislike of foods based on taste is one of the most easily observed behaviors in animals. Animals eat palatable foods and reject aversive foods, which makes measurement of taste perception possible using various behavioral techniques. Three different methods to accurately measure taste behavior are described here. First, two-bottle preference tests evaluate whether a taste compound (tastant) is preferred over water. Second, lickometer tests quantify the like and dislike for multiple concentrations of the same tastant or multiple tastants at the same time. Finally, conditioned taste aversion tests accurately determine the perceived taste threshold for palatable tastants. Together, these diverse methods enable researchers to observe and measure behavioral taste responses in mice to any tastant. 2016 by John Wiley & Sons, Inc.
Keywords: conditioned taste aversion, lickometer, two-bottle preference test, taste discrimination, taste behaviour, taste threshold
INTRODUCTION
Taste is the gateway to ingestion. Good-tasting, appetitive nutrients, including sugars, proteins, lipids, and low concentrations of salts, are consumed to maintain body homeostasis and ensure survival, whereas bad-tasting, aversive (bitter, sour), poisonous compounds are rejected to ensure survival. This natural avoidance and acceptance of foods based on taste enables researchers to accurately measure taste perception through observation of behavior alone, which is especially useful with animals that cannot verbally describe their taste perceptions. In this regard, there are both biological and technical concerns that must be considered in order to choose the most appropriate behavior paradigm to use to measure taste perception.
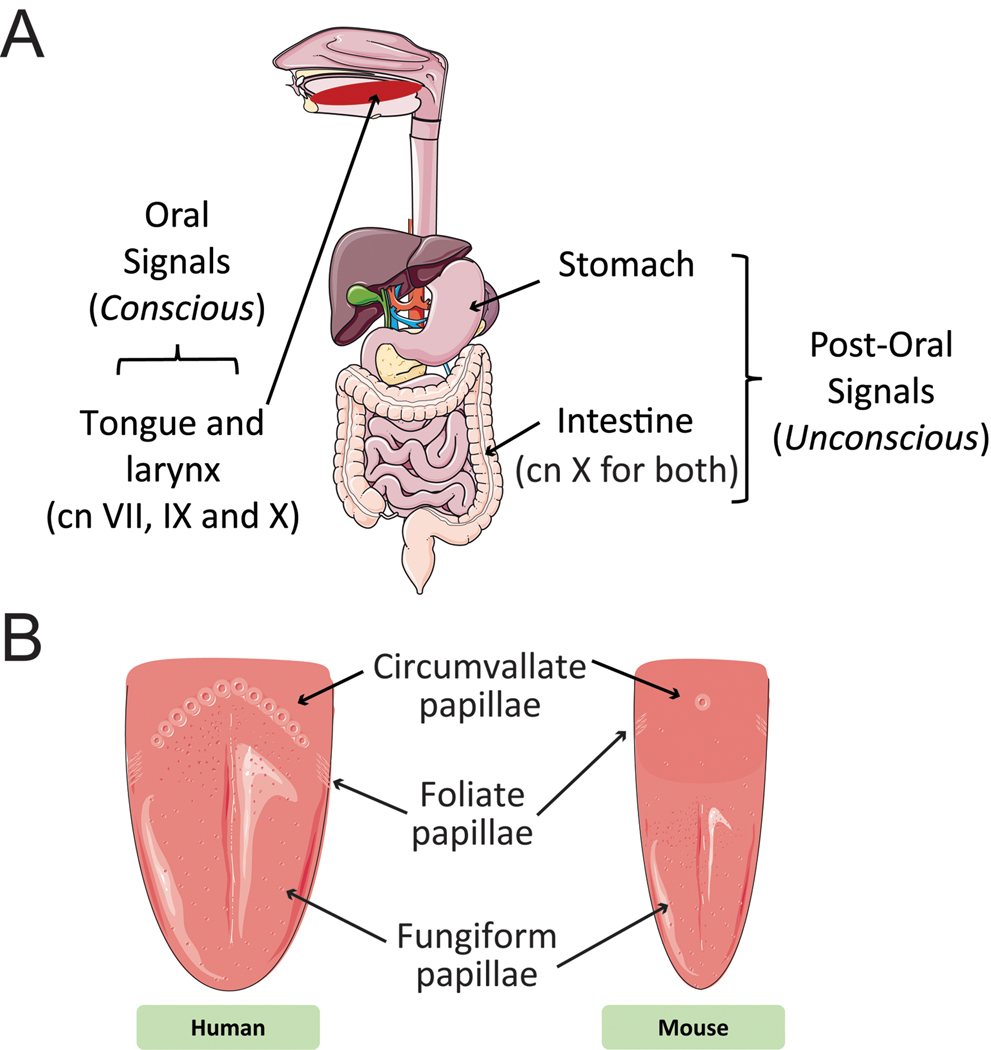
Biologically, the decision to eat or reject a taste compound (tastant) is dependent upon a multitude of conscious and unconscious factors. In particular, an ingested tastant stimulates receptors throughout the alimentary canal that are largely responsible for the perceived sensory qualities of food. The sensory neural signals generated by stimulation of these receptors are classified into two broad categories: oral (sensory signals triggered by the taste, texture, temperature, and smell of foods; conscious) and post-oral (sensory signals generated during digestion of ingested food components; unconscious; see Fig. 1A) (Zukerman et al., 2011).
Figure 1.
Sensory influences on behavioral taste preferences based on alimentary canal anatomy. (A) Sensory signals generated by ingestion and digestion of tastants are classified into oral (gustation and somesthesis) and post-oral signals. Gustatory signals are conscious signals generated by activation of chemically sensitive receptors in the tongue and larynx. These signals are carried to the brain by cranial nerves (cn) VII, IX, and X. Post-oral signals are unconscious signals generated by activation of chemically sensitive receptors in the stomach and intestine and are carried to the brain by cn X. (B) Tastants in the mouth activate receptors in taste buds located in three specialized structures within the tongue: circumvallate papillae in the posterior lingual epithelium, foliate papillae on the posterior lateral sides of the tongue, and fungiform papillae in the anterior two thirds of the tongue. Illustrations modified from Servier Medical Art (http://www.servier.com/Powerpoint-image-bank).
Oral signals are generated through the mastication of foods. The smell of volatile food components, including some tastants, can be detected orthonasally before ingestion. Tastants released through mastication can also be detected retronasally (circulating from the mouth to the olfactory epithelium via the nasopharynx), and somesthesis (texture, cold, heat, pain, etc.) is triggered by contact of food components with the oral mucosa. The body has the ability to detect five basic taste modalities (sweet, bitter, umami, salt, and sour/acid), and recently a sixth taste modality (fatty acids, i.e., lipid components) has been proposed (Stratford et al., 2006; Chale-Rush et al., 2007; Gaillard et al., 2008; Stratford and Contreras, 2010; Running et al., 2015; Besnard et al., 2016). Tastants are detected by an array of taste buds found mostly in taste papillae embedded in the tongue epithelium, and more sparsely in the palate as well as upper respiratory airways. Fungiform papillae occupy the anterior two thirds, and laterally positioned foliate papillae and centrally located circumvallate papillae organized in a V shape are found in the posterior tongue. Mice are distinct from humans in that they possess a single circumvallate papilla (Fig. 1B). Each taste bud is composed of a heterogeneous population of elongated cells that express a multitude of apical taste receptors. Binding of a tastant to specific receptors triggers an intracellular signaling cascade that in turn induces the firing of afferent nerve fibers to transmit the gustatory information to the brain. For a comprehensive description of the taste system, see Key References.
In contrast, post-oral signals often require further breakdown of ingested tastants through the digestive process before these particles can stimulate production of various peptides and hormones in the gut, including but not limited to GLP-1, cholecystokinin, and peptide YY (Tomé et al., 2009; Fig. 1A). Thus, the influence of post-oral signals is delayed compared to the immediate influence of oral signals on behavioral preferences for food.
These diverse signals are carried to the brain by several different cranial nerves. Oral signals are carried by four different nerves (Fig. 1A): two branches of the facial nerve (VII) carry taste sensations from the anterior two-thirds of the tongue (fungiform and most anterior foliate papillae) and palate; the glossopharyngeal nerve (IX) conveys taste signals from the posterior third of the tongue (circumvallate and most posterior foliate papillae; Yarmolinsky et al., 2009); and the superior laryngeal branch of the vagus nerve (X) carries sensations from the oropharynx (Konstantinidis, 2009). In contrast, post-oral signals are sent to the brain only by subdiaphragmatic vagal branches (X; Fig. 1A; Tomé et al., 2009). The various signals are processed by the brain to adjust eating behavior to the quality and quantity of nutrients ingested.
In addition to the sensory qualities of ingested tastants, learning also plays a role in food preference and choice, especially in close association with post-oral signals. The most important application for this association to assessing taste behavior in mice is the conditioned taste aversion paradigm. An animal learns to associate the taste of an ingested sapid solution with experimentally induced unpleasant post-oral malaise sensations (nausea, sickness, etc.), and subsequently chooses to avoid taste solutions that are then perceived as poisonous. Finally, in addition to sensory signals and learning, thirst and hunger can also impact food preference and choice. Because thirst is used in some of the protocols described below to induce a state of motivation in mice to drink test solutions in a short time, it is important to tightly control this parameter between conditions and experiments.
All of these influences must be weighed and considered carefully when choosing which method best meets the needs of a particular research project (see Strategic Planning).
This unit provides detailed methodology for three different behavioral paradigms used to reliably measure taste perception in mice: the two-bottle preference test (see Basic Protocol 1), lickometer test (brief-access, see Basic Protocol 2), and conditioned taste aversion test (see Basic Protocol 3). Each test has particular advantages and disadvantages, outlined in Table 1.
Table 1.
Characteristics, Sensitivity, and Utility of Behavioral Paradigms for Measuring Taste Perception
| Technique | Sensitivity | Taste vs. post-oral | Appetitive vs. aversive tastes | Time required | Water restriction required |
|---|---|---|---|---|---|
| Two-bottle test | Measures broad taste sensitivities (preference for tastant over water) | Both, depending on length of testing time and tastant used | Both | 4–5 daysa | <60 min: yes; >60 min: no |
| Lickometer | Measures preference for specific tastes, but not specific taste thresholds | Taste | Both | 4 daysa | Yes |
| Conditioned taste aversion | Measures specific taste thresholds | Taste | Appetitive | 7–14 daysb | Yes |
Depending on water training and number of concentrations/tastants tested.
Including conditioning, depending on protocol and number of concentrations tested.
STRATEGIC PLANNING
Four primary factors must be considered when selecting the appropriate behavioral taste paradigm:
-
1
Overall research goal (i.e., taste vs. post-oral; overall preference vs. discrete taste thresholds). For instance, does the experiment need to measure a behavior that is influenced only by orosensory signals (taste only) or a general ingestive behavior (taste and post-oral signals)? Is the goal to assess whether a mouse prefers a tastant, whether an experimental condition alters the preference for a tastant compared to a control condition (overall preference)? Is the goal to accurately measure a taste threshold (discrete taste threshold)?
-
2
Hedonic quality (i.e., appetitive vs. aversive) of the tastes to be tested.
-
3
Equipment available (i.e., lickometer or drinking bottles).
-
4
Amount of time and training needed to conduct each test, including how environmental conditions affect animal performance.
Some gustatory behavioral paradigms require little prior animal training, such as the two-bottle preference test, and can be completed in a relatively brief time (~4–5 days). Others require extensive training (i.e., lickometer and conditioned taste aversion; 4–14 days), which significantly increases the overall time needed to collect relevant data.
Moreover, a set of conditions that may be most effective for one researcher may not be optimal for another. Subtle differences in geographic location, environmental housing conditions, etc., may influence conditioned taste aversion testing as well as all behavioral taste preference testing in unintended and unknown ways. The overall key is to acknowledge that behavioral taste testing involves some trial and error (i.e., adjustment of experimental variables, such as water deprivation, tastant concentrations, test duration, etc.) to maximize the effectiveness of any given experiment. For more details, refer to the respective protocols and see Troubleshooting.
Additionally, after selection of the appropriate method, the experimenter must consider if the tastants to be tested can be detected via olfaction or somesthesis or both, and implement measures to minimize non-gustatory oral cues. If a tastant has olfactory and textural properties (e.g., fatty acids, oil), additional procedural measures may be considered. For instance, air circulation (fan, cage ventilation system) or the use of anosmic mice (zinc sulfate treatment; Takeda et al., 2001) minimizes or prevents olfactory cues, and substituting xanthan gum (Takeda et al., 2001; Gaillard et al., 2008), mineral oil (Martin et al., 2011), or both for water minimizes textural cues.
NOTE: All protocols using live animals must first be reviewed and approved by an Institutional Animal Care and Use Committee (IACUC) or must conform to governmental regulations regarding the care and use of laboratory animals.
NOTE: In all protocols, the solutions must be equilibrated to and used at room temperature.
BASIC PROTOCOL 1
THE SHORT-TERM TWO-BOTTLE PREFERENCE TEST
Because taste is a predominant component of ingestive behavior, the two-bottle test provides a broad measure of taste sensitivity, i.e., whether a tastant is preferred over water. The two-bottle preference test is a simple and cost-effective procedure to compare the intake of a test fluid to that of the control fluid. Short-term two-bottle tests (<5 min) reflect taste sensitivity better than longer term (>5 min) tests, which involve both gustatory and post-ingestive satiety cues that also modulate feeding behavior. However, the contribution of post-ingestive cues to feeding behavior (e.g., fluid intake) in long-term two-bottle tests can be minimized by utilizing tastants that are relatively inert in the gut, including artificial sweeteners, such as saccharin and the artificial sweet compound SC45647.
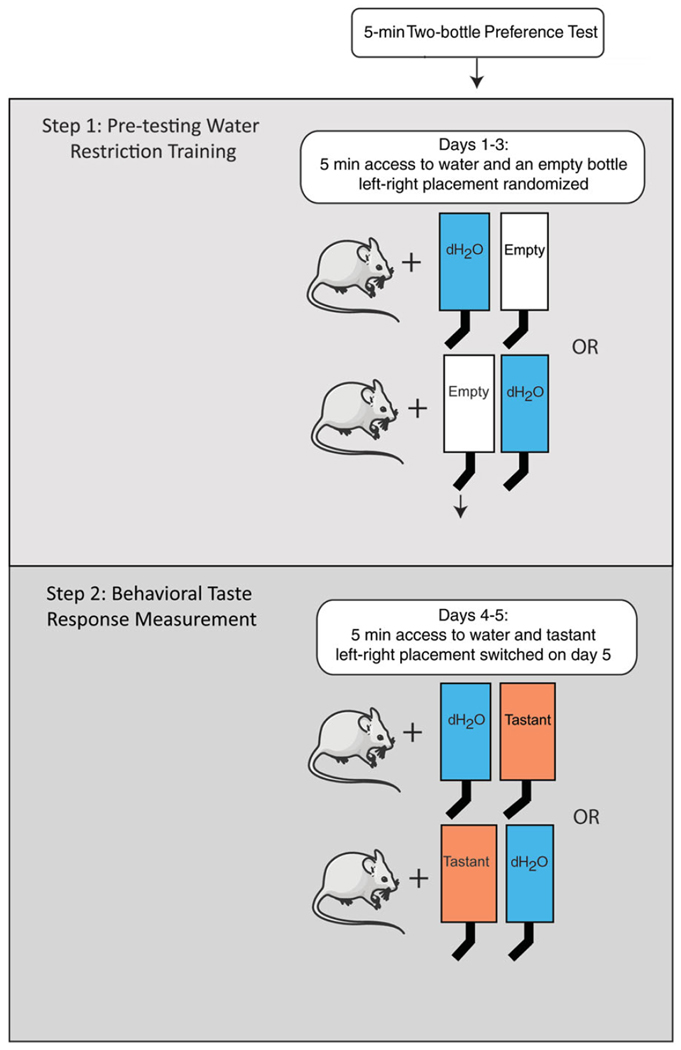
This protocol and Alternate Protocol 1 describe a 5-min test and a 48-hr test, respectively. In the first scenario, mice are presented with a bottle of water and a bottle of tastant for 5 min on the first day, and the positon of the bottle is switched the next day to account for side preference (Fig. 2). Mice are water-deprived overnight prior to each session to motivate them to drink during the short time frame. In a 48-hr test, mice are presented with a bottle of water and a bottle of tastant continuously for 48 hr, the position of the bottles being switched after 24 hr (Bachmanov et al., 2002).
Figure 2.
Protocol for short-term (5-min) two-bottle preference test. Step 1: Train water-restricted animals to drink within allotted time. Training is continued until animals reliably drink 3 ml within 5 min. Step 2: Two-bottle test response measurement. Illustrations modified from Servier Medical Art (http://www.servier.com/Powerpoint-image-bank).
Materials
Mouse subjects in home cages
Deionized water
Tastant solution(s) in deionized water
25-ml plastic serological pipets with 0.2-ml gradations
Fine handsaw blade or similar
Silicone tubing (7.94 mm i.d., 12.8 mm o.d.)
Scissors or a sharp cutting tool
Stainless steel sipper tubes (≥45 mm long, 7.94 mm o.d., ~2–3 mm hole diameter) Rubber stoppers (size 000)
Construct drinking bottles
-
1
For each mouse to be tested, prepare two 25-ml plastic pipets by cutting off both ends with a handsaw.
-
2
For each pipet, cut a 1.5- to 2-cm-long piece of silicone tubing with scissors or asharp cutting tool.
-
3
Insert the wider side of a sipper tube into a piece of silicone tubing and then into the end of each 25-ml pipet.
An assembled drinking bottle is shown in Figure 3. The design is adapted from (Bachmanov et al., 1996, 2002) and the Monell Mouse Taste Phenotyping Project (http://www.monell.org/MMTPP/). The rubber stopper is inserted once the bottle is filled with the desired solution.
The size of the sipper tube is important for accurate results. Mice have difficulty drinking viscous fluids (e.g., oil) if the hole is too small, and larger holes are prone to spillage (http://www.monell.org/MMTPP/).
Figure 3.
Assembled drinking bottle.
Day 0: Start water restriction
-
4
Remove water source 22–23 hr prior to first day of training.
Day 1: Start water training
-
5
Label the drinking bottles. Fill one with water and leave the other empty.
-
6
Insert the rubber stopper at the top end of each bottle.
-
7
Prime the sipper tube by removing air bubbles: lightly shake the drinking bottle with a finger on the sipper tube hole until no bubbles move up the solution.
-
8
Measure the volume of liquid in the water bottle.
-
9
Place a water bottle and an empty bottle in the home cage of each mouse, spaced 1.5 to 3 cm apart. For multiple tests/cages, randomize the left/right position.
-
10
At the end of 5 min, measure the fluid intake (i.e., the change in fluid volume).
-
11
After the training session, give mice ad libitum access to water until the water deprivation period for the next session begins (e.g., if mice are on 22 hr water restriction, give 2 hr access to water).
Days 2–3: Complete water training
-
12
12. Repeat steps 5–11 on consecutive days until all animals reliably consume at least 3 ml water in a 5-min training session, switching the left/right position of the bottles.
A minimum of two days of training is required; extra training days may be needed if the animals do not perform reliably during each presentation.
Days 4–5: Perform taste preference test
-
13
Label the bottles. Fill one with tastant solution and the other with water.
-
14
Prime bottles by removing air bubbles from the tube.
-
15
Measure the volume of liquid in each bottle.
-
16
Place both bottles in the home cages of mice, spaced 1.5 to 3 cm apart. Randomize the left/right position.
-
17
At the end of 5 min, measure the fluid intake.
-
18
After the testing session, give mice ad libitum access to water until the water deprivation period for the next session begins.
-
19
The following day, repeat steps 13–18, switching the left/right position of the bottles.
The same tastant, different concentrations of the same tastant, or a different tastant can be tested on subsequent days.
Analyze data
- 20
Figure 4.
Graphical representation of two-bottle preference data. (A) Average fluid intake for water and tastant. (B) Tastant intake normalized to water intake (preference score). A preference score of 50% indicates that equal amounts of water and tastant were consumed. A score <50% indicates that water was preferred over tastant, and a score >50% indicates that tastant was preferred over water.
The first method provides visualization of all behavioral data and may be useful if the amount of water consumed between experimental groups is different. The preference score graph is an ideal way to present data, as it instantly shows whether a fluid was preferred over water. A preference score >50% indicates that the tastant was preferred over water, and a preference score <50% indicates that water was preferred.
ALTERNATE PROTOCOL 1
THE LONG-TERM TWO-BOTTLE PREFERENCE TEST
The protocol for a 48-hr test is illustrated in Figure 5. For description and materials, see Basic Protocol 1.
Figure 5.
Protocol for long-term (48-hr) two-bottle preference test. Step 1: Train animals to drink from drinking bottles. Training is continued until animals reliably drink 3 ml within 24 hr. Step 2: Two-bottle test response measurement. Illustrations modified from Servier Medical Art (http://www.servier.com/Powerpoint-image-bank).
Construct drinking bottles
-
1
Construct drinking bottles as described (see Basic Protocol, steps 1–3).
Days 1–3: Perform water training
-
2
Label the drinking bottles and fill both with water.
-
3
Insert the rubber stopper at the top end of each bottle.
-
4
Prime the sipper tube by removing air bubbles: lightly shake the drinking bottle with a finger on the sipper tube hole until no bubbles move up the solution.
-
5
Measure the volume of liquid in each bottle.
-
6
Place both bottles in the home cage of a mouse, spaced 1.5 to 3 cm apart. Leave for 24 hr.
The bottles must be the only source of fluids available to the mice during water training.
-
7
Measure the fluid intake (i.e., the change in fluid volume) for each bottle.
-
8
Refill bottles with water and measure volume. Return bottles to the cage, switching the left/right position of the bottles. Leave for 24 hr.
-
9
Measure the fluid intake for each bottle.
Days 3–5: Perform taste preference test
-
10
Make taste solution in deionized water. Label the bottles and fill one with taste solution and the other with water.
-
11
Prime bottles by removing air bubbles from the tube.
-
12
Measure the volume of liquid in each bottle.
-
13
Place both bottles in the home cages of mice. Leave for 24 hr.
The bottles must be the only source of fluids available to the mice during testing.
-
14
Measure the fluid intake for each bottle.
-
15
Refill bottles and measure volume. Return bottles to the cage, switching the left/right position of the bottles. Leave for 24 hr.
-
16
Measure the fluid intake for each bottle.
The same tastant, or different concentrations of the same tastant, or even a different tastant can be tested again the following days.
Analyze data
-
17
Calculate and graph the results as described (see Basic Protocol 1, steps 20).
BASIC PROTOCOL 2
THE LICKOMETER TEST
The lickometer is a brief-access test that measures the number of licks an animal gives on a sipper tube. The ancestor of the lickometer as we know it today is the drinkometer, first described in 1952 (Stellar and Hill, 1952). Brief-access tests were developed to provide a more sensitive alternative to the two-bottle test for exploring the behavioral responses of a laboratory rodent to gustatory cues by minimizing post-ingestive and post-absorptive effects. In contrast to the two-bottle test, where fluid intake is measured continuously for several minutes to 48 hr, a brief-access test measures the licking behavior during 5- to 30-sec presentations, thereby limiting the amount of fluid ingested, which can trigger a satiety or toxicity response from the gut.
The protocol below uses the most common device, the Davis Rig MS-160 lickometer, which was originally developed by Drs. Ross Henderson and James Smith at Florida State University (Smith, 2001). The MS-160 lickometer consists of up to 16 bottles with stainless steel sipper tubes (Fig. 6A) mounted on a mobile rack (Fig. 6B). Mice are placed in a cage with a grounded stainless steel grid floor (Fig. 6C). A motorized shutter (Fig. 6D) opens to grant the rodent access to one drinking tube (Fig. 6E). The licking behavior is measured by recording the number of licks and the interval between licks through a contact circuit. Specifically, an undetectable small current (Gannon et al., 1992) passes through the sipper tube. A change in capacitance is induced by the contact of the tongue on the sipper tube and is recorded through an analog-to-digital converter and computer system. When the presentation time is over (usually 5 to 30 sec), the shutter closes and the rack moves to present a different bottle.
Figure 6.
The MS-160 Davis Rig lickometer. (A) Sipper tubes, (B) mobile bottle rack, (C) mouse cage, (D) motorized shutter, (E) mouse access to a drinking tube.
Figure 7 shows the general procedure. The example used throughout the protocol consists of five trial blocks with one bottle of water and three concentrations of compound SC45647. Mice are allowed to lick for 5 sec from the first lick (called a “trial”), with 7.5 sec access restriction between trials to bring the next bottle into position. The session is limited to a total time of 30 min (although some studies limit testing time to 20 min). Because the lick rate and ratio can vary between mouse strains (Boughter et al., 2002, 2007; Glendinning et al., 2005), it may be necessary to adjust trial parameters, either empirically or based on existing literature. In addition, a concentration series may be chosen and duration of trials may be adjusted based on the genetic back ground of the mice (see especially Boughter et al., 2002, 2007; Glendinning et al., 2005; Poole et al., 2015).
Figure 7.
Protocol for brief-access lickometer test. Step 1: Train water-restricted animals to reliably drink within allotted time. Training is continued until animals reliably drink within each 5-sec trial. Step 2: Brief-access lickometer test response measurement.
Materials
Mouse subjects
Deionized water
Tastant(s) to be tested
Davis Rig MS-160 lickometer with accessories and software (DiLog Instruments)
Sound-proof chamber (optional)
Fan (optional; to mask potential tastant smells) Microsoft Excel
Day 0: Start water restriction
-
1
Remove water source 16–24 hr prior to first day of training.
Mice must be deprived of water for 16–24 hr prior to testing to induce motivation to drink during short exposure times. It is recommended to water deprive the animals no longer than 16–20 hr for sweet tastants, as sweet compounds do not require as high a motivational state as do aversive compounds (Hallock et al., 2009). Duration of water deprivation periods may need to be adjusted empirically or based on existing literature (Boughter et al., 2007; Hallock et al., 2009; Tordoff et al., 2014, 2015; Poole et al., 2015; Vandenbeuch et al., 2015).
Day 1: Start water training
On day 1, the apparatus is set up and a single bottle of water is presented to the mouse in a 30-min trial to acclimate the mouse to the experimental set up.
Set up apparatus
-
2
Fill one glass lickometer bottle with water and insert the sipper tube into the bottle.
-
3
Prime the drinking tube by removing air bubbles: lightly shake the bottle upside down with a finger on the sipper tube hole until no bubbles move up the solution. Keep bottle upside down.
-
4
Place bottle in slot #1 on the mobile rack of the lickometer.
-
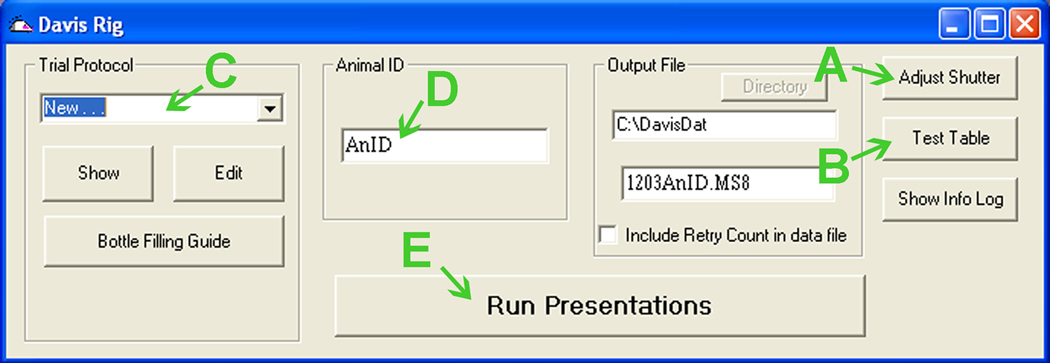
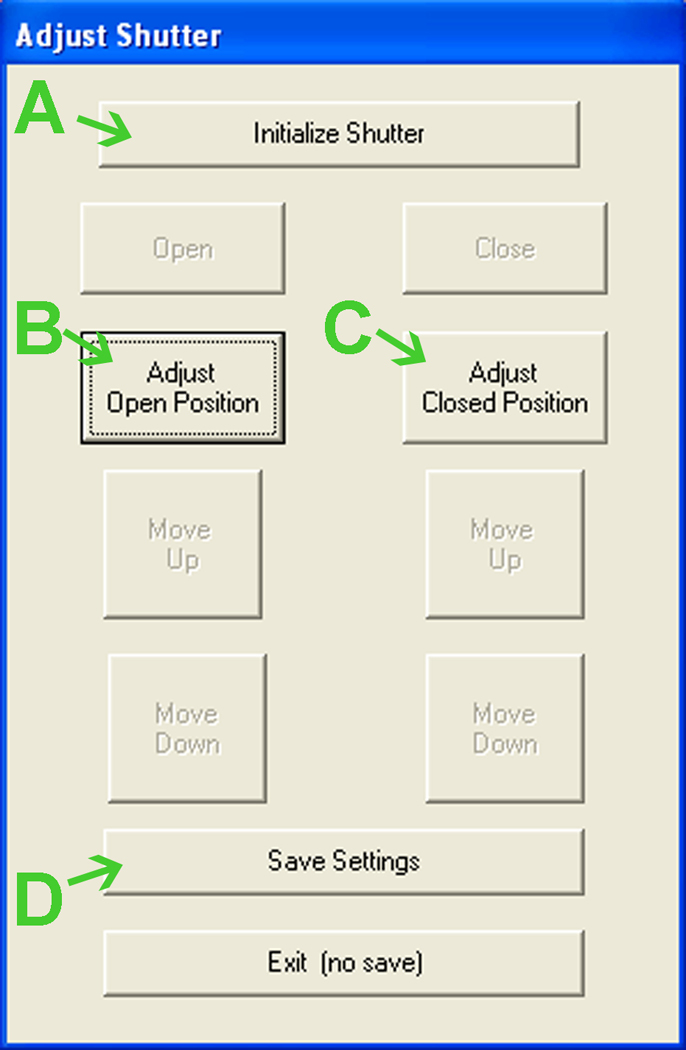
5Open the Davis Collect Data software. While the software starts, the shutter and table initialize. If the shutter is not in the correct position:
-
6
Click “Test Table” (Fig. 8B), then “Initialize” in the new window (Fig. 10A).
-
7Select the tube position (#1; Fig. 10B) and verify that the slot on the table aligns with the opening in the cage wall. Repeat for each tube position that will be used on subsequent days. If the table does not align properly:
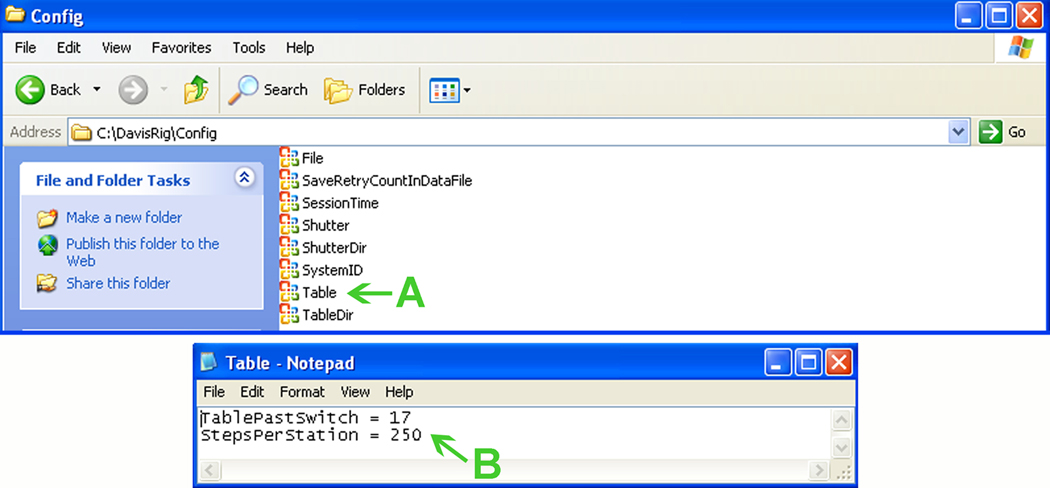
- Go to the \DavisRig\Config folder in the root of the computer, and double-click on the “Table” icon (Fig. 11A).
- Adjust the values for “TablePastSwitch” and “StepPerStation” (Fig. 11B) until the table slots align with the cage opening.
- Save the file document and then restart the Davis Rig software to validate the changes.
-
8
Verify that the slots on the table align with the opening in the cage wall. Repeat step7 if necessary. Click “Exit” (Fig. 10C).
Figure 8.
View upon opening Davis Collect Data software. See text for details.
Figure 9.
Adjusting Davis Rig shutter position. See text for details.
Figure 10.
Verifying Davis Rig table position. See text for details.
Figure 11.
Adjusting Davis Rig table position. See text for details.
Create trial parameters
-
9
Under “Trial Protocol”, select “New. . . ” (Fig. 8C) and then “Edit”.
-
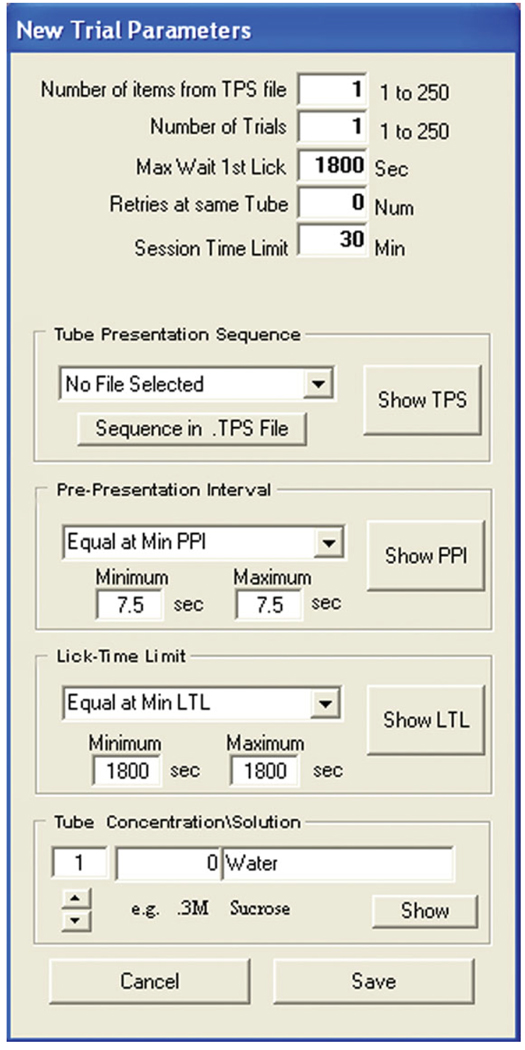
10Specify trial parameters (Fig. 12) as follows:
- Under “Tube Presentation Sequence”, choose “No File Selected”.
- Enter a “Pre-Presentation Interval” (inter-presentation time) of 7.5 sec.
- Enter a “Lick-Time Limit” of 1800 sec.
- For tube #1, enter the concentration (“0”) and solution (“Water”).
-
11
Click “Save”, enter a file name, and save in the \DavisRig\Parameters folder in the root of the computer.
Figure 12.
Creating a trial protocol in the Davis Collect Data software for day 1 of water training. See text for details.
Run presentation
-
12
Under “Trial Protocol”, select the saved file (Fig. 8C).
To verify that all parameters are set as desired, click “Show”.
-
13
Enter the mouse ID (Fig. 8D).
-
14
Place the water-restricted mouse in the cage and cover the cage with the lid.
-
15
Start the program by clicking “Run Presentations” (Fig. 8E).
-
16
When program is complete, save the experiment file.
The presentation sequence is now saved in the \Davis Dat folder in the root of the computer.
-
17
Give mouse ad libitum access to water until water deprivation for the next session begins (i.e., if mice are on 22 hr water restriction, give 1.5 hr access to water after the 30-min lickometer training session).
Day 2: Continue water training
On day 2, multiple bottles of water are presented using the same experimental procedure that will be used for tastants (e.g., five blocks of 5-sec trials with 7.5 sec between trials). To prevent a sequence bias caused by presenting solutions in the same order, a randomized presentation sequence must be created.
Create presentation sequence
-
18
Open the Davis Rig Randomize software.
-
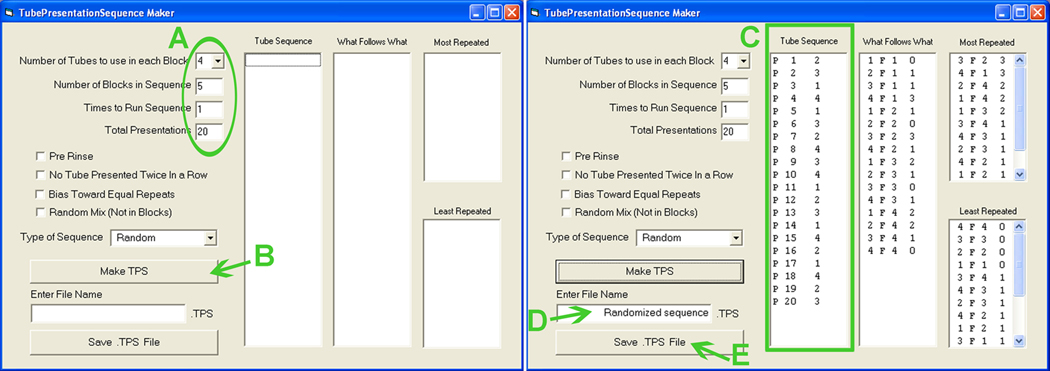
19
Fill in blanks (Fig. 13A) according to the desired experiment.
Figure 13.
Creating a randomized presentation sequence. See text for details.
The example shows randomization for four solutions presented five times.
-
e
Click “Make TPS” (Fig. 13B).
The tube sequence will appear to the right (Fig. 13C).
The presentation sequence is now saved in the \DavisRig\Parameters folder in the root of the computer.
Create trial parameters
-
21
Open Davis Collect Data software.
-
22
Under “Trial Protocol”, select “New. . . ” (Fig. 8C) and then “Edit”.
-
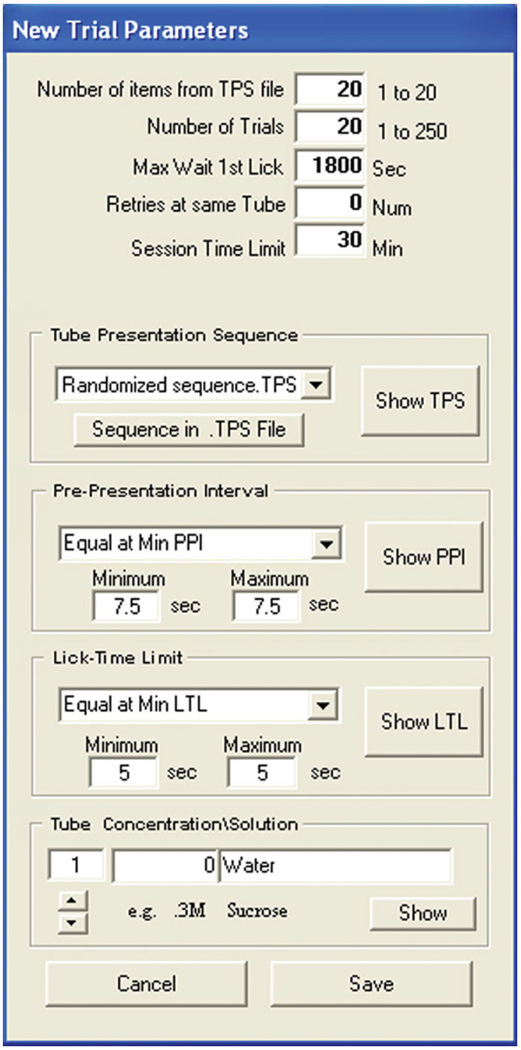
23Specify trial parameters (Fig. 14) as follows:
- Under “Tube Presentation Sequence”, click “Sequence in .TPS file” to select the previously created presentation sequence.
- Enter a “Pre-presentation Interval” (inter-presentation time) of 7.5 sec.
- Enter a “Lick-Time Limit” of 5 sec.
- For each tube number that will be used, enter the concentration and solution:
Tube Concentration Solution 1 0 Water 2 3 μM SC45647 3 10 μM SC45647 4 100 μM SC45647
Figure 14.
Creating a trial protocol in the Davis Collect Data software for days 2–3 of water training and day 4 of testing. See text for details.
In Figure 14, “Max Wait 1st Lick” defines the time the program has to wait for the first lick on the bottle presented before moving to the next step.
-
24
Click “Save”, enter a file name, and save in the \DavisRig\Parameters folder in the root of the computer.
Run presentation
-
25
Fill four glass lickometer bottles with water and insert the sipper tube into each bottle.
-
26
Prime drinking tubes by removing air bubbles: lightly shake each bottle upside down with a finger on the sipper tube hole until no bubbles move up the solution. Keep bottles upside down.
-
27
Place bottles in the desired slots on the mobile rack.
-
28
Repeat steps 5–8 and 12–17.
Day 3: Complete water training
-
29
If needed, repeat presentation as on day 2 (steps 26–29).
A minimum of two days of training is required; extra training days may be needed if the animals do not perform reliably during each trial.
Day 4: Measure taste response
-
30
Repeat presentation as on day 2 (steps 26–29), but fill only one bottle with water and the rest with the desired concentrations of tastant.
When testing several concentrations of an aversive tastant, one bottle of an appetitive (e.g., sweet) tastant should be included to maintain motivation.
If experimental design permits, repeat the presentation once more on day 5 for reproducibility purposes. Other tastants or concentrations (or both) can be tested on subsequent days.
Analyze data
-
31
Open Microsoft Excel and then click “Open Workbook”.
-
32
Select “Text Files” (Fig. 15A) followed by the experiment files (Fig. 15B), and then click “Open” (Fig. 15C).
Figure 15.
Opening lickometer data files in Microsoft Excel. See text for details.
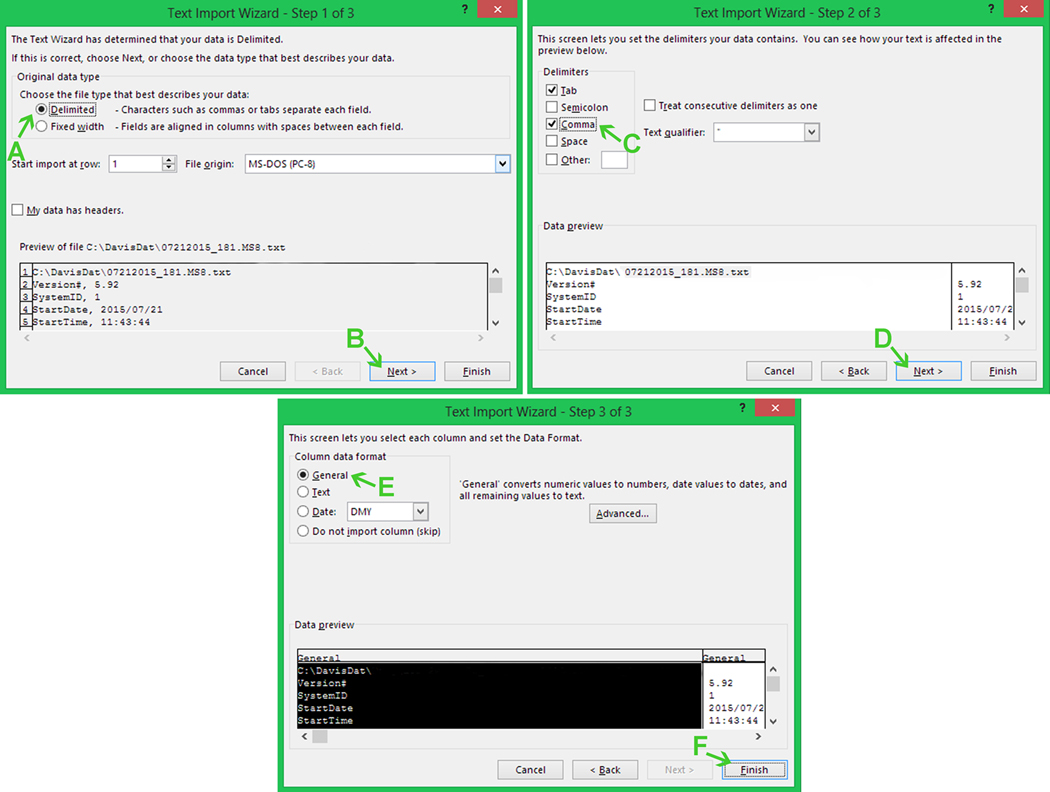
This opens the Text Import Wizard (Fig. 16).
Figure 16.
Opening lickometer data text files using the Excel Text Import Wizard. See text for details.
-
33
Select “Delimited” under “Original data type” (Fig. 16A) and then click “Next”(Fig. 16B).
-
34
Select “Comma” under “Delimiters” (Fig 16C) and then click “Next” (Fig. 16D).
-
35
Select “General” in the “Column data format” (Fig. 16E) and then click “Finish” (Fig. 16F).
-
36
Once the data are downloaded and opened in Excel, calculate the average number of licks for water and each concentration of tastant.
All trial blocks may not be included in the calculation of lick averages. For both appetitive and aversive tastants, the high motivational state during the first block(s) may induce mice to maximally lick both water and tastants, whereas the last block(s) may reflect learning mainly due to post-ingestive detection of the tested compounds. Therefore, it is common to omit the first and last presentation blocks prior to averaging (here, averaging only blocks 2–4). However, comparison of the latency to initiate the first lick between presentation trials is a useful tool to determine whether the last block(s) can be included in the data analysis. Latency to initiate the first lick can be calculated from the Inter Licking Intervals found in the matrix below the lick numbers table in the data files. More information can be found in Hallock et al. (2009).
- 37
Figure 17.
Graphical representation of lickometer data. (A) Fluid intake presented as the average number of licks. (B) Lick response to tastant normalized to lick response to water (lick ratio). A lick ratio of 1 indicates that equal amounts of water and tastant were consumed. A lick ratio <1 indicates that water was preferred over tastant, and a lick ratio >1 indicates that tastant was preferred over water.
The first method provides visualization of all behavioral data. However, if water intake is inconsistent across all animals, the lick ratio graph is an ideal way to represent data as it normalizes fluid intake as a function of water intake. Moreover, it instantly shows whether or not a tastant was preferred. A lick ratio of 1 means that a mouse consumed equal amounts of water and tastant. A lick ratio >1 indicates that the tastant was preferred over water, and a lick ratio of <1 indicates that water was preferred.
Data analysis using a standardized lick ratio (which controls for individual differences in local lick rate) may be useful, e.g., when the licking response to water is almost as strong as the licking response to a tastant. A detailed description for calculation of the standardized lick ratio can be found in Glendinning et al., (2002) and Grobe and Spector (2008).
BASIC PROTOCOL 3
THE CONDITIONED TASTE AVERSION TEST USING A TWO-BOTTLE PARADIGM
The conditioned taste aversion behavioral paradigm relies on the simple fact that animals (including humans) will actively reject foods that previously made them feel ill, referred to as “malaise” in animals (Garcia et al., 1955; Bernstein and Webster, 1980). In other words, animals avoid eating foods that may harm them (Kalat and Rozin, 1973), and rely on taste to distinguish between potentially poisonous and safe foods. Because avoidance of specific tastes is so important for survival, animals are especially proficient at detecting a taste that previously caused malaise at concentrations much lower than those behaviorally preferred. This evolutionary behaviour can be exploited to measure discrete taste thresholds in mice by pairing a high concentration of a tastant with a substance that causes the animal to experience malaise. The threshold for taste perception for a specific taste can be measured by allowing mice to consume various concentrations of the tastant. The concentration at which the mice no longer avoid drinking a tastant indicates the approximate taste threshold for the tastant.
The conditioned taste aversion test has two main limitations. First, it is most accurate to measure perceived taste thresholds for appetitive taste qualities. Second, the protocol requires additional conditioning and training time as compared to other behavioral taste paradigms, such as the two-bottle and lickometer tests. However, these limitations are offset by the test’s flexibility, as it can be done using either a modified two-bottle preference test or lickometer paradigm depending on equipment and time constraints. If lickometer equipment is not available, or if the experiment to be conducted does not have specific time constraints (e.g., can be completed in 10 days, rather than 8), a two-bottle preference test can be used, as described below. If lickometer equipment is available and the experiment must be completed in the shortest amount of time possible, lickometer testing can be used (see Alternate Protocol 2).
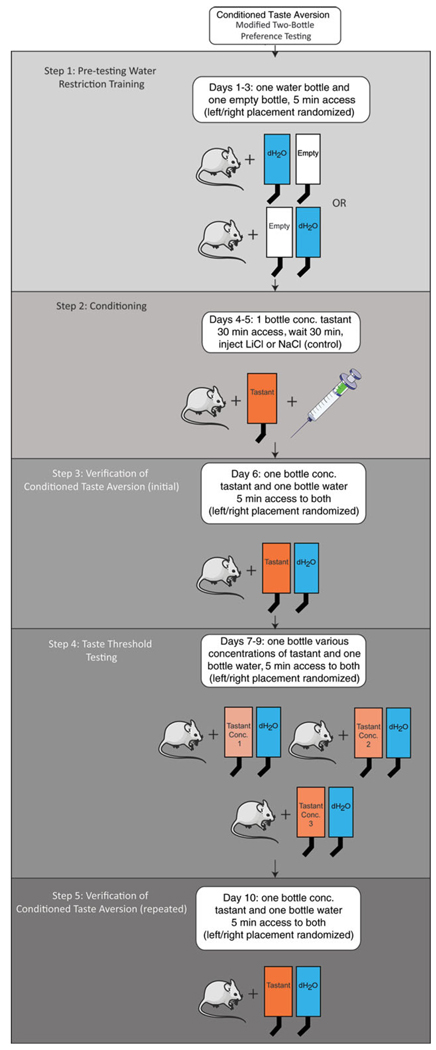
The following protocol is illustrated in Figure 18. The initial steps use the two-bottle methodology (see Basic Protocol 1) to train animals to reliably consume at least 3 ml water in 5 min to minimize post-oral detection of ingested fluids. The conditioning methodology is adapted from Stratford et al. (2006).
Figure 18.
Protocol for conditioned taste aversion using the modified two-bottle preference test. Step 1: Train water-restricted animals to reliably drink within allotted time. Continue until animals reliably drink 3 ml in 30 min. Step 2: Pair exposure to high concentration of tastant with malaise (by injection of LiCl) to generate a conditioned aversion to the tastant. Step 3: Confirm that animals acquired conditioned aversion. Step 4: Measure tastant perception threshold (concentration at which LiCl-injected animals fail to avoid the tastant). Step 5: Verify that animals still show a conditioned aversion to the high tastant concentration. Illustrations modified from Servier Medical Art (http://www.servier.com/Powerpoint-image-bank).
Materials
225 mM LiCl (Sigma-Aldrich, cat. no. 310468)
150 mM NaCl (Sigma-Aldrich, cat. no. S7653)
Varying concentrations of single tastant in deionized water 1 ml Luer-Lock syringes with 25-G hypodermic needles
Additional reagents and equipment for two-bottle preference test (see Basic Protocol 1)
Construct drinking bottles
-
1
Construct drinking bottles as described (see Basic Protocol 1, steps 1–3).
Days 0–3: Perform water training
-
2
Carry out water restriction (see Basic Protocol 1, step 4) and day 1 of water training (see Basic Protocol 1, steps 5–11) as described.
-
3
Repeat training on days 2 and 3, reducing the access time to 5 min each day. Continue until all animals reliably consume at least 3 ml water in a 5-min training session.
A minimum of two days is required; extra training days may be needed if the animals do not perform reliably during each presentation.
Days 4–5: Perform conditioning
-
4
Fill one drinking bottle with a high concentration of tastant, record the volume, and place it in the home cage.
The tastant concentration used for conditioning should be one that is known to produce a reliable behavioral preference based on previous studies.
-
5
Remove bottle after 30 min and measure the fluid intake.
The bottles are left on the cage for a longer period of time (i.e., 30 min vs. 5 min) to ensure that the tastant stimulates both oral and post-oral sensory signals, which are required for successful conditioned taste aversion acquisition.
-
6
Wait 30 min.
During this time, prepare syringes containing LiCl and NaCl.
-
7
Inject half the mice intraperitoneally with 225 mM LiCl (0.1 ml/10 g body weight) and inject the remaining mice with 150 mM NaCl (0.1 ml/10 g body weight) as a control.
-
8
Observe all mice for signs of malaise (lying flat on their bellies, moving slowly, coprophagia) for 45 min post-injection.
These signs provide an indirect indication of the efficacy of LiCl and should appear within 5–10 min after a successful injection.
-
9
Give mice ad libitum access to water until the water deprivation period for the next session begins.
-
10
Repeat steps 4–9 on day 5.
Day 6: Verify conditioned taste aversion
-
11
Fill one drinking bottle with the same concentration of a tastant used for conditioning and one bottle with water. Record the volume and place bottles in the home cage (left/right order randomized).
-
12
Remove bottle after 5 min and measure the fluid intake.
-
13
Give mice ad libitum access to water until the water deprivation period for the next session begins.
-
14
If any of the LiCl-injected animals consume any of the tastant, remove them from the rest of the experiment, as this indicates that conditioning was not successful.
Days 7–9: Perform threshold testing
-
15
Repeat steps 11–13 for three days using a different concentration of tastant each day, with order of concentrations tested randomized.
The taste threshold is the concentration at which animals no longer avoid drinking the tastant and consume approximately equal amounts of water and tastant (i.e., when the preference score is ~50%). Although there is no agreed-upon, standardized method for selection of tastant concentrations to test, a general rule of thumb is to choose concentrations based on a logarithmic scale. If the criterion for the taste threshold is not met within the testing time (i.e., three days), continue with additional decreased concentrations until the criterion is met.
Day 10: Reverify conditioned taste aversion
-
16
Repeat steps 11–13 once more using the same concentration used for conditioning. Remove any LiCl-injected animals that consume any of the tastant.
Analyze data
-
17
Graph results for both LiCl-treated and control animals using one of the methods described (see Basic Protocol 1, step 20; see Figs. 19A,B).
Figure 19.
Graphical representation of conditioned taste aversion data. Two-bottle preference data can be presented as unmodified (raw) water and tastant intake (A) or as a preference score (B). Lickometer data can be graphed as the number of licks in 5 sec (raw intake; C) or as a lick ratio (D). For all graphs, the concentration at which NaCl- and LiCl-injected animals have similar intakes, preference scores, or lick ratios indicates the approximate detection threshold for the tastant. Cond. Conc.: conditioning tastant concentration.
ALTERNATE PROTOCOL 2
THE CONDITIONED TASTE AVERSION TEST USING A LICKOMETER PARADIGM
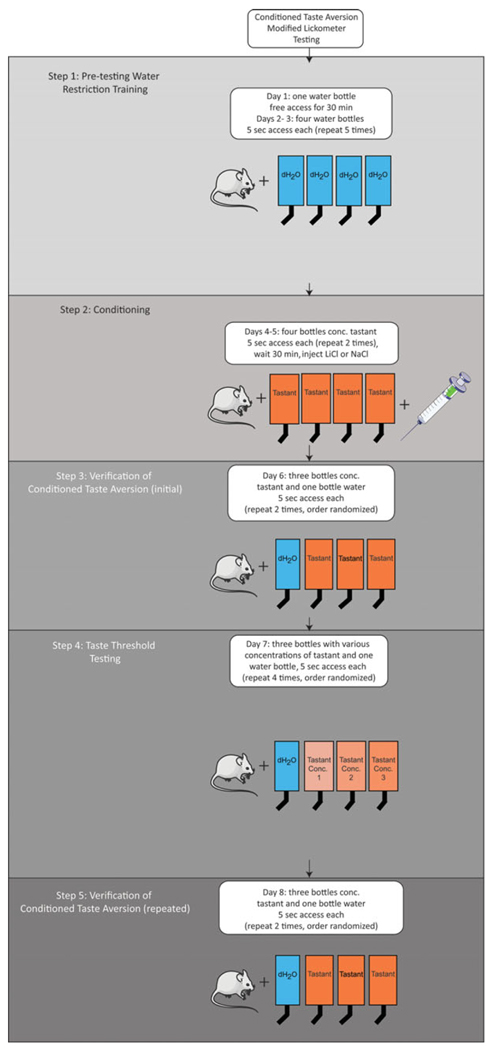
The following protocol is illustrated in Figure 20. The initial steps use the lickometer methodology (see Basic Protocol 2) to train animals to reliably drink fluids in a 5-sec trial. The conditioning methodology is adopted from Eddy et al. (2009, 2012). All materials are listed in Basic Protocols 2 and 3.
Figure 20.
Protocol for conditioned taste aversion using the modified lickometer test. Step 1: Train water-restricted animals to reliably drink within allotted time. Continue training until animals reliably drink within each 5-sec trial. Step 2: Pair exposure to high concentration of tastant with malaise (by injection of LiCl) to generate a conditioned aversion to the tastant. Step 3: Confirm that animals acquired conditioned aversion. Step 4: Measure tastant perception threshold (concentration at which LiCl-injected animals fail to avoid the tastant). Step 5: Verify that animals still show a conditioned aversion to the high tastant concentration. Illustrations modified from Servier Medical Art (http://www.servier.com/Powerpoint-image-bank).
Days 0–3: Perform water restriction training
-
1
Carry out water restriction on the day before training as described (see Basic Protocol 2, step 1).
-
2
On day 1, place one glass bottle containing water in the lickometer and carry out the first training with a 30-min access period (shutter open) as described (see Basic Protocol 2, steps 2–17).
-
3
On day 2, place four glass bottles containing water in the lickometer and carryout the second training, giving each mouse 5 sec access to each bottle (see Basic Protocol 2, steps 18–29). Repeat 5 times.
The bottle presentation order is randomized.
-
4
On day 3, repeat step 3. If needed, repeat steps 3 and 4 until mice reliably lick within each of the 5-sec trials.
Days 4–5: Perform conditioning
-
5
Fill four glass lickometer bottles with a high concentration of tastant and place in the lickometer.
The tastant concentration used for conditioning should be one that is known to produce a reliable behavioral preference based on previous studies.
-
6
Give mice 5 sec access to each bottle (bottle presentation order randomized). Repeat twice (8 trials total).
-
7
Wait 30 min.
The bottles are left on the cage for a longer period of time (i.e., 30 min vs. 5 min) to ensure that the tastant stimulates both oral and post-oral sensory signals, which are required for successful conditioned taste aversion acquisition.
During this time, prepare syringes containing LiCl and NaCl.
-
8
Inject half the mice intraperitoneally with 225 mM LiCl (0.1 ml/10 g body weight) and the other half with NaCl (0.1 ml/10 g body weight) as a control.
-
9
Observe all mice for signs of malaise (lying flat on their bellies, moving slowly, coprophagia) for 45 min post-injection.
These signs provide an indirect indication of the efficacy of LiCl and should appear with 5–10 min after a successful injection.
-
10
Give mice ad libitum access to water until the water deprivation period for the next session begins.
-
11
Repeat steps 5–10 on day 5.
Day 6: Verify conditioned taste aversion
-
12
Fill three glass lickometer bottles with the same concentration of tastant used for conditioning and one bottle with water. Place all bottles in the lickometer.
A water bottle is included to encourage the animal to continue drinking throughout the course of testing.
-
13
Give each mouse 5 sec access to each of the bottles (bottle presentation order randomized). Repeat twice (8 trials total).
-
14
Give mice ad libitum access to water until the water deprivation period for the next session begins.
-
15
If any of the LiCl-injected animals consume any of the tastant, remove them from the rest of the experiment, as this is an indication that conditioning was not maintained throughout the course of the experiment (a.k.a. extinction).
Day 7: Perform threshold testing
-
16
On day 7, fill three glass lickometer bottles with different concentrations of tastant (other than the concentration used for conditioning) and one bottle with water. Place all bottles in the lickometer.
-
17
Give each mouse 5 sec access to each of the bottles (bottle presentation order randomized). Repeat four times (16 trials total).
The taste threshold is the concentration at which animals no longer avoid drinking the tastant and consume approximately equal amounts of water and tastant (i.e., when the lick ratio is ~1). Although there is no agreed-upon, standardized method for selection of tastant concentrations to test, a general rule of thumb is to choose concentrations based on a logarithmic scale. If the criterion for the taste threshold is not met with the concentrations used, additional concentrations may be added using additional bottles. Continue with additional decreased tastant concentrations until the criterion is met.
-
18
Give mice ad libitum access to water until the water deprivation period for the next session begins.
If experimental design permits, repeat steps 16–18 the following day for reproducibility.
Day 8: Reverify conditioned taste aversion
-
19
Repeat steps 12–15 using the same concentrations used for conditioning. Remove any LiCl-injected animals that consume any of the tastant.
Analyze data
-
20
Open data in Microsoft Excel and calculate the average number of licks for water and each concentration of tastant (see Basic Protocol 2, steps 32–37).
-
21
Graph results for both LiCl-treated and control animals using one of the methods described (see Basic Protocol 2, step 38; see Figs. 19C,D).
COMMENTARY
Background Information
Two-bottle test
The protocol above describes the making of drinking tubes as an economic way to complete a two-bottle preference test. Alternatively, one can use regular static cage drinking bottles, provided that the drinking hole size remains in an acceptable range (see discussion in protocol). Although they require larger volumes of fluid, regular bottles are easy to use and readily available in a laboratory environment. However, graduations on regular drinking bottles are not accurate, and thus the amount of fluid ingested should be measured by weighing the bottle and its content before and after the test (1 g = 1 ml).
As described above, two-bottle tests can be carried out for a short time (<5 min) to minimize post-ingestive regulation of feeding behavior. For short-term tests, water deprivation (22–23 hr prior to each presentation) is necessary to motivate the animal to drink during the allocated time frame, and training to drink from bottles may be extended beyond two days before presenting a tastant.
Brief-access lickometer test
The example in the protocol above includes one bottle of water and three bottles of various concentrations of one tastant. Users can extend the testing protocol by using up to 16 bottles with more concentrations or different tastants or both. However, adding more bottles causes the mice to reach satiety faster, and thus fewer presentation trials are possible, resulting in fewer data points to average.
This protocol uses the Davis Rig MS-160 lickometer, but can be easily adapted to other home-made and commercially available lick-ometers. A very simple and low-cost solution involves the use of a simple drinking bottle with a stainless steel sipper tube, aluminum foil, an analog-to-digital converter, and a computer (Hayar et al., 2006). This system is based on the first drinkometer (Stellar and Hill,1952) and later versions (Davis, 1961). However, it does not allow automated presentation of multiple solutions.
Private companies have also developed their own lickometer systems utilizing various types of sensor, including optical, electrical, and force sensors. These companies sell ready-to-use setups as well as parts for customizing your own setup. A quick online search will provide multiple options.
Additionally, Alan Spector and collaborators at Florida State University developed a new gustometer that presents the advantage of delivering very precise and smaller fluid volumes per lick (~1 μl vs 1.8–2 μl with the MS-160), delaying satiation and allowing more trials per session. This gustometer is not yet commercially available, but parts, dimensions, and schematics for electronic circuits are detailed in Spector et al. (2015).
Conditioned taste aversion test
The two main challenges of a conditioned taste aversion protocol are getting the animals to consume fluids in a discrete amount of time and ensuring that LiCl-injected animals maintain a conditioned aversion to the high tastant concentration throughout testing. Tips to troubleshoot these problems are discussed below (see Troubleshooting).
The other practical concern is being able to reliably and efficiently inject LiCl into the abdomen of mice. Although intraperitoneal injections are not especially difficult, it is important to practice prior to the start of the experiment, especially for researchers who have never done this type of injection. One approach is to do all of the NaCl injections first to become proficient, and then transition to the LiCl injections.
As mentioned previously, the main limitation of this technique is that it is most effective for measuring taste thresholds for appetitive tastes. Thus, other methodologies, such as a gustometer (Spector et al., 2015) may be more effective to measure taste thresholds of aversive stimuli.
Critical Parameters
As described in the Introduction, there are three things to consider when choosing between the various tests: (1) the amount of time and training needed to conduct each test, (2) the available equipment (lickometer or drinking bottles), and (3) the sensitivity of the measurement (0.1 ml volume vs. licks). It takes ~5–6 days to complete a two-bottle test vs. ~4 days for a lickometer test. For conditioned taste aversion tests, it takes ~11 days for modified two-bottle preference tests vs. ~8 days for modified lickometer tests.
In conditioned taste aversion tests, regardless of the method used (two-bottle vs. lickometer), LiCl-injected animals should consume more water than tastant at most concentrations tested, as the concentration at which animals no longer avoid drinking the tastant indicates the taste threshold.
Troubleshooting
Two-bottle test
Problem: Some mice will not drink water in 5 min during water-restriction training. Solution: Extend the number of training days or the water deprivation period or both.
Brief-access lickometer test
Problem: Mice will not drink water during water-restriction training in the lickometer. Solution: Extend training days or include an appetitive tastant (such as sucrose) in place of one of the water bottles during training or both.
Problem: Mice drink maximally throughout all trials in the lickometer. Solution: Decrease the time of water restriction depending on the tastant tested, or increase the trial duration beyond 5 sec (e.g., 7.5 sec), or both. Other researchers report using a range of water restriction lengths from 16 to 24 hr (Boughter et al., 2007; Hallock et al., 2009; Tordoff et al., 2014, 2015; Poole et al., 2015; Vandenbeuch et al., 2015).
Problem: Data are not consistent between animals, not reproducible. Solution: Repeat the presentation on day 5 to acquire more an-alyzable data for the same mice and solutions.
Conditioned taste aversion test
Tips for training animals to drink within 5 min (in two-bottle tests) or 5 sec (in lick-ometer) are outlined in Basic Protocols 1 and 2. The above troubleshooting points for the two bottle and lickometer tests apply when these tests are modified for conditioned taste aversion. Two additional problems are:
Problem: Conditioning is not effective in LiCl-injected animals (i.e., some LiCl-treated animals do not avoid consuming the high concentration of tastant). Solutions: (1) Purchase a new lot of powdered LiCl and verify calculations for making 225 mM LiCl and for determining injection volumes. (2) Try an alternative concentration or injection volume of LiCl. Other researchers have used a less concentrated dose (e.g., 150 mm LiCl at 2.0 mEq/kg; Hashimoto and Spector, 2014; Schier et al., 2016). (3) Verify that the concentration of tastant used for conditioning is detectable behaviorally by mice using other behavioral taste paradigms, such as two-bottle preference tests and lickometer tests.
Problem: LiCl-injected animals do not maintain a conditioned aversion throughout the course of the experiment (i.e., LiCl-injected animals fail to avoid the high tastant concentration on the final day of testing). Solutions: (1) Verify that the concentration of tastant used for conditioning is detectable behaviorally (see above). (2) Increase the concentration of tastant used for conditioning, if possible (the concentration used must be still preferred behaviorally).
Anticipated Results
Detailed and illustrated results are described in the protocols (see Basic Protocol 1, step 20; see Basic Protocol 2, step 38; see Basic Protocol 3, step 17).
Time Considerations
See the Critical Parameters section for details on time requirements.
Acknowledgments
This work was supported by NIH grants to Dr. Thomas E. Finger (5R01DC012931-03), Dr. Linda Barlow (R01DC012383), and the Rocky Mountain Taste and Smell Center (P30 DC04657).
Literature Cited
- Bachmanov AA, Tordoff MG, and Beauchamp GK 1996. Ethanol consumption and taste preferences in C57BL/6ByJ and 129/J mice. Alcohol.Clin.Exp.Res.20:201–206. doi: 10.1111/j.1530-0277.1996.tb01630.x. [DOI] [PMC free article] [PubMed] [Google Scholar]
- Bachmanov AA, Reed DR, Beauchamp GK, and Tordoff MG 2002. Food intake, water intake, and drinking spout side preference of 28 mouse strains. Behav. Genet. 32:435–443. doi: 10.1023/A:1020884312053. [DOI] [PMC free article] [PubMed] [Google Scholar]
- Bernstein IL and Webster MM 1980. Learned taste aversions in humans. Physiol. Behav. 25:363–366. doi: 10.1016/0031-9384(80)90274-7. [DOI] [PubMed] [Google Scholar]
- Besnard P, Passilly-Degrace P, and Khan NA 2016. Taste of fat: A sixth taste modality? Physiol. Rev. 96:151–176. doi: 10.1152/physrev.00002.2015. [DOI] [PubMed] [Google Scholar]
- Boughter JD Jr., St John SJ, Noel DT, Ndubuizu O, and Smith DV 2002. A brief-access test for bitter taste in mice. Chem. Senses 27:133–142. doi: 10.1093/chemse/27.2.133. [DOI] [PubMed] [Google Scholar]
- Boughter JD, Baird JP, Bryant J, John SJ St., and Heck D 2007. C57BL/6J and DBA/2J mice vary in lick rate and ingestive microstructure. Genes Brain. Behav. 6:619–627. doi: 10.1111/j.1601-183X.2006.00293.x. [DOI] [PubMed] [Google Scholar]
- Chale-Rush A, Burgess JR, and Mattes RD 2007. Evidence for human orosensory (taste?) sensitivity to free fatty acids. Chem. Senses 32:423–431. doi: 10.1093/chemse/bjm007. [DOI] [PubMed] [Google Scholar]
- Davis JD 1961. Electric drinkometer and recorder. J. Exp. Anal. Behav. 4:145–147. doi: 10.1901/jeab.1961.4-145. [DOI] [PMC free article] [PubMed] [Google Scholar]
- Eddy MC, Eschle BK, Barrows J, Hallock RM, Finger TE, and Delay ER 2009. Double P2X2/P2X3 purinergic receptor knockout mice do not taste NaCl or the artificial sweetener SC45647. Chem. Senses 34:789–797. doi: 10.1093/chemse/bjp068. [DOI] [PMC free article] [PubMed] [Google Scholar]
- Eddy MC, Eschle BK, Peterson D, Lauras N, Margolskee RF, and Delay ER 2012. A conditioned aversion study of sucrose and SC45647 taste in TRPM5 knockout mice. Chem. Senses 37:391–401. doi: 10.1093/chemse/bjr093. [DOI] [PMC free article] [PubMed] [Google Scholar]
- Gaillard D, Laugerette F, Darcel N, El-Yassimi A, Passilly-Degrace P, Hichami A, Khan NA, Montmayeur JP, and Besnard P 2008. The gustatory pathway is involved in CD36-mediated orosensory perception of long-chain fattyacidsinthemouse.Faseb.J.22:1458–1468. doi: 10.1096/fj.07-8415com. [DOI] [PubMed] [Google Scholar]
- Gannon KS, Smith JC, Henderson R, and Hendrick P 1992. A system for studying the microstructure of ingestive behavior in mice. Physiol. Behav. 51:515–521. doi: 10.1016/0031-9384(92)90173-Y. [DOI] [PubMed] [Google Scholar]
- Garcia J, Kimeldorf DJ, and Koelling RA 1955. Conditioned aversion to saccharin resulting from exposure to gamma radiation. Science 122:157–158. doi: 10.1126/science.122.3160.157. [DOI] [PubMed] [Google Scholar]
- Glendinning JI, Gresack J, and Spector AC 2002. A high-throughput screening procedure for identifying mice with aberrant taste and oromotor function. Chem. Senses 27:461–474. doi: 10.1093/chemse/27.5.461. [DOI] [PubMed] [Google Scholar]
- Glendinning JI, Chyou S, Lin I, Onishi M, Patel P, and Zheng KH 2005. Initial licking responses of mice to sweeteners: Effects of Tas1r3 polymorphisms. Chem. Senses 30:601–614. doi: 10.1093/chemse/bji054. [DOI] [PubMed] [Google Scholar]
- Grobe CL and Spector AC 2008. Constructing quality profiles for taste compounds in rats: A novel paradigm. Physiol. Behav. 95:413–424. doi: 10.1016/j.physbeh.2008.07.007. [DOI] [PubMed] [Google Scholar]
- Hallock RM, Tatangelo M, Barrows J, and Finger TE 2009. Residual chemosensory capabilities in double P2X2/P2X3 purinergic receptor mull mice: Intraoral or postingestive detection? Chem. Senses 34:799–808. doi: 10.1093/chemse/bjp069. [DOI] [PMC free article] [PubMed] [Google Scholar]
- Hashimoto K and Spector AC 2014. Extensive lesions in the gustatory cortex in the rat do not disrupt the retention of a presurgically conditioned taste aversion and do not impair unconditioned concentration-dependent licking of sucrose and quinine. Chem. Senses 39:57–71. doi: 10.1093/chemse/bjt054. [DOI] [PMC free article] [PubMed] [Google Scholar]
- Hayar A, Bryant JL, Boughter JD, and Heck DH 2006. A low-cost solution to measure mouse licking in an electrophysiological setup with a standard analog-to-digital converter. J. Neurosci. Methods 153:203–207. doi: 10.1016/j.jneumeth.2005.10.023. [DOI] [PMC free article] [PubMed] [Google Scholar]
- Kalat JW and Rozin P 1973. “Learned safety” as a mechanism in long-delay taste-aversion learning in rats. J. Comp. Physiol. Psychol. 83:198207. doi: 10.1037/h0034424. [DOI] [PubMed] [Google Scholar]
- Konstantinidis I 2009The taste peripheral system. B-ENT 5 (Suppl 13):115–121. [PubMed] [Google Scholar]
- Martin C, Passilly-Degrace P, Gaillard D, Merlin JF, Chevrot M, and Besnard P 2011. The lipid-sensor candidates CD36 and GPR120 are differentially regulated by dietary lipids in mouse taste buds: Impact on spontaneous fat preference. PLoS One 6:e24014. doi. 10.1371/journal.pone.0024014. [DOI] [PMC free article] [PubMed] [Google Scholar]
- Poole RL, Aleman TR, Ellis HT, and Tordoff MG 2015. Maltodextrin acceptance and preference in eight mouse strains. Chem. Senses 41:45–52. doi: 10.1093/chemse/bjv056. [DOI] [PMC free article] [PubMed] [Google Scholar]
- Running CA, Craig BA, and Mattes RD 2015. Oleogustus: The Unique Taste of Fat. Chem. Senses 40:507–516. doi: 10.1093/chemse/bjv036. [DOI] [PubMed] [Google Scholar]
- Schier LA, Blonde GD, and Spector AC 2016. Bilateral lesions in a specific subregion of posterior insular cortex impair conditioned taste aversion expression in rats.J.Comp.Neurol.524:5473. doi: 10.1002/cne.23822. [DOI] [PMC free article] [PubMed] [Google Scholar]
- Smith JC 2001. The history of the “Davis Rig”. Appetite 36:93–98. doi: 10.1006/appe.2000.0372. [DOI] [PubMed] [Google Scholar]
- Spector AC, Blonde GD, Henderson RP, Treesukosol Y, Hendrick P, Newsome R, Fletcher FH, Tang T, and Donaldson JA 2015. A new gustometer for taste testing in rodents. Chem. Senses 40:187–196. doi: 10.1093/chemse/bju072. [DOI] [PMC free article] [PubMed] [Google Scholar]
- Stellar E and Hill JH 1952. The rat’s rate of drinking as a function of water deprivation. J. Comp. Physiol. Psychol. 45:96–102. doi: 10.1037/h0062150. [DOI] [PubMed] [Google Scholar]
- Stratford JM and Contreras RJ 2010. Peripheral gustatory processing of free fatty acids In Fat Detection: Taste, Texture, and Post Ingestive Effects (Montmayeur JP and Le Coutre J, eds.) pp. 123–136. CRC Press/Taylor & Francis, Boca Raton, Fla. [Google Scholar]
- Stratford JM, Curtis KS, and Contreras RJ 2006. Chorda tympani nerve transection alters linoleic acid taste discrimination by male and female rats. Physiol. Behav. 89:311–319. doi: 10.1016/j.physbeh.2006.06.009. [DOI] [PubMed] [Google Scholar]
- Takeda M, Sawano S, Imaizumi M, and Fushiki T 2001. Preference for corn oil in olfactory-blocked mice in the conditioned place preference test and the two bottle choice test. Life Sci. 69:847–854. doi: 10.1016/S0024-3205(01)01180-8. [DOI] [PubMed] [Google Scholar]
- Tomé D, Schwarz J, Darcel N, and Fromentin G. 2009. Protein, amino acids, vagus nerve signaling, and the brain. Am. J. Clin. Nutr. 90:838S–843S. doi: 10.3945/ajcn.2009.27462W. [DOI] [PubMed] [Google Scholar]
- Tordoff MG, Ellis HT, Aleman TR, Downing A, Marambaud P, Foskett JK, Dana RM, and McCaughey SA 2014. Salty taste deficits in CALHM1 knockout mice. Chem. Senses 39:515–528. doi: 10.1093/chemse/bju020. [DOI] [PMC free article] [PubMed] [Google Scholar]
- Tordoff MG, Aleman TR, Ellis HT, Ohmoto M, Matsumoto I, Shestopalov VI, Mitchell CH, Foskett JK, and Poole RL 2015. Normal taste acceptance and preference of PANX1 knockout mice. Chem. Senses 40:453–459. doi: 10.1093/chemse/bjv025. [DOI] [PMC free article] [PubMed] [Google Scholar]
- Vandenbeuch A, Anderson CB, and Kinnamon SC 2015. Mice lacking Pannexin 1 release ATP and respond normally to all taste qualities. Chem. Senses 40:461–467. doi: 10.1093/chemse/bjv034. [DOI] [PMC free article] [PubMed] [Google Scholar]
- Yarmolinsky DA, Zuker CS, and Ryba NJP 2009. Common sense about taste: From mammals to insects. Cell 139:234–244. doi: 10.1016/j.cell.2009.10.001. [DOI] [PMC free article] [PubMed] [Google Scholar]
- Zukerman S, Ackroff K, and Sclafani A 2011. Rapid post-oral stimulation of intake and flavor conditioning by glucose and fat in the mouse. Am. J. Physiol. 301:R1635–1647. doi: 10.1152/ajpregu.00425.2011. [DOI] [PMC free article] [PubMed] [Google Scholar]
Key References
- Chandrashekar J, Hoon MA, Ryba NJ, and Zuker CS 2006. The receptors and cells for mammalian taste. Nature 444:288–94. [DOI] [PubMed] [Google Scholar]
- Chaudhari N and Roper SD 2010. The cell biology of taste. J. Cell Biol. 190:285–296. [DOI] [PMC free article] [PubMed] [Google Scholar]
- Liman ER, Zhang YV, and Montell C 2014. Peripheral coding of taste. Neuron 81:984–1000. [DOI] [PMC free article] [PubMed] [Google Scholar]
- Yarmolinsky et al., 2009. See above.
- Together, these reviews provide a comprehensive description of the taste system, from anatomy to peripheral and central coding.
- Tomé et al., 2009. See above.
- This review descibes in detail how post-oral signals regulate eating behavior.
- Eddy et al., 2009. See above.
- This paper outlines common conditioned taste a version methedology using a lickometer and was the basis of the conditioned taste aversion lickometer test described here.
- Spector et al., 2015. See above.
- This paper provides an alternative method to measure taste thresholds using a gustometer. Although this technique is more sensitive than a conventional conditioned taste aversion paradigm, it requires highly specialized equiptment that may be unavailble for some researchers.
- Stratford et al., 2006. See above.
- Although done using rats, this paper outlines common conditioned taste aversion methodology using a modified two-bottle preference test, and was the basis of the conditioned taste aversion two-bottle test described here.


