

Abstract
Objective
To examine the temporal changes in the likelihood of dementia and mild cognitive impairment (MCI) between 1993 and 2012 using a short battery of cognitive tests.
Methods
A cohort of 10,342 participants underwent a short battery of cognitive tests collected during triennial in-home interviews with 2,794 of those evaluated for the clinical diagnosis of dementia and MCI. We used a generalized logit regression model to estimate the likelihood of dementia and MCI, and a quasibinomial regression model to examine the temporal changes in those likelihood scores.
Results
A short battery of cognitive tests—delayed story recall test, Symbol Digit Modalities Test, and the Mini-Mental State Examination—were associated with the clinical diagnosis of dementia and MCI. The classification accuracy of likelihood scores was 0.92 for dementia and 0.85 for MCI. After adjusting for age, race/ethnicity, and education, the likelihood of dementia in the population decreased from 21.6% (95% confidence interval [CI] 20.9%–22.3%) to 18.9% (95% CI 18.1%–19.7%) between 1993–1996 and 2000–2002 and showed no significant decline between 2000–2002 and 2009–2012 (−0.2%, 95% CI −1.1% to 0.7%). The estimated likelihood of MCI remained similar between 1993–1996 and 2009–2012 (29.0%, 95% CI 27.9%–30.1%), but showed a nonsignificant decrease in 2000–2002.
Conclusion
The likelihood scores based on a short battery of cognitive tests can serve as a measure of dementia and MCI in epidemiologic studies. The decline in the likelihood of dementia and MCI over earlier years was not sustained in later years.
Epidemiologic studies have widely produced varying estimates of dementia trends, with several studies showing a decline,1–6 while others have shown stabilization over recent years.7–10 Substantial variations in trends over time are magnified by clinical diagnoses that require placing a cut point along a continuum between normal and cognitively impaired. Small variations in placement of the cut point can further lead to large differences in the number of people diagnosed with dementia. Such variations can make the estimates of dementia prevalence less stable across studies and over time.
The clinical diagnosis of dementia is made using a comprehensive battery of cognitive tests11; however, the comprehensive battery is time-consuming and expensive to administer in population studies. A short battery of cognitive tests has been widely used to measure preclinical changes in the cognition of asymptomatic individuals.12,13 Lower scores on the short battery have been indicative of an increased severity of dementia risk14 and correlated with the presence of amyloid plaques in the brain.15–17 Therefore, developing a likelihood score for dementia and mild cognitive impairment (MCI) using a short battery of tests can be of great practical value to epidemiologic studies, particularly for tracking the population-level occurrence of dementia and MCI.
Methods
The Chicago Health and Aging Project enrolled participants based on a door-to-door census in 4 Chicago neighborhoods consisting of African American (AA) and European American (EA) participants.18 The inclusion criteria required that the study participants lived in the geographical area and were over the age of 65 years. The first cycle of data collection started in 1993 and ended in 1996 and consisted of 78.7% of all residents over the age of 65 years. The participants in the original cohort were followed for a second cycle between 1997 and 1999. In 2000, a successive cohort of participants who had reached the age of 65 was added to the original cohort. Data were collected every 3 years and 4 replenishment cohorts were added between 2000 and 2012 (table 1). A short battery of cognitive tests was administered in 10,342 participants every 3 years during in-home visits between 1993 and 2012. At the end of each population interview cycle, about one-third of participants were selected for a clinical assessment of dementia and MCI between 1994 and 2012 based on stratum created by age (5-year groups), sex (male and female), race/ethnicity (AA and EA), and cognition (high, medium, and low). A comprehensive battery of cognitive tests was collected in 2,794 participants during clinical evaluations for the occurrence of dementia and MCI. The short battery of cognitive tests also administered during the clinical evaluations to 2,794 participants was used to develop a dementia and MCI likelihood prediction model, which was then used to estimate the likelihood of dementia and MCI in 10,342 participants in the population interview.
Table 1.
Time-specific demographic characteristics of Chicago Health and Aging Project participants in the population sample

The institutional review board of the Rush University Medical Center approved the study protocols, and all participants provided written consent for in-home population interviews and clinical evaluations.
Short battery of cognitive tests
Four short cognitive tests were administered to participants during in-home population interviews. The cognitive tests consisted of 2 tests of episodic memory based on immediate and delayed story recall of the East Boston Test (scores ranging from 0 to 12),19 one test for executive function based on Symbol Digit Modalities Test (SDMT; scores ranging from 0 to 75),20 and the Mini-Mental State Examination (MMSE; scores ranging from 0 to 30).21 In general, higher cognitive test scores were indicative of better cognitive health and a lower risk of Alzheimer disease, and took approximately 20 minutes to complete.
Clinical diagnosis of dementia
A stratified random sample of participants evaluated during population interviews was selected for a detailed clinical evaluation that included a structured medical history, neurologic examination, and a battery of 19 cognitive performance tests.22 The diagnosis of dementia followed National Institute of Neurological and Communicative Disorders and Stroke–Alzheimer’s Disease and Related Disorders Association (NINCDS-ADRDA) guidelines, which require a history of cognitive decline and impairment in at least 2 cognitive domains.11 To minimize random variability in clinical classification of dementia across clinicians and time, and thereby maximizing the reliability of diagnostic decisions,23 we developed educationally adjusted cut points on 11 tests24,25 and an algorithm for converting impairment ratings on tests to impairment ratings for 5 cognitive domains: orientation, attention, memory, language, and perception.26 A neuropsychologist, who had access to all cognitive data, education, occupation, and ratings of sensorimotor problems and motivation, agreed or disagreed with each cognitive domain rating and in the event of disagreement supplied a revised rating (and reasons for disagreeing with the algorithm). If 2 cognitive domains were impaired, the neuropsychologist also rated the likelihood of dementia. A second algorithm classified dementia according to NINCDS-ADRDA criteria. A board-certified neurologist with access to all clinical data then agreed or disagreed with the dementia algorithm and in the event of disagreement supplied a revised diagnosis (and reasons for disagreeing with the algorithm). Functional impairment in everyday activities is not included in the NINCDS-ADRDA dementia criteria, which may enhance their reliability because of the difficulty in assessing functional impairment uniformly across individuals from different age, socioeconomic, and cultural subgroups. Persons who had impairment in at least one cognitive domain and were judged not to meet dementia criteria by the neurologist were diagnosed with MCI. These criteria for MCI have been associated with a rate of cognitive decline,24,27,28 risk of death,24,29 and level of dementia-related pathology30 intermediate to those in subgroups with dementia and no cognitive impairment (NCI). The neuropsychologist and neurologist were blinded to all previously collected data (to maintain uniformity in diagnostic decision-making).
Statistical analysis
Sample weight–adjusted baseline descriptive statistics were computed for population interviews and clinical evaluations and for demographic characteristics, such as age, the number of formal years of education completed, self-reported race/ethnicity, sex of the participant, and 4 neurocognitive tests. Means and SDs for continuous characteristics and percentage for categorical characteristics were estimated for population interviews.
A sample weight–adjusted generalized logit regression model with 4 short cognitive test scores collected during clinical evaluations and demographic characteristics—age at clinical evaluation, female sex, years of formal education, and AA race/ethnicity—was used to examine the association with the clinical diagnosis of dementia and MCI with NCI as the reference category.31 The linearity assumption of generalized logit model was validated by comparing the logit values against each cognitive test score. The classification accuracy of the regression model was evaluated using 2 separate logistic models—one for dementia and a second for MCI—with NCI as the reference. The prediction errors for the likelihood of dementia and MCI were estimated using a bootstrapping approach.
Using coefficients from the generalized logit regression model and a short battery of cognitive tests and age at each population interview, and time-specific demographic characteristics of the individual—age at interview, sex, race/ethnicity, and education—of each participant, we estimated 3 participant-specific likelihood scores for dementia, MCI, and NCI. The likelihood scores ranged from 0 to 1, with 0 indicating lower likelihood and 1 indicating higher likelihood. The population-level average of the estimated likelihood of dementia can be interpreted as the estimated occurrence of dementia or MCI providing the probability that a randomly selected participant in the population interview will be diagnosed with dementia or MCI. Since about 55% of the population had died between 1993 and 2012, we used a conservative last observation carried forward imputation for the time during which they had died. We tested the sensitivity of this approach using multiple imputation, and found our estimates of the average likelihood of dementia to be higher by about 1.2% and MCI to be higher by about 1.8%.
After estimating the time-specific dementia likelihood score (DLS) in 10,342 participants, we used a marginal mean model within a generalized estimating equation framework to examine the change in the likelihood of dementia and MCI over time. Five indicator variables for each triennial cycle with 2000–2002 as the reference time and time-specific age, female sex, and AA race/ethnicity were used to estimate the population-level likelihood of dementia and MCI. We treated each likelihood score as number of realizations with the condition over 100 Bernoulli trials. For example, a likelihood score of 0.80 would consist of 80 realizations with disease (value of 1) and 20 realizations with no disease (value of 0). We used a generalized estimating equation with an exchangeable correlation matrix to account for participant-level correlation of the event over Bernoulli trials with a logit link function32 after adjusting for age, AA race/ethnicity, sex, and education, and setting these values to be the same as the baseline cohort, performed using R program.33
Data availability
Deidentified demographic data, short battery of cognitive test scores, and likelihood scores for dementia and MCI developed in this article will be shared upon request with any qualified investigators. Study protocols for population interview of these measures and earlier study protocol publications will be made available upon request to the corresponding author.
Results
The average age of the original and successive cohorts ranged between 75 and 80 years and consisted of at least 60% AA and female in each of the triennial population interviews (table 1). The average age of participants was 73.1 years with 12.3 years of formal education and consisted of 63% AA and 61% female during population interviews (table 2). After adjusting for sampling weights, the clinical sample consisted of individuals who were about a year younger and had slightly higher cognitive functioning than the population sample.
Table 2.
Baseline characteristics of Chicago Health and Aging Project participants enrolled in population interview and selected for clinical evaluation for diagnosis of dementia, mild cognitive impairment, or no cognitive impairment

Of the 2,794 participants selected for clinical evaluations, 767 (weighted percentage 21%) participants were clinically diagnosed with dementia, another 837 (weighted percentage 26%) were diagnosed with MCI, and the remaining 1,190 (weighted percentage 53%) had NCI. On an average, participants diagnosed with dementia were about 2 years older than participants with MCI, and about 4 years older than participants with NCI. Participants diagnosed with dementia also had lower education by 1 year than in those with MCI and by 2 years than in participants with NCI. As expected, participants diagnosed with dementia had lower scores on all 4 cognitive tests than participants with either MCI or NCI.
Development of the DLS
In the clinical sample of 2,794, a short battery of cognitive tests collected during the clinical interviews was associated with the occurrence of dementia and MCI (table 3). The delayed story recall test score was associated with lower odds for clinical diagnosis of dementia (odds ratio [OR] 0.74, 95% confidence interval [CI] 0.67–0.82) and MCI (OR 0.87, 95% CI 0.79–0.94) compared to NCI. SDMT and the MMSE were also associated with lower odds for clinical diagnosis of dementia and MCI compared to NCI. However, immediate recall test score was not associated with either the diagnosis of dementia or MCI. Female sex and AA race/ethnicity were also associated with higher odds for the clinical diagnosis of dementia and MCI compared to NCI. Although age was associated with the diagnosis of dementia, it was not associated with the diagnosis of MCI compared to NCI.
Table 3.
Odds ratios (ORs) and 95% confidence intervals (CIs) of cognitive tests and demographic characteristics for clinical diagnosis of dementia and mild cognitive impairment (MCI) in the Chicago Health and Aging Project population sample

The area under the receiver operating characteristic curve for dementia submodel was 0.92 (95% CI 0.88–0.95) and for MCI submodel was 0.89 (95% CI 0.82–0.94), which suggests high classification accuracy for each outcome. The bias in the average likelihoods of the bootstrap sample for dementia likelihood was 0.2% and MCI likelihood was 0.5%. The figure shows a 3D scatterplot of the likelihood of dementia, MCI, and NCI during the baseline assessment using our short battery of cognitive tests. The average DLS was 19.8% (95% CI 19.5%–20.1%) and MCI likelihood score was 28.9% (95% CI 28.7%–29.1%) over the duration of the study. AA participants had large average DLS (23.5% vs 13.2%) and MCI likelihood scores (33.0% vs 21.7%) compared to EA participants.
Figure. 3D plot of the likelihood of dementia, mild cognitive impairment, and no cognitive impairment at the baseline interview.

The likelihood of dementia, mild cognitive impairment, and no cognitive impairment is based on the probability of the event given time-specific demographic characteristics and cognitive test scores at the baseline assessment during the population interview.
Evaluating trends in DLS between 1993 and 2012
For each participant in the population sample, the likelihood of dementia and MCI was estimated using a generalized logit regression model in 6 triennial cycles between 1993 and 2012 (table 4). After adjusting for age, sex, race/ethnicity, and education, and setting these characteristics to be same as the baseline cohort, we estimated the likelihood of dementia in our population sample to be around 21.6% (95% CI 20.9%–22.3%) in 1993–1996, which decreased to 18.9% (95% CI 18.1%–19.7%) in 2000–2002, and remained steady through 2009–2012 at 18.7% (95% CI 17.8%–19.6%). A significant decrease in the likelihood of dementia was observed between 1993–1996 and 2000–2002 (p = 0.012). However, no significant differences in any of the triennial cycles from 2000 to 2012 were observed. The decrease in the likelihood of dementia seemed to have flattened between 2000 and 2012.
Table 4.
Age-, sex-, and race-adjusted estimate of prevalence of dementia and mild cognitive impairment using likelihood scores in Chicago Health and Aging Project population sample between 1993 and 2012
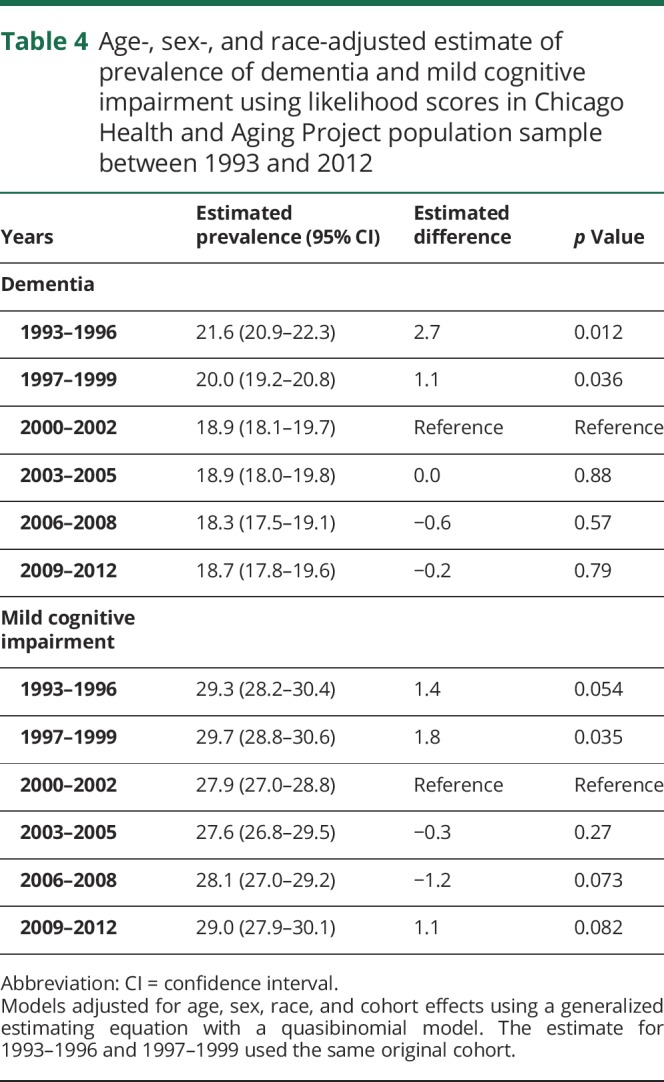
The change in likelihood of MCI between 1993 and 2012 was also evaluated using our approach. Interestingly, the likelihood of MCI was similar between 1993–1996 and 2009–2012 at about 29.3%, with a decrease in 2000–2002 at 27.9%, which was not statistically significant. The likelihood of MCI did not show any significant patterns of change over the 18-year study period, although small variations were observed over time.
Discussion
The population-level likelihood of dementia was derived using a short battery of cognitive test scores in a large population-based study over 18 years. Three cognitive test scores—delayed story recall test, SDMT, and MMSE—provided the likelihood of dementia and MCI after adjusting for age, education, race/ethnicity, and sex. The immediate recall test was not associated with the likelihood of dementia or MCI in the presence of the other 3 cognitive tests. Demographic characteristics, such as age and female sex, were also associated with higher likelihood of dementia, even in the presence of the cognitive tests. Our findings also suggest that AA participants have significantly higher occurrence of dementia and MCI, even in the presence of short battery of cognitive tests and other demographic characteristics.
The DLS has several applications, including estimating the population-level likelihood of dementia in a longitudinal cohort study. Prevalence can be interpreted as the probability of dementia for an entire population. DLS are individual-specific probabilities of dementia and averaging the likelihood scores would provide an estimate of the probability of dementia. Hence, average DLS and prevalence estimates are equivalent. The prevalence of dementia showed a decline in earlier years, but did not show much variability between 2000 and 2012,7 contrary to studies that reported dramatic decreases in the prevalence of dementia, nationally4 and internationally in developed countries.5,6 Interestingly, the likelihood of MCI showed some variability with a decrease between 1993 and 2000, and a steady increase thereafter to reach levels similar to 1993–1996.
The DLS has several advantages over cognitive composites and memory scores. Many cognitive composite scores are based on linear scales where decrements in scores are associated with increased risk of dementia (e.g., Preclinical Alzheimer Cognitive Composite).12–17 Because these scores are not directly examined to provide a likelihood of dementia or lesser cognitive impairments, using composite test scores in classifying dementia and MCI can be more difficult. Even though misclassification rates are often provided, estimates for how many people are wrongly classified as having dementia or NCI are often unknown, and the variability in these estimates is also not known.34 The effect of these misclassification rates on population-level changes needs to be evaluated further. The DLS are not based on pathologic diagnosis; hence, these scores do not distinguish between patients with and without Alzheimer disease.
In our study, a short battery of cognitive tests coupled with the demographic characteristics predicted the likelihood of dementia and MCI with high accuracy. Education contributed to the DLS even after adjusting for neuropsychological test scores, age, sex, and race/ethnicity. The contributions of these demographic characteristics were significant even after accounting for the cognitive test scores. The mortality-adjusted estimates were higher by about 3%, which suggests that studies that do not account for mortality are more likely to underestimate the prevalence of dementia. The demography of older populations and the uncertainty in prevalence of dementia calls for a closer watch on the future changes in mortality characteristics.35
The study has several limitations. The short battery of cognitive tests was repeated at population interview and clinical evaluations, which makes the tests highly correlated, although one is a short battery and the other is a battery of 19 cognitive tests. The likelihood scores reduce the dimension of tests from 4 cognitive tests to a single measure of probability, resulting in some loss of information. Also, the immediate recall test did not provide any meaningful information in the presence of delayed recall, perceptual speed, and MMSE. This could be due to the high correlatedness of the cognitive tests. The likelihood scores are based on a linear parameterization of the cognitive tests; that is, the odds of dementia and MCI increases linearly with decreasing cognitive test scores. However, this association may have certain clinical thresholds beyond or below which the tests do not provide meaningful information. In addition, the dementia diagnosis was based on the NINCDS-ADRDA criteria and did not include functional impairment and does not distinguish between dementia subtypes. Although the temporal trends adjusted for demographic characteristics and set the population levels to the baseline cohort, there might be some residual age confounding. AA patients have higher ORs for dementia and MCI even after adjusting for cognitive tests; some of this association may depend on social, behavioral, personality, and unmeasured characteristics not examined here.
Dementia and MCI likelihood scores are useful tools in understanding the changing risk of cognitive impairment in the population. Risk factors associated with these likelihood scores can also be evaluated in future studies. Although some studies suggest that the prevalence of dementia and MCI may be declining, our investigation suggests a greater variability around such trend estimates. Given the rise in the prevalence of chronic health conditions and their relation to dementia, it is increasingly important to examine the reasons for any decline and to identify the uncertainty in the estimation of occurrence of dementia and MCI in population studies.
Glossary
- AA
African American
- CI
confidence interval
- DLS
dementia likelihood score
- EA
European American
- MCI
mild cognitive impairment
- MMSE
Mini-Mental State Examination
- NCI
no cognitive impairment
- NINCDS-ADRDA
National Institute of Neurological and Communicative Disorders and Stroke–Alzheimer’s Disease and Related Disorders Association
- OR
odds ratio
- SDMT
Symbol Digit Modalities Test
Appendix. Authors

Study funding
Supported by NIH grants (R01AG051635, RF1AG057532, and R01AG058679).
Disclosure
K. Rajan receives support from NIH grants (R01AG051635 [principal investigator], R01AG057532 [principal investigator], and R01AG058679 [principal investigator]). J. Weuve is a consultant for the Alzheimer's Association and the AlzRisk Project (alzrisk.org) and funded by NIH (R21ES020404 [principal investigator]). R. Wilson serves as a Consulting Editor for Aging, Neuropsychology, and Cognition, Psychology and Aging, and Neuropsychology; has served as a consultant for Pain Therapeutics, Inc.; and receives research support from the NIH (P30AG010161 [coinvestigator], RF1AG015819 [coinvestigator], R01AG017917 [coinvestigator], R01AG034374 [coinvestigator], R01AG039478 [coinvestigator], R01AG036042 [coinvestigator], R01AG036836 [coinvestigator], R01AG041797 [coinvestigator], R01AG042210 [coinvestigator], and R01NR013151 [coinvestigator]), the Alzheimer's Association (NIRGD-11-205469), and Zinfandel Pharmaceuticals. L. Barnes receives research support from the NIH (R01AG022018 [principal investigator], P20MD006886 [principal investigator], and P30AG010161 [co–core leader]) and Zinfandel Pharmaceuticals. E. McAninch reports no disclosures relevant to the manuscript. D. Evans is and was principal investigator of grants from the NIH (R01-AG09966 [present] and R01-AG11101 [past]). Go to Neurology.org/N for full disclosures.
References
- 1.Prince M, Ali GC, Guerchet M, Prina AM, Albanese E, Wu YT. Recent global trends in the prevalence and incidence of dementia, and survival with dementia. Alzheimers Res Ther 2016;8:23. [DOI] [PMC free article] [PubMed] [Google Scholar]
- 2.Satizabal CL, Beiser AS, Chouraki V, Chêne G, Dufouil C, Seshadri S. Incidence of dementia over three decades in the Framingham Heart Study. N Engl J Med 2016;374:523–532. [DOI] [PMC free article] [PubMed] [Google Scholar]
- 3.Steenland K, Goldstein FC, Levey A, Wharton W. A meta-analysis of Alzheimer's disease incidence and prevalence comparing African Americans and Caucasians. J Alzheimers Dis 2015;50:71–76. [DOI] [PMC free article] [PubMed] [Google Scholar]
- 4.Langa KM, Larson EB, Crimmins EM, et al. A comparison of the prevalence of dementia in the United States in 2000 and 2012. JAMA Intern Med 2017;177:51–58. [DOI] [PMC free article] [PubMed] [Google Scholar]
- 5.Matthews FE, Arthur A, Barnes LE, et al. A two-decade comparison of prevalence of dementia in individuals aged 65 years and older from three geographical areas of England: results of the Cognitive Function and Ageing Study I and II. Lancet 2013;382:1405–1412. [DOI] [PMC free article] [PubMed] [Google Scholar]
- 6.Lobo A, Saz P, Marcos G, et al. Prevalence of dementia in a southern European population in two different time periods: the ZARADEMP Project. Acta Psychiatr Scand 2007;116:299–307. [DOI] [PubMed] [Google Scholar]
- 7.Rajan KB, Weuve J, Barnes LL, Wilson RS, Evans DA. Prevalence and incidence of clinically diagnosed Alzheimer's disease dementia from 1994 to 2012 in a population study. Alzheimers Dement 2019;15:1–7. [DOI] [PMC free article] [PubMed] [Google Scholar]
- 8.Weuve J, Rajan KB, Barnes LL, Wilson RS, Evans DA. Secular trends in cognitive performance in older black and white U.S. adults, 1993-2012: findings from the Chicago Health and Aging Project. J Gerontol B Psychol Sci Soc Sci 2018;73(suppl 1):S73–S81. [DOI] [PMC free article] [PubMed] [Google Scholar]
- 9.Satizabal CL, beiser AD, Chouraki V, et al. Incidence of dementia over three decades in the Framingham Heart Study. N Engl J Med 2016;374:523–532. [DOI] [PMC free article] [PubMed] [Google Scholar]
- 10.Rocca WA, Petersen RC, Knopman DS, et al. Trends in the incidence and prevalence of Alzheimer's disease, dementia, and cognitive impairment in the United States. Alzheimers Dement 2011;7:80–93. [DOI] [PMC free article] [PubMed] [Google Scholar]
- 11.McKhann G, Drachman D, Folstein M, Katzman R, Price D, Stadlan M. Clinical diagnosis of Alzheimer's disease: report of the NINCDS-ADRDA Work Group under the auspices of Department of Health and Human Services Task Force on Alzheimer's disease. Neurology 1984;34:939–944. [DOI] [PubMed] [Google Scholar]
- 12.Weintraub S, Carrillo MC, Farias ST, et al. Measuring cognition and function in the preclinical stage of Alzheimer's disease. Alzheimers Dement 2018;4:64–75. [DOI] [PMC free article] [PubMed] [Google Scholar]
- 13.Rajan KB, Wilson RS, Weuve J, et al. Cognitive impairment 18 years prior to clinical diagnosis of Alzheimer's disease dementia. Neurology 2015;85:898–904. [DOI] [PMC free article] [PubMed] [Google Scholar]
- 14.Lim YY, Snyder PJ, Pietrzak RH, Ukiqi A, Villemagne VL, Ames D. Sensitivity of composite scores to amyloid burden in preclinical Alzheimer's disease: introducing the Z-scores of attention, verbal fluency, and episodic memory for nondemented older adults composite score. Alzheimers Dement 2016;2:19–26. [DOI] [PMC free article] [PubMed] [Google Scholar]
- 15.Donohue MC, Sperling RA, Salmon DP, Rentz DM, Raman R, Thomas RG. AIBL, ADNI, ADCS, the preclinical Alzheimer cognitive composite: measuring amyloid-related decline. JAMA Neurol 2014;71:961–970. [DOI] [PMC free article] [PubMed] [Google Scholar]
- 16.Mormino EC, Papp KV, Rentz DM, Donohue MC, Amariglio R, Quiroz YT. Early and late change on the preclinical Alzheimer's cognitive composite in clinically normal older individuals with elevated β-amyloid. Alzheimers Dement 2017;13:1004–1012. [DOI] [PMC free article] [PubMed] [Google Scholar]
- 17.Snitz BE, Weissfeld LA, Lopez OL, Kuller LH, Saxton J, Singhabahu D. Cognitive trajectories associated with β-amyloid deposition in the oldest-old without dementia. Neurology 2013;80:1378–1384. [DOI] [PMC free article] [PubMed] [Google Scholar]
- 18.Evans DA, Bennett DA, Wilson RS, et al. Incidence of Alzheimer disease in a biracial urban community. Arch Neurol 2003;60:185–189. [DOI] [PubMed] [Google Scholar]
- 19.Albert M, Smith LA, Scherr PA, Taylor JO, Evans DA, Funkenstein HH. Use of brief cognitive tests to identify individuals in the community with clinically diagnosed Alzheimer's disease. Int J Neurosci 1991;57:167–178. [DOI] [PubMed] [Google Scholar]
- 20.Smith A. Symbol Digits Modalities Test. Los Angeles: Western Psychological Services; 1982. [Google Scholar]
- 21.Folstein MF, Folstein SE, McHugh TR. “Mini-Mental State”: a practical method for grading the cognitive state of patients for the clinician. J Psychiatr Res 1975;12:189–198. [DOI] [PubMed] [Google Scholar]
- 22.Wilson RS, Bennett DA, Bienias JL, et al. Cognitive activity and incident AD in a population-based sample of older persons. Neurology 2002;59:1910–1914. [DOI] [PubMed] [Google Scholar]
- 23.Meehl PE. Clinical Versus Statistical Prediction: A Theoretical Analysis and a Review of the Evidence. Minneapolis: University of Minnesota Press; 1954. [Google Scholar]
- 24.Bennett DA, Wilson RS, Schneider JA, et al. Natural history of mild cognitive impairment in older persons. Neurology 2002;59:198–205. [DOI] [PubMed] [Google Scholar]
- 25.Wilson RS, Boyle PA, Yang J, James BD, Bennett DA. Early life instruction in foreign language and music and incidence of mild cognitive impairment. Neuropsychology 2015;29:292–302. [DOI] [PMC free article] [PubMed] [Google Scholar]
- 26.Bennett DA, Schneider JA, Aggarwal NT, et al. Decision rules guiding the clinical diagnosis of Alzheimer's disease in two community-based cohort studies compared to standard practice in a clinic-based cohort study. Neuroepidemiology 2006;27:169–176. [DOI] [PubMed] [Google Scholar]
- 27.Boyle PA, Wilson RS, Aggarwal NT, Tang Y, Bennett DA. Mild cognitive impairment: risk of Alzheimer disease and rate of cognitive decline. Neurology 2006;67:441–445. [DOI] [PubMed] [Google Scholar]
- 28.Wilson RS, Aggarwal NT, Barnes LL, Mendes de Leon CF, Hebert LE, Evans DA. Cognitive decline in incident Alzheimer disease in a community population. Neurology 2010;74:951–955. [DOI] [PMC free article] [PubMed] [Google Scholar]
- 29.Wilson RS, Aggarwal NT, Barnes LL, Bienias JL, Mendes de Leon CF, Evans DA. Biracial population study of mortality in mild cognitive impairment and Alzheimer disease. Arch Neurol 2009;66:767–772. [DOI] [PMC free article] [PubMed] [Google Scholar]
- 30.Bennett DA, Schneider JA, Bienias JL, Evans DA, Wilson RS. Mild cognitive impairment is related to Alzheimer disease pathology and cerebral infarctions. Neurology 2005;64:834–841. [DOI] [PubMed] [Google Scholar]
- 31.Agresti A. Categorical Data Analysis: Wiley Series in Probability and Statistics. 2nd ed. Hoboken: John Wiley & Sons, Inc.; 2002. [Google Scholar]
- 32.Prentice RL, Zhao LP. Estimating equations for parameters in means and covariances of multivariate discrete and continuous responses. Biometrics 1991;47:825–839. [PubMed] [Google Scholar]
- 33.Core Team. R: A Language and Environment for Statistical Computing. Vienna: R Foundation for Statistical Computing; 2017. [Google Scholar]
- 34.Crimmins EM, Kim JK, Langa KM, Weir DR. Assessment of cognition using surveys and neuropsychological assessment: the Health and Retirement Study and the Aging, Demographics, and Memory Study. J Gerontol B Psychol Sci Soc Sci 2011;66B(suppl 1):i162–i171. [DOI] [PMC free article] [PubMed] [Google Scholar]
- 35.Zissimopoulos JM, Tysinger BC, St. Clair PA, Crimmins EM. The impact of changes in population health and mortality on future prevalence of Alzheimer's disease and other dementias in the United States. J Gerontol B Psychol Sci Soc Sci 2018;73:S38–S44. [DOI] [PMC free article] [PubMed] [Google Scholar]
Associated Data
This section collects any data citations, data availability statements, or supplementary materials included in this article.
Data Availability Statement
Deidentified demographic data, short battery of cognitive test scores, and likelihood scores for dementia and MCI developed in this article will be shared upon request with any qualified investigators. Study protocols for population interview of these measures and earlier study protocol publications will be made available upon request to the corresponding author.