

The Ebola virus glycoprotein contains a mucin-like domain which may play a role in immune evasion. Chimeric vesicular stomatitis viruses with the EBOV glycoprotein substituted for the VSV glycoprotein show greater safety and efficacy in targeting brain tumors in immunodeficient mice when the MLD was expressed within the EBOV glycoprotein than when EBOV lacked the mucin-like domain.
KEYWORDS: Ebola virus, brain, oncolytic virus, vesicular stomatitis virus
ABSTRACT
Given that the Ebola virus (EBOV) infects a wide array of organs and cells yet displays a relative lack of neurotropism, we asked whether a chimeric vesicular stomatitis virus (VSV) expressing the EBOV glycoprotein (GP) might selectively target brain tumors. The mucin-like domain (MLD) of the EBOV GP may enhance virus immune system evasion. Here, we compared chimeric VSVs in which EBOV GP replaces the VSV glycoprotein, thereby reducing the neurotoxicity associated with wild-type VSV. A chimeric VSV expressing the full-length EBOV GP (VSV-EBOV) containing the MLD was substantially more effective and safer than a parallel construct with an EBOV GP lacking the MLD (VSV-EBOVΔMLD). One-step growth, reverse transcription-quantitative PCR, and Western blotting assessments showed that VSV-EBOVΔMLD produced substantially more progeny faster than VSV-EBOV. Using immunodeficient SCID mice, we focused on targeting human brain tumors with these VSV-EBOVs. Similar to the findings of our previous study in which we used an attenuated VSV-EBOV with no MLD that expressed green fluorescent protein (GFP) (VSV-EBOVΔMLD-GFP), VSV-EBOVΔMLD without GFP targeted glioma but yielded only a modest extension of survival. In contrast, VSV-EBOV containing the MLD showed substantially better targeting and elimination of brain tumors after intravenous delivery and increased the survival of brain tumor-bearing mice. Despite the apparent destruction of most tumor cells by VSV-EBOVΔMLD, the virus remained active within the SCID mouse brain and showed widespread infection of normal brain cells. In contrast, VSV-EBOV eliminated the tumors and showed relatively little infection of normal brain cells. Parallel experiments with direct intracranial virus infection generated similar results. Neither VSV-EBOV nor VSV-EBOVΔMLD showed substantive infection of the brains of normal immunocompetent mice.
IMPORTANCE The Ebola virus glycoprotein contains a mucin-like domain which may play a role in immune evasion. Chimeric vesicular stomatitis viruses with the EBOV glycoprotein substituted for the VSV glycoprotein show greater safety and efficacy in targeting brain tumors in immunodeficient mice when the MLD was expressed within the EBOV glycoprotein than when EBOV lacked the mucin-like domain.
INTRODUCTION
Ebola virus (EBOV) is considered one of the most dangerous viruses, with a lethality approaching 90% in some outbreaks (1). One factor contributing to the ability of EBOV to evoke lethal infections is the mucin-like domain (MLD) contained in the GP1 subunit of the EBOV glycoprotein (GP). This domain (amino acids 309 to 489) is rich in proline, serine, and threonine residues, is heavily glycosylated, and is one of the most variable regions in the EBOV GP (2–4). Expression of this domain constitutes one of several mechanisms by which EBOV successfully evades and delays activation of the host immune system (5–7). The MLD is thought to function like a glycosylated umbrella, shielding the viral GP from neutralization by the adaptive immune response (4, 8, 9).
In recent years, there have been large outbreaks of EBOV disease, particularly in West Africa (2013 to 2016) and more recently in the Democratic Republic of the Congo (2018 to the present). In both outbreaks, a live-attenuated vaccine (rVSV-ZEBOV), consisting of a recombinant vesicular stomatitis virus (VSV) with its glycoprotein gene replaced by the Zaire EBOV GP gene, has been used and has shown efficacy and safety in the protection of men, women, and children (10–12). Furthermore, this chimeric VSV expressing the full-length EBOV GP (VSV-EBOV) was found to be safe even after direct injection into the brains of nonhuman primates (13).
We recently tested a chimeric VSV-EBOV which included a green fluorescent protein (GFP) reporter gene in the first genomic position before the nucleoprotein gene and which carried a replacement of the VSV glycoprotein with an EBOV GP lacking the MLD (VSV-EBOVΔMLD-GFP) (14, 15). This VSV-EBOVΔMLD-GFP construct showed only modest efficacy compared with that of another VSV chimera, VSV-LASV, in which the Lassa virus (LASV) glycoprotein replaced the VSV glycoprotein (15, 16). VSV-LASV was safe in the mouse brain and displayed a substantial potential for targeting and cytolytically attacking brain tumors (15). Here, we address the question of whether different chimeric VSV-EBOV constructs, which either have or do not have the MLD in the EBOV GP and which lack the GFP reporter gene, might enhance the ability of the virus to target brain tumors.
RESULTS
Oncolytic targeting of VSV-EBOVs in vitro.
Here we compared chimeric VSV-EBOVs expressing different versions of the EBOV GP. The MLD, which constitutes part of the EBOV GP, has been found to vary among EBOV isolates both within and between EBOV outbreaks and can enhance immune shielding/evasion (17–19). We compared the safety and efficacy of three chimeric VSV-EBOVs in which the neurotropic VSV glycoprotein was replaced by the EBOV GP (with or without the MLD sequence) (Fig. 1A and B).
FIG 1.

Genomic composition of chimeric VSV-EBOVs and control VSVs used in the present study. VSV sequences are shown in gray and white, the EBOV GP sequence is in violet, and GFP is in green. VSV genes (gray) consist of the original recombinant VSV sequence used by Lawson et al. (20), whereas the VSV-EBOVΔMLD-GFP genes (white) derive from a second recombinant VSV sequence used by Whelan et al. (21). (A) The schematic shows the gene order, relative gene size, and the replacement of the VSV glycoprotein gene (VSV G) with the Ebola virus glycoprotein gene (EBOV GP). The EBOV GP mucin-like domain (MLD) sequence is indicated (yellow) in VSV-EBOV, and its deletion is identified (ΔMLD) in VSV-EBOVΔMLD and VSV-EBOVΔMLD-GFP. (B) Illustration depicting chalice-shaped trimers of EBOV GP with (left) and without (right) the MLD, based on cryo-electron tomography (47). (C) Comparison of the amino acid sequences of four VSV proteins (N, P, M, L) expressed by all chimeric VSV-EBOVs examined here. Red lines indicate amino acid differences between the two sets of VSV genes originating from Lawson et al. (20) (GenBank accession number FJ478454) and Whelan et al. (21) (Addgene plasmid number 31833).
Two of these VSV-EBOVs (VSV-EBOV and VSV-EBOVΔMLD) expressed recombinant VSV genes derived from a VSV genome common to both (20), whereas the third (VSV-EBOVΔMLD-GFP) expressed VSV genes derived from a different source (21). A comparison of the amino acid sequences of the VSV N, P, M, and L proteins showed differences in all four viral genes, (Fig. 1C; see the details in Materials and Methods). VSV-EBOVΔMLD-GFP was constructed using a VSV backbone (21) different from that used for VSV-EBOV and VSV-EBOVΔMLD (20); its inclusion here provides a basis for comparing its previously described modest oncolytic efficacy (15) with the oncolytic activity of other VSV-EBOV chimeras.
To compare the safety and efficacy of these chimeric viruses, we first tested two viruses, one with the MLD (VSV-EBOV) and another without the MLD (VSV-EBOVΔMLD), in normal primary human melanocytes (harvest 865 and harvest 871) and melanocyte-derived human melanoma YUMAC cells. Both VSV-EBOV and VSV-EBOVΔMLD displayed a much greater infection of cancerous melanoma cells than of the normal precursor melanocytes, as determined by a cell infectivity assay and plaque-size assay (Fig. 2A to D).
FIG 2.

Chimeric VSV-EBOV and VSV-EBOVΔMLD selectively infect a human melanoma and mouse glioma. (A) Two chimeric VSV-EBOVs (VSV-EBOV, VSV-EBOVΔMLD) were used to infect (MOI = 1) monolayer cultures of human melanoma YUMAC cells and normal primary melanocytes (harvest 865, harvest 871). Cells were fixed at 24 h postinfection (hpi) and visualized by fluorescent immunolabeling using a primary antibody against VSV and a secondary green fluorescent antibody. (B) Images of immunolabeled viral plaques from a plaque assay 2 days postinfection (dpi) with the same viruses and cells for which the results are shown in panel A. (C) Bar graphs of the percentage of infected cells measured in the cultures shown in panel A. Bars indicate the means for 9 microscopic fields sampled from 3 wells, and error bars are ±SE. (D) Graphs showing viral plaque size development over time. Parallel cultures of cells shown in panel A were infected and overlaid in a plaque assay and then allowed to develop for 1, 2, or 3 days prior to fixation and immunolabeling. Plaques were visualized using fluorescence microscopy, and an area of 60 plaques was measured for each condition (mean ± SE). (E) Monolayer cultures of mouse glioma cells (GL261, CT-2A) and primary glia cells were infected (MOI = 1) using three chimeric VSV-EBOVs (VSV-EBOV, VSV-EBOVΔMLD, VSV-EBOVΔMLD-GFP) and one nonchimeric wild-type recombinant VSV (VSVwt). Cells were fixed at 24 hpi and immunolabeled. Bars, 0.5 mm (A, B, and E). (F) Bar graphs of the percentage of infected cells measured in the cultures shown in panel E. Bars indicate the means for 9 microscopic fields sampled from 3 wells, and error bars are ±SE. ***, P < 0.001; n.s., not significant.
We compared these chimeric VSVs with a control VSV that retained the native VSV glycoprotein (glycoprotein from nonchimeric wild-type recombinant VSV [VSVwt]) using two mouse glioma cell lines (GL261 and CT-2A glioma cells) as well as control normal mouse glia at a multiplicity of infection (MOI) of 1. At 24 h after infection, only small numbers of normal mouse glia cells were infected with any of the chimeric VSVs (VSV-EBOV, 0.3% ± 0.0%; VSV-EBOVΔMLD, 2.0% ± 0.0%; VSV-EBOVΔMLD-GFP, 4.8% ± 0.1%; n = 9 samples/group; Fig. 2E and F). In contrast, substantial numbers of infected mouse CT-2A glioma cells were found (VSV-EBOV, 65.5% ± 0.0%; VSV-EBOVΔMLD, 72.4% ± 3.3%; VSV-EBOVΔMLD-GFP, 60.4% ± 3.4%; VSVwt, 77.7% ± 2.4%; n = 9 samples/group). Although VSVwt displayed a robust infection of GL261 glioma cells (82.3% ± 1.5%), these cells showed greater resistance to infection with the VSV-EBOVs (VSV-EBOV, 0.8% ± 0.0%; VSV-EBOVΔMLD, 4.9% ± 0.09%; VSV-EBOVΔMLD-GFP, 5.2% ± 0.02%).
Potential of chimeric VSVs to infect and kill human glioma cells.
To test the oncolytic activity and safety of chimeric VSVs, we compared the relative levels of infection for each of the three viruses with the level for a control VSVwt on human glioma or normal human glia cells at an MOI of 1 at 24 h postinoculation (hpi) (Fig. 3). All three chimeric VSVs showed strong infection of the different human glioma cells, including ATCC87 glioma cells (VSV-EBOV, 87.6% ± 1.9%; VSV-EBOVΔMLD, 99.1% ± 0.5%, VSV-EBOVΔMLD-GFP, 58.8% ± 1.3%; Fig. 3B). On normal human glia cells, VSV-EBOV and VSV-EBOVΔMLD showed only modest infection and less than that of VSVwt (VSV-EBOV, 8.3% ± 0.0%; VSV-EBOVΔMLD, 1.6% ± 0.2%).
FIG 3.

Chimeric VSV-EBOV and VSV-EBOVΔMLD selectively infect human glioma cells. (A) Three chimeric VSV-EBOVs (VSV-EBOV, VSV-EBOVΔMLD, VSV-EBOVΔMLD-GFP) and wild-type recombinant VSV (VSVwt) were used to infect a collection of human glioma cells (ATCC87, U118, U251, A172) and normal glia. The cells were fixed at 24 hpi, fluorescently immunolabeled with VSV antibody, and imaged. Bar, 0.5 mm. (B) Bar graphs showing the percentage of infected cells for which the results are shown in panel A. Statistical comparisons are between glioma and normal glia cultures. Bars indicate the means for 9 microscopic fields sampled from 3 wells, and error bars are ±SE. *, P < 0.05; ***, P < 0.001; n.s., not significant.
Using the same cells, a plaque-size assay was performed and plaques were measured at 1 to 3 days postinfection (dpi) (Fig. 4). This assay reflects both viral infection and replication within particular cell types. Representative images of viral plaques at 2 dpi (Fig. 4A) and graphs (Fig. 4B) show viral plaque-size development over time. All three chimeric viruses showed larger plaque sizes in ATCC87 glioma cells (2 dpi; VSV-EBOV, 13.5 ± 0.02 mm2; VSV-EBOVΔMLD, 16.6 ± 0.04 mm2; VSV-EBOV-ΔMLD-GFP, 4.7 ± 0.02 mm2; n = 60 plaques/condition) and U251 glioma cells (VSV-EBOV, 1.9 mm2 ± 0.0 mm2; VSV-EBOVΔMLD, 2.2 ± 0.01 mm2; VSV-EBOVΔMLD-GFP, 1.4 ± 0.0 mm2; n = 60 plaques/condition) than in normal human glia cells. However, the largest plaques were generated by VSVwt-GFP (ATCC87, 35.1 ± 0.04 mm2; 3 dpi; positive control).
FIG 4.

Glioblastoma cultures yield larger plaques than normal human glia. (A) Representative images of viral plaques at 2 dpi after fixation and fluorescent immunolabeling in cultures of human glia, human glioblastoma (ATCC87, A172, U1118, U251), and mouse glioma (CT-2A) cells. Three chimeric VSV-EBOVs (VSV-EBOV, VSV-EBOVΔMLD, VSV-EBOVΔMLD-GFP) and the attenuated nonchimeric VSV (VSVwt-GFP) were tested. Bar, 1 mm. (B) Graphs showing viral plaque size development over time. Parallel cultures of the cells shown in panel A were infected and overlaid in a plaque assay and then allowed to develop for 1, 2, or 3 days prior to fixation and immunolabeling. Plaques were visualized using fluorescence microscopy, and an area of 60 plaques was measured for each condition (mean ± SE). (C) One-step growth curves comparing VSV-EBOV (black) and VSV-EBOVΔMLD (red) performed on cultures of mouse primary brain, human glioma ATCC87, and Vero cells. Each curve represents the mean from duplicate experiments, with the titers at the indicated time points being determined by plaque assay on Vero cells. (D) Summary bar graph of one-step viral titers from panel C measured at 10 h. (E) Bar graph comparing the relative levels of intracellular VSV N RNA from VSV-EBOV- and VSV-EBOVΔMLD-infected Vero cell cultures (MOI = 10). RNA was harvested from cells at 3, 6, and 12 h postinfection, and VSV RNA was measured using RT-qPCR. (F) SDS-PAGE Western blots comparing the relative amounts of intracellular VSV N and M proteins using conditions similar to those used for the RNA analysis for which the results are shown in panel E. Results from triplicate infections are shown. **, P < 0.01; ***, P < 0.001; n.s., not significant.
To compare the propagation of VSV-EBOV with that of VSV-EBOVΔMLD, we used an analysis of one-step growth curves. This was done on normal mouse brain cells, which included both glia and neurons. We also examined ATCC87 human glioblastoma and Vero cells. In all cases, we found substantially greater virus production (>10-fold) of VSV-EBOVΔMLD than of VSV-EBOV. In addition, VSV-EBOVΔMLD began to release progeny at a slightly earlier time point (1 h faster) than VSV-EBOV. These data are shown in Fig. 4C and D. We also measured VSV RNA expression (Fig. 4E) by reverse transcription-quantitative PCR (RT-qPCR) and protein expression (Fig. 4F) by Western blotting in Vero cells at 3, 6, or 12 h postinfection. Consistent with the results of the one-step growth assay, VSV-EBOVΔMLD displayed a faster accumulation of both VSV RNA and protein in the infected cells than VSV-EBOV. Taken together, these results suggest that VSV-EBOVΔMLD replicates faster and yields a larger amount of infectious viral progeny than VSV-EBOV.
Efficacy and safety in immunocompetent mice.
To test whether VSV-EBOV and VSV-EBOVΔMLD were safe in vivo, viruses were injected into the striatum of normal immunocompetent adult Swiss Webster mice. Neither group of injected animals displayed weight loss or signs of toxicity, and all mice survived (Fig. 5A and B). For histological analysis, additional brains were harvested at 4, 14, and 60 dpi, and the viruses were identified in coronal brain sections by fluorescent immunocytochemistry. As shown in Fig. 5C and D, both chimeric VSVs were detectable in mouse brains 4 days after intracranial (i.c.) administration. However, no infected cells were found at 14 dpi or thereafter, indicating clearance of the virus from the brain (Fig. 5C and D). Mice were euthanized after 2 months, and no detectable virus was found in brain sections of any of the brains from passage 14 (P14) or later (Fig. 5C and D).
FIG 5.

Safety after intracranial injection of VSV-EBOV and VSV-EBOVΔMLD into normal immunocompetent mice. Swiss Webster mice were intracranially injected with either VSV-EBOV or VSV-EBOVΔMLD (0.5 μl of 1.8 × 10⁸ PFU/ml for each). (A) Kaplan-Meier plot showing the survival of all animals after injection with either virus throughout the entire course of the observation period (60 days). (B) Graph showing the body weights (group mean ± SE) of animals injected in the experiment whose results are presented in panel A. Neither group of injected animals displayed weight loss. (C and D) Fluorescent immunolabeled coronal brain sections from injected animals sacrificed at 4, 14, and 60 dpi. At 4 dpi, viral infection was found surrounding the injection site in both VSV-EBOV-injected mice (C) and VSV-EBOVΔMLD-injected mice (D) (n = 2 in each group). At 14 dpi and later, no infected cells were found in either injected group. Bar, 1 mm. Ab, antibody.
VSV-EBOVs target tumors in vivo.
Red fluorescent human glioma ATCC87 cells were injected into the right striatum of CB17 SCID mice. Eight days after the implantation of glioma cells, mice were given an intravenous (i.v.) injection through the tail vein of 75 μl containing 1 × 10⁸ PFU/ml of VSV-EBOV, VSV-EBOVΔMLD, or VSV-EBOVΔMLD-GFP. Infected cells could be detected in mouse tumors as soon as 3 dpi (data not shown). By 7 dpi, mice displayed a strong tumor infection, and the tumor mass was less in virus-treated mice brains than in the control brains (Fig. 6A). Little infection was found outside the tumor area, demonstrating a rapid and selective antitumor targeting of the viruses at this point (Fig. 6B).
FIG 6.

VSV-EBOV, VSV-EBOVΔMLD, and VSV-EBOVΔMLD-GFP target glioma cells in brain. Brain sections from CB17 SCID mice implanted with unilateral striatal xenografts of human rATCC87 glioma (1 μl 5 × 10⁵ cells/μl) expressing RFP are shown. At 8 days post-tumor implantation (dpti), mice were treated by tail vein injection (75 μl of 1 × 10⁸ PFU/ml) using either VSV-EBOV (n = 4), VSV-EBOVΔMLD (n = 4), VSV-EBOVΔMLD-GFP (n = 4), or saline as a control (n = 4). At 3, 7, and 15 dpi, mice were sacrificed and brains were fixed, sectioned, and immunolabeled using a primary antibody to VSV and a green fluorescent secondary antibody. (A) At 15 dpti and 7 dpi, virus-treated mice in all three groups displayed partial and highly selective infection of implanted tumors. (B) At 23 dpti and 15 dpi, the tumors were eliminated in both the VSV-EBOV- and VSV-EBOVΔMLD-injected groups. Bar, 1 mm.
VSV-EBOV enhances survival in glioma-implanted SCID mice.
To corroborate further the therapeutic potential of these viruses, tumor-bearing mice treated with chimeric VSVs were examined with a Kaplan-Meier survival analysis (Fig. 7A and 8A). At 8 days after the implantation of red fluorescent human glioma into the SCID mouse brain (right-side striatum), viruses were administered i.v. by tail vein injection using 75 μl at 1 × 10⁸ PFU/ml (Fig. 7) or intracranially (i.c.) using 0.5 μl at 1 × 10⁸ PFU/ml (Fig. 8); control mice with tumors received an equal volume of saline instead of virus.
FIG 7.

Intravenous injection of VSV-EBOV, VSV-EBOVΔMLD, and VSV-EBOVΔMLD-GFP targets human glioblastoma and enhances survival. CB17 SCID mice were implanted with unilateral striatal xenografts of human rATCC87 glioma cells (1 μl at 5 × 10⁵ cells/μl). At 8 days post-tumor implantation (dpti), the mice were treated by tail vein injection (75 μl of 1 × 10⁸ PFU/ml) with either VSV-EBOV (n = 32), VSV-EBOVΔMLD (n = 32), VSV-EBOVΔMLD-GFP (n = 11), or saline as a control (n = 28). (A) Kaplan-Meier plot showing the survival of glioma-implanted mice after injection with the indicated chimeric VSV-EBOV or saline (control). VSV-EBOV and VSV-EBOVΔMLD injections yielded 16 and 6 survivors, respectively, at 100 dpti; VSV-EBOVΔMLD-GFP injection produced no survivors at 100 dpti, yet it enhanced the survival beyond that of the control animals. (B) Graph showing the body weights (group mean + SE) of animals injected in the experiment whose results are shown in panel A over the course of the observation period. (C) Whole-brain fluorescent imaging of two brains from each group for which the results are shown in panel A. (Top rows) Outline of brain under normal light; (bottom rows) the same brain shown in the top rows under fluorescent illumination. Tumor-bearing mice treated with VSV-EBOV (100 dpti) and VSV-EBOVΔMLD (74, 100 dpti) displayed no detectable red tumors; tumor-bearing mice treated with VSV-EBOVΔMLD-GFP (30, 32 dpti) showed small residual tumor masses (red) and infected cells (green). d, day. (D) Representative collection of brains from each treatment group for which the results are shown in panel A. The arrowheads indicate the large expansion of the tumor mass. All brains from the untreated group of control mice developed large tumors. In contrast, the brains from the survivors in the VSV-EBOV and VSV-EBOVΔMLD treatment groups displayed little or no observable tumor mass by the end of the observation period.
FIG 8.

Intracranial injection of VSV-EBOV, VSV-EBOVΔMLD, and VSV-EBOVΔMLD-GFP targets human glioblastoma and enhances survival. CB17 SCID mice with unilateral striatal xenografts of human rATCC87 glioma (1 μl of 5 × 10⁵ cells/μl) were treated with an intracranial injection (0.5 μl of 1 × 10⁸ PFU/ml) of either VSV-EBOV (n = 8), VSV-EBOVΔMLD (n = 8), VSV-EBOVΔMLD-GFP (n = 8), or saline as a control (n = 8) at 8 days post-tumor implantation (dpti). (A) Kaplan-Meier plot showing the survival of glioma-implanted mice after injection of virus or saline (control). (B) Graph showing the body weights (group mean) of animals injected in the experiment whose results are shown in panel A over the course of the observation period. (C and D) Whole-brain fluorescent imaging of two brains from each group for which the results are shown in panel A. (Top row) Outline of brain under normal light; (bottom row) the same brain in the top row under red (glioma) fluorescent illumination. Mice treated with VSV-EBOV, VSV-EBOVΔMLD, or VSV-EBOVΔMLD-GFP displayed no detectable tumors on the indicated days post-tumor implantation (dpti).
All three chimeric viruses improved the survival of tumor-bearing mice. Of interest, with both i.v. and i.c. inoculation, VSV-EBOV-treated mice showed the longest mean survival time compared with the survival times of the mice treated with the other VSV-EBOVs (Fig. 7A [P < 0.001] and Fig. 8A [P < 0.001]). Although VSV-EBOVΔMLD-GFP targeted the brain tumors and modestly enhanced survival (Fig. 7A; P < 0.001), mice treated i.c. with this virus experienced only a minimally extended life (median survival time, 35 days; n = 8) compared with that for the controls, and all mice died by day 62 post-tumor implantation.
Histological analysis of mice that died before 60 days post-tumor implantation (dpti) yet that received viral treatment by i.v. injection showed that some mice had remaining tumors without evidence of viral infection (VSV-EBOV, n = 13; VSV-EBOVΔMLD, n = 15; VSV-EBOVΔMLD-GFP, n = 3; Fig. 7). Interestingly, in the time interval after 57 dpti, in the VSV-EBOV-treated group, the mice were tumor free, but some of the mice without tumors in both the VSV-EBOVΔMLD- and VSV-EBOVΔMLD-GFP-treated groups still died. In contrast to the findings for mice in which virus was delivered i.v., none of the mice treated by i.c. virus injection showed tumors. No mouse either in the VSV-EBOVΔMLD-treated group or in the VSV-EBOVΔMLD-GFP-treated group survived (at 120 dpti), whereas 5 mice in the VSV-EBOV-treated group were still alive. The VSV-EBOV-treated mice displayed a statistically significant difference from the other two groups (for VSV-EBOV-treated mice versus VSV-EBOVΔMLD-treated mice, P < 0.05; for VSV-EBOV-treated mice versus VSV-EBOVΔMLD-GFP-treated mice, P < 0.05; Fig. 8). Analysis of other organs from i.v. inoculated mice, including lung, heart, spleen, liver, and intestine, which were immunostained, showed no detectable infection by the VSV-EBOVs.
VSV-EBOV infection has little impact on SCID mouse body weight.
Mice were observed for neurological symptoms and weighed several times each week. Both i.v. and i.c. administration of VSV-EBOV to ATCC87-derived xenografts targeted and destroyed a number of tumors (Fig. 7C and 8C) and generally had no negative effect on overall body weight (Fig. 7B and 8B). Although VSV-EBOVΔMLD showed some oncolytic activity (Fig. 7C and 8D), the body weight of i.c.-treated mice began to decline after 40 dpi (Fig. 8B). VSV-EBOVΔMLD-GFP targeted brain tumors after i.v. inoculation (Fig. 7C), but the body weight also declined in these mice as well (Fig. 7B).
VSV-EBOV displays the highest tumor specificity.
To further assess the therapeutic potential of these chimeric VSVs, we examined the brains of the infected and the control animals histologically. Immunostaining was done with anti-VSV antisera. Widespread infection by VSV-EBOVΔMLD and VSV-EBOVΔMLD-GFP was found throughout the brains of injected animals (Fig. 9C and 10C and D). Robust infection was found not only at the striatal site of injection but also in the contralateral striatum, hippocampus, hypothalamus, and cortex (Fig. 9C and 10C and D). Even as early as 32 dpi, mice treated i.v. with VSV-EBOVΔMLD-GFP showed a strikingly wide distribution of infected neurons within the brain (Fig. 9C). In contrast, brain cells were only rarely infected with VSV-EBOV (Fig. 9B).
FIG 9.

VSV-EBOV displays the highest selectivity for targeting glioma relative to the other chimeric VSV-EBOVΔMLDs tested. The coronal brain sections shown here are from mouse brains harvested and shown in Fig. 7. (A) Section from an untreated control mouse bearing a red fluorescent rATCC87 tumor. Brain was harvested at 28 dpti, and tumor expansion displaced a large volume of brain tissue. (B) Section from a tumor-implanted mouse (100 dpti) 92 days after treatment with VSV-EBOV. The tumor implant was completely eradicated, with no residual infection of normal brain tissue. (C) Sections from tumor-implanted mice treated with VSV-EBOV (top row), VSV-EBOVΔMLD (center row), and VSV-EBOVΔMLD-GFP (bottom row). Little infection was found in VSV-EBOV-treated animals. In contrast, sections from VSV-EBOVΔMLD- and VSV-EBOVΔMLD-GFP-treated mice displayed a wide distribution of infected cells, including striatum, cortex, hippocampus, and hypothalamus.
FIG 10.

VSV-EBOV targets intracranial glioma. The brains shown here are from mice injected in the experiment for which the results are shown in Fig. 12. A representative collection of brains harvested from each group is shown (top), with the arrow indicating the brain used for coronal sections (bottom two rows) imaged using phase (1st square), red fluorescent (2nd square), and green fluorescent (3rd square) illumination. (Bottom row) Higher-magnification images of the middle row under green fluorescence are of features indicated in the lower-magnification images (a, b, c). (A) Sections from a control mouse obtained at 28 dpti, showing substantial red glioma tumor expansion. (B) Sections from a VSV-EBOV-treated mouse (obtained at 120 dpti), showing complete eradication of the tumor and little remaining viral infection. (C and D) Sections from VSV-EBOVΔMLD-treated mice (obtained at 81 dpti) and VSV-EBOVΔMLD-GFP-treated mice (obtained at 27 dpti) showing no remaining tumor and a wide distribution of infected cells.
Quantification of brain infection after i.v. and i.c. administration of VSVs was performed by counting the number of infected neurons and glia in coronal brain sections (n = 3 animals/group) (Fig. 11 and 12). Infected neurons and glia were detected throughout the brain; some brains showed stronger infection in subregions of the brain, and different mice infected with the same virus showed variability in brain infection patterns. For instance, some VSV-EBOVΔMLD-infected mice showed stronger infection in the septum (Fig. 11B, left), whereas others infected with the same virus showed little septal infection (Fig. 11B, right), suggesting some variability in relative infection in different brain regions. SCID mice treated with VSV-EBOVΔMLD and VSV-EBOVΔMLD-GFP displayed far more infected cells than VSV-EBOV-treated mice (Fig. 11D [P < 0.001, n = 3] and Fig. 12D [P < 0.001, n = 3]), irrespective of the route of virus administration.
FIG 11.

VSV-EBOV, VSV-EBOVΔMLD, and VSV-EBOVΔMLD-GFP infection of tumor-bearing mouse brain after intravenous inoculation. Illustrations of the brain sections shown here are based on mouse brains that were examined and for which the images and results are shown in Fig. 6 and 7. For each immunolabeled section shown, multiple overlapping fluorescent images were stitched together and examined for infected neurons (red dots) and glia (blue dots). The days post-tumor implantation are indicated to the left of each section. (A to C) Illustrations of the brain sections from VSV-EBOV-infected mice (A), VSV-EBOVΔMLD-infected mice (B), and VSV-EBOVΔMLD-GFP-infected mice (C). (D) Bar graphs showing the number of neurons (red) and glia (blue) counted in each section.
FIG 12.

VSV-EBOV and VSV-EBOVΔMLD-GFP propagation in the mouse brain after intracranial inoculation. The illustrations of brain sections shown here are based on mouse brains that were examined and for which the images and results are shown in Fig. 8 and 10. For each immunolabeled section shown, multiple overlapping fluorescent images were stitched together and examined for infected neurons (red dots) and glia (blue dots). The days post-tumor implantation are indicated to the left of each section. (A to C) Illustrations of the brain sections from VSV-EBOV-infected mice (A), VSV-EBOVΔMLD-infected mice (B), and VSV-EBOVΔMLD-GFP-infected mice (C). (D) Bar graphs showing the number of neurons (red) and glia (blue) counted in each section. (E) To avoid complications due to the presence of tumor cells, the brains in which either of the two viruses was injected intracranially in mice with no tumors were studied. Typical of brains infected with VSV-EBOVΔMLD, strong infection of the dentate granule cells (arrows) was found. (F) Some granule cells show punctate strong labeling (arrowheads). (G) In contrast, little infection of the same area was found in the brains of mice infected with VSV-EBOV. (H) Infection with VSV-EBOV was suggestive of a late-stage infection, with poor cell morphology remaining. (I) Neurons were counted in the dentate gyrus of the hippocampus in sections of 4 dentate gyri in mice infected with either VSV-EBOV (n = 3 mice) or VSV-EBOVΔMLD (n = 3 mice) by intracranial inoculation. The bar graph shows the mean ± SEM. ***, P < 0.001.
To compare the two viruses without the confounding variable of tumor presence, we injected each virus intracranially into SCID mice. After 4 weeks, the mice were euthanized and immunostained brain sections were generated. In mice that received intracranial VSV-EBOV, virus-immunoreactive cells were found at late stages of infection, with the cellular structure being suggestive of strong deterioration (Fig. 12G and H). In contrast, the brains of mice injected with VSV-EBOVΔMLD showed more infected cells, particularly neurons, with the cell structure being suggestive of recent infection; these cells showed a morphology typical of newly infected cells, with robust dendritic trees and little cell deterioration (Fig. 12E and F). All mice that received VSV-EBOVΔMLD showed multiple sites of hippocampal/dentate gyrus and hilus infection with strong labeling of infected excitatory granule cell neurons and their dendrites; we did not see substantive infection of the hippocampus/dentate gyrus in mice that received VSV-EBOV (P < 0.001) (Fig. 12I).
A critical question here is, why did the tumor-bearing mice that were treated with virus die? First, all the tumor-bearing control mice not treated with virus showed large expanded tumors that resulted in a lethal response to the tumor. The tumor-bearing mice treated with VSV-EBOVΔMLD-GFP showed a modest extension of survival, but all died. Histological analysis of these mice revealed brain tumors, some with incomplete virus infection. Tumor-bearing mice treated with VSV-EBOVΔMLD were found to have tumors with a histology similar to that of tumors from the VSV-EBOVΔMLD-GFP-treated group but displayed a greater extension of survival. A critical benefit of VSV-EBOV was the relative lack of host brain infection over longer intervals. The collateral infection of normal host brain cells by the other two viruses contributed to the reduced survival that they provided.
VSV-EBOVs upregulate ISGs, DCs, and NK cells.
Although CB17 scid/scid (SCID) mice contain an autosomal recessive mutation in the prkdc gene, resulting in a deficiency of mature T and B lymphocytes, normal antigen-presenting cells, myeloid, natural killer (NK) cell, and interferon (IFN) functions are still present (https://www.jax.org/strain/001303). To determine whether VSV-EBOVΔMLD and VSV-EBOV have similar capacities to induce innate IFN-mediated antiviral responses, we investigated whether intracranial infection with these viruses leads to different levels of interferon-stimulated gene (ISG) expression. Compared to the findings for uninfected control brains, expression of the representative ISGs 2′,5′-oligoadenylate synthetase 1A (OAS) and IFN-induced protein with tetratricopeptide repeats 3 (IFIT3) in the brains of both VSV-EBOVΔMLD- and VSV-EBOV-infected mice showed similar significant increases at 2 days following infection (Fig. 13).
FIG 13.
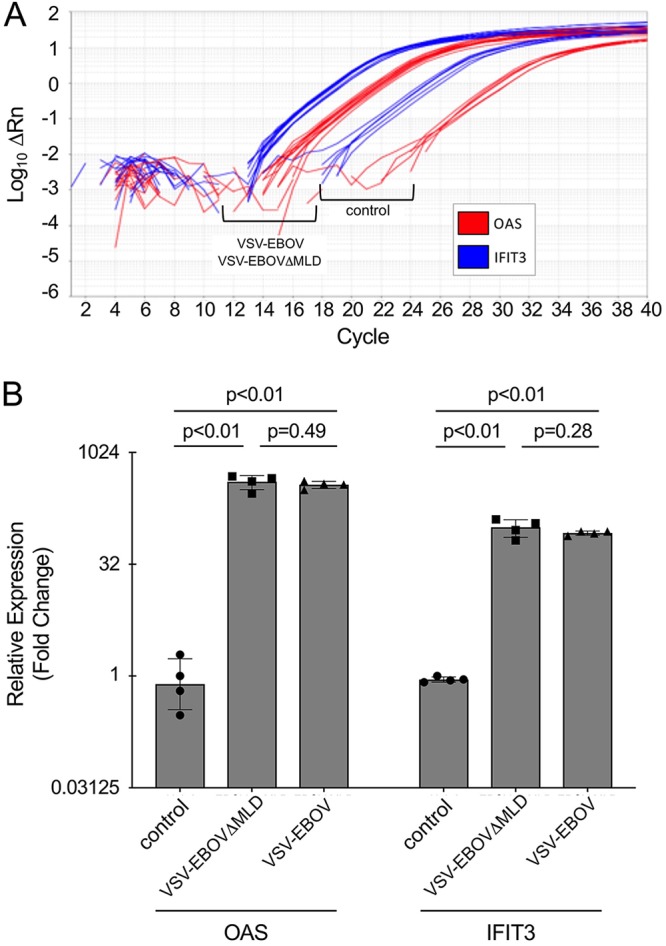
Equivalent activation of ISG expression by VSV-EBOVΔMLD and VSV-EBOV. (A) Representative RT-qPCR measurement of OAS and IFIT3 mRNA expression in uninfected brains (control) and in mice infected with VSV-EBOVΔMLD and VSV-EBOV. On the y axis, ΔRn is normalized reporter fluorescence minus baseline. (B) Quantification of OAS and IFIT3 expression, shown as the fold change relative to the results for one uninfected control mouse. Bar graphs indicate means, and error bars indicate the standard deviation (n = 4). P values indicate the results of Student's t test.
To examine the response of innate immune cells to VSV-EBOVs in this immunocompromised mouse, we investigated conventional dendritic cells (cDCs) and natural killer (NK) cells using flow cytometry. Seven- to 8-week-old SCID mice were intravenously injected with 75 μl of 1 × 10⁸ PFU/ml VSV-EBOV or VSV-EBOVΔMLD-GFP or with an equal volume of saline (control). Spleens were collected at 3 and 7 dpi (Fig. 14A). Both VSV-EBOV and VSV-EBOVΔMLD-GFP increased the number of cDCs (Fig. 14B to D) and NK cells (Fig. 14E to H) compared with that in the control mice (3 dpi; VSV-EBOV-treated mice, P < 0.05; VSV-EBOVΔMLD-GFP-treated mice, P < 0.05). We further analyzed and quantified the mean fluorescence intensity of the DC activation marker CD86; mature cDCs upregulate the CD86 coreceptor to provide help to CD4 T cells (22). At days 3 and 7 postinfection, CD86 expression was significantly increased in the cDCs of both VSV-EBOV- and VSV-EBOVΔMLD-GFP treated mice (VSV-EBOV-treated mice, P < 0.05; VSV-EBOVΔMLD-GFP-treated mice, P < 0.05) (Fig. 14D).
FIG 14.

DC and NK cells in the spleens of VSV-EBOV- and VSV-EBOVΔMLD-GFP-infected mice. (A) VSV-EBOV (n = 5; 75 μl of 1 × 10⁸ PFU/ml), VSV-EBOVΔMLD-GFP (n = 7; 75 μl of 1 × 10⁸ PFU/ml), or saline (control) was injected into the tail vein of CB17 SCID mice, and spleens were harvested at 3 dpi or 7 dpi. PE, phycoerythrin; FITC, fluorescein isothiocyanate; APC, allophycocyanin; BV510, Brilliant Violet 510. (B and C) Representative flow plots showing CD11C+ major histocompatibility complex class II-positive DC cells (gated on live CD45+ cells). (D) (Left) Amounts of DCs in live CD45+ splenocytes at 3 and 7 dpi after virus infection, expressed as a percentage of the total number of live CD45+ cells. (Right) Quantification of the mean fluorescence intensity of CD86 (CD86 MFI) in DCs. The mean of the control value in each group was set at 1. Two-way ANOVA with Tukey’s multiple comparisons between all data sets was used in one representative of two independent experiments (*, P < 0.05; ***, P < 0.001). (E and G) Representative flow plots showing DX+ NK cells (gated on live CD45+ cells). SSC, side scatter. (F and H) Percentage of DX5+ NK cells in live CD45+ splenocytes. Data are means ± SEM. The mean of the control value in each group (3 dpi and 7 dpi) is set at 0.1. The significance of differences was determined by two-way ANOVA with Tukey’s multiple comparisons between all data sets using one representative of two independent experiments (*, P < 0.05).
DISCUSSION
We compared three different chimeric VSV-EBOV recombinants in xenotransplant immunodeficient mouse models carrying human brain tumors and found that VSV-EBOV with the Ebola virus MLD displayed a substantially enhanced safety and efficacy profile relative to VSV-EBOVΔMLD and VSV-EBOVΔMLD-GFP, both of which lack the mucin-like domain of their respective EBOV GPs.
Consistent with our previous report (15), VSV-EBOVΔMLD-GFP was ineffective at rescuing tumor-bearing animals from lethality after either i.v. or i.c. injection of virus and was the least effective of the three chimeric VSV-EBOVs tested. Whereas VSV-EBOVΔMLD-GFP did target the brain glioma after injection, it did not completely infect the tumor and produced only a modest prolongation of survival. The presence of a GFP reporter gene in the first genomic position of VSV-EBOVΔMLD-GFP attenuates viral propagation relative to the propagation of the same genomic construct without the GFP reporter, as previously observed with other recombinant VSVs (23, 24), and likely accounts for at least some of the reduction in efficacy of this recombinant relative to that of VSV-EBOVΔMLD.
Interestingly, while both VSV-EBOVΔMLDs (with and without GFP) enhanced tumor-bearing animal survival, they also propagated throughout the brain, yielding a widespread infection of normal brain cells. Infected cells consisted of both neurons and glia, with the number of infected neurons being approximately 50-fold greater than the number of infected glia. In contrast, VSV-EBOV infected very few brain cells, with little apparent preference between neurons and glia. This was true both in mice that had brain tumors and in control mice with no tumor in the brain. This suggests that removal of the MLD sequence may substantially enhance the ability of VSV-EBOVΔMLDs to propagate among normal cells in the SCID mouse brain. Deletion of the MLD does not impair the fundamental function of viral entry and receptor binding to host cells in vitro and has been reported to yield an enhancement of viral propagation (2, 25–28). Consistent with these previous reports, our one-step growth analyses showed that VSV-EBOVΔMLD generated more than a 10-fold greater release of infectious viral progeny than VSV-EBOV in both human glioblastoma and mouse brain cells. This result was further recapitulated in Vero cells, which also demonstrated an increased production of VSV RNA and VSV protein during the early period of infection. Vero cells carry a homozygous chromosomal deletion of their entire type I interferon gene cluster, thus knocking out type I interferon expression (29). Whereas interferon effects may contribute to some of the differences observed between VSV-EBOV and VSV-EBOVΔMLD in normal cells, this would not be true of Vero cells and suggests that interferon effects on innate cellular immunity may not be the primary mechanism underlying greater VSV-EBOVΔMLD propagation relative to that of VSV-EBOV with the MLD. It has been suggested that, after infection, wild-type glycoprotein is typically retained in the Golgi apparatus of the host cell until all the serine and threonine residues in the MLD are modified through glycosylation and that deletion of the MLD may permit more rapid transit through the Golgi system, yielding higher levels of glycoprotein processing and greater surface expression (2). As suggested by these studies and our one-step growth experiments, similar mechanisms might underlie the enhanced propagation of VSV-EBOVΔMLDs among normal brain cells in SCID mice lacking a functional adaptive immune system. Another factor that may contribute to the higher lethality associated with the VSV-EBOVΔMLD-GFP is the VSV backbone, which was slightly different from the VSV from the non-GFP-bearing viruses (20, 21); the VSV-EBOVΔMLD-GFP genome encoded a number of amino acid differences in all four VSV proteins that may have altered virus behavior, even with the expected attenuation due to the insertion of a GFP reporter gene in the first genomic position, as delineated in the Results section (Fig. 1C).
Additionally, the few infected normal cells observed in these mice after VSV-EBOV injection indicate that the activity of the innate immune system, which remains functional in SCID mice, is sufficient to curtail the widespread propagation of this virus throughout the brain. Injections of VSV-EBOVΔMLD and VSV-EBOV into the brains of immunocompetent Swiss Webster mice produced only a short-lived local infection of cells surrounding the injection site, indicating that the combined activity of the innate and adaptive immune system in these animals is fully capable of terminating the spread of both viruses within the brain. Taken together, these results suggest that while the innate immune system may not be sufficient to limit the infection of normal cells by VSV-EBOVΔMLD, innate immunity alone appears to be capable of curtailing the widespread propagation of VSV-EBOV within the brain. Furthermore, the combined activity of both the innate and the adaptive immune systems terminates the continued infection of normal cells by both viruses and underlines the importance of normal systemic immunity, including the presence of the T- and B-cell responses that are attenuated in the SCID mouse brain.
We examined several cells and the responses of both the systemic and the innate immune systems. VSV-EBOVs with and without the MLD both enhanced spleen NK cells and increased the number and the CD86 upregulation of dendritic cells, but no difference was found between viruses with or without the MLD. Similarly, both viruses greatly enhanced the expression of interferon-stimulated genes OAS and IFIT3 in the brain, but no differences in enhanced expression were detected between the two genotypes. Although we found no differences, it is possible that at longer exposure intervals, differences might be detectable. Innate immunity, including type I interferon responses, can enhance the immune system-mediated destruction of infected tumor cells (30). These results indicate that the influence of the MLD on VSV-EBOV tumor destruction and spread within the brain appears to occur independently of the innate and adaptive immune responses to the virus and is likely a consequence of differences in virus infectivity, replication, or spread. This conclusion is supported by the one-step growth curves, RT-qPCR, and Western blot analyses, all of which showed the greater replication of VSV-EBOVΔMLD than of VSV-EBOV.
Intravenous and direct intracranial injections of the viruses were compared. Although i.v. inoculation was successful in several cases, tumor-bearing mice with intracranial virus delivery showed a greater degree of tumor infection and tumor elimination. These results suggest that intracranial delivery may be a more reliable approach than i.v. administration for treating brain tumors in vivo. We did find that the VSV-EBOVs also selectively targeted mouse melanoma; further studies of mouse tumor cells in the immunocompetent mouse brain may therefore be beneficial. Intravenous inoculation may retain some advantage in selectively infecting small or undetected peripheral melanomas, similar to the findings seen with some attenuated VSVs retaining the VSV glycoprotein (31).
Here we focused our experiments on human cancer cells within the brain, particularly human glioblastoma, and found that VSV-EBOV does a good job in targeting and eliminating the tumor in many SCID mice. These results suggest that the virus merits further testing in additional models of brain tumors. Previous work has shown that VSV-EBOVs are safe in the primate brain (13); additionally, the use of VSV-EBOV in over a quarter of a million humans in vaccinations against Ebola virus in Africa (12) supports the perspective that this chimeric virus is relatively safe in humans and certainly safer than either of the parent viruses (VSV or Ebola virus). Although VSV-EBOV appears to be substantially safer than VSV-EBOVΔMLD in SCID mice, in primates, including humans, with normal immune responses, both viruses merit further testing for their oncolytic potential in humans.
MATERIALS AND METHODS
Cells.
The human glioblastoma cell line ATCC87 was originally obtained from the American Type Culture Collection (ATCC; Manassas, VA) as U87MG cells. The U87MG cells distributed by ATCC have recently been reported (32) to differ in genotype from the original U87MG line established at the University of Uppsala (33). Based on the mRNA expression profile of these cells, it was concluded that the cell line is of human central nervous system origin and likely to be from a glioblastoma derived from an unknown patient (32). We genotyped our U87MG cells from ATCC and confirmed that they match the ATCC-specific genotype that was previously reported (32). We refer to these cells as ATCC87 cells. The U251 human glioblastoma line was also originally obtained by us (via R. Matthews, Yale University, New Haven, CT) from ATCC as U373MG cells. These cells have recently been reported to be misidentified U251 cells that were widely distributed by ATCC (34). We genotyped our cultures of these cells and found that they match the previously reported U251 genotype (34). The U118 and A172 human glioblastoma cell lines were also kindly provided by R. Matthews (Yale University, New Haven, CT), and genotyping of these lines confirmed their identity. Stably transfected recombinant ATCC87 (rATCC87) cells expressing DsRed fluorescent protein (RFP) have been described previously (31). Normal human glial cells were established from tissue derived from patients undergoing epilepsy surgery, as previously described (35–37). The mouse glioma cell lines GL261 and CT-2A were obtained from T. Seyfried (Boston College, Chestnut Hill, MA). Primary mouse glial cultures were generated by dissociating brain tissue from P1 mice as previously described (15). Human melanoma cells were supplied by the Yale University Skin Cancer SPORE, and normal human melanocytes were obtained from the cell culture facility of the Yale Skin Disease Research Core Center (YSDRCC). Human cells were collected consistent with HIPAA policy, and use of the tissue was approved by the Yale University human investigation committee. Vero cells (used in the propagation and harvesting of VSV) were a kind gift from Connie Cepko (Harvard Medical School, Boston, MA). BHK-21 (WI-2) cells (38, 39) were a gift from Jack Rose (Yale University School of Medicine, New Haven, CT). Human and mouse glioma cells and normal glial cells were maintained in Dulbecco modified Eagle medium (DMEM; Invitrogen, Carlsbad, CA) supplemented with 10% fetal bovine serum (FBS) and 1% penicillin-streptomycin (pen-strep) solution (Invitrogen). BHK-21 (WI-2) cells were maintained in Glasgow minimal essential medium (MEM; Invitrogen) supplemented with 10% FBS, 2% MEM amino acids (MEMAA), 1% tryptose phosphate broth (TPB), and 0.5% pen-strep solution (40). Melanoma cells were maintained in Opti-MEM with 5% FBS and 1% pen-strep (Invitrogen), and melanocytes were maintained in medium containing additional supplements, listed elsewhere (31). Vero cells were maintained in MEM with 10% FBS and 1% pen-strep (Invitrogen). All cell cultures were incubated in a humidified atmosphere containing 5% CO2 at 37°C. Micrographs were taken on an Olympus IX70 fluorescence microscope; contrast and brightness were corrected with Adobe Photoshop software, treating the entire image simultaneously.
Viruses.
Five recombinant VSVs were used in this study (Fig. 1A). VSV-EBOV is a chimeric VSV in which the normal Indiana serotype VSV glycoprotein has been replaced with the full-length glycoprotein (GP) from the Mayinga strain of EBOV (40). VSV-EBOVΔMLD was engineered in a similar manner; however, the EBOV GP carries a deletion of the mucin-like domain (ΔMLD) (Fig. 1A and B). VSV-EBOV and VSV-EBOVΔMLD were generated as previously described (40, 41). Both viruses were generated using recombinant VSV plasmids derived from those described by Lawson et al. (20). VSV-EBOVΔMLD-GFP is an attenuated version of VSV-EBOVΔMLD that carries a gene for GFP inserted into the first genomic position of the VSV genome (14, 15). VSV-EBOVΔMLD-GFP was obtained from Sean Whelan (Harvard Medical School, Boston, MA) and was generated using recombinant VSV plasmids derived from those described by Whelan et al. (21). VSVwt is a recombinant VSV described previously (20), and VSVwt-GFP is an attenuated version of the same virus that has been engineered to express GFP from the first genomic position (23). VSVwt and VSVwt-GFP were kind gifts from Jack Rose (Yale University School of Medicine, New Haven, CT) and were generated using recombinant VSV plasmids derived from those used in the study of Lawson et al. (20). Comparisons between VSV genes derived from Lawson et al. (20) and Whelan et al. (21) were performed using sequences obtained from GenBank (accession number FJ478454) and Addgene (plasmid number 31833), respectively. All VSVs were propagated and harvested using Vero cells, as described previously (15), and viral titers were determined by plaque assay on Vero cells using crystal violet counterstaining prior to the experiments.
Viral infection and plaque-size assays.
Cells to be tested were plated overnight in 24-well dishes at a density of 50,000 cells per well. After 24 h, 1 ml of medium containing VSV was added to yield a final concentration with an MOI of 1. After 24 h, the cells were fixed with 4% paraformaldehyde and then visualized by immunolabeling with a primary antibody against VSV (42), together with a secondary fluorescent antibody, as described previously (43). To determine the relative number of cells infected for each particular virus, the total number of cells and the number of infected cells were counted based on the numbers from at least three culture dishes inoculated with each of the four viruses.
Plaque-size assays were used to compare the propagation of VSVs by normal cells and multiple cancer cell types, as described previously (24, 31). Briefly, 12-well cultures of cell monolayers were inoculated with serial dilutions of virus and then overlaid with a nonsolid viscous 1% solution of methylcellulose (catalog number M0512; Sigma-Aldrich, St. Louis, MO) in DMEM. After 1, 2, and 3 days, infected cultures were fixed using 4% paraformaldehyde. The viscous overlay was removed, and plaques were visualized by fluorescent immunostaining. Plaque sizes were measured (n = 60 plaques/condition) using fluorescence microscopy.
One-step growth curves.
One step-growth curves (44, 45) were performed for VSV-EBOV and VSV-EBOVΔMLD in a manner similar to that previously described (24, 46). Briefly, primary mouse brain, ATCC87, and Vero cells were grown in 35-mm wells (1.2 × 10⁶ cells/well; duplicate wells per condition) of a 6-well plate and then infected with each of the viruses to be tested (MOI = 10) and allowed to incubate for 1 h. After incubation, the inoculum was removed and each well was washed twice with phosphate-buffered saline (PBS) to remove unadsorbed virus and then replenished with 3 ml of medium and returned to the incubator. At the indicated time points (Fig. 4C), 100 μl of medium was removed and stored at −80°C for subsequent measurements of the viral titer. At each time point, after the samples were drawn, the medium in each well was returned to its initial volume using 100 μl of fresh medium. Plaque assays using Vero cells counterstained with crystal violet were subsequently used to determine the viral titer of each sample. The resulting duplicate sample titers for each condition at each time point were averaged.
Mouse procedures.
Seven- to 8-week-old immunodeficient homozygous CB17 SCID mice (The Jackson Laboratory, Bar Harbor, ME) were used for xenograft brain tumor models. Mice were pretreated (intraperitoneally) with meloxicam (Metacam; 0.3 mg/kg of body weight) and buprenorphine HCl (0.05 mg/kg). After 2 h, the mice were anesthetized using a combination of ketamine and xylazine (100 and 10 mg/kg, respectively), applied intraperitoneally. rATCC87 glioblastoma cells (expressing a red fluorescent reporter gene) were harvested in the logarithmic growth phase, resuspended in saline, and injected intracranially (1 μl; 5 × 10⁵ cells/μl) into the striatum (2 mm lateral and 0.5 mm rostral to bregma at a 3-mm depth) using a microsyringe (Hamilton Co., Reno, NV) controlled by a stereotactic injector (Stoelting Co., Wood Dale, IL).
At 8 days after tumor placement, the mice received saline (control) or virus via intracranial (i.c.) or intravenous (i.v.) injection. For the i.c. injection, viruses (0.5 μl at 1 × 10⁸ PFU/ml) were injected in the vicinity of the tumor. For the i.v. injection, mice were administered virus (75 μl at 1 × 10⁸ PFU/ml) by tail vein injection. In some experiments, normal immunocompetent adult Swiss Webster mice were i.c. injected into the left striatum with virus (0.5 μl at 1.8 × 10⁸ PFU/ml) during transient anesthesia.
The animals were monitored daily with measurements of body weight, food and water consumption, and overall health. During the survival studies, mice were euthanized if either of the following conditions were observed: weight loss of 25% or more or the development of adverse neurological symptoms, including immobility and impaired movement. All surviving mice were euthanized at the end of the observation period of a survival study. For histologic analysis of early stages of viral infection, some mice were euthanized at earlier time points. Mice were euthanized using an anesthetic overdose and perfused transcardially with saline followed by freshly prepared 4% paraformaldehyde (PFA) solution. Brains were fixed overnight with 4% PFA, dehydrated using a 30% sucrose solution for at least 1.5 days, frozen in 7.5% gelatin plus 15% sucrose, and cut into 35- to 50-μm coronal sections using a cryostat. All experiments using mice were approved by the Yale University Animal Care and Use Committee (IACUC; approval number 10117). Mice were maintained in a biosafety level 2 (BL2)/BL2+ containment room.
RT-qPCR.
RT-qPCR was used for analysis of interferon-stimulated gene (ISG) expression in SCID mice and VSV RNA in Vero cells. For the SCID mouse experiment, 6- to 7-week-old immunodeficient homozygous CB17 SCID mice underwent stereotactic i.c. injections, using 4 μl of virus (1 × 10⁸ PFU/ml) or PBS (control), into both sides of the striatum. Forty hours later, the animals were euthanized and the brains were harvested, diced into small pieces, and then stabilized using the RNAlater reagent (Qiagen, Valencia, CA) and stored at 4°C. For the cell culture experiments, Vero cells were infected at an MOI of 10, harvested at 3, 6, or 12 h after infection, and lysed in RLT buffer (Qiagen). Total RNA was isolated from the mouse brain tissue or Vero cells using an RNeasy midi- or minikit (Qiagen). cDNA was prepared using equal amounts of total RNA from each sample with a high-capacity cDNA reverse transcription kit (Applied Biosystems, Waltham, MA). Gene expression was measured by quantitative PCR using a StepOnePlus real-time PCR system (Applied Biosystems) with SYBR green reagents, and data were analyzed using StepOne software (v2.3). Gene expression was normalized to that of glyceraldhehyde-3-phosphate dehydrogenase (GAPDH) and quantified by the ΔΔCT threshold cycle (CT) method. The primer sequences for RT-qPCR were as follows: mouse GAPDH, 5′-TCT GGA AAG CTG TGG CGT G-3′ (forward) and 5′-CCA GTG AGC TTC CCG TTC AG-3′ (reverse); human/monkey GAPDH, 5′-AAG TAT GAC AAC AGC CTC AAG ATC-3′ (forward) and 5′-CTG TGG TCA TGA GTC CTT C-3′ (reverse); VSV N, 5′-GAT AGT ACC GGA GGA TTG ACG ACT A-3′ (forward) and 5-TCA AAC CAT CCG AGC CAT TC-3′ (reverse); 2′,5′-oligoadenylate synthetase 1A (OAS), 5′-GAT GTC AAA TCA GCC GTC AA-3′ (forward) and 5′-AGT GTG GTG CCT TTG CCT GA-3′ (reverse); and IFN-induced protein with tetratricopeptide repeats 3 (IFIT3), 5′-GGG AAA CTA CGC CTG GAT CTA CT-3′ (forward) and 5′-CAT GCT GTA AGG ATT CGC AAA C-3′ (reverse).
SDS-PAGE and Western blot analysis.
Vero cells infected with VSV-EBOV or VSV-EBOVΔMLD were lysed with radioimmunoprecipitation assay buffer (Sigma), and the protein concentration was quantified using a bicinchoninic acid protein assay kit (Thermo Scientific Pierce). For each sample, 5 μg of total protein was separated by 10% SDS-PAGE. Separated proteins were transferred to nitrocellulose membranes, which were blocked with PBS, 0.05% Tween 20, and 5% nonfat dry milk for 1 h at room temperature. Blocked membranes were incubated overnight with a 1:1,000 dilution of rabbit polyclonal anti-VSV antibody (kindly provided by Jack Rose, Yale University) at 4°C. Secondary antibody incubation was carried out with anti-rabbit immunoglobulin horseradish peroxidase-labeled antibody at room temperature for 1 h. Following detection, the blots were stripped for 45 min in stripping buffer (62.5 mM Tris-HCl, 2% SDS, 0.8% β-mercaptoethanol) at 50°C, washed with water, reblocked, and reprobed with primary goat anti-actin (I-19) antibody (catalog number sc-1616; Santa Cruz Biotechnology). Secondary antibody incubation was carried out with anti-goat immunoglobulin horseradish peroxidase-labeled antibody. The Clarity Western enhanced chemiluminescence reagent (Bio-Rad) was used for protein detection with a ChemiDoc MP imaging system (Bio-Rad). Images were acquired using Image Lab software.
Flow cytometry.
Spleens were harvested from 6- to 7-week-old immunodeficient homozygous CB17 SCID mice 3 or 7 days after i.v. injection of virus (75 μl at 1 × 10⁸ PFU/ml). To prepare single-cell suspensions, spleens were cut into small fragments and digested for 30 min at 37°C with mixing in 10 ml Hank’s buffer containing 5-mg/ml type II collagenase (Invitrogen). At the end of digestion, 200 μl of the cell suspension was filtered through nylon mesh to remove undigested fibrous material. Digested cells were further treated with red blood cell lysis buffer (150 mM ammonium chloride, 10 mM potassium bicarbonate, 0.1 mM EDTA). Single-cell suspensions (2 million cells) were preincubated with Fc blocking antibody (monoclonal antibody 2.4G2) and stained with LIVE/DEAD fixable yellow dye to discriminate dead cells (Invitrogen). Cells were surface stained with the antibodies described below for 30 min at 4°C. Flow cytometry was performed on a fluorescence-activated cells sorter (LSR II flow cytometer; Becton, Dickinson, Franklin Lakes, NJ), and the results were analyzed with FlowJo software (TreeStar, Portland, OR). The monoclonal antibodies used were fluorescein isothiocyanate-conjugated anti-CD86, phycoerythrin (PE)-conjugated CD45, allophycocyanin-Cy7-conjugated CD11C, peridinin chlorophyll protein-Cy5.5-conjugated CD11b, Brilliant Violet 510-conjugated IA/B, and PE-Cy7-conjugated DX5 (BioLegend, San Diego, CA).
Statistics.
Statistical analysis was performed by using SPSS (v13.0) software (IBM, Armonk, NY). The experimental and control data were analyzed by one-way analysis of variance (ANOVA) followed by the two-sided Dunnett’s test. Kaplan-Meier survival curves were generated using GraphPad Prism (v5.0) software (GraphPad Software, San Diego, CA). Statistical significance between groups was determined using the log-rank test. In all studies, a P value of <0.05 was considered statistically significant.
ACKNOWLEDGMENTS
We thank Sean Whelan and Jack Rose for supplying some of the recombinant VSVs used in the present study. We thank Guido Wollmann for suggestions during the preparation of the manuscript.
This study was in part supported by the Intramural Research Program, NIAID, NIH, and by NIH R01 grants CA188359 and CA161048.
A. N. van den Pol has a financial interest in Implicyte; the other authors report no conflict of interest.
REFERENCES
- 1.World Health Organization (WHO). 2018. Fact sheet: Ebola virus disease. www.who.int/en/news-room/fact-sheets/detail/ebola-virus-disease.
- 2.Jeffers SA, Sanders DA, Sanchez A. 2002. Covalent modifications of the Ebola virus glycoprotein. J Virol 76:12463–12472. doi: 10.1128/jvi.76.24.12463-12472.2002. [DOI] [PMC free article] [PubMed] [Google Scholar]
- 3.Takada A. 2012. Filovirus tropism: cellular molecules for viral entry. Front Microbiol 3:34. doi: 10.3389/fmicb.2012.00034. [DOI] [PMC free article] [PubMed] [Google Scholar]
- 4.Ortega V, Stone JA, Contreras EM, Iorio RM, Aguilar HC. 2019. Addicted to sugar: roles of glycans in the order Mononegavirales. Glycobiology 29:2–21. doi: 10.1093/glycob/cwy053. [DOI] [PMC free article] [PubMed] [Google Scholar]
- 5.Dowling W, Thompson E, Badger C, Mellquist JL, Garrison AR, Smith JM, Paragas J, Hogan RJ, Schmaljohn C. 2007. Influences of glycosylation on antigenicity, immunogenicity, and protective efficacy of Ebola virus GP DNA vaccines. J Virol 81:1821–1837. doi: 10.1128/JVI.02098-06. [DOI] [PMC free article] [PubMed] [Google Scholar]
- 6.Lee JE, Fusco ML, Hessell AJ, Oswald WB, Burton DR, Saphire EO. 2008. Structure of the Ebola virus glycoprotein bound to an antibody from a human survivor. Nature 454:177–182. doi: 10.1038/nature07082. [DOI] [PMC free article] [PubMed] [Google Scholar]
- 7.Martinez O, Tantral L, Mulherkar N, Chandran K, Basler CF. 2011. Impact of Ebola mucin-like domain on antiglycoprotein antibody responses induced by Ebola virus-like particles. J Infect Dis 204:S825–S832. doi: 10.1093/infdis/jir295. [DOI] [PMC free article] [PubMed] [Google Scholar]
- 8.Reynard O, Borowiak M, Volchkova VA, Delpeut S, Mateo M, Volchkov VE. 2009. Ebolavirus glycoprotein GP masks both its own epitopes and the presence of cellular surface proteins. J Virol 83:9596–9601. doi: 10.1128/JVI.00784-09. [DOI] [PMC free article] [PubMed] [Google Scholar]
- 9.Francica JR, Varela-Rohena A, Medvec A, Plesa G, Riley JL, Bates P. 2010. Steric shielding of surface epitopes and impaired immune recognition induced by the Ebola virus glycoprotein. PLoS Pathog 6:e1001098. doi: 10.1371/journal.ppat.1001098. [DOI] [PMC free article] [PubMed] [Google Scholar]
- 10.Henao-Restrepo AM, Longini IM, Egger M, Dean NE, Edmunds WJ, Camacho A, Carroll MW, Doumbia M, Draguez B, Durraffour S, Enwere G, Grais R, Gunther S, Hossmann S, Konde MK, Kone S, Kuisma E, Levine MM, Mandal S, Norheim G, Riveros X, Soumah A, Trelle S, Vicari AS, Watson CH, Keita S, Kieny MP, Rottingen JA. 2015. Efficacy and effectiveness of an rVSV-vectored vaccine expressing Ebola surface glycoprotein: interim results from the Guinea ring vaccination cluster randomised trial. Lancet 386:857–866. doi: 10.1016/S0140-6736(15)61117-5. [DOI] [PubMed] [Google Scholar]
- 11.Chappell KJ, Watterson D. 2017. Fighting Ebola: a window for vaccine re-evaluation? PLoS Pathog 13:e1006037. doi: 10.1371/journal.ppat.1006037. [DOI] [PMC free article] [PubMed] [Google Scholar]
- 12.World Health Organization (WHO). 2019. Ebola virus disease: Democratic Republic of the Congo, p 6 External situation report 68 World Health Organization, Geneva, Switzerland. [Google Scholar]
- 13.Mire CE, Miller AD, Carville A, Westmoreland SV, Geisbert JB, Mansfield KG, Feldmann H, Hensley LE, Geisbert TW. 2012. Recombinant vesicular stomatitis virus vaccine vectors expressing filovirus glycoproteins lack neurovirulence in nonhuman primates. PLoS Negl Trop Dis 6:e1567. doi: 10.1371/journal.pntd.0001567. [DOI] [PMC free article] [PubMed] [Google Scholar]
- 14.Wong AC, Sandesara RG, Mulherkar N, Whelan SP, Chandran K. 2010. A forward genetic strategy reveals destabilizing mutations in the Ebolavirus glycoprotein that alter its protease dependence during cell entry. J Virol 84:163–175. doi: 10.1128/JVI.01832-09. [DOI] [PMC free article] [PubMed] [Google Scholar]
- 15.Wollmann G, Drokhlyansky E, Davis JN, Cepko C, van den Pol AN. 2015. Lassa-vesicular stomatitis chimeric virus safely destroys brain tumors. J Virol 89:6711–6724. doi: 10.1128/JVI.00709-15. [DOI] [PMC free article] [PubMed] [Google Scholar]
- 16.Jae LT, Raaben M, Riemersma M, van Beusekom E, Blomen VA, Velds A, Kerkhoven RM, Carette JE, Topaloglu H, Meinecke P, Wessels MW, Lefeber DJ, Whelan SP, van Bokhoven H, Brummelkamp TR. 2013. Deciphering the glycosome of dystroglycanopathies using haploid screens for Lassa virus entry. Science 340:479–483. doi: 10.1126/science.1233675. [DOI] [PMC free article] [PubMed] [Google Scholar]
- 17.Simon-Loriere E, Faye O, Faye O, Koivogui L, Magassouba N, Keita S, Thiberge JM, Diancourt L, Bouchier C, Vandenbogaert M, Caro V, Fall G, Buchmann JP, Matranga CB, Sabeti PC, Manuguerra JC, Holmes EC, Sall AA. 2015. Distinct lineages of Ebola virus in Guinea during the 2014 West African epidemic. Nature 524:102–104. doi: 10.1038/nature14612. [DOI] [PMC free article] [PubMed] [Google Scholar]
- 18.Ibeh N, Nshogozabahizi JC, Aris-Brosou S. 2016. Both epistasis and diversifying selection drive the structural evolution of the Ebola virus glycoprotein mucin-like domain. J Virol 90:5475–5484. doi: 10.1128/JVI.00322-16. [DOI] [PMC free article] [PubMed] [Google Scholar]
- 19.Brown CJ, Quates CJ, Mirabzadeh CA, Miller CR, Wichman HA, Miura TA, Ytreberg FM. 2016. New perspectives on Ebola virus evolution. PLoS One 11:e160410. doi: 10.1371/journal.pone.0160410. [DOI] [PMC free article] [PubMed] [Google Scholar]
- 20.Lawson ND, Stillman EA, Whitt MA, Rose JK. 1995. Recombinant vesicular stomatitis viruses from DNA. Proc Natl Acad Sci U S A 92:4477–4481. doi: 10.1073/pnas.92.10.4477. [DOI] [PMC free article] [PubMed] [Google Scholar]
- 21.Whelan SPJ, Ball LA, Barr JN, Wertz G. 1995. Efficient recovery of infectious vesicular stomatitis virus from cDNA clones. Proc Natl Acad Sci U S A 92:8388–8392. doi: 10.1073/pnas.92.18.8388. [DOI] [PMC free article] [PubMed] [Google Scholar]
- 22.Pham PV, Le HT, Vu BT, Pham VQ, Le PM, Phan NL, Trinh NV, Nguyen HT, Nguyen ST, Nguyen TL, Phan NK. 2016. Targeting breast cancer stem cells by dendritic cell vaccination in humanized mice with breast tumor: preliminary results. Onco Targets Ther 9:4441–4451. doi: 10.2147/OTT.S105239. [DOI] [PMC free article] [PubMed] [Google Scholar]
- 23.Ramsburg E, Publicover J, Buonocore L, Poholek A, Robek M, Palin A, Rose JK. 2005. A vesicular stomatitis virus recombinant expressing granulocyte-macrophage colony-stimulating factor induces enhanced T-cell responses and is highly attenuated for replication in animals. J Virol 79:15043–15053. doi: 10.1128/JVI.79.24.15043-15053.2005. [DOI] [PMC free article] [PubMed] [Google Scholar]
- 24.van den Pol AN, Davis JN. 2013. Highly-attenuated recombinant vesicular stomatitis virus VSV-12′GFP displays immunogenic and oncolytic activity. J Virol 87:1019–1034. doi: 10.1128/JVI.01106-12. [DOI] [PMC free article] [PubMed] [Google Scholar]
- 25.Simmons G, Wool-Lewis RJ, Baribaud F, Netter RC, Bates P. 2002. Ebola virus glycoproteins induce global surface protein down-modulation and loss of cell adherence. J Virol 76:2518–2528. doi: 10.1128/jvi.76.5.2518-2528.2002. [DOI] [PMC free article] [PubMed] [Google Scholar]
- 26.Medina MF, Kobinger GP, Rux J, Gasmi M, Looney DJ, Bates P, Wilson JM. 2003. Lentiviral vectors pseudotyped with minimal filovirus envelopes increased gene transfer in murine lung. Mol Ther 8:777–789. doi: 10.1016/j.ymthe.2003.07.003. [DOI] [PubMed] [Google Scholar]
- 27.Takada A, Fujioka K, Tsuiji M, Morikawa A, Higashi N, Ebihara H, Kobasa D, Feldmann H, Irimura T, Kawaoka Y. 2004. Human macrophage C-type lectin specific for galactose and N-acetylgalactosamine promotes filovirus entry. J Virol 78:2943–2947. doi: 10.1128/jvi.78.6.2943-2947.2004. [DOI] [PMC free article] [PubMed] [Google Scholar]
- 28.Hoffmann M, González Hernández M, Berger E, Marzi A, Pöhlmann S. 2016. The glycoproteins of all filovirus species use the same host factors for entry into bat and human cells but entry efficiency is species dependent. PLoS One 11:e0149651. doi: 10.1371/journal.pone.0149651. [DOI] [PMC free article] [PubMed] [Google Scholar]
- 29.Osada N, Kohara A, Yamaji T, Hirayama N, Kasai F, Sekizuka T, Kuroda M, Hanada K. 2014. The genome landscape of the African green monkey kidney-derived Vero cell line. DNA Res 21:673–683. doi: 10.1093/dnares/dsu029. [DOI] [PMC free article] [PubMed] [Google Scholar]
- 30.Martikainen M, Essand M. 2019. Virus based immunotherapy of glioblastoma. Cancers (Basel) 11:E186. doi: 10.3390/cancers11020186. [DOI] [PMC free article] [PubMed] [Google Scholar]
- 31.Wollmann G, Davis JN, Bosenberg MW, van den Pol AN. 2013. Vesicular stomatitis virus variants selectively infect and kill human melanomas but not normal melanocytes. J Virol 87:6644–6659. doi: 10.1128/JVI.03311-12. [DOI] [PMC free article] [PubMed] [Google Scholar]
- 32.Allen M, Bjerke M, Edlund H, Nelander S, Westermark B. 2016. Origin of the U87MG glioma cell line: good news and bad news. Sci Transl Med 8:354re3. doi: 10.1126/scitranslmed.aaf6853. [DOI] [PubMed] [Google Scholar]
- 33.Ponten J, Macintyre EH. 1968. Long term culture of normal and neoplastic human glia. Acta Pathol Microbiol Scand 74:465–486. [DOI] [PubMed] [Google Scholar]
- 34.Torsvik A, Stieber D, Enger PO, Golebiewska A, Molven A, Svendsen A, Westermark B, Niclou SP, Olsen TK, Chekenya Enger M, Bjerkvig R. 2014. U-251 revisited: genetic drift and phenotypic consequences of tong-term cultures of glioblastoma cells. Cancer Med 3:812–824. doi: 10.1002/cam4.219. [DOI] [PMC free article] [PubMed] [Google Scholar]
- 35.Ozduman K, Wollmann G, Piepmeier J, van den Pol AN. 2008. Systemic vesicular stomatitis virus selectively destroys multifocal glioma and metastatic carcinoma in brain. J Neurosci 28:1882–1893. doi: 10.1523/JNEUROSCI.4905-07.2008. [DOI] [PMC free article] [PubMed] [Google Scholar]
- 36.Ozduman K, Wollmann G, Ahmadi SA, van den Pol AN. 2009. Peripheral immunization blocks lethal actions of vesicular stomatitis virus within the brain. J Virol 83:11540–11549. doi: 10.1128/JVI.02558-08. [DOI] [PMC free article] [PubMed] [Google Scholar]
- 37.Wollmann G, Rogulin V, Simon I, Rose JK, van den Pol AN. 2010. Some attenuated variants of vesicular stomatitis virus show enhanced oncolytic activity against human glioblastoma cells relative to normal brain cells. J Virol 84:1563–1573. doi: 10.1128/JVI.02040-09. [DOI] [PMC free article] [PubMed] [Google Scholar]
- 38.Vaheri A, Sedwick WD, Plotkin SA, Maes R. 1965. Cytopathic effect of rubella virus in BHK21 cells and growth to high titers in suspension culture. Virology 27:239–241. doi: 10.1016/0042-6822(65)90170-4. [DOI] [PubMed] [Google Scholar]
- 39.Whitt MA. 2010. Generation of VSV pseudotypes using recombinant ΔG-VSV for studies on virus entry, identification of entry inhibitors, and immune responses to vaccines. J Virol Methods 169:365–374. doi: 10.1016/j.jviromet.2010.08.006. [DOI] [PMC free article] [PubMed] [Google Scholar]
- 40.Garbutt M, Liebscher R, Wahl-Jensen V, Jones S, Möller P, Wagner R, Volchkov V, Klenk H-D, Feldmann H, Ströher U. 2004. Properties of replication-competent vesicular stomatitis virus vectors expressing glycoproteins of filoviruses and arenaviruses. J Virol 78:5458–5465. doi: 10.1128/jvi.78.10.5458-5465.2004. [DOI] [PMC free article] [PubMed] [Google Scholar]
- 41.Marzi A, Kercher L, Marceau J, York A, Callsion J, Gardner DJ, Geisbert TW, Feldmann H. 2015. Stat1-deficient mice are not an appropriate model for efficacy testing of recombinant vesicular stomatitis virus-based filovirus vaccines. J Infect Dis 212:S404–S409. doi: 10.1093/infdis/jiv188. [DOI] [PMC free article] [PubMed] [Google Scholar]
- 42.Johnson JE, Schnell MJ, Buonocore L, Rose JK. 1997. Specific targeting to CD4+ cells of recombinant vesicular stomatitis viruses encoding human immunodeficiency virus envelope proteins. J Virol 71:5060–5068. doi: 10.1128/JVI.71.7.5060-5068.1997. [DOI] [PMC free article] [PubMed] [Google Scholar]
- 43.van den Pol AN, Mao G, Chattopadhyay A, Rose JK, Davis JN. 2017. Chikungunya, influenza, Nipah, and Semliki Forest chimeric viruses with vesicular stomatitis virus: actions in the brain. J Virol 91:e02154-16. doi: 10.1128/JVI.02154-16. [DOI] [PMC free article] [PubMed] [Google Scholar]
- 44.Dulbecco R, Vogt M. 1953. Some problems of animal virology as studied by the plaque technique. Cold Spring Harbor Symp Quant Biol 18:273–279. doi: 10.1101/sqb.1953.018.01.039. [DOI] [PubMed] [Google Scholar]
- 45.Dulbecco R, Vogt M. 1954. One-step growth curve of Western equine encephalomyelitis virus on chicken embryo cells grown in vitro and analysis of virus yields from single cells. J Exp Med 99:183–199. doi: 10.1084/jem.99.2.183. [DOI] [PMC free article] [PubMed] [Google Scholar]
- 46.Kretzschmar E, Peluso R, Schnell MJ, Whitt MA, Rose JK. 1996. Normal replication of vesicular stomatitis virus without C proteins. Virology 216:309–316. doi: 10.1006/viro.1996.0066. [DOI] [PubMed] [Google Scholar]
- 47.Tran EE, Simmons JA, Bartesaghi A, Shoemaker CJ, Nelson E, White JM, Subramaniam S. 2014. Spatial localization of the Ebola virus glycoprotein mucin-like domain determined by cryo-electron tomography. J Virol 88:10958–10962. doi: 10.1128/JVI.00870-14. [DOI] [PMC free article] [PubMed] [Google Scholar]