Abstract
Classically, G protein-coupled receptors (GPCRs) are thought to activate G protein from the plasma membrane and are subsequently desensitized by β-arrestin (βarr). However, some GPCRs continue to signal through G protein from internalized compartments, mediated by a GPCR–G protein–βarr ’megaplex’. Nevertheless, the megaplex’s molecular architecture remains unknown. Here, we present its cryo-electron microscopy structure, which shows simultaneous engagement of human G protein and bovine βarr to the core and phosphorylated tail, respectively, of a single active human chimeric β2-adrenergic receptor with the C-terminal tail of the arginine vasopressin type 2 receptor (β2V2R). All three components adopt their canonical active conformations, suggesting that a single megaplex GPCR is capable of simultaneously activating G protein and βarr. Our findings provide a structural basis for GPCR-mediated sustained, internalized G protein signaling.
G protein coupled receptors (GPCRs) are a class of ubiquitous cell-surface receptors involved in the regulation of many physiological processes1,2. An agonist stabilizes a GPCR in an active conformation, which facilitates binding and activation of G proteins. This leads to generation of second messenger molecules like cyclic AMP (cAMP) and subsequent signal propagation. In order to terminate G protein signaling, GPCR kinases (GRKs) phosphorylate the receptor, often on its C-terminal tail, which enables binding of β-arrestin (βarr) to the receptor1,3. βarr interacts with both the phosphorylated GPCR tail and intracellular core, with the latter interaction sterically blocking G protein binding and desensitizing further G protein signaling. βarr promotes internalization of the receptor by recruiting endocytic proteins (Fig. 1)3,4. Subsequently, the receptor is either: 1) rapidly recycled to the plasma membrane for receptors that transiently interact with βarr (class A GPCRs) or 2) internalized into endosomes followed by degradation for receptors that strongly interact with βarr (class B GPCRs)4,5. βarr is also capable of mediating G protein-independent signaling pathways by scaffolding other signaling proteins3.
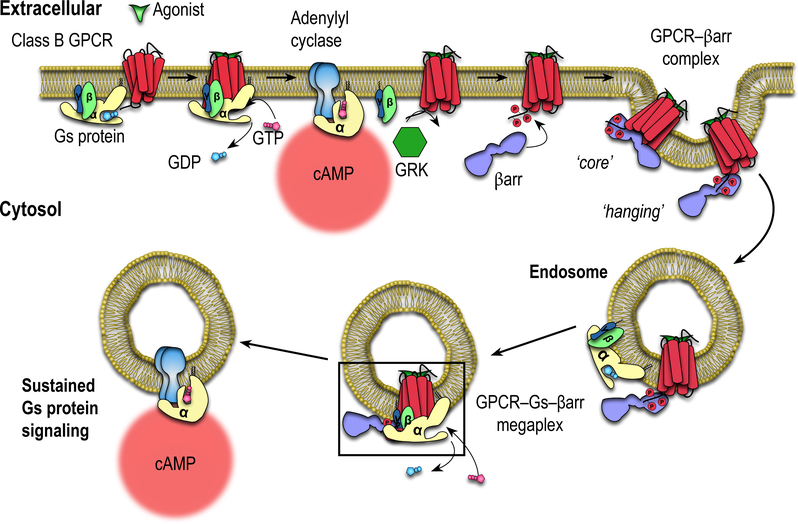
Fig. 1. Schematic illustration of the mechanism of sustained signaling through the formation of endosomal class B GPCR–G protein–βarr megacomplexes.
Binding of β-arrestin (βarr) to a GRK-phosphorylated GPCR tail (leaving the receptor intracellular core open) and subsequent receptor internalization allows for further G protein binding, forming a megaplex (black box). The megaplex continues to activate G protein, leading to sustained endosomal cAMP generation.
Recently, class B GPCRs such as the thyroid-stimulating hormone receptor, parathyroid hormone receptor and the vasopressin type 2 receptor (V2R) have been reported to engage in sustained G protein signaling after receptor internalization into endosomes rather than being desensitized6–9. Internalized G protein signaling has been difficult to incorporate within the ‘classical understanding’ of GPCR biology, since the GPCR–βarr interaction which drives internalization was thought to sterically block G protein binding and desensitize further signaling. However, we demonstrated that GPCR–βarr complexes can assume two distinct conformations with βarr either: (1) only bound to the phosphorylated receptor C-terminal tail and appears to hang from the receptor (‘tail conformation’); or (2) also bound concurrently to the receptor intracellular core via its finger loop region (‘core conformation’)9–11. In the tail conformation, the receptor intracellular core is presumably exposed, potentially allowing for interaction with G protein to form a GPCR–G protein–βarr ‘megaplex’ capable of stimulating G protein signaling while being internalized by βarr (Fig. 1, black box)9.
The megaplex hypothesis is supported by the observation that megaplex components come into close proximity with each other at endosomes for many class B GPCRs using cellular bioluminescence resonance energy transfer (BRET) assays6,8,9,12–14. Additionally, we previously demonstrated that functional megaplexes can be formed in vitro in an agonist-dependent manner, and the GPCRs within these megaplexes activate G proteins by promoting GTPase activity, GTP/GDP exchange and dissociation of the Gα subunit from Gβγ subunits9.
That a GPCR within a megaplex can elicit both G protein and βarr functions (i.e. internalization) raises a number of questions: what is the conformation of a GPCR when simultaneously bound to both G protein and βarr? What are the conformations of the megaplex βarr and G protein, and how do these conformations compare to the canonical active conformations they each separately adopt? To answer these questions and understand the structural basis for megaplex-mediated signaling by internalized GPCRs, we here report a cryo-electron microscopy (cryo-EM) structure of the megaplex.
Results
Complex Formation and Structure Solution
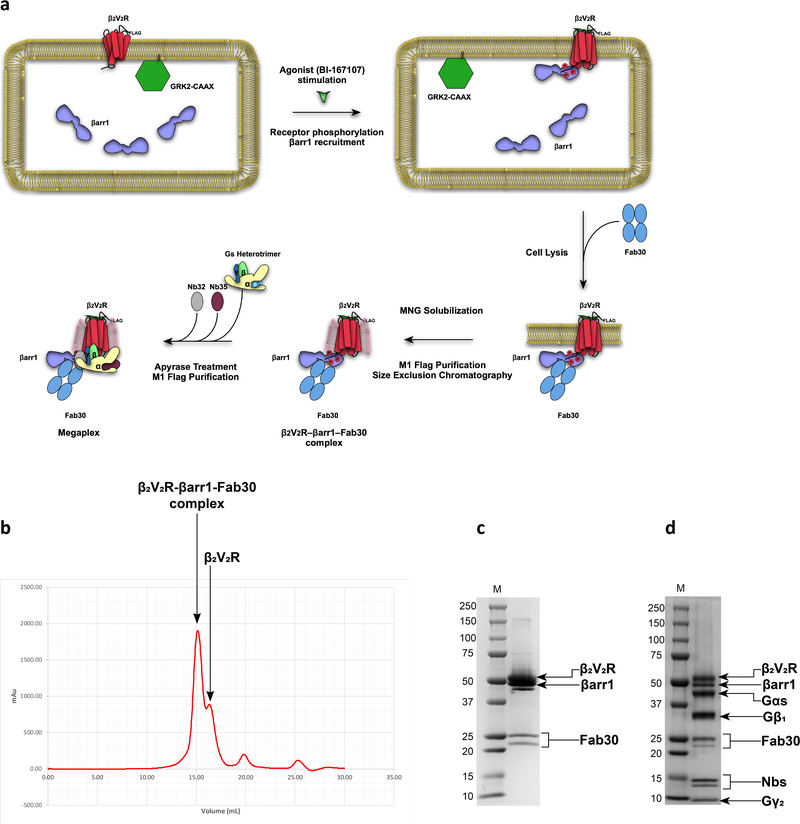
To form megaplexes, we first purified the β2V2R–βarr complex co-expressed with a prenylated GRK2 (GRK2-CAAX) bound to the high-affinity β2-adrenergic receptor (β2AR) agonist BI-167107 (BI) and stabilized by the conformationally sensitive antibody fragment Fab3010. Gs protein was added to the β2V2R–βarr1–Fab30 complex to form the megaplex along with nanobody 35 (Nb35) to stabilize the β2V2R–Gs interaction (Extended Data Fig. 1)9,15. The β2V2R is an N-terminal T4 lysozyme (T4L)-fused, modified β2AR with the first 341 residues of the β2AR combined with the last 29 amino acids V2R C-terminal tail (V2T)10. While maintaining the pharmacological properties of the β2AR, the β2V2R interacts strongly with βarrs, forming megaplexes and promotes endosomal G protein signaling comparable to the class B V2R4,5,9–11.
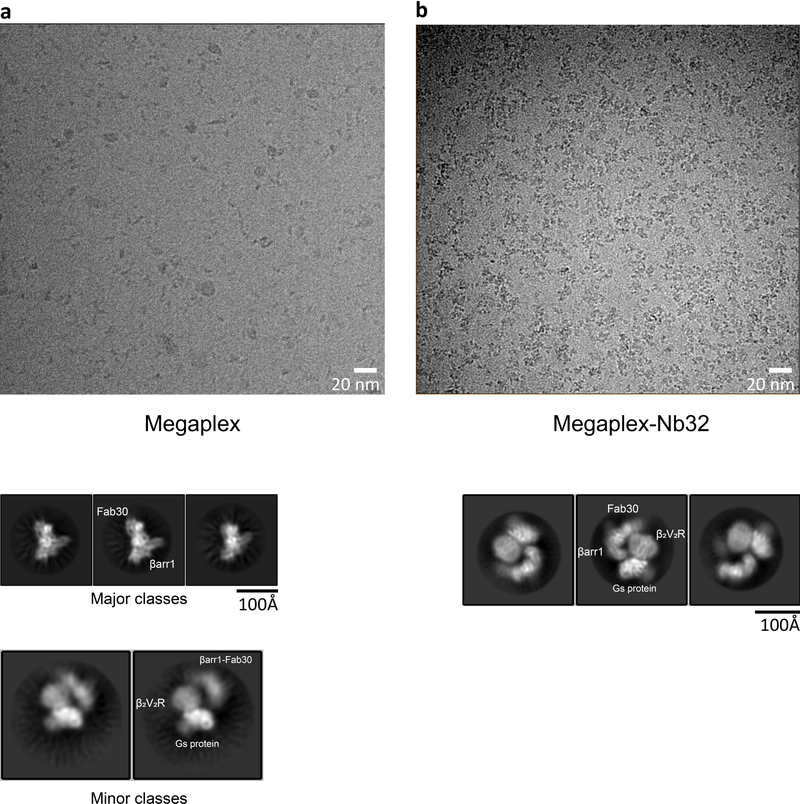
Initial cryo-EM imaging revealed significant dissociation of the megaplex, with class averages from the few intact megaplex particles displaying preferential orientation and blurred density for the βarr1–Fab30 portion, presumably due to its flexibility (Extended Data Fig. 2). To improve complex stability, we formed the megaplex with Nanobody 32 (Nb32), which further stabilizes active βarr1 bound to the phosphorylated V2T11. Nb32 substantially enhanced the number of intact megaplex particles and led to better-defined density for βarr1–Fab30 in class averages, potentially by sterically limiting βarr1–Fab30 flexibility (Extended Data Fig. 2). To overcome preferential orientation, all data were subsequently collected with the specimen stage tilted from 30° to 50° (Extended Data Figs. 3,4).
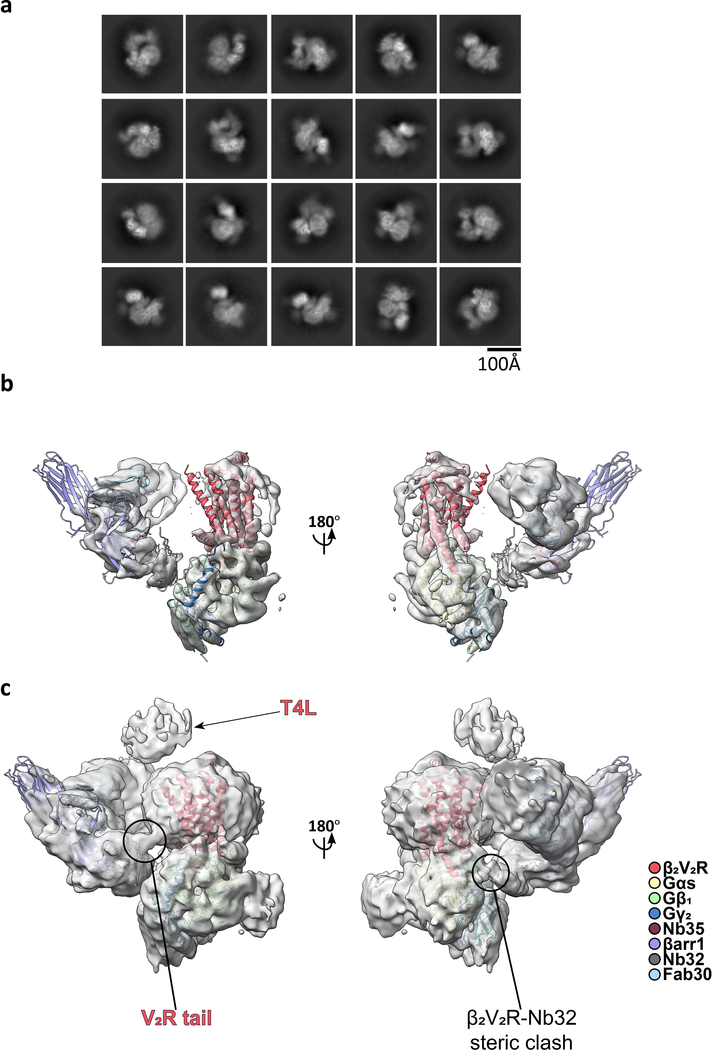
Our initial reconstruction of the megaplex shows Gs binding to the β2V2R intracellular core, while βarr1 binds to the phosphorylated V2T in a tail conformation (Extended Data Fig. 5). We do not observe additional contact between βarr1 and the receptor, nor any direct contact between Gs and βarr1 (Extended Data Fig. 5). We observe Nb32 binding to the N-terminal lobe of βarr1, and that it sterically makes contact with the β2V2R and Nb35 at low map thresholds (Extended Data Fig. 5).
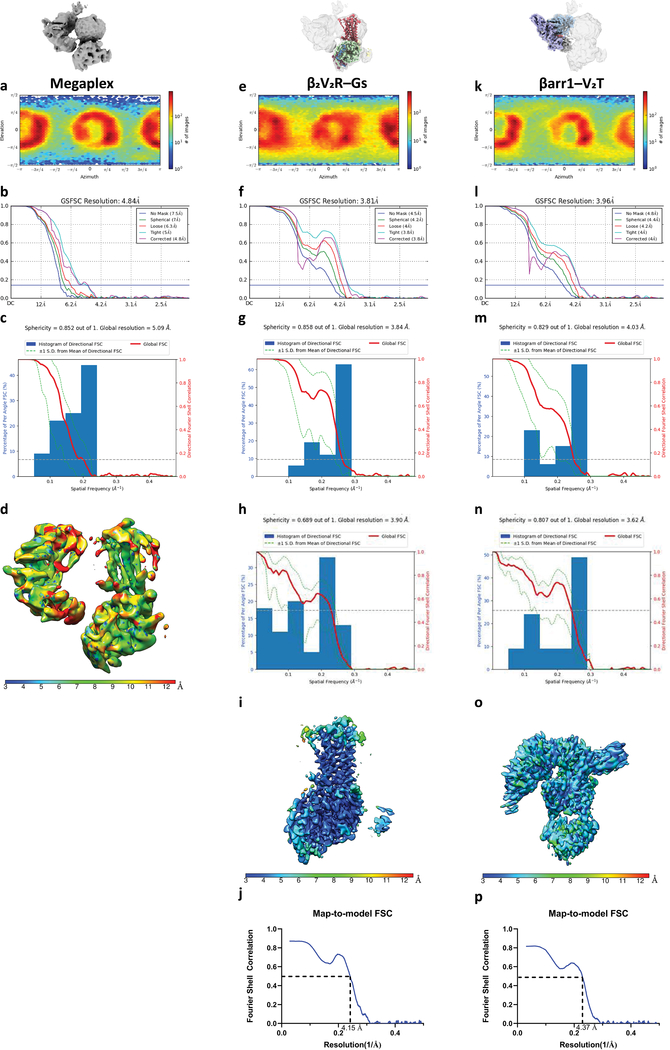
The phosphorylated receptor C-terminal tail serves as the only connection between the receptor and βarr1. Because this connection is inherently flexible, our structure’s local resolution is limited to ~7 Å (Extended Data Figs. 5,6). Subsequent attempts to reconstruct the megaplex after computationally subtracting Fab30 and Nb32 densities led to a map with well-defined features for the β2V2R–Gs–Nb35 portion, but not for the smaller βarr1 bound to the phosphorylated tail, indicating that βarr1 is truly flexible relative to the β2V2R–Gs–Nb35 component (Extended Data Fig. 4).
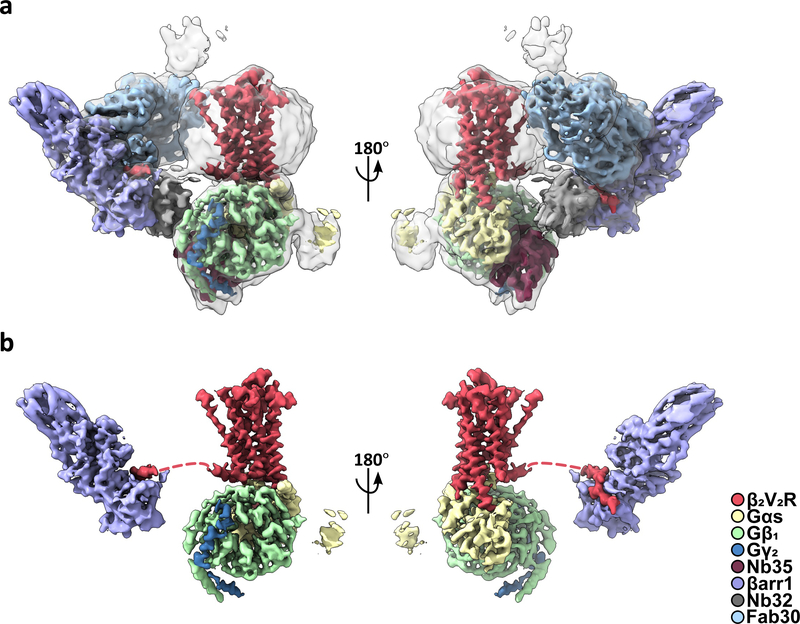
To overcome this inherent flexibility, we analyzed the megaplex as two separate subcomplexes: the BI–β2V2R–Gs–Nb35 (with T4L removed) and the Nb32–V2T–βarr1–Fab30 subcomplexes, from this point on referred to as the β2V2R–Gs and βarr1–V2T subcomplexes, respectively. By realigning each subcomplexes separately, we obtained reconstructions for the β2V2R–Gs and βarr1–V2T subcomplexes at 3.8 Å and 4.0 Å, respectively (Table 1, and Extended Data Figs. 4, 6, 7). While the subcomplexes’ resolution vary directionally, the higher resolution allows for analysis of all relevant megaplex interactions. These subcomplex reconstructions are aligned to the overall reconstruction and displayed together as a composite cryo-EM map (Fig. 2a,b).
Table 1.
Cryo-EM data collection, refinement and validation statistics
| Megaplex Consensus Reconstruction (EMD-9377) | β2V2R–Gs (EMD-9376, PDB 6NI3) | βarr1–V2T (EMD-9375, PDB 6NI2) | |
|---|---|---|---|
| Data collection and processing | |||
| Magnification | 105,000 | 105,000 | 105,000 |
| Voltage (kV) | 300 | 300 | 300 |
| Electron exposure (e−/Å2) | 104.3 | 104.3 | 104.3 |
| Defocus range (μm) | 1.0–3.5 | 1.0–3.5 | 1.0–3.5 |
| Pixel size (Å) | 1.04 | 1.04 | 1.04 |
| Symmetry imposed | C1 | C1 | C1 |
| Initial particle images (no.) | 8.15 million | 8.15 million | 8.15 million |
| Final particle images (no.) | 317,529 | 299,893 | 230,021 |
| Map resolution (Å) | 4.8 | 3.8 | 4.0 |
| FSC threshold | 0.143 | 0.143 | 0.143 |
| Map resolution range (Å) | 7–12 | 3.5–7 | 3.5–7 |
| Refinement | |||
| Initial model used (PDB code) | 3SN6 | 4JQI | |
| Model resolution (Å) | 4.15 | 4.37 | |
| FSC threshold | 0.5 | 0.5 | |
| Model resolution range (Å) | |||
| Map sharpening B factor (Å2) | −202.3 | −133.6 | −139.0 |
| Model composition | |||
| Nonhydrogen atoms | 8136 | 5381 | |
| Protein residues | 1043 | 704 | |
| Ligands | 1 | 0 | |
| B factors (Å2) | |||
| Protein | 83.75 | 131.66 | |
| Ligand | 74.16 | ||
| R.m.s. deviations | |||
| Bond lengths (Å) | 0.01 | 0.009 | |
| Bond angles (°) | 1.197 | 1.297 | |
| Validation | |||
| MolProbity score | 1.6 | 1.81 | |
| Clashscore | 4.67 | 6.6 | |
| Poor rotamers (%) | 0.23 | 0 | |
| Ramachandran plot | |||
| Favored (%) | 94.83 | 93.11 | |
| Allowed (%) | 5.17 | 6.74 | |
| Disallowed (%) | 0 | 0.15 |
Fig. 2. Cryo-EM structure of a β2V2R–Gs–βarr1 megaplex.
a, Composite cryo-EM density map of the megaplex reconstruction fitted into a transparent envelope of the megaplex consensus structure. b, Same as in a, but with protein stabilizers (Nb35, Nb32, and Fab30) and consensus reconstruction removed. Red dashed lines indicate the flexible C-terminal tail connecting βarr1 to the receptor.
The β2V2R–Gs portion of the megaplex
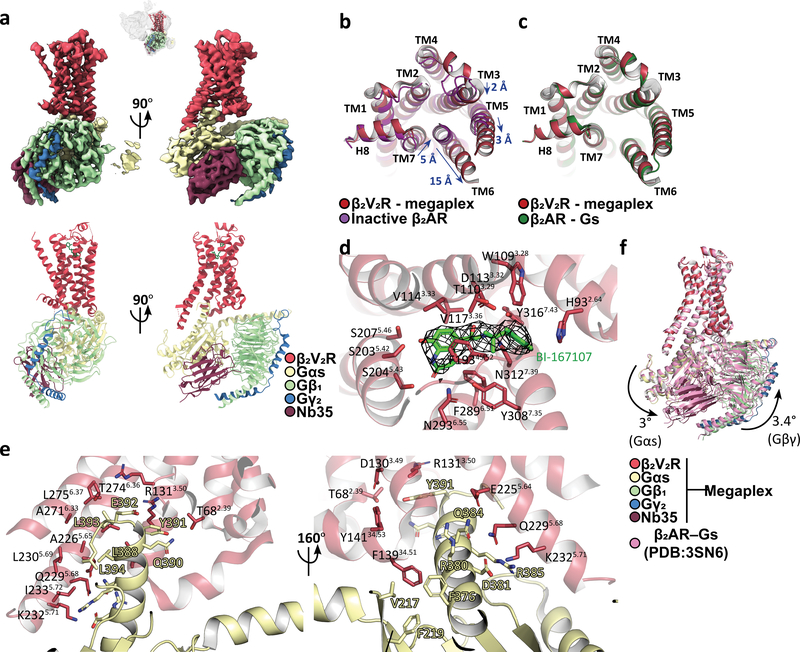
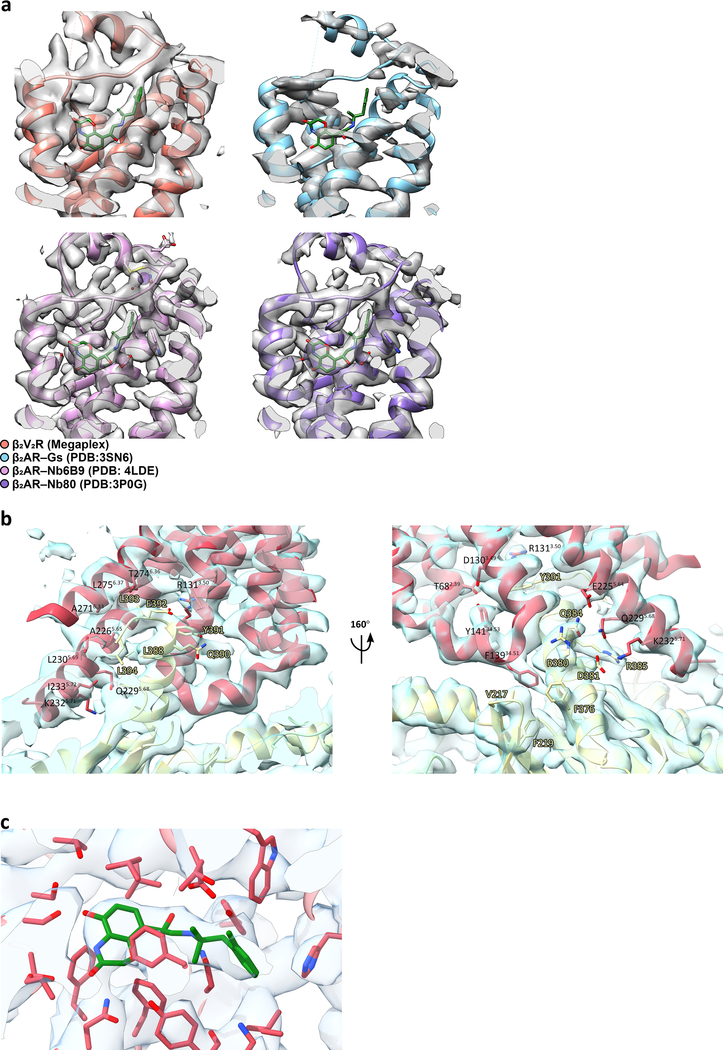
The Gs protein engages the β2V2R at its intracellular core (Fig. 3a). To assess the megaplex β2V2R conformation, we compared it to the structures of inactive, carazolol-bound β2AR (PDB: 2RH1) and the active, Gs protein-bound β2AR (PDB: 3SN6)15,16. In comparison to the inactive β2AR structure, the megaplex β2V2R shows a 15Å outward shift away from the receptor intracellular core in its transmembrane (TM) helix 6, as measured from the Cα of residue E2686.30 (superscript denotes Ballesteros-Weinstein numbering)17. TM5 displays an outward movement of 3 Å, as measured from the Cα of L2305.69. TM3 and TM7 move inward towards the intracellular core by 2 Å (as measured from T1363.55) and 5 Å (as measured from C3277.54), respectively (Fig. 3b). These changes are consistent with those observed in the active, Gs-bound β2AR15. The Gs-bound β2AR and our β2V2R are nearly superimposable, with a Cα RMSD of 0.63 Å (Fig. 3c). Examination of the ligand binding pocket reveals density that can be attributed to BI, which adopts a similar binding pose to those in previous crystal structures of BI-occupied β2AR bound to G protein-mimicking nanobodies (Fig. 3d, and Extended Data Fig. 8a)18,19.
Fig. 3. Structure and interactions of the β2V2R–Gs portion of the megaplex.
a, Orthogonal views of the density map and model for the β2V2R–Gs portion of the megaplex. Small top image orients the β2V2R–Gs subcomplex in relation to the megaplex consensus structure. b, Intracellular view of the superimposition between the megaplex β2V2R and the inactive, carazolol-bound β2AR (PDB: 2RH1). Blue arrows indicate movements in transmembrane helices (TMs) 3,5,6 and 7 and their magnitudes. c, Intracellular view of the superimposition between the megaplex β2V2R and the Gs-bound β2AR (PDB: 3SN6). d, Ligand-binding pocket of the β2V2R, with density for the agonist BI-167107 (BI-167107, green) in mesh. e, Interaction of the α5-helix of Gαs with hydrophobic residues on TM5 and TM6, and with polar residues between TM3 and TM5 of the β2V2R. β2V2R residues are labeled in black for d and e. f, Structural comparison of the β2AR–Gs complex (pink, PDB: 3SN6) against the β2V2R–Gs portion of the megaplex, both aligned by their receptors. Curved arrows indicate 3° rotation of Gαs around an axis parallel to the β2V2R-α5 helix contact and 3.4° rotation of Gβγ around an axis parallel to the plasma membrane seen in the megaplex.
Analysis of the β2V2R–Gs interaction surface revealed contacts mostly between the α5 helix on Gαs and TM3, TM5, TM6, and intracellular loop 2 (ICL2), consistent with those observed in the β2AR–Gs crystal structure (Fig. 3e). The Gαs α5 helix forms primarily nonpolar interactions with various residues located in TM5 and TM6 (Fig. 3e, and Extended Data Fig. 8b). Polar residues on TM5 of the receptor, namely E2255.64, Q2295.68, and K2325.71, are within distance to form a hydrogen bonding network with Gαs residues D381 and Q384. Also notable is the nonpolar interaction formed between F13934.51 in ICL2 with the hydrophobic pocket formed by V217, F219, and F376 of Gαs (Fig. 3e, and Extended Data Fig. 8b). Significant interactions involving the DRY motif, namely packing of Y391 of the Gαs α5 helix against R1313.50 as well as the hydrogen bonding network between Y14134.53, T682.39, and D1303.49 is also observed (Fig. 3e, and Extended Data Fig. 8b).
In the presence of the tail-bound βarr1, when our β2V2R–Gs and the β2AR–Gs complex were aligned by their receptors, a 3.4° rotation in Gβγ around an axis parallel to the membrane was observed, and a 3° rotation in Gαs was observed around an axis parallel to the β2V2R–Gαs contact compared to the β2AR–Gs crystal structure (Fig. 3f). Taken together, while G protein adopts a distinct rotational pose, the overall receptor conformation and key receptor–Gs interactions appear to be unchanged, suggesting canonical G protein activation by a megaplex GPCR.
The βarr1–V2T portion of the megaplex
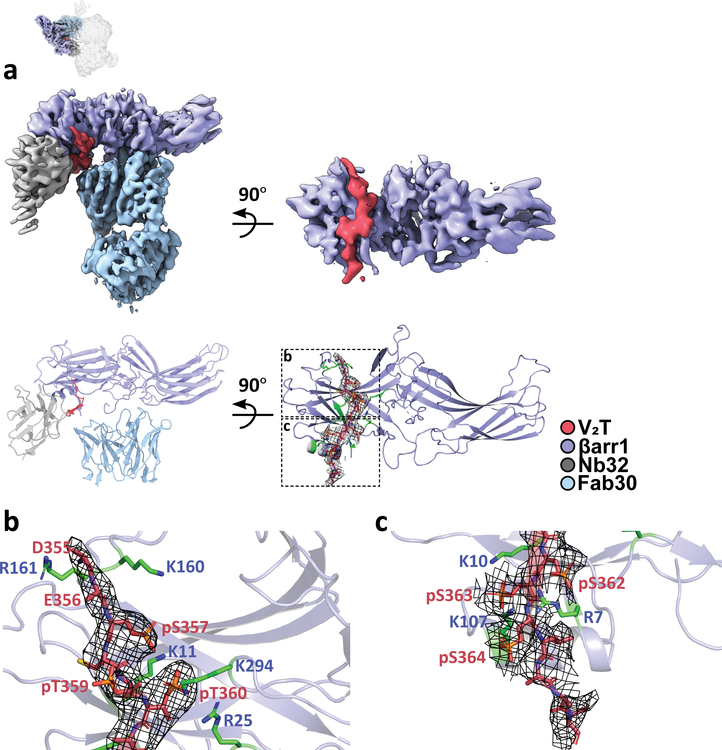
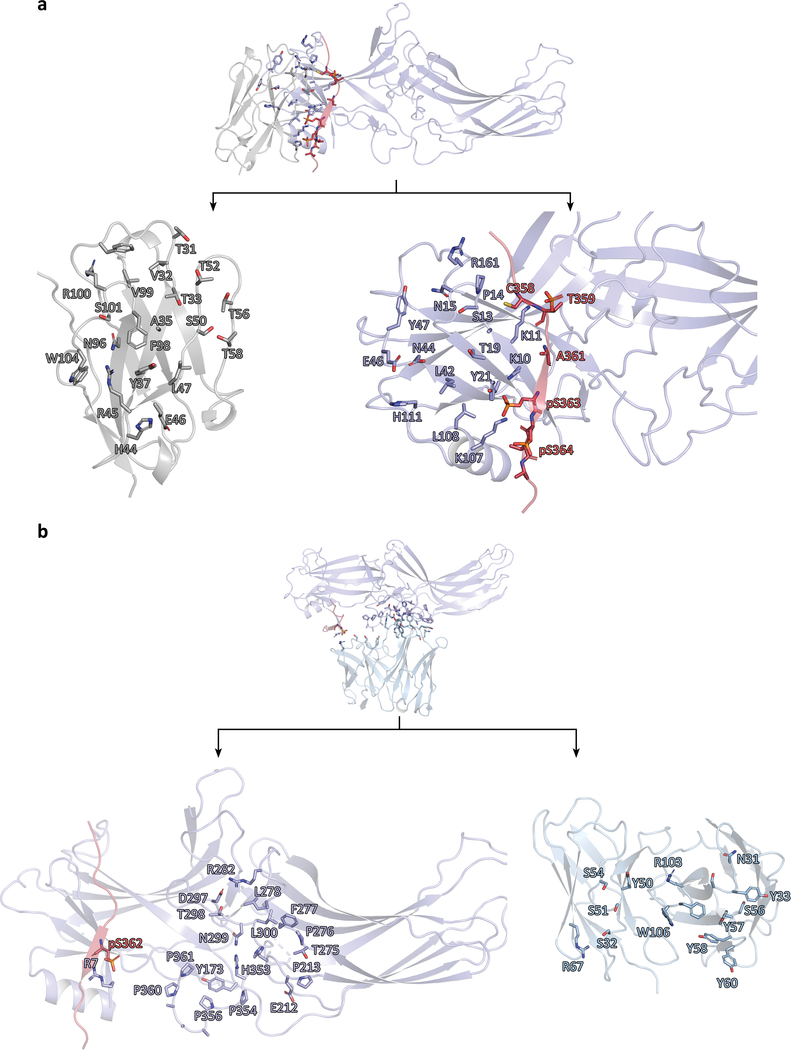
The βarr1–V2T subcomplex shows V2T binding to the N-terminal lobe of an active βarr1, indicated by a ~20° twist between its N and C-terminal lobes (Fig. 4a). Fab30 and Nb32 concurrently interact with various regions of βarr1 as well as the V2T; Fab30 forms hydrogen bonds with phosphorylated residues S362 (pS362) while Nb32 forms electrostatic interactions with pS363 and pS364 on the V2T (Extended Data Fig. 9a,b). The direct interactions of Fab30 and Nb32 with the V2T provide an explanation for the conformational selectivity of these stabilizers for active βarr.
Fig. 4. Structure and interactions of the βarr1–V2T portion of the megaplex.
a, Density map and model for the megaplex βarr1–V2T. Mesh delineates density for the V2T. Small top image orients the βarr1–V2T subcomplex in relation to the megaplex consensus structure. b,c, Regions of the V2T with phosphorylated residues pS357, pT359, pT360 (b) and pS362, pS363, and pS364 (c) interacting with positively charged residues on βarr1, which are colored in green and labeled in blue.
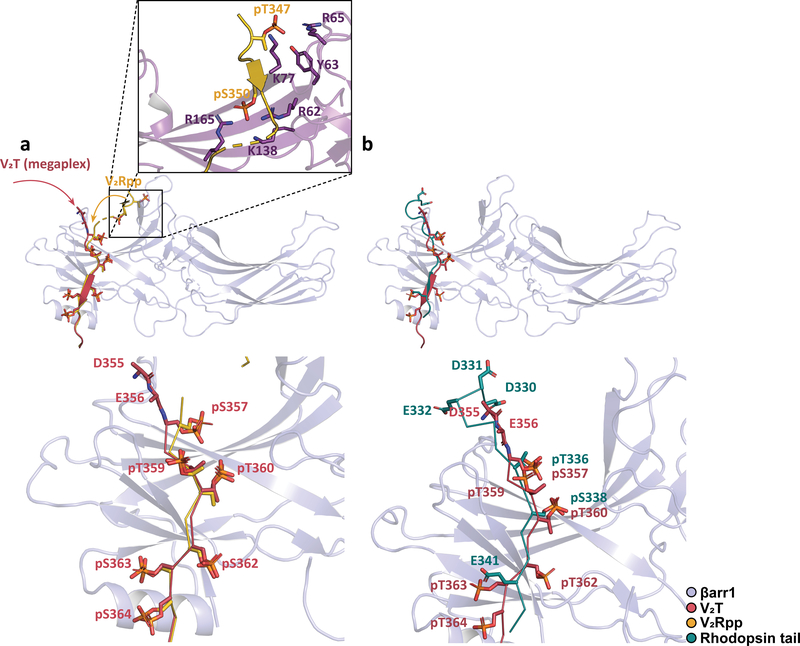
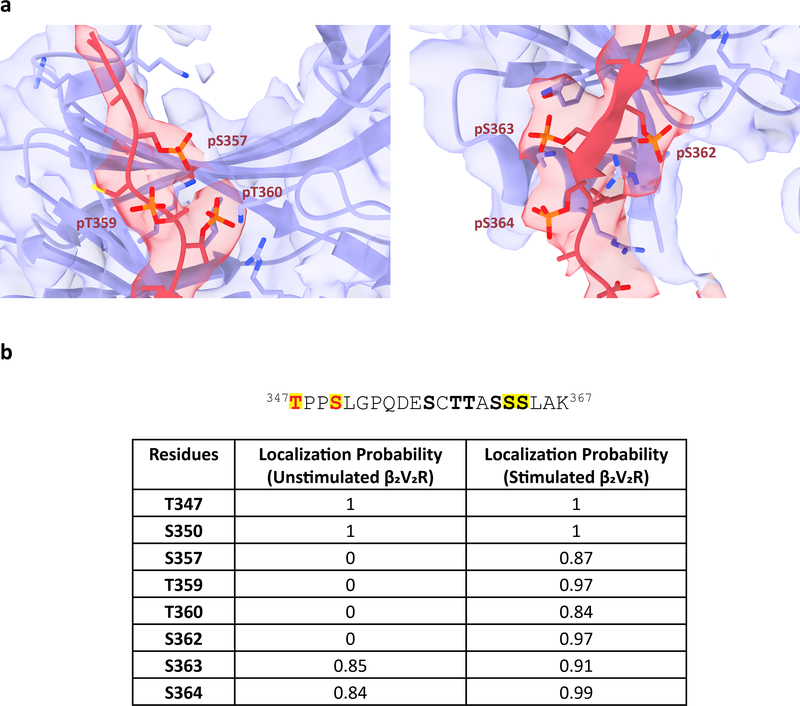
Previously, we reported a crystal structure of a Fab30-stabilized βarr1 bound to a synthetic V2R phosphopeptide (V2Rpp), which acts as a phosphorylated receptor C-terminal tail mimic20. The V2Rpp is derived from the last 29 amino acids of the V2R and contains eight chemically synthesized potential phosphorylated serines and threonines at positions pT347, pS350, pS357, pT359, pT360, pS362, pS363, and pS364. However, our structure shows only six GRK2-phosphorylated residues on the V2T that interact with βarr1: pS357, pT359, pT360, pS362, pS363, and pS364 (Fig. 4b,c and Extended Data Fig. 10a).
All of these phosphorylated residues with the exception of pT359 form electrostatic interactions with lysines and arginines lining the surface of the N-terminal lobe of βarr1. Residue pT359 points outward and does not appear to make any contact with βarr1 (Fig. 4b). More specifically, residues pS357 and pS363 make electrostatic interactions with the well-conserved βarr1 residues K11 and K10 within β-strand I of βarr1, respectively (Fig. 4b). In addition, both pS363 and pS364 appear to interact with K107 on α-helix I of βarr1, while pS362 is positioned to interact with R7 (Fig. 4c). Finally, pT360 is well-positioned to interact with R25 and K294. These interactions are comparable with interactions previously reported between the V2Rpp and βarr120.
A comparison between the βarr1–V2T subcomplex and the V2Rpp–βarr1–Fab30 crystal structure illustrates that while βarr1 in both structures adopts a similar active conformation (Cα RMSD of 0.76Å), the structure with V2Rpp contains interaction between pS347 and pT350 not observed in our structure (Fig. 5a). pS347 interacts extensively with residues on βarr1 near the finger loop’ region, forming ionic interactions with R65 and K77 and participates in hydrogen bonding with Y63. Similarly, pT350 forms electrostatic interactions with R62, K138, and R165 on βarr1 (Fig. 5a, inset).
Fig. 5. Comparison of the megaplex βarr1–V2T to the V2Rpp–βarr1–Fab30 and rhodopsin–visual arrestin crystal structures.
a, Superimposition between the βarr1–V2T (megaplex) and the V2Rpp–βarr1–Fab30 crystal structure. Inset shows interaction between pT347 and pS350 of the V2Rpp with residues near the finger loop region of βarr1. Red and yellow arrows delineate the differing path of the V2T and V2Rpp, respectively. b, Alignment between βarr1–V2T (megaplex) and the rhodopsin–visual arrestin crystal structure. For clarity, only βarr1 of the megaplex is shown in a and b.
To gain further insight into which serine and threonine residues on the V2T are phosphorylated upon receptor stimulation, we performed liquid chromatography-tandem mass spectrometry (LC-MS/MS) on unstimulated β2V2R expressed by itself and BI-stimulated β2V2R co-expressed with GRK2-CAAX (Extended Data Fig. 10b). Our analysis revealed that T347, S350, S363, and S364 are phosphorylated in both samples, whereas S357, T359, T360, and S362 are only phosphorylated after receptor stimulation. These data suggest that: (1) T347/S350 are phosphorylated independent of stimulation, potentially through a GRK-independent mechanism and are not critical for βarr1 binding, (2) phosphorylation at residues S357, T359, T360, and S362 are necessary to recruit and stabilize βarr1 interaction with the V2T.
Finally, from our EM map, we observe an additional interaction between two acidic V2T residues D355 and E356 with βarr1, not observed in the V2Rpp–βarr1–Fab30 crystal structure (Fig. 4c). While local resolution does not allow for placement of side chains for D355 and E356, cryo-EM density for this region suggests that they are in position to interact with K160 and R161 on βarr1. Interestingly, these two acidic residues are prevalent in the C-terminal tail of a number of GPCRs (e.g. β2AR, rhodopsin, and vasopressin receptors) and have been proposed to form a consensus motif for GRK1 and GRK2 phosphorylation, which when mutated in the closely-related vasopressin 1a receptor led to a loss in all tail phosphorylation21.
In order to further understand the structural implications of GPCR–arrestin interaction, we compared our βarr1–V2T portion of the megaplex, which binds to the β2V2R in a tail conformation, to the rhodopsin-visual arrestin crystal structure, in which visual arrestin binds the intracellular core of rhodopsin in addition to the phosphorylated tail (Fig. 5b). Alignment of βarr1 and visual arrestin in these two structures show that V2T residues pS357, pT360, pS363 align well with residues pT336, pS338, and E341 on the rhodopsin tail. In addition, our structure has three additional phosphorylation sites, at positions pT359, pS362, and pS364 (Fig. 5b). All of these additional sites, with the exception of pT359, interact with βarr1, most likely conferring higher receptor affinity to βarr1 even though a smaller number of phosphorylated residues on a GPCR tail may be sufficient to activate arrestin.
Architecture of the megaplex within a cell membrane
We noted that βarr1 in our megaplex structure is pointing upward towards an area where the membrane is located in a cellular context. This position of βarr1 is facilitated by a physical clash between the receptor, Nb35 and Nb32, both of which are needed to stabilize the complex, and the lack of a membranous barrier in our detergent-purified megaplex (Extended Data Fig. 5). Therefore, we employed coarse-grained molecular dynamics (MD) simulation to explore the movement of βarr1 when bound to the highly flexible receptor C-terminal tail within the megaplex in a cellular environment.
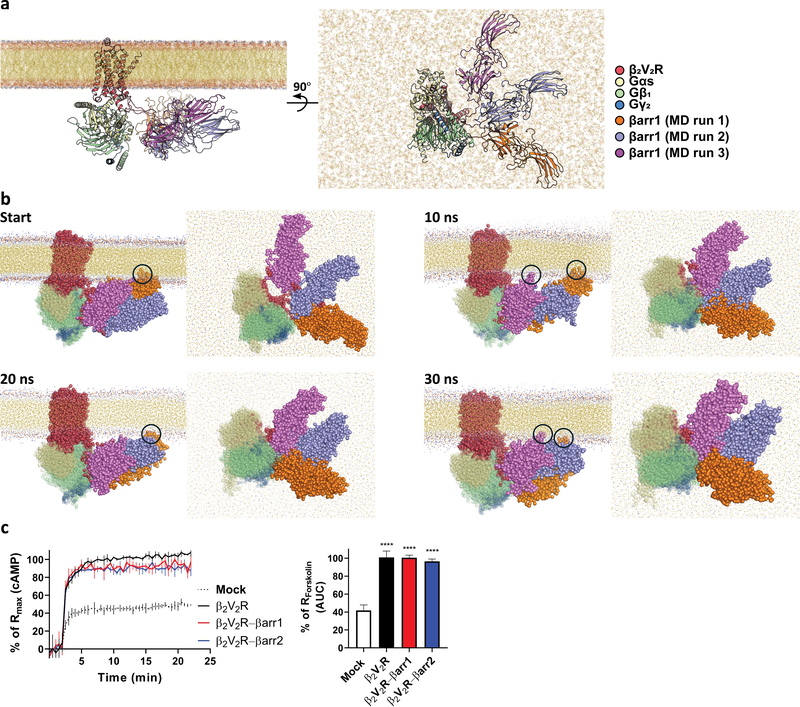
We modeled the entire megaplex embedded within a dipalmitolphosphatidylcholine (DPPC) bilayer in the absence of all protein stabilizers (Fig. 6a). As expected, βarr1 movement is much more constrained when a lipid bilayer is present. Moreover, the two proline residues 348 and 349 induces a kink in the V2T, thus serves to restrict βarr1 distance from the β2V2R–Gs portion. Even though these two factors limit the βarr1 range of motion, it can still adopt a wide range of possible conformations. To sample this conformational range, we modeled three possible megaplex structures, each of them different by the position of βarr1–V2T in relation to the β2V2R–Gs portion and the membrane (Fig. 6a, MD runs 1–3). A 30 ns coarse-grained MD simulation was run using each modeled structure as a starting point (Fig. 6b). In all three MD runs, βarr1 flexibly moves in relation to the β2V2R–Gs subcomplex. Interestingly, in runs 1 and 3, nonpolar βarr1 residues 332GGLLG336, part of a loop at the distal edge of the C-terminal lobe, make transient contacts with the lipid bilayer at various time points (Fig. 6b, black circles). Another βarr1 C-terminal loop, comprising residues 261TVAPS265, also makes contact with the membrane, albeit to a lesser extent. Previous MD experiments as well as the rhodopsin-visual arrestin crystal structure (in which visual arrestin binds both the phosphorylated C-terminal tail and core of rhodopsin) have both shown that various analogous loops in visual arrestin can interact with a lipid bilayer22,23. Our results indicate that a tail-bound βarr1 in a megaplex has the ability to maintain this interaction, and further highlight the diverse positions that βarr1 could adopt within the cell membrane as part of the megaplex.
Figure 6. The megaplex within a membrane environment.
a, Orthogonal views of three modeled megaplex structures for molecular dynamics (MD) simulations with differing βarr1–V2T positions, aligned by their β2V2R–Gs region. b, Coarse-grained MD models of the three structures, aligned by their β2V2R–Gs region at 10 ns increments. Black circles denote transient contact between βarr1 residues and the lipid bilayer. c, Real-time cAMP measurement of BI-stimulated β2V2R or β2V2R–βarr1/2 in β2AR/βarr1/βarr2 triple knock-out HEK293 cells, expressed as percentages of 10 μM Forskolin control. Data represents mean ± S.E.M. of four independent experiments for the β2V2R–βarr1 and β2V2R–βarr2 conditions and of three independent experiments for the β2V2R condition. Ordinary one-way ANOVA with Holm-Sidak’s multiple comparison post-hoc test was performed to determine statistical significance between mock control and the β2V2R or β2V2R–βarr1/2 conditions (****P < 0.0001).
The ability of β2V2R to interact with and activate Gs while being bound to βarr1 through the flexible C-terminal tail in a cellular context was further confirmed using βarr1/βarr2/β2AR triple knock-out HEK293 cells transiently expressing functionally verified β2V2R–βarr1 or β2V2R–βarr2 fusion proteins9,11. In these cells, BI-stimulation of β2V2R–βarr1/2 resulted in a fast and sustained increase in cAMP comparable to either β2V2R alone or forskolin-stimulated cAMP production (Fig. 6c). These results demonstrate that a single GPCR residing within a cell membrane and while being coupled functionally to βarr (in this case through a covalent attachment) can still physically interact with and activate G protein.
Discussion
The initial discovery of βarrs provided a mechanism for how GPCR-mediated G protein signaling is desensitized24,25. Overlapping binding sites of G proteins and βarrs at the receptor core have been confirmed in multiple structural studies, and therefore, it has traditionally been assumed that binding of G protein and βarr to a single receptor are mutually exclusive15,23–28.
However, the discovery that a class B GPCR–βarr complex in the tail conformation can continue to activate G protein through the formation of megaplexes provides a biophysical explanation for the ability of some GPCRs to signal within internalized cellular compartments. Now, we show in our megaplex structure that the BI-bound, active β2V2R binds to Gs protein at the receptor intracellular core while coupling to βarr1 via the phosphorylated V2T (Fig. 2). The β2V2R–Gs contacts in the megaplex are also comparable to those of the β2AR–Gs structure, indicating that Gs protein is being activated by the megaplex receptor in a canonical fashion (Fig. 3e). The V2T -bound βarr1 also adopts an active conformation, indicated by ~20° twisting of its N and C-terminal lobes (Fig. 4a). The structure demonstrates that the binding of G protein and βarr to the same GPCR are not mutually exclusive, with both transducers being canonically activated.
Verified by LC-MS/MS analyses, six phosphorylated residues were visualized on the GPCR tail, with five of them engaging the active megaplex βarr1 (Fig. 4, and Extended Data Fig. 10b). These observations further recapitulate cellular data that demonstrate decrease in phosphorylation and, by extension, arrestin recruitment to the GPCR after mutating one or a series of these phosphorylated residues4,23,29,30. A recent biochemical study showed V2R phosphopeptides which contained more phosphorylated residues bind βarr with much higher affinity31. Therefore, the presence of multiple phosphorylated residues on the V2T likely enhances the affinity of β2V2R–βarr1 interaction and thus contributes to megaplex formation. Moreover, our LC-MS/MS results suggest that while some residues are phosphorylated independent of receptor stimulation, specific phosphorylation sites are necessary to recruit and stabilize βarr1 on the GPCR tail (Extended Data Fig. 10b).
Orientational changes in receptor-bound G proteins have been implicated in downstream signaling consequences, as can be observed with previous structures of comparable GPCRs in the presence of differing ligands or receptor binders27,28,32,33. In the presence of βarr, the Gαs subunit within the megaplex displays a 3° rotation by an axis parallel to the β2V2R–Gs contact. Additionally, the Gβγ subunits displays a 3.4° rotation by an axis parallel to the membrane, potentially as a consequence of βarr1 binding to the V2T (Figure 3f).
MD experiments reveal a flexible megaplex βarr1 capable of adopting multiple positions in relation to the β2V2R–Gs subcomplex, and hints at transient contacts made between nonpolar βarr1 edge residues and the membrane. Comparable C-edge loops within visual arrestin have also been shown to interact with the lipid bilayer when bound to an active rhodopsin22,23. Recently, our group has also demonstrated that the tail conformation of a GPCR–βarr complex is capable of signaling, raising an interesting possibility that a megaplex βarr can also signal within internalized compartments by binding to downstream effectors11.
We observed an interaction between V2T residues D355 and E356 and βarr1 (presumably at K160 and R161) in the megaplex structure. This interaction is analogous to one observed between two acidic rhodopsin C-terminal tail residues, D330 and E332, and visual arrestin residues R19, K167, and K168. Along with the binding of rhodopsin C-terminal tail residue E341 to visual arrestin, these observations suggest that acidic residues, in addition to phosphorylated residues, play an important role in the association of arrestin by the C-terminal tail of a GPCR.
The fact that class B GPCRs primarily signal in a prolonged manner implicates the tail conformation in propagating sustained signaling. This is further reinforced by the fact that class A GPCRs like the β2AR, which do not tightly associate with βarr, do not signal from internalized compartments or do so only weakly9,34. There are two potential ways in which βarr may enable a GPCR to continue G protein signaling: (1) by keeping the receptor internalized, and (2) by scaffolding free Gβγ to accelerate reassociation of GDP-bound Gαs, reforming a Gs heterotrimer that is in close proximity to a receptor-arrestin complex to initiate another round of signaling.
βarr seems to serve as a scaffold for Gβγ, and together they have been shown to form a complex with a GPCR9,12,35. We have reported that the direct interaction between Gβγ subunits and phosphopeptide-bound active βarr1 increases upon Gs activation and separation of the Gαs from the Gβγ subunits9. Thus, it is possible that the interface of Gβγ subunits that associate with Gαs in the heterotrimeric Gs may interact with βarr1 upon Gs activation and Gαs separation. Indeed, currently available structures of Gβγ bound to protein effectors all show Gβγ interacting with them on the Gβ interface that normally interacts with Gα, consistent with the notion that Gβγ typically binds to other proteins after receptor-mediated dissociation from Gα36–38. Such a Gβγ scaffolding role of βarrs may serve to confine the G protein near the receptor, resulting in an increased G protein activation rate from internalized compartments.
Our structure of the β2V2R–Gs protein–βarr1 megaplex shows an active, ligand-bound receptor simultaneously engaging Gs protein by its intracellular core and activating βarr1 via six phosphorylated residues in the receptor C-terminal tail. That the receptor is in an active conformation, contacts Gs in a canonical fashion, while allowing βarr1 to bind to its phosphorylated C-terminal tail points to the GPCR as a master regulator of signaling capable of activating G protein in addition to performing βarr-mediated signaling concurrently. Finally, our structure provides a biophysical basis for G protein activation and sustained signaling within internalized cellular compartments.
Methods
Purification of the T4L-β2V2R–βarr1–Fab30 Complex, Gs Protein, and Protein Stabilizers
Gs protein, Fab30, and Nb32 were purified as previously described11,15,20. The T4L-β2V2R–βarr1–Fab30 complex is also purified as previously described4. Briefly, Sf9 cells were co-expressed with T4L-β2V2R, untagged bovine βarr1 (1–393), and GRK2-CAAX. Sixty-six hours post-infection, cells were stimulated for 30 minutes at 37 °C with 0.5 μM BI-167107 to stimulate receptor phosphorylation and complex formation. After harvest, cells were resuspended and dounce-homogenized in 20 mM HEPES, 150 mM NaCl, pH 7.4, 100 nM BI, leupeptin-benzamidine (LB) protease inhibitor. Excess purified Fab30 were added to stabilize the complex, and the mixture was stirred for 30 minutes at RT. Subsequently, complexes were solubilized with the addition of 0.5% lauryl maltose neopentyl glycol (LMNG)/0.05% cholesteryl hemisuccinate (CHS) and the mixture was stirred for an additional hour. Cell debris were clarified by centrifugation and solubilized material were purified using M1 Anti-Flag resin. Complexes were subjected to a cysteine alkylation procedure as previously reported, concentrated using a 100 kDa-cutoff Millipore concentrator and loaded onto a size exclusion column (Extended Data Fig. 1)10. The purified complexes were flash frozen with glycerol and stored until further use.
Formation of the Megaplex
In order to form megaplexes, the β2V2R–βarr1–Fab30 complex was incubated with excess Gs protein, Nb35, and Nb32 at RT for 1 hr in 20 mM HEPES, 150 mM NaCl, pH 7.4, 4 mM CaCl2, 0.01% LMNG, and 30 uM BI. Apyrase (25 mU/mL) was then added to the mixture and incubated at RT for 1 hr (Extended Data Fig. 1). To pull down megaplexes, M1 beads were added with subsequent incubation for an additional hour at RT. The beads were then spun down and washed five times with 20 mM HEPES, 150 mM NaCl, pH 7.4, 2 mM CaCl2, 0.01% LMNG, and 10 uM BI. Finally, the megaplexes were eluted with buffer containing 20 mM HEPES, 100 mM NaCl, pH 7.4, 0.01% LMNG, 30 uM BI, 0.2 mg/ml FLAG peptide, 1 mM TCEP, leupeptin-benzamidine protease inhibitor and 5 mM EDTA.
Initial samples were prepared in an identical manner without the use of Nb32.
Cryo-EM Sample Preparation and Data Acquisition
For grid preparation, megaplex samples were used either at a concentration of 0.8 mg/ml or diluted to 0.4 mg/ml with the same elution buffer as described above. Three uL of the sample was applied to freshly glow-discharged UltrAufoil 0.6/1 300-mesh grids (Quantifoil, Großlöbichau, Germany). The grids were prepared on an FEI Vitrobot Mark IV, blotted for 1.5 sec, and vitrified by plunge freezing into liquid ethane cooled by liquid nitrogen at −180 °C. Longer blot time consistently yielded dissociated complexes, pointing to a time-dependent dissociation of the complexes at the air-water interface39. The addition of Nb32 significantly enhanced the number of intact complexes (Extended Data Fig. 2).
Data acquisition at the Howard Hughes Medical Institute Janelia Research Campus was done on an FEI Titan Krios (Janelia Krios 1) operating at 300 kV equipped with a spherical aberration corrector, an energy filter (Gatan GIF Quantum), and a post-GIF K2 Summit direct electron detector. Images were obtained in super-resolution counting mode with a super-resolution pixel size of 0.52Å, which corresponds to a physical pixel size of 1.04 Å. An energy slit with a width of 20 eV was used during data collection. Fully automated data collection was carried out using the SerialEM software40. Initial data collection and analysis showed that intact megaplex particles exhibited preferred orientation (Extended Data Fig. 2). Attempts to alleviate this problem was unsuccessful. Therefore, tilted data collection was employed to improve orientational distribution41.
In total, five separate datasets were collected with the stage tilted at 30°,40°, and 45° on Janelia Krios 1. For an initial dataset comprising 30° and 40° tilted micrographs (Extended Data Fig. 4, dataset 1), the dose rate was set at 8 e−/pixel/s and the total exposure time was 14 s, resulting in a total dose of 103.5 e−/Å2. With dose fractionation set at 0.2 s/frame, each movie series contains 70 frames. For subsequent 40° and 45° tilted data collections (Extended Data Fig. 4, datasets 2–5), the dose rate was set at 8 e−/pixel/s and the total exposure time was 14.1 s, resulting in a total dose of 104.3 e−/Å2. With dose fractionation set at 0.15 s/frame, each movie series contains 94 frames.
All data collected at New York Structural Biology Center (NYSBC) was done on an FEI Titan Krios (NYSBC Krios 2) operating at 300 kV equipped with a spherical aberration corrector, an energy filter (Gatan GIF Quantum), and a post-GIF K2 Summit direct electron detector. Images were obtained in electron counting mode with a physical pixel size of 1.1 Å. An energy slit with a width of 20 eV was used during data collection. Fully automated data collection was carried out using the Leginon software42.
In total, two datasets were collected on NYSBC Krios 2. A dataset that comprises 45° and 50° tilted micrographs (Extended Data Fig. 4, dataset 6) had a dose rate of 8.65 e−/pixel/s and a total exposure time of 14 s, resulting in a total dose of 103.5 e−/Å2. With dose fractionation set at 0.2 s/frame, each movie series contains 70 frames. A subsequent dataset of 40° tilted micrographs (Extended Data Fig. 4, dataset 7) was collected with a dose rate of 8.38 e−/pixel/s and a total exposure time of 13.95 s, resulting in a total dose of 96.61 e−/Å2. With dose fractionation set at 0.15 s/frame, each movie series contains 93 frames.
Data Processing
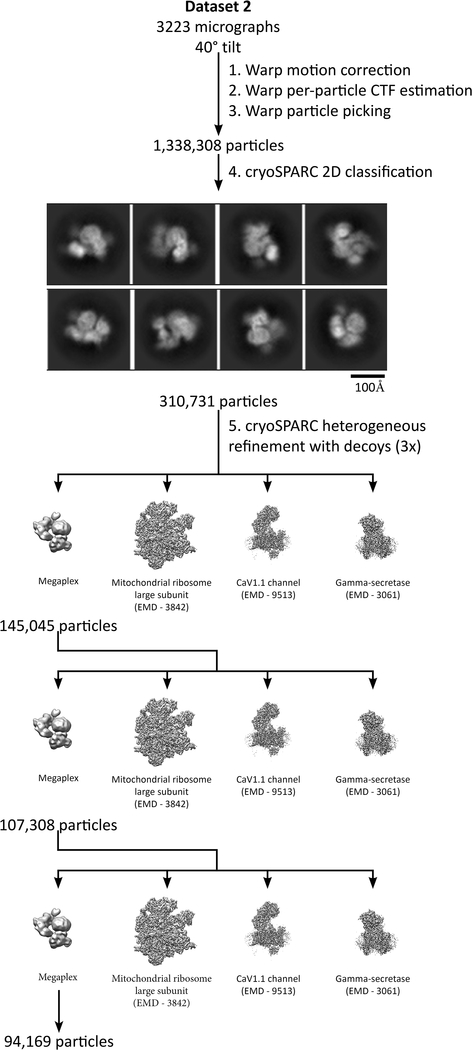
All data processing operations were performed with Warp v. 1.0.5, Relion 3.0-beta-2, and cryoSPARC v2.4.0 unless otherwise specified43–45. Warp was used for gain correction and motion correction of all raw frames, as well as for particle picking and per-particle CTF estimation. Subsequently, particles were extracted for processing in cryoSPARC, where each dataset was first put through 2D classification in order to remove false positives. Multiple rounds of heterogeneous refinement against a megaplex reconstruction and three other decoy structures was performed to clean up the dataset (Extended Data Fig. 3).
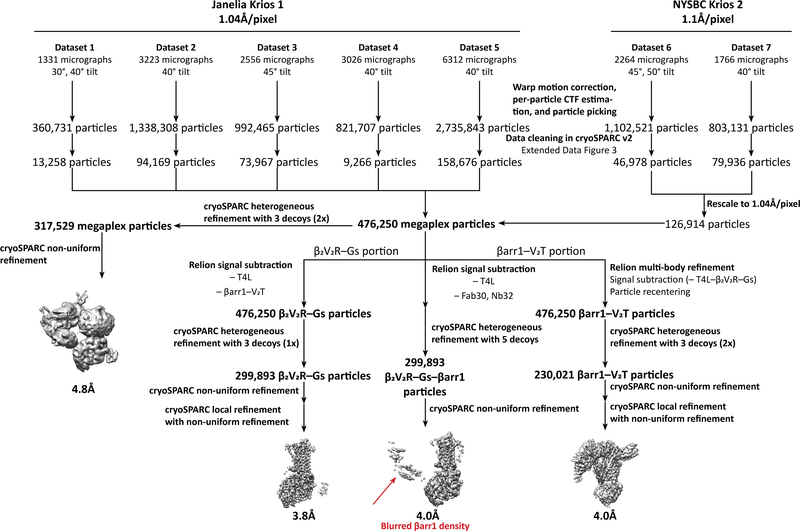
Cleaned particles from the NYSBC datasets were rescaled to a pixel size of 1.04Å and combined with particles from the Janelia datasets, resulting in a total of 476,250 megaplex particles. These particles subsequently underwent two rounds of heterogeneous refinement against a megaplex reconstruction and three other decoy structures, resulting in 317,529 particles that made up the megaplex consensus reconstruction (Extended Data Fig. 4, 5). The map was sharpened within cryoSPARC using an estimated b-factor of −202.3 Å2.
To obtain a higher resolution reconstruction of the β2V2R–Gs portion, signal subtraction was performed in Relion to subtract density corresponding to T4L and the Nb32–V2T–βarr1–Fab30 portion of the megaplex. The signal subtracted particle stack was further cleaned through one round of cryoSPARC heterogeneous refinement against a segmented β2V2R–Gs map and three decoy structures, resulting in 299,893 β2V2R–Gs particles. Finally, these particles were refined in cryoSPARC using non-uniform refinement followed by local non-uniform refinement, resulting in a final reconstruction of the β2V2R–Gs portion at 3.8Å (Extended Data Figs. 4,6). The map was sharpened within cryoSPARC using an estimated b-factor of −133.6 Å2.
As the βarr1–V2T portion (which contains the Nb32–V2T–βarr1–Fab30 portion of the megaplex) is much smaller than the β2V2R–Gs portion, we first performed multibody refinement within Relion, subtracted the T4L–β2V2R–Gs portion from the particle images, and re-centered them on the βarr1–V2T density. These subtracted, re-centered βarr1–V2T particles were put through two rounds of cryoSPARC heterogeneous refinement against a segmented Nb32–V2T–βarr1–Fab30 map and three decoy structures, resulting in 230,021 particles. Finally, these particles were refined in cryoSPARC using non-uniform refinement, followed by local non-uniform refinement, resulting in a final reconstruction at 4.0Å (Extended Data Figs. 4,6). The map was sharpened within cryoSPARC using an estimated b-factor of −139 Å2.
The signal-subtracted reconstructions were fitted within and resampled on the grid of the consensus megaplex reconstruction using the vop resample command within UCSF Chimera.
For each reconstruction, gold-standard fourier shell correlation (FSC = 0.143 criterion) was determined within cryoSPARC, and local resolution was determined using the program MonoRes, implemented within cryoSPARC45,46. Three-dimensional FSC (3D-FSC) to assess for directional resolution anisotropy was determined using the 3D-FSC web server (https://3dfsc.salk.edu)41. To calculate map-to-model sphericity, the models were converted to density maps at 2.08 Å using Chimera. To make the mask, the models were converted to density maps at 8 Å using Chimera and binarized using Relion 3 with a soft Gaussian edge of 3 pixels. The FSC and 3D-FSC of map to model was calculated between the sharpened density maps and the model density map using the 3DFSC server at a FSC threshold of 0.5, after applying the aforementioned mask. Finally, map-to-model FSC (FSC = 0.5 criterion) was determined using phenix.mtriage47.
Model Building
The β2V2R–Gs and βarr1–V2T portions of the megaplex were modeled using the β2AR–Gs–Nb35 (PDB: 3SN6) and the V2Rpp–βarr1–Fab30 (PDB: 4JQI) crystal structures as starting points, respectively. A homology model of Nb32 was generated using the I-TASSER web server48. The crystal structures were first rigidly fitted into their corresponding signal-subtracted maps in UCSF Chimera, followed by manual adjustments and model building in Coot49,50. Atomic models for each subcomplexes were refined against the signal-subtracted density map using phenix.real_space_refine with Ramachandran, rotamer, torsion, and secondary structure restraints enforced47. Additional modeling and manual adjustments were performed in Coot and the modeling statistics were validated using MolProbity51. All structural comparisons and figures were made with UCSF Chimera, UCSF ChimeraX, and PyMOL (pymol.org)49,52.
Coarse-grained Molecular Dynamics (MD) Simulations
All MD starting structures were modified from the cryo-EM structure to allow for proper receptor placement in a DPPC membrane. The linker (343-ARGGRTPPSLGPQD-355) from the end of helix 8 to the C terminal tail of the receptor was modeled in through PyMOL (pymol.org) and clashes between side chains were minimized using PyMOL sculpting tool. These structures was then embedded in a 30 nm DPPC lipid bilayer and set up for martini coarse graining using the CHARMM_GUI website53,54. All MD calculations were performed using the SBgrid software package with GROMACS 2018.1 at 303K55. The complex was minimized in 10,000 steps and subjected to 5 rounds of equilibration, each of 1 ns, to stabilize the system with a time interval of 0.02 ps between calculations. 30 nanoseconds of production were run on each MD to ensure stability of the complex. All final MD structures were visualized and analyzed through VMD and PyMOL56.
Liquid Chromatography-Tandem Mass Spectrometry (LC-MS/MS)
All solvents are of MS-grade and purchased from Fisher Scientific, unless otherwise specified. Gel-bands were cut into small pieces of approximately 1mm3 using a scalpel and destained, reduced and alkylated as previously described57. Digestion was carried out at 37°C overnight using a combination of sequencing grade trypsin (Promega) and endopeptidase LysC (Wako Chemicals). Two iterations of peptide extraction were performed using 70% acetonitrile, 5% formic acid in water and peptides were dried using a vacuum centrifuge (Savant).
Liquid chromatography was performed on a Dionex 3000 Ultimate HPLC equipped with a NCS3500RS nano- and microflow pump (Dionex). Peptides were loaded onto a 100 μm*20mm Acclaim PepMap C18 trap column (Thermo Scientific) at 3μL/min. Solvent A consisted of 0.1 % formic acid in water and solvent B consisted of 0.1% formic acid, 80% acetonitrile in water. Separation was achieved using a 75μm*120mm pulled-emitter nanocolumn (Nikkyo Technos). Solvent B went from 1% – 38% over 70 minutes followed by a sharp 1-minute increase to 90% where it was kept for 13 minutes. Peptides were analyzed using a Q-Exactive HF mass spectrometer (Thermo Scientific) operating in positive ion mode. For the data-dependent analyses, spectra were recorded in data dependent acquisition (DDA) mode, selecting the 20 most abundant ions for fragmentation within each duty cycle. MS1 resolution was set to 60 000 and an MS2 resolution was set to 30 000. AGC targets of 3e6 (MS1) and 2e5 (MS2) were applied.
A parallel reaction monitoring (PRM) method was designed to target two peptides from the C-terminus which were found to be phosphorylated from the DDA experiment. The targets were TPPSLGPQDESCTTASSSLAK with 0–3 phosphorylations and GRTPPSLGPQDESCTTASSSLAK with 0–4 phosphorylations.
Data was searched using MaxQuant v. 1.6.258. Default settings were applied. Phosphorylation of S and T and oxidation of M were applied as variable modifications. Carbamidomethylation of C was applied as a static modification. A maximum of 8 possible modifications per peptide was allowed. Match between runs was enabled. Collapsed phosphosite information was exported, from which the localization probabilities for phosphorylations at individual residues could be determined59.
MS1 peak areas were extracted using Skyline v. 4.1.0.1816960. Peak areas from the two peptide targets were collapsed to provide an intensity for the region of interest with varying number phosphorylations. Intensity values of the C-terminal region were normalized based on all identified peptides from the protein.
The mass spectrometry proteomics data have been deposited to the ProteomeXchange Consortium via the PRIDE partner repository with the dataset identifier PXD015298.
Real-time cAMP measurement
Previously described βarr1/βarr2/β2AR triple-knockout HEK293 cells were transiently co-transfected with plasmids encoding the bioluminescence resonance energy transfer (BRET)-based CAMYEL cAMP biosensor (YFP-Epac-Rluc) and either β2V2R, β2V2R–βarr1, β2V2R–βarr1, or pcDNA3.1(+) mock control11. Twenty-four hours after transfection, the cells were plated in poly-D-lysine coated white 96-well plates (Coring, USA) and incubated overnight. Forty-eight hours after transfection, the cells were washed and placed in assay buffer (HBSS + 10 mM HEPES, pH 7.4) at 37 °C for 30 min. Cells were loaded with 5 μM luciferase substrate coelenterazine H for 5 min and BRET was detected through Rluc8 luminescence (480 nm) and YFP fluorescence (530 nm) measurements using a CLARIOstar Plus plate reader (BMG Labtech). After a 2-min basal period, cells were challenged with 1 μM BI-167107. Forskolin (10 μM) was used as a positive control, and regular assay buffer as a negative/baseline control. All data was subsequently normalized to the 10 μM Forskolin control. Data represents mean ± S.E.M. of four independent experiments for the β2V2R–βarr1 and β2V2R–βarr2 conditions and of three independent experiments for the β2V2R condition. Ordinary one-way ANOVA with Holm-Sidak’s multiple comparison post-hoc test was performed to determine statistical significance between mock control and the β2V2R or β2V2R–βarr1/2 conditions.
Further information on experimental design is available in the Nature Research Reporting Summary linked to this article.
Data Availability
Cryo-EM maps corresponding to the consensus megaplex reconstruction as well as the signal-subtracted β2V2R–Gs and βarr1–V2T subcomplexes have been deposited in the Electron Microscopy Data Bank (EMDB) with accession codes EMD-9377, EMD-9376, and EMD-9375, respectively. Atomic coordinates for the β2V2R–Gs and βarr1–V2T subcomplexes have been deposited in the Protein Data Bank (PDB) with accession codes PDB-6NI3 and PDB-6NI2, respectively. The mass spectrometry proteomics data have been deposited to the ProteomeXchange Consortium via the PRIDE partner repository with the dataset identifier PXD015298. Source data for Extended Data Figures 1c and 1d are available with the paper online. Other data that support the findings of this study are available from the corresponding authors upon request.
Extended Data
Extended Data Fig. 1: Sample preparation and purification of the megaplex.
a, Schematic illustration of the purification and in vitro formation procedure of the megaplex. b, Size exclusion chromatogram of the precursor β2V2R–βarr1–Fab30 complex. c, SDS-PAGE gel of the β2V2R–βarr1–Fab30 complex after purification by size exclusion chromatography. d, SDS-PAGE gel of the megaplex after in vitro formation and M1 anti-Flag purification. For c-d, M denotes molecular weight (kDa) marker. Uncropped gel images for Extended Data Fig. 1c,d are provided as Source Data.
Extended Data Fig. 2: Nanobody 32 (Nb32) stabilizes the megaplex.
a, Representative micrograph and 2D class averages of megaplex samples prepared without nanobody 32 (Nb32), displaying a small percentage of megaplexes. b, Same as in a, but with a megaplex sample prepared with Nb32.
Extended Data Fig. 3: A procedure utilizing Warp and cryoSPARC for initial data processing and cleaning of one representative dataset (Dataset 2).
The same procedure was used on all dataset.
Extended Data Fig. 4:
Data processing workflow for all datasets of the megaplex.
Extended Data Fig. 5: Megaplex consensus reconstruction.
a, Representative 2D class averages of the consensus megaplex reconstruction. b-c, The megaplex reconstruction is shown at high (0.115) threshold (b), and low (0.05) threshold (c). The T4L and flexible portion of the V2T appears at a lower threshold. The atomic models of the components, derived from signal subtracted reconstructions, are fitted to the consensus reconstruction. Densities for the flexible V2T and steric clash between the β2V2R and Nb32 are denoted by black circles.
Extended Data Fig. 6: Orientational distribution and resolution measurements of the megaplex.
a-d, orientational distribution (a), FSC curves indicating overall resolution (FSC = 0.143) (b), 3D-FSC to assess directional resolution anisotropy (c), and local resolution measurements (d) of the megaplex consensus reconstruction. e-j, orientational distribution (e), FSC curves indicating overall resolution (FSC = 0.143) (f), 3D-FSC to assess directional resolution anisotropy (g), map-to-model FSC and sphericity (h), local resolution measurements (i), and map-to-model FSC curve (j) of the β2V2R–Gs reconstruction. k-p, same as e-j, but for the βarr1–V2T reconstruction.
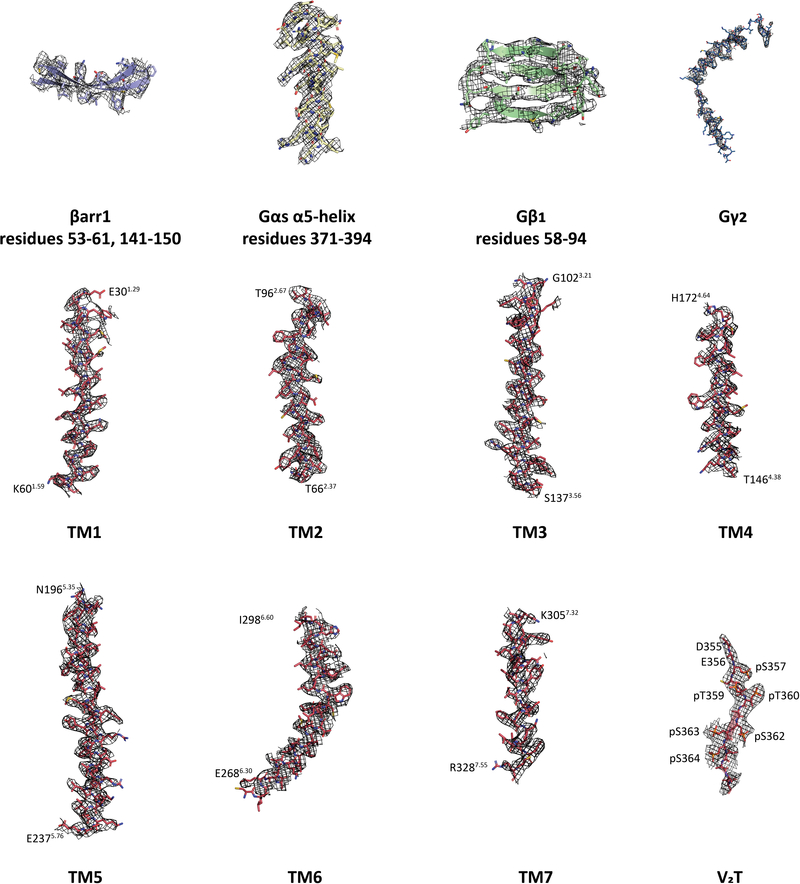
Extended Data Fig. 7: Representative densities in black mesh of various protein components.
Representative densities, from the 3.8Å β2V2R–Gs and 4.0Å βarr1–V2T structures, of the β2V2R, Gs subunits, and βarr1.
Extended Data Fig. 8: Representative density of the β2V2R–Gs portion of the megaplex, and comparison against other active β2AR structures.
a, Comparison of the binding pose of BI-167107 (BI) in the megaplex against three other available BI-bound β2AR structures. BI is colored green. b, Representative density showing contacts between the β2V2R and Gs in the megaplex. c, The BI binding pocket within the megaplex, accompanied by EM density for all residues within 5 Å of the ligand.
Extended Data Fig. 9: Interaction between Fab30, V2T and protein stabilizers.
a-b, Interface between βarr1 and V2T with either Nb32 (a) or Fab30 (b). Interface residues are labeled.
Extended Data Fig. 10: Verification of observed phosphorylation sites on the V2T.
a, Cryo-EM density for the six phosphorylated residues on the V2T. b, Localization probabilities of eight potential sites of phosphorylation on the V2T assessed by LC-MS/MS. A trypsin-digested fragment of the V2T is displayed. Bolded residues are phosphorylation sites observed in the cryo-EM map. Residues in red were not observed in the map, and yellow-highlighted residues were phosphorylated in both unstimulated and BI-stimulated receptors.
Supplementary Material
Acknowledgments
We thank Q. Lennon, J. Bisson and J. Taylor for excellent administrative support, W. Capel for technical support, Y. Zhang and G. Skiniotis for help with initial sample screening, C.-R. Liang, L.-L. Gu and J.-M. Shan for synthesizing BI-167107, T. Wang and the CUNY Advanced Science Research Center Imaging Facility for help with sample screening and data collection, the lab of K. Gardner at the CUNY Advanced Science Research Center for providing various general lab reagents and equipment during initial sample screening, M. Walters, M. DeLong, M. Plue, T. Milledge, D. Capel and X. Jiang at Duke University for technical support and discussion, D. Lyumkis, D. Tegunov, W. Rice, E. Eng, L. Kim, M. Kopylov and A. Cheng for help with tilted data collection and processing and S. Houston and B. Plouffe for helpful discussion.
This work received support from NIH grants (nos. T32GM007171 and F30HL149213 to A.H.N; F30HL129803 to T.J.C.; T32GM007767 to J.P.M.; R35GM133598 to A.d.G. and R01HL016037 to R.J.L.); HHMI Medical Research Fellowship to A.H.N.; the Danish Council for Independent Research & Lundbeck Foundation (DFF-5053-00136 and R172-2014-1468 to A.R.B.T.); American Heart Association Innovative Project Award (no. 19IPLOI34760706 to A.d.G); Institut de Recherche Servier (no. 18021932 to A.d.G. and D.B.-H.); and American Heart Association Predoctoral Fellowship (no. 13PRE17110027 to J.P.M.). Some of this work was performed at the Simons Electron Microscopy Center and National Resource for Automated Molecular Microscopy located at the New York Structural Biology Center, supported by grants from the Simons Foundation (grant no. SF349247), NYSTAR, and the NIH National Institute of General Medical Sciences (grant no. GM103310) with additional support from Agouron Institute (grant no. F00316) and the NIH (grant no. OD019994). R.J.L. is an HHMI Investigator.
Footnotes
Competing Interests Statement
The authors declare no competing interests.
References
- 1.Reiter E, Ahn S, Shukla AK & Lefkowitz RJ Molecular mechanism of beta-arrestin-biased agonism at seven-transmembrane receptors. Annu Rev Pharmacol Toxicol 52, 179–97 (2012). [DOI] [PMC free article] [PubMed] [Google Scholar]
- 2.Lefkowitz RJ, Stadel JM & Caron MG Adenylate cyclase-coupled beta-adrenergic receptors: structure and mechanisms of activation and desensitization. Annu Rev Biochem 52, 159–86 (1983). [DOI] [PubMed] [Google Scholar]
- 3.Rajagopal S, Rajagopal K & Lefkowitz RJ Teaching old receptors new tricks: biasing seven-transmembrane receptors. Nat Rev Drug Discov 9, 373–86 (2010). [DOI] [PMC free article] [PubMed] [Google Scholar]
- 4.Oakley RH, Laporte SA, Holt JA, Barak LS & Caron MG Association of beta-arrestin with G protein-coupled receptors during clathrin-mediated endocytosis dictates the profile of receptor resensitization. Journal of Biological Chemistry 274, 32248–32257 (1999). [DOI] [PubMed] [Google Scholar]
- 5.Oakley RH, Laporte SA, Holt JA, Caron MG & Barak LS Differential affinities of visual arrestin, beta arrestin1, and beta arrestin2 for G protein-coupled receptors delineate two major classes of receptors. J Biol Chem 275, 17201–10 (2000). [DOI] [PubMed] [Google Scholar]
- 6.Calebiro D et al. Persistent cAMP-signals triggered by internalized G-protein-coupled receptors. PLoS Biol 7, e1000172 (2009). [DOI] [PMC free article] [PubMed] [Google Scholar]
- 7.Ferrandon S et al. Sustained cyclic AMP production by parathyroid hormone receptor endocytosis. Nat Chem Biol 5, 734–42 (2009). [DOI] [PMC free article] [PubMed] [Google Scholar]
- 8.Feinstein TN et al. Noncanonical control of vasopressin receptor type 2 signaling by retromer and arrestin. J Biol Chem 288, 27849–60 (2013). [DOI] [PMC free article] [PubMed] [Google Scholar]
- 9.Thomsen ARB et al. GPCR-G Protein-beta-Arrestin Super-Complex Mediates Sustained G Protein Signaling. Cell 166, 907–919 (2016). [DOI] [PMC free article] [PubMed] [Google Scholar]
- 10.Shukla AK et al. Visualization of arrestin recruitment by a G-protein-coupled receptor. Nature 512, 218–222 (2014). [DOI] [PMC free article] [PubMed] [Google Scholar]
- 11.Cahill TJ 3rd et al. Distinct conformations of GPCR-beta-arrestin complexes mediate desensitization, signaling, and endocytosis. Proc Natl Acad Sci U S A 114, 2562–2567 (2017). [DOI] [PMC free article] [PubMed] [Google Scholar]
- 12.Wehbi VL et al. Noncanonical GPCR signaling arising from a PTH receptor-arrestin-Gbetagamma complex. Proc Natl Acad Sci U S A 110, 1530–5 (2013). [DOI] [PMC free article] [PubMed] [Google Scholar]
- 13.Jimenez-Vargas NN et al. Protease-activated receptor-2 in endosomes signals persistent pain of irritable bowel syndrome. Proc Natl Acad Sci U S A 115, E7438–E7447 (2018). [DOI] [PMC free article] [PubMed] [Google Scholar]
- 14.Wanka L, Babilon S, Kaiser A, Morl K & Beck-Sickinger AG Different mode of arrestin-3 binding at the human Y1 and Y2 receptor. Cell Signal 50, 58–71 (2018). [DOI] [PubMed] [Google Scholar]
- 15.Rasmussen SG et al. Crystal structure of the beta2 adrenergic receptor-Gs protein complex. Nature 477, 549–55 (2011). [DOI] [PMC free article] [PubMed] [Google Scholar]
- 16.Cherezov V et al. High-resolution crystal structure of an engineered human beta2-adrenergic G protein-coupled receptor. Science 318, 1258–65 (2007). [DOI] [PMC free article] [PubMed] [Google Scholar]
- 17.Ballesteros JA, Weinstein. H Integrated methods for the construction of three-dimensional models and computational probing of structure-function relations in G protein-coupled receptors. Methods in Neurosciences, 366–428 (1995). [Google Scholar]
- 18.Ring AM et al. Adrenaline-activated structure of beta2-adrenoceptor stabilized by an engineered nanobody. Nature 502, 575–579 (2013). [DOI] [PMC free article] [PubMed] [Google Scholar]
- 19.Rasmussen SG et al. Structure of a nanobody-stabilized active state of the beta(2) adrenoceptor. Nature 469, 175–80 (2011). [DOI] [PMC free article] [PubMed] [Google Scholar]
- 20.Shukla AK et al. Structure of active beta-arrestin-1 bound to a G-protein-coupled receptor phosphopeptide. Nature 497, 137–41 (2013). [DOI] [PMC free article] [PubMed] [Google Scholar]
- 21.Fredericks ZL, Pitcher JA & Lefkowitz RJ Identification of the G protein-coupled receptor kinase phosphorylation sites in the human beta2-adrenergic receptor. J Biol Chem 271, 13796–803 (1996). [DOI] [PubMed] [Google Scholar]
- 22.Lally CC, Bauer B, Selent J & Sommer ME C-edge loops of arrestin function as a membrane anchor. Nat Commun 8, 14258 (2017). [DOI] [PMC free article] [PubMed] [Google Scholar]
- 23.Zhou XE et al. Identification of Phosphorylation Codes for Arrestin Recruitment by G Protein-Coupled Receptors. Cell 170, 457–469 e13 (2017). [DOI] [PMC free article] [PubMed] [Google Scholar]
- 24.Lohse MJ, Benovic JL, Codina J, Caron MG & Lefkowitz RJ beta-Arrestin: a protein that regulates beta-adrenergic receptor function. Science 248, 1547–50 (1990). [DOI] [PubMed] [Google Scholar]
- 25.Lohse MJ et al. Receptor-specific desensitization with purified proteins. Kinase dependence and receptor specificity of beta-arrestin and arrestin in the beta 2-adrenergic receptor and rhodopsin systems. J Biol Chem 267, 8558–64 (1992). [PubMed] [Google Scholar]
- 26.Kang Y et al. Crystal structure of rhodopsin bound to arrestin by femtosecond X-ray laser. Nature 523, 561–7 (2015). [DOI] [PMC free article] [PubMed] [Google Scholar]
- 27.Liang YL et al. Phase-plate cryo-EM structure of a class B GPCR-G-protein complex. Nature 546, 118–123 (2017). [DOI] [PMC free article] [PubMed] [Google Scholar]
- 28.Zhang Y et al. Cryo-EM structure of the activated GLP-1 receptor in complex with a G protein. Nature 546, 248–253 (2017). [DOI] [PMC free article] [PubMed] [Google Scholar]
- 29.Le Gouill C, Innamorati G & Birnbaumer M An expanded V2 receptor retention signal. FEBS Lett 532, 363–6 (2002). [DOI] [PubMed] [Google Scholar]
- 30.Innamorati G, Sadeghi HM, Tran NT & Birnbaumer M A serine cluster prevents recycling of the V2 vasopressin receptor. Proc Natl Acad Sci U S A 95, 2222–6 (1998). [DOI] [PMC free article] [PubMed] [Google Scholar]
- 31.Mayer D et al. Distinct G protein-coupled receptor phosphorylation motifs modulate arrestin affinity and activation and global conformation. Nat Commun 10, 1261 (2019). [DOI] [PMC free article] [PubMed] [Google Scholar]
- 32.Liang YL et al. Cryo-EM structure of the active, Gs-protein complexed, human CGRP receptor. Nature 561, 492–497 (2018). [DOI] [PMC free article] [PubMed] [Google Scholar]
- 33.Liang YL et al. Phase-plate cryo-EM structure of a biased agonist-bound human GLP-1 receptor-Gs complex. Nature 555, 121–125 (2018). [DOI] [PubMed] [Google Scholar]
- 34.Irannejad R et al. Conformational biosensors reveal GPCR signalling from endosomes. Nature 495, 534–8 (2013). [DOI] [PMC free article] [PubMed] [Google Scholar]
- 35.Yang M, He RL, Benovic JL & Ye RD beta-Arrestin1 interacts with the G-protein subunits beta1gamma2 and promotes beta1gamma2-dependent Akt signalling for NF-kappaB activation. Biochem J 417, 287–96 (2009). [DOI] [PMC free article] [PubMed] [Google Scholar]
- 36.Gaudet R, Bohm A & Sigler PB Crystal structure at 2.4 angstroms resolution of the complex of transducin betagamma and its regulator, phosducin. Cell 87, 577–88 (1996). [DOI] [PubMed] [Google Scholar]
- 37.Lodowski DT, Pitcher JA, Capel WD, Lefkowitz RJ & Tesmer JJ Keeping G proteins at bay: a complex between G protein-coupled receptor kinase 2 and Gbetagamma. Science 300, 1256–62 (2003). [DOI] [PubMed] [Google Scholar]
- 38.Whorton MR & MacKinnon R X-ray structure of the mammalian GIRK2-betagamma G-protein complex. Nature 498, 190–7 (2013). [DOI] [PMC free article] [PubMed] [Google Scholar]
Methods-only References
- 39.Noble AJ et al. Routine single particle CryoEM sample and grid characterization by tomography. Elife 7(2018). [DOI] [PMC free article] [PubMed] [Google Scholar]
- 40.Mastronarde DN Automated electron microscope tomography using robust prediction of specimen movements. J Struct Biol 152, 36–51 (2005). [DOI] [PubMed] [Google Scholar]
- 41.Tan YZ et al. Addressing preferred specimen orientation in single-particle cryo-EM through tilting. Nat Methods 14, 793–796 (2017). [DOI] [PMC free article] [PubMed] [Google Scholar]
- 42.Suloway C et al. Automated molecular microscopy: the new Leginon system. J Struct Biol 151, 41–60 (2005). [DOI] [PubMed] [Google Scholar]
- 43.Tegunov D & Cramer P Real-time cryo-EM data pre-processing with Warp. BioRxiv (2018). [Google Scholar]
- 44.Zivanov J et al. New tools for automated high-resolution cryo-EM structure determination in RELION-3. Elife 7(2018). [DOI] [PMC free article] [PubMed] [Google Scholar]
- 45.Punjani A, Rubinstein JL, Fleet DJ & Brubaker MA cryoSPARC: algorithms for rapid unsupervised cryo-EM structure determination. Nat Methods 14, 290–296 (2017). [DOI] [PubMed] [Google Scholar]
- 46.Vilas JL et al. MonoRes: Automatic and Accurate Estimation of Local Resolution for Electron Microscopy Maps. Structure 26, 337–344 e4 (2018). [DOI] [PubMed] [Google Scholar]
- 47.Adams PD et al. PHENIX: a comprehensive Python-based system for macromolecular structure solution. Acta Crystallogr D Biol Crystallogr 66, 213–21 (2010). [DOI] [PMC free article] [PubMed] [Google Scholar]
- 48.Roy A, Kucukural A & Zhang Y I-TASSER: a unified platform for automated protein structure and function prediction. Nat Protoc 5, 725–38 (2010). [DOI] [PMC free article] [PubMed] [Google Scholar]
- 49.Pettersen EF et al. UCSF Chimera--a visualization system for exploratory research and analysis. J Comput Chem 25, 1605–12 (2004). [DOI] [PubMed] [Google Scholar]
- 50.Emsley P, Lohkamp B, Scott WG & Cowtan K Features and development of Coot. Acta Crystallogr D Biol Crystallogr 66, 486–501 (2010). [DOI] [PMC free article] [PubMed] [Google Scholar]
- 51.Chen VB et al. MolProbity: all-atom structure validation for macromolecular crystallography. Acta Crystallogr D Biol Crystallogr 66, 12–21 (2010). [DOI] [PMC free article] [PubMed] [Google Scholar]
- 52.Goddard TD et al. UCSF ChimeraX: Meeting modern challenges in visualization and analysis. Protein Sci 27, 14–25 (2018). [DOI] [PMC free article] [PubMed] [Google Scholar]
- 53.Marrink SJ & Mark AE Molecular view of hexagonal phase formation in phospholipid membranes. Biophys J 87, 3894–900 (2004). [DOI] [PMC free article] [PubMed] [Google Scholar]
- 54.Jo S, Kim T, Iyer VG & Im W CHARMM-GUI: a web-based graphical user interface for CHARMM. J Comput Chem 29, 1859–65 (2008). [DOI] [PubMed] [Google Scholar]
- 55.Pronk S et al. GROMACS 4.5: a high-throughput and highly parallel open source molecular simulation toolkit. Bioinformatics 29, 845–54 (2013). [DOI] [PMC free article] [PubMed] [Google Scholar]
- 56.Humphrey W, Dalke A & Schulten K VMD: visual molecular dynamics. J Mol Graph 14, 33–8, 27–8 (1996). [DOI] [PubMed] [Google Scholar]
- 57.Shevchenko A, Tomas H, Havlis J, Olsen JV & Mann M In-gel digestion for mass spectrometric characterization of proteins and proteomes. Nat Protoc 1, 2856–60 (2006). [DOI] [PubMed] [Google Scholar]
- 58.Cox J & Mann M MaxQuant enables high peptide identification rates, individualized p.p.b.-range mass accuracies and proteome-wide protein quantification. Nat Biotechnol 26, 1367–72 (2008). [DOI] [PubMed] [Google Scholar]
- 59.Olsen JV & Mann M Improved peptide identification in proteomics by two consecutive stages of mass spectrometric fragmentation. Proc Natl Acad Sci U S A 101, 13417–22 (2004). [DOI] [PMC free article] [PubMed] [Google Scholar]
- 60.MacLean B et al. Skyline: an open source document editor for creating and analyzing targeted proteomics experiments. Bioinformatics 26, 966–8 (2010). [DOI] [PMC free article] [PubMed] [Google Scholar]
Associated Data
This section collects any data citations, data availability statements, or supplementary materials included in this article.
Supplementary Materials
Data Availability Statement
Cryo-EM maps corresponding to the consensus megaplex reconstruction as well as the signal-subtracted β2V2R–Gs and βarr1–V2T subcomplexes have been deposited in the Electron Microscopy Data Bank (EMDB) with accession codes EMD-9377, EMD-9376, and EMD-9375, respectively. Atomic coordinates for the β2V2R–Gs and βarr1–V2T subcomplexes have been deposited in the Protein Data Bank (PDB) with accession codes PDB-6NI3 and PDB-6NI2, respectively. The mass spectrometry proteomics data have been deposited to the ProteomeXchange Consortium via the PRIDE partner repository with the dataset identifier PXD015298. Source data for Extended Data Figures 1c and 1d are available with the paper online. Other data that support the findings of this study are available from the corresponding authors upon request.


