Abstract
BACKGROUND
Residual C-peptide is detected in many people for years following the diagnosis of type 1 diabetes; however, the physiologic significance of low levels of detectable C-peptide is not known.
METHODS
We studied 63 adults with type 1 diabetes classified by peak mixed-meal tolerance test (MMTT) C-peptide as negative (<0.007 pmol/mL; n = 15), low (0.017–0.200; n = 16), intermediate (>0.200–0.400; n = 15), or high (>0.400; n = 17). We compared the groups’ glycemia from continuous glucose monitoring (CGM), β cell secretory responses from a glucose-potentiated arginine (GPA) test, insulin sensitivity from a hyperinsulinemic-euglycemic (EU) clamp, and glucose counterregulatory responses from a subsequent hypoglycemic (HYPO) clamp.
RESULTS
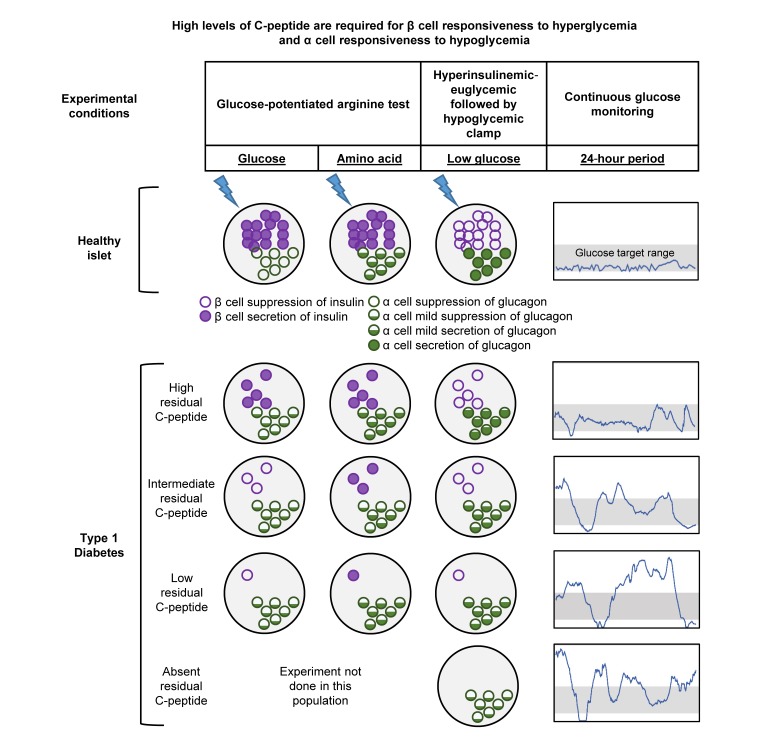
Low and intermediate MMTT C-peptide groups did not exhibit β cell secretory responses to hyperglycemia, whereas the high C-peptide group showed increases in both C-peptide and proinsulin (P ≤ 0.01). All groups with detectable MMTT C-peptide demonstrated acute C-peptide and proinsulin responses to arginine that were positively correlated with peak MMTT C-peptide (P < 0.0001 for both analytes). During the EU-HYPO clamp, C-peptide levels were proportionately suppressed in the low, intermediate, and high C-peptide compared with the negative group (P ≤ 0.0001), whereas glucagon increased from EU to HYPO only in the high C-peptide group compared with negative (P = 0.01). CGM demonstrated lower mean glucose and more time in range for the high C-peptide group.
CONCLUSION
These results indicate that in adults with type 1 diabetes, β cell responsiveness to hyperglycemia and α cell responsiveness to hypoglycemia are observed only at high levels of residual C-peptide that likely contribute to glycemic control.
FUNDING
Funding for this work was provided by the Leona M. and Harry B. Helmsley Charitable Trust, the National Center for Advancing Translational Sciences, and the National Institute of Diabetes and Digestive and Kidney Diseases.
Keywords: Endocrinology
Keywords: Beta cells, Diabetes, Islet cells
Introduction
Type 1 diabetes (T1D) results from autoimmune destruction of the insulin-producing β cells in the endocrine pancreatic islets of Langerhans. After a subclinical period of months to years of autoimmune destruction, the clinical diagnosis of diabetes occurs when the functional capacity for insulin secretion has been markedly reduced (1, 2), and corresponds to a considerable reduction in β cell volume (3, 4). Interestingly, there is heterogeneity of the pathology affecting the islets of individuals with T1D, with some pancreatic lobules containing islets without β cells and others containing islets with a near-normal complement of β cells (3, 4). With increasing time from diabetes diagnosis it becomes harder to find islets containing β cells (5), although scattered insulin-positive cells can be found in most individuals with T1D (6). Even among those with long-standing disease, some individuals may have pancreatic lobules with islets containing β cells (7). Thus, a portion of individuals with T1D appears to maintain a population of β cells capable of evading immune detection (8).
Consistent with the pathologic description of residual islets containing β cells, many individuals with T1D will maintain clinically meaningful endogenous insulin secretion, as estimated from levels of mixed meal–stimulated C-peptide greater than 0.200 pmol/mL (>0.60 ng/mL), for up to 5 years from diagnosis (9). In the Diabetes Control and Complications Trial (DCCT), such residual β cell function measured within 5 years of disease diagnosis was associated with reduced incidence of retinopathy and nephropathy and a decreased prevalence of severe hypoglycemia (10). Conversely, DCCT participants who had “undetectable” C-peptide at enrollment were at the greatest risk for severe hypoglycemia regardless of treatment intensity (11). Although the lower limit of detection for the C-peptide assay used in the DCCT was 0.03 pmol/mL (0.09 ng/mL) (9, 12), most assays performed poorly at this low concentration. Thus, “negative” has been used across a range from less than 0.03 to 0.17 pmol/mL (0.10–0.50 ng/mL), and stimulated C-peptide levels greater than 0.200 pmol/mL have been considered clinically meaningful. However, a more recent analysis of the DCCT (13) suggests that any level of measurable C-peptide may be associated with better clinical outcomes.
With the development and increasing use of improved C-peptide assays, it is now possible to detect residual C-peptide production in the majority of people with T1D during the first 10 years of diabetes, and in a substantial minority of people in their second and third decades with the disease (14–16). These observations have recently been extended to the Joslin Medalist cohort that includes individuals with more than 50 years disease duration (7). However, whether detection of low levels of residual C-peptide has any physiologic significance for affecting the secretory responses of other islet hormones such as glucagon or contributing to glucose control or counterregulation is not known. Moreover, one postulated mechanism for insulin resistance in T1D is peripheral administration of exogenous insulin versus portal delivery of endogenous insulin that is important for hepatic metabolism (17). Thus, people with intact C-peptide secretion were hypothesized to have higher insulin sensitivity.
The present study was designed to investigate the significance of varying levels of residual C-peptide production for evidencing persistent β cell function as well as α cell function that is dysregulated in T1D. Additionally, we sought to determine whether a minimum threshold of C-peptide was physiologically important based on a comprehensive evaluation of islet cell responsivity. To accomplish this, residual C-peptide defined by the peak during a mixed-meal tolerance test (MMTT) was related to β and α cell responsivity to glucose and arginine derived from glucose-potentiated arginine testing; insulin sensitivity measured during a stable glucose isotope–labeled hyperinsulinemic-euglycemic clamp; β and α cell responsivity to hypoglycemia and counterregulatory hormone, symptom and endogenous glucose production measured during a stable glucose isotope–labeled hyperinsulinemic-hypoglycemic clamp; and glycemic control derived from continuous glucose monitoring. Participants were grouped by their peak C-peptide during the MMTT as negative (<0.007 pmol/mL [<0.02 ng/mL]), low (0.017–0.200 pmol/mL [0.05–0.60 ng/mL]), intermediate (>0.200–0.400 pmol/mL [>0.60–1.20 ng/mL]), or high (>0.400 pmol/mL [>1.20 ng/mL]) based on previously reported distribution of residual C-peptide production in T1D (16). Although these were protocol-specified categories, the relationships between physiologic measures were also evaluated by peak C-peptide as a continuous variable.
Results
Participant characteristics.
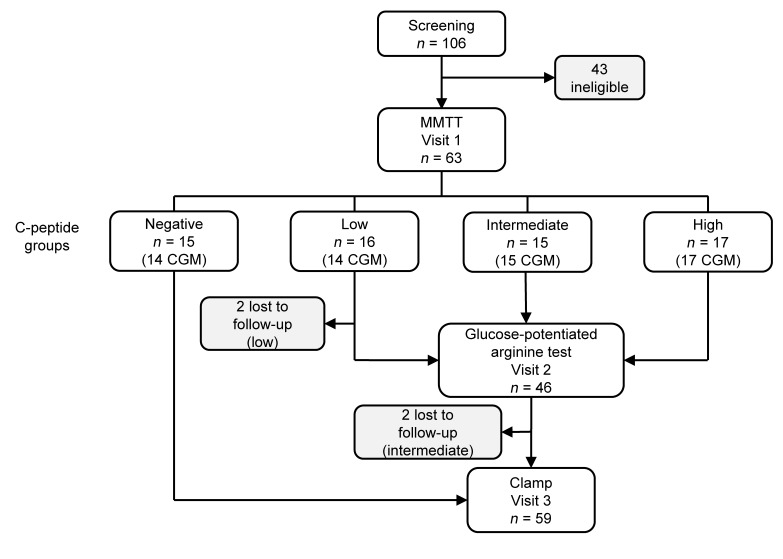
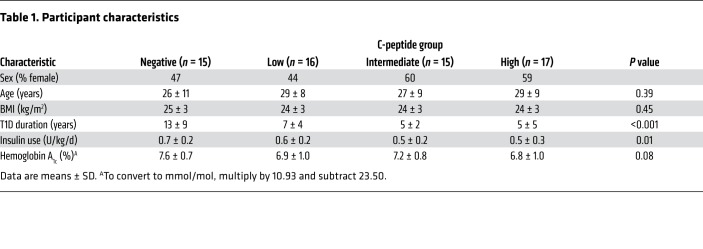
Between June 2016 and February 2017, 63 participants completed the study protocol (Figure 1). The participants were balanced across groups of C-peptide production for sex, age, and BMI; however, T1D duration was longer (P < 0.001) and insulin requirements were greater (P = 0.01) for those in the negative C-peptide group (Table 1).
Figure 1. Study design.
Eligibility was determined at a screening visit where measurement of nonfasting C-peptide was used to balance recruitment of participants to C-peptide groups. C-peptide group was ultimately determined from the mixed-meal tolerance test (MMTT) peak C-peptide measured at visit 1. Participants in the detectable (low, intermediate, and high) C-peptide groups underwent a glucose-potentiated arginine test at visit 2, and participants in the undetectable (negative) and detectable C-peptide groups underwent a hyperinsulinemic-euglycemic followed by hypoglycemic clamp at visit 3, as well as continuous glucose monitoring (CGM).
Table 1. Participant characteristics.
Islet and incretin responses during the MMTT.
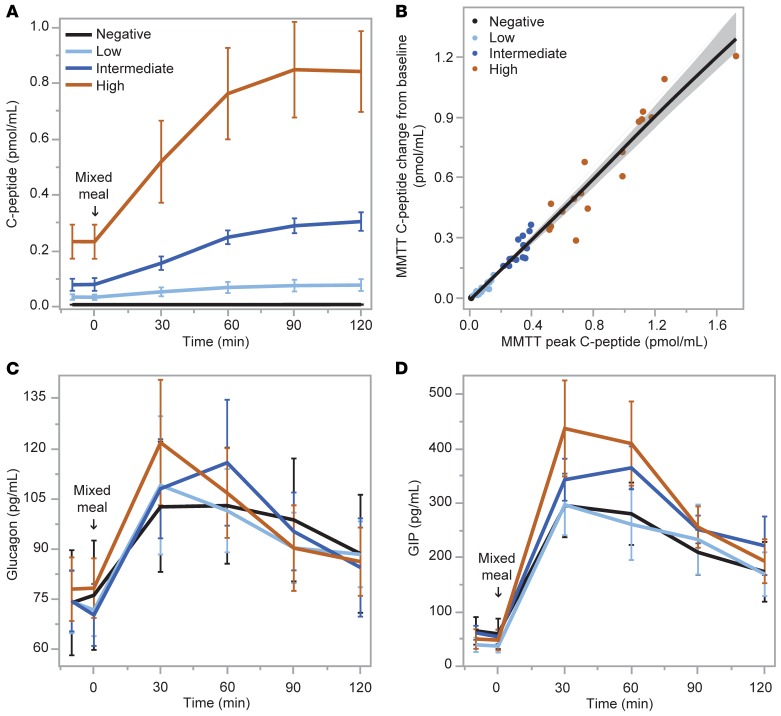
As expected from the study design, C-peptide responses during the MMTT increased significantly from no response in the negative group to incrementally greater responses in the low, intermediate, and high C-peptide groups (P < 0.0001; Figure 2A). This relationship was also strongly apparent when evaluated as a continuous variable (r = 0.99; P < 0.0001; Figure 2B). There was no relationship between glucagon responses and either categorical (Figure 2C) or continuous (not shown) C-peptide responses during the MMTT. No differences in glucagon-like peptide-1 (GLP-1) responses were seen across the groups or when C-peptide was assessed as a continuous variable (data not shown). In contrast, there was a relationship between peak C-peptide and the glucose-dependent insulinotropic polypeptide (GIP) response as both a categorical (P < 0.01; Figure 2D) and a continuous (r = 0.48; P = 0.0001) variable.
Figure 2. Mixed-meal tolerance test (MMTT).
(A and B) Serum C-peptide response to ingestion of a standardized liquid meal was different by group based on peak C-peptide level (negative, <0.007 pmol/mL [<0.02 ng/mL]; low, 0.017–0.200 pmol/mL [0.05–0.60 ng/mL]; intermediate, >0.200–0.400 pmol/mL [>0.60–1.20 ng/mL]; high, >0.400 pmol/mL [>1.20 ng/mL]), and by continuous relationship to peak C-peptide. (C and D) Plasma glucagon response was not different while plasma glucose-dependent insulinotropic polypeptide (GIP) response was different in response to meal ingestion by peak C-peptide level group. Data are means with error bars denoting 95% confidence intervals (CIs).
Glucose, C-peptide, proinsulin, and glucagon during the glucose-potentiated arginine test.
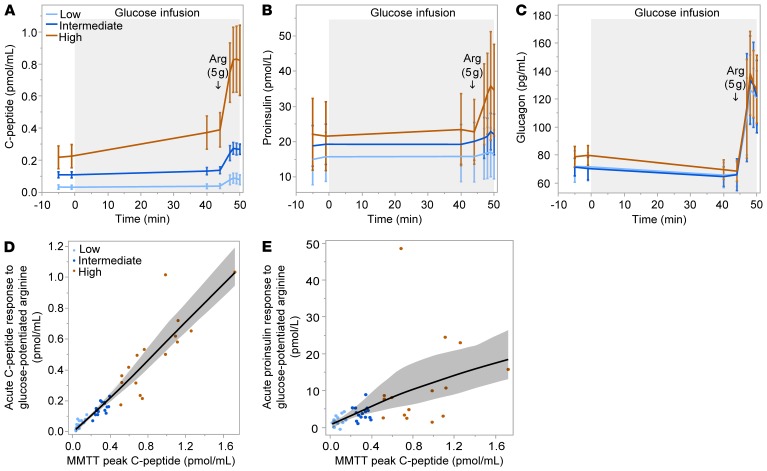
A glucose-potentiated arginine (GPA) test was conducted in the groups with detectable C-peptide as the gold-standard assessment of islet hormone secretion, since the β cell response to arginine is preserved after it is lost to glucose (18, 19), and arginine stimulation allows the α cell response to be simultaneously quantitated and related (20). Fasting glucose was greater in the low and intermediate than in the high C-peptide group (145 ± 30 vs. 148 ± 31 vs. 115 ± 0 mg/dL; P = 0.02). Across the low, intermediate, and high C-peptide groups, there was increasing fasting C-peptide (0.03 ± 0.02 vs. 0.11 ± 0.03 vs. 0.22 ± 0.13 pmol/mL; P < 0.0001; Figure 3A) and no difference in fasting proinsulin (Figure 3B). Thus, the fasting proinsulin/C-peptide ratio was highest in the low C-peptide group (0.56 ± 0.40 vs. 0.18 ± 0.08 vs. 0.14 ± 0.17; P < 0.0001). In response to the approximately 230-mg/dL hyperglycemic clamp, while the pre-arginine glucose was similar across groups (236 ± 10 vs. 233 ± 9 vs. 239 ± 16 mg/dL), the low and intermediate C-peptide groups did not exhibit a β cell response to the induction of hyperglycemia, whereas the high C-peptide group showed increases in both C-peptide (P < 0.001) and proinsulin (P = 0.01). All 3 groups demonstrated β cell responses to GPA (Figure 3, A and B), with increases across groups in both the acute C-peptide response (0.05 ± 0.03 vs. 0.15 ± 0.04 vs. 0.51 ± 0.26 pmol/mL; P < 0.0001) and the acute proinsulin response (0.002 ± 0.001 vs. 0.004 ± 0.002 vs. 0.012 ± 0.012 pmol/mL; P = 0.0001). The proinsulin secretory ratio (PISR), a measure of β cell stress derived from GPA stimulation (21), was not different across groups. The peak C-peptide during the MMTT was highly correlated with the acute C-peptide response to arginine stimulation (ACRarg: r = 0.96; P < 0.0001; Figure 3D) and less so with the acute proinsulin response to arginine (APRarg: r =0.65; P < 0.0001; Figure 3E). Although the GPA test was not conducted in the group with undetectable stimulated C-peptide during the MMTT, the y-intercept of the regression line relating ACRarg to the MMTT peak C-peptide equaled zero, supporting that undetectable stimulated C-peptide by one test is predictive for a negative response by the other test. The α cell response measured as acute glucose response to arginine (AGRarg) was not different across groups (Figure 3C), and there was no relationship between the MMTT peak C-peptide and the acute glucagon response (data not shown).
Figure 3. Glucose-potentiated arginine (GPA) test.
(A and B) Serum C-peptide and proinsulin responses to an approximately 230-mg/dL hyperglycemic clamp and to the injection of arginine after 45 minutes of glucose infusion were different by group based on MMTT peak C-peptide level. (C) Plasma glucagon responses to GPA were not different by group. (D and E) Relationship between the acute C-peptide and proinsulin responses to GPA and MMTT peak C-peptide. Data are means with error bars denoting 95% CIs.
Insulin sensitivity during the hyperinsulinemic-euglycemic clamp.
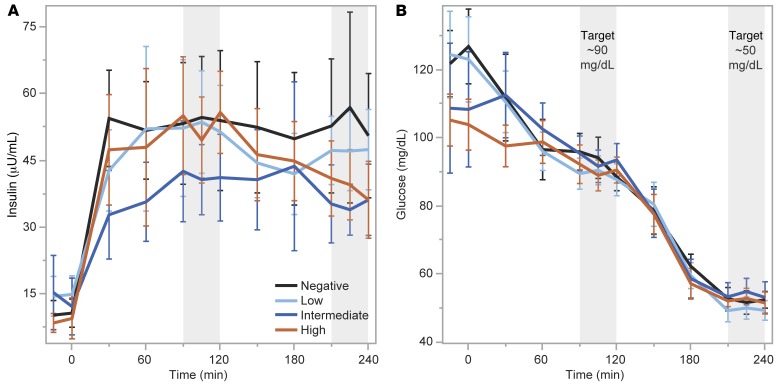
A hyperinsulinemic-euglycemic (EU) clamp was conducted as a gold-standard assessment of insulin sensitivity, with infusion of a stable glucose isotope in order to distinguish hepatic from peripheral insulin action using the isotopic dilution method (22). Insulin administration during the clamp resulted in similar levels of plasma insulin during EU across the negative, low, intermediate, and high C-peptide groups (53.0 ± 24.7 vs. 52.4 ± 18.3 vs. 41.3 ± 15.2 vs. 52.3 ± 16.5 μU/mL; Figure 4A), and there was no difference in plasma glucose during the last 30 minutes of EU across the groups (93 ± 6 vs. 89 ± 4 vs. 94 ± 6 vs. 90 ± 5 mg/dL; Figure 4B). No differences were seen across the negative, low, intermediate, and high C-peptide groups for total-body insulin sensitivity (SI; 0.100 ± 0.046 vs. 0.112 ± 0.065 vs. 0.136 ± 0.069 vs. 0.127 ± 0.079 × 10² dL/min/kg per μU/mL), peripheral insulin sensitivity (SIP; 0.052 ± 0.039 vs. 0.060 ± 0.058 vs. 0.073 ± 0.049 vs. 0.079 ± 0.048 × 10² dL/min/kg per μU/mL), or hepatic insulin sensitivity (SIH; 0.603 ± 0.172 vs. 0.660 ± 0.249 vs. 0.675 ± 0.272 vs. 0.659 ± 0.171.
Figure 4. Hyperinsulinemic-euglycemic (EU) followed by hypoglycemic (HYPO) clamp.
(A) Serum insulin levels were not statistically different across groups based on MMTT peak C-peptide levels during the EU or HYPO phase of testing. (B) Serum glucose levels were well matched across groups during the EU (~90 mg/dL) and HYPO (~50 mg/dL) phases of testing. Data are means with error bars denoting 95% CIs.
Counterregulatory responses during the hyperinsulinemic-hypoglycemic clamp.
A hyperinsulinemic-hypoglycemic (HYPO) clamp was performed as a gold-standard assessment of hormonal and glucose counterregulatory responses to insulin-induced hypoglycemia, with the infusion of stable glucose isotope enabling determination of the endogenous glucose production (EGP) response as the ultimate defense against the development of low blood glucose (23, 24).
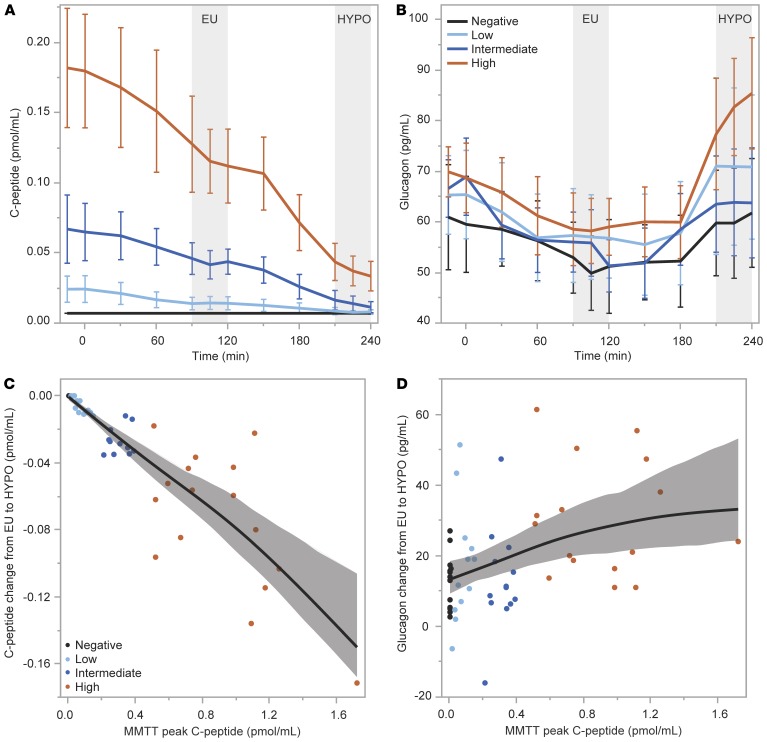
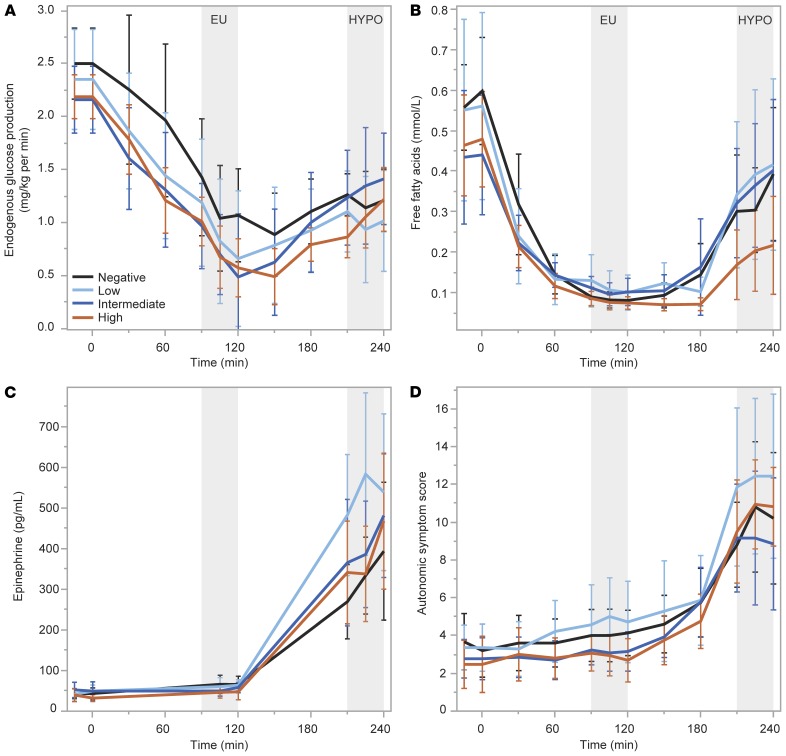
Plasma levels of insulin were not statistically different during HYPO across the negative, low, intermediate, and high C-peptide groups (52.8 ± 29.1 vs. 47.2 ± 14.3 vs. 35.1 ± 10.5 vs. 38.7 ± 13.6 μU/mL; Figure 4A), and there was no difference in plasma glucose during the last 30 minutes of HYPO across the groups (52 ± 4 vs. 50 ± 4 vs. 54 ± 6 vs. 52 ± 4 mg/dL; Figure 4B). Suppression of C-peptide from EU to HYPO was incrementally greater for the groups by increasing C-peptide production (0 ± 0 vs. –0.006 ± 0.005 vs. –0.027 ± 0.008 vs. –0.074 ± 0.042 pmol/mL; P < 0.0001; Figure 5A). The increase in glucagon from EU to HYPO was significantly different across the groups by increasing C-peptide production (12.9 ± 7.7 vs. 17.4 ± 16.7 vs. 13.0 ± 14.4 vs. 30.1 ± 16.2 pg/mL; P = 0.007; Figure 5B), with a clearly greater increase in glucagon on average in the high C-peptide group and overlap in the intermediate and low C-peptide groups. The peak C-peptide during the MMTT was highly associated with the suppression of C-peptide during HYPO (r = –0.95; P < 0.0001; Figure 5C) and weakly correlated with the glucagon response to HYPO (r = 0.40; P = 0.003; Figure 5D). No differences were seen across the negative, low, intermediate, and high C-peptide groups in the change from EU to HYPO for EGP (0.19 ± 0.71 vs. 0.33 ± 0.69 vs. 0.78 ± 0.56 vs. 0.50 ± 0.60 mg/kg/min; Figure 6A), free fatty acids (0.314 ± 0.267 vs. 0.329 ± 0.315 vs. 0.319 ± 0.242 vs. 0.165 ± 0.208 mmol/L; Figure 6B), epinephrine (380 ± 277 vs. 590 ± 309 vs. 445 ± 203 vs. 451 ± 300 pg/mL; Figure 6C), or autonomic symptoms (7.62 ± 5.61 vs. 9.02 ± 6.39 vs. 7.69 ± 5.44 vs. 10.04 ± 4.38; Figure 6D).
Figure 5. β Cell and α cell responses from the euglycemic (EU) to hypoglycemic (HYPO) clamp condition.
(A and B) Suppression of C-peptide and increase in glucagon were greater by group based on MMTT peak C-peptide level. (C and D) Relationships of the change in C-peptide and glucagon levels between the EU and HYPO conditions to MMTT peak C-peptide. Data are means with error bars denoting 95% CIs.
Figure 6. Glucose counterregulatory responses from the euglycemic (EU) to hypoglycemic (HYPO) clamp condition.
No differences were seen across groups based on MMTT peak C-peptide level for responses of counterregulatory endogenous glucose production (A), serum free fatty acids (B), plasma epinephrine (C), or autonomic symptom generation (D). Data are means with error bars denoting 95% CIs.
Glycemic control as assessed by continuous glucose monitoring.
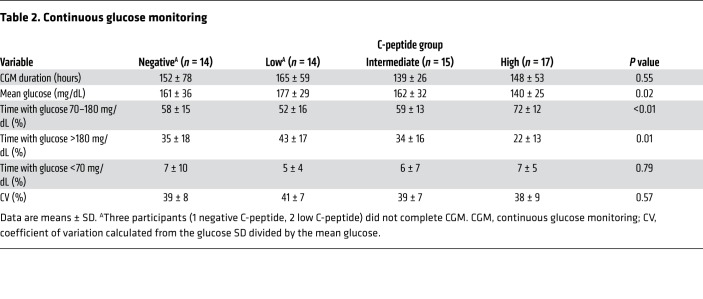
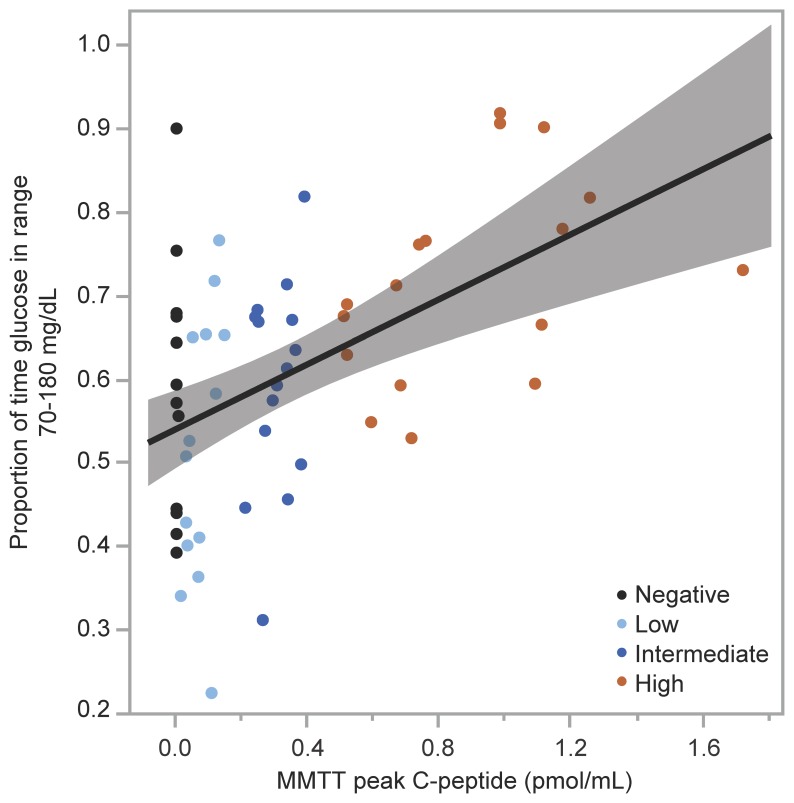
Participants from all 4 groups collected a similar amount of sensor glucose data from the 7-day continuous glucose monitoring (CGM) (Table 2). Mean glucose was lower, time in range 70–180 mg/dL was higher, and time with glucose greater than 180 mg/dL was lower in the group with the highest C-peptide (P < 0.05 for all comparisons; Table 2), while statistically significant differences were not seen across groups for glucose coefficient of variation (CV) or time with glucose less than 70 mg/dL. When evaluated as a continuous relationship with MMTT peak C-peptide, mean glucose was lower (r = –0.356; P = 0.005), time in range 70–180 mg/dL was higher (r = 0.456; P < 0.001), time with glucose greater than 180 mg/dL was lower (r = –0.376; P = 0.003), and glucose CV was lower (r = –0.258; P = 0.046) with increasing C-peptide, while no relationship was seen for time with glucose less than 70 mg/dL. No individual with MMTT peak C-peptide greater than 0.400 pmol/mL exhibited less than 50% time in range 70–180 mg/dL (Figure 7), and so the high C-peptide group appeared to be protected from experiencing suboptimal glycemic control (25).
Table 2. Continuous glucose monitoring.
Figure 7. Glucose time in range by MMTT peak C-peptide.
Relationship between proportion of glucose time in range of 70–180 mg/dL by CGM and MMTT peak C-peptide. All individuals in the high C-peptide group (MMTT peak C-peptide >0.400 pmol/mL) maintained greater than 50% time in the target glucose range.
Discussion
To our knowledge, our study is the first to comprehensively assess islet cell responsivity in people with T1D using gold-standard methods across the spectrum of detectable C-peptide production. The group with high peak C-peptide (>0.400 pmol/mL) during an MMTT exhibited lower fasting glucose (111 ± 31 mg/dL), hemoglobin A1c (6.8% ± 1.0%), and mean glucose (140 ± 25 mg/dL), and greater CGM-derived time in target range (72% ± 12%). Given that the high C-peptide group was considerably less often hyperglycemic based on CGM, the lack of difference in peripheral or hepatic insulin sensitivity across the groups supports that insulin resistance in T1D is not strongly related to hyperglycemia as suggested by others (26). The high C-peptide group was the only group who demonstrated β cell responsivity to glucose during the hyperglycemic clamp conducted during the GPA test, with measurable increases in C-peptide and proinsulin secretion. Furthermore, this group also demonstrated α cell responsivity to hypoglycemia, with greater increases in glucagon. Evaluation of peak C-peptide as a continuous variable also demonstrated a continuous association with these measures of islet cell responsivity, suggesting that any selected threshold remains somewhat arbitrary. Thus, while the group comparisons suggest that an MMTT peak C-peptide of >0.400 pmol/mL represents a minimum threshold of physiologic importance, the threshold of peak C-peptide >0.200 pmol/mL established by the DCCT as clinically meaningful may be explained by some degree of preserved islet cell responsivity in the intermediate C-peptide group, while lower levels are unlikely to contribute any meaningful benefit for glycemic control in T1D.
Our results support the concept that classification of residual C-peptide by peak MMTT response is consistent with the underlying β cell secretory capacity as demonstrated here using the GPA test. Functional β cell mass is most accurately determined in vivo from the β cell secretory capacity (27). The β cell secretory capacity is derived from glucose potentiation of insulin or C-peptide release in response to injection of a non-glucose insulin secretagogue, such as arginine or glucagon. Glucose potentiation serves to prime the β cells by inducing recruitment of secretory granules to a readily releasable pool that is subsequently released in response to membrane depolarization induced by arginine or glucagon (28). Because differences in glucose concentration affect the priming of β cells to acute stimulation by arginine, and the repeatability of the measured responses is superior with arginine compared with glucagon (29), we used a hyperglycemic clamp to create the same degree of glucose potentiation (~230 mg/dL [12.8 mmol/L]) of arginine-induced insulin secretion in all participants for the most accurate quantification of remaining functional β cell mass. The fact that the MMTT peak C-peptide was highly associated with the acute C-peptide response to GPA (r = 0.96; P < 0.0001; Figure 3D) indicates that mixed-meal stimulation may serve as a reasonable correlate to estimate functional β cell mass in T1D.
An increased proinsulin/C-peptide ratio was observed under fasting conditions in the low C-peptide group. This may be explained by greater exposure to hyperglycemia in this group, since studies in isolated human islets have shown that hyperglycemia decreases β cell insulin content and increases β cell secretion of proinsulin (30). Alternatively, this finding may represent transition within this group to becoming C-peptide negative, where proinsulin secretion may be detected in the absence of C-peptide (31, 32). However, there was no difference in the PISR when hyperglycemia was matched across groups during the hyperglycemic clamp, suggesting that proinsulin processing is not dependent on differences in low residual mass of functioning β cells. In addition, measures of insulin sensitivity at both the skeletal muscle and liver were not different across groups with residual C-peptide production compared with the negative group, and therefore differences within such low levels of β cell function do not seem to affect the insulin resistance of T1D (33).
We also show that residual β cell function does not affect the paradoxical increase in glucagon secretion during meal ingestion in T1D, since individuals across all levels of peak C-peptide response had the same postprandial glucagon levels as those with undetectable C-peptide, findings that confirm a recent smaller study (34, 35). Consistent with this result, there was also no difference in the acute glucagon response to GPA across groups of increasing residual C-peptide, and prior work demonstrated impaired suppression of glucagon secretion during an MMTT in youth with T1D within the first 2 years of diagnosis (36). Impaired glucagon suppression to hyperglycemia is also seen in individuals with early, asymptomatic T1D manifested by normal fasting but “diabetic”-range postprandial values (1). Moreover, each of these asymptomatic individuals with T1D also had markedly impaired functional β cell mass, with the acute insulin response to GPA approximately 25% of normal. In contrast, despite markedly impaired first-phase insulin secretion, antibody-positive relatives with nondiabetic oral glucose tolerance tests suppress glucagon appropriately in response to intravenous glucose. We recently reported that multiple-antibody-positive individuals before clinical diagnosis have a wide range of functional β cell mass (37). Thus, while clearly a continuum, the data to date suggest a model whereby loss of functional β cell mass associated with impaired glucagon suppression to hyperglycemia underlies the transition from pre- to post-clinical diagnosis. Then, as currently demonstrated, regardless of residual C-peptide secretion, once a diagnosis of T1D is established, the reduced functional β cell mass is no longer capable of exerting reciprocal regulation of glucagon secretion as occurs in nondiabetic individuals (38).
Curiously, there was a positive relationship between the peak C-peptide response and the glucose-dependent insulinotropic polypeptide (GIP) response during the MMTT. Although higher levels of GIP would be expected to augment β cell function and might contribute to the higher C-peptide, the much more robust relationship between the peak C-peptide response and the β cell secretory capacity evidences that in the low or negative C-peptide group the low/absent C-peptide is a result of β cell loss, not lack of incretin augmentation. A possible explanation for the correlation of peak C-peptide to the GIP response during the MMTT is the presence of mild pancreatic exocrine insufficiency in subjects with lower levels of C-peptide that could affect intestinal nutrient sensing and GIP secretion. Endogenous insulin exerts paracrine trophic effect on the exocrine pancreas via an insulo-acinar portal circulation (39), and several studies have demonstrated loss of pancreatic exocrine tissue volume in T1D (40, 41). Consistent with this, a positive relationship between residual C-peptide production and pancreatic exocrine function has been reported in T1D (42), although we did not measure pancreatic exocrine function in the present study.
Whereas α cell responsiveness to nutrient stimulation such as by amino acids remains intact as shown in the present study by MMTT and arginine administration, T1D is associated with the development of a selective defect in α cell glucagon secretion in response to hypoglycemia (43). This defect in α cell responsivity to low blood glucose may also be explained by the loss of the reciprocal regulation of glucagon secretion by neighboring β cells turning off insulin secretion (38). Although the glucagon response to hypoglycemia is already markedly impaired at the onset of T1D (44, 45), islets containing β cells might retain responsiveness of their α cells to hypoglycemia and contribute to the better glycemic control and avoidance of hypoglycemia associated with increasing amounts of residual C-peptide production. Prior studies examining this relationship have generated conflicting results, some finding a correlation between stimulated C-peptide levels and the glucagon response to insulin-induced hypoglycemia (46–48), and others finding no relationship (49, 50). Our results demonstrate a weak association of peak C-peptide from the MMTT and the glucagon response to insulin-induced hypoglycemia, supporting that a relationship does exist, but again is most significant with high levels of residual C-peptide. We did not, however, see any difference in the EGP response to hypoglycemia across groups of increasing C-peptide when compared with the negative C-peptide group, a result consistent with other studies reporting no difference in recovery from hypoglycemia in those with or without residual C-peptide (47), while another study did see modestly greater EGP during hypoglycemia in C-peptide–positive compared with –negative T1D (48). In this latter study, the epinephrine response was less in the C-peptide–negative versus the C-peptide–positive group (48), which likely accounts for the lower EGP response that becomes dependent on epinephrine when the glucagon response is impaired (51). Consistent with this premise, the present study identified no difference in the EGP response, while another study identified no difference in the rate of recovery from hypoglycemia (47) when epinephrine responses to hypoglycemia remained intact. Because the epinephrine response is intact at the onset of T1D (44, 45), the maintenance of the EGP response to defend against the development of low blood glucose appears most dependent on preservation of epinephrine and not low levels of glucagon secretion during hypoglycemia.
These results are important to inform the consideration of potential treatment targets for interventions such as immune modulation aimed at preserving or restoring β cell function in T1D. Studies that evidenced an association between less hypoglycemia and microvascular complications in people with T1D who had mixed meal–stimulated C-peptide in the range of our low C-peptide group (13) involved cohorts with hundreds of people, and the associations, while statistically significant, were very weak. Others have shown that children 3–6 years after diagnosis with stimulated C-peptide greater than 0.040 pmol/mL had significantly less severe hypoglycemic events and lower hemoglobin A1c than those with less or no residual secretion (52). Earlier work has shown a benefit of low levels of residual C-peptide in protecting individuals from the development of ketoacidosis in the setting of insulin deprivation when compared with those with negative C-peptide (53). In an analysis of T1D recipients of islet transplantation selected for experiencing severe hypoglycemia and having undetectable stimulated C-peptide before transplantation, low levels (<0.200 pmol/mL) of mixed meal–stimulated C-peptide following transplantation were associated with poor glycemic control and excessive glucose variability that improved significantly and in a continuous fashion with C-peptide ≥0.200 pmol/mL until insulin-independence was observed with C-peptide >1.000 pmol/mL (54). Consensus guidelines recommend considering β cell replacement therapy (currently available as islet or pancreas transplantation) in people with either negative or low C-peptide who are experiencing severe episodes of hypoglycemia complicated by hypoglycemia unawareness or marked glycemic lability (55). Such people are clearly not protected by the presence of low levels of residual C-peptide production, and so the goal of intervention is to restore β cell function with a C-peptide level of at least 0.200 pmol/mL (55). In the present study, while we were unable to pinpoint a threshold level of C-peptide as being physiologically distinct, the low C-peptide group did not behave any differently from the negative group. Clinically, significantly better glycemic control evidenced by CGM was observed in the group with high (>0.400 pmol/mL) mixed meal–stimulated C-peptide. Thus, our data are consistent with the idea that interventions targeting preservation or restoration of β cell function in T1D should aim for more than “low” levels of C-peptide production.
In conclusion, classification of residual C-peptide production by the peak value obtained during the MMTT is consistent with the underlying β cell secretory capacity. Although an MMTT peak C-peptide greater than 0.4 pmol/mL may indicate a threshold of physiologic importance for β cell responsivity to hyperglycemia and α cell responsivity to hypoglycemia, no amount of residual C-peptide in T1D tested in this study is associated with appropriate suppression of glucagon secretion during hyperglycemia. Importantly, even individuals with no residual C-peptide are capable of maintaining glucose counterregulation in defense against the development of low blood glucose as long as the epinephrine response to hypoglycemia is intact. Because our study was cross-sectional, we cannot determine whether the duration of sustained residual C-peptide production may affect these results. We are not able to comment on the mechanisms by which residual insulin secretion contributed to islet cell and counterregulatory responsiveness in the maintenance of glycemic control. Notwithstanding these limitations, the continuous relationship of MMTT peak C-peptide with measures of β and α cell function reported here precludes specification of a discrete level warranting further consideration as a potential requirement or treatment target for interventions aimed at preserving or restoring β cell function in T1D.
Methods
Participants.
Participants were recruited at 7 sites in the T1D Exchange Clinic Network. Eligible participants were aged 18–65 years, had been diagnosed with T1D between 6 months and 46 years, and had a disease duration of at least 2 years. Additional inclusion and exclusion criteria are provided in Supplemental Material (supplemental material available online with this article; https://doi.org/10.1172/JCI134057DS1).
Design.
Participants were grouped by C-peptide such that negative (<0.007 pmol/mL [<0.02 ng/mL]) would have undetectable stimulated C-peptide by the most sensitive assay available and low (0.017–0.200 pmol/mL [0.05–0.60 ng/mL]) would have detectable C-peptide by current standard assays but below the cutoff deemed clinically meaningful by the Diabetes Control and Complications Trial (DCCT) (10). The intermediate (>0.200–0.400 pmol/mL [>0.60–1.20 ng/mL]) and high (>0.400 pmol/mL [>1.20 ng/mL]) groups were assigned in order to understand the relevance of stimulated C-peptide above the DCCT threshold of 0.200 pmol/mL, and twice that level, respectively, to assure that we sampled across the distribution of C-peptide values based on approximately 5% of individuals with similar disease duration having random C-peptide levels greater than 0.400 pmol/mL (16). Because the nonfasting C-peptide is predictive of the peak C-peptide during the MMTT (16), participants were selected to proceed with the MMTT based on their screening level of nonfasting C-peptide with the goal of enrolling about 16 participants per group. Participant grouping for analysis was ultimately determined by the peak C-peptide during the MMTT. All metabolic testing was completed within a 30-day period.
Mixed-meal tolerance test.
Following a 10-hour overnight fast, an antecubital or forearm vein catheter was placed for blood sampling. After baseline blood sampling at t = –10 and –1 minutes, at t = 0, a standardized liquid meal (Boost High Protein; 6 mL/kg up to 360 mL) was consumed over a 5-minute period. Additional blood samples were taken at 30, 60, 90, and 120 minutes from the start of the meal (16).
Glucose-potentiated arginine test.
Following a 10-hour overnight fast, one catheter was placed in an antecubital vein for infusions, and another catheter was placed in a distal forearm or hand vein for blood sampling, with the hand placed in a heating pad to promote arterialization of the venous blood. After baseline blood sampling at t = –5 and –1 minutes, at t = 0, a hyperglycemic clamp (56) using a variable-rate infusion of 20% dextrose was performed to achieve a plasma glucose concentration of approximately 230 mg/dL. Blood samples were taken every 5 minutes, centrifuged, and measured at bedside with an automated glucose analyzer (YSI 2300; Yellow Springs Instruments) to adjust the infusion rate and achieve the desired plasma glucose concentration. At t = 40 and 44 minutes, blood samples were collected before the bolus infusion of 5 g of 10% arginine over 1 minute starting at t = 45. Additional blood samples were collected at t = 47, 48, 49, and 50 minutes (corresponding to 2, 3, 4, and 5 minutes after the infusion of arginine). Participants who were C-peptide negative did not undergo GPA testing.
Hyperinsulinemic-euglycemic–hypoglycemic clamp.
Participants either spent the night or arrived early in the morning following a 10-hour overnight fast to the clinical research center. One catheter was placed in an antecubital vein for infusions, and another catheter was placed in a distal forearm or hand vein for blood sampling, with the hand placed in a heating pad to promote arterialization of the venous blood. Participants were converted from subcutaneous insulin to a low-dose intravenous insulin infusion protocol to target a blood glucose of 81–115 mg/dL before testing. A baseline blood sample was collected for determination of the background enrichment of 6,6-2H2-glucose. At t = –120 minutes, a primed (5 mg/kg · fasting plasma glucose in mg/dL/90 given over 5 minutes) continuous (0.05 mg/kg/min for 355 minutes) infusion of 6,6-2H2-glucose (99% enriched; Cambridge Isotopes Laboratories) was administered to assess EGP before and during the induction of hyperinsulinemia. After blood sampling at t = –15 and –1 minutes, at t = 0 minutes a primed (1.6 mU/kg/min given over 10 minutes) continuous (0.8 mU/kg/min for 230 minutes) infusion of insulin was administered to produce hyperinsulinemia (57). Subsequently, a variable-rate infusion of 20% glucose enriched to ~2.0% with 6,6-2H2-glucose was administered according to the glycemic clamp technique to achieve a plasma glucose of ~90 mg/dL by ~60 minutes and maintained until ~120 minutes, after which the plasma glucose was allowed to fall to ~50 mg/dL by ~180 minutes and maintained until 240 minutes. Blood samples were taken every 5 minutes, centrifuged, and measured at the bedside with an automated glucose analyzer (YSI 2300) to adjust the glucose infusion rate and achieve the desired plasma glucose concentration. Additional blood samples were collected at t = 30, 60, 90, 105, 120, 150, 180, 210, 225, and 240 minutes for biochemical analysis. A questionnaire was administered every 30 minutes during the study to quantitate autonomic symptoms as the sum of scores ranging from 0 (none) to 5 (severe) for each of the following symptoms: anxiety, palpitations, sweating, tremor, hunger, and tingling (58).
Biochemical analysis.
Blood samples were collected into serum separator tubes (for glucose, free fatty acids, insulin, C-peptide, and proinsulin) and on ice into EDTA-containing tubes (for 6,6-2H2-glucose and epinephrine) with protease inhibitor cocktail containing dipeptidyl peptidase 4 inhibitor (for glucagon, glucagon-like peptide-1 [GLP-1], and glucose-dependent insulinotropic polypeptide [GIP]), centrifuged at 4°C, separated, and frozen at –80°C for subsequent analysis. Glucose was determined by the hexokinase enzymatic method and free fatty acids by enzymatic colorimetrics (Roche Modular P auto-analyzer; Roche Diagnostics). Insulin and C-peptide levels were measured by 2-site immuno-enzymometric assays (Tosoh 2000 auto-analyzer; Tosoh Bioscience). The C-peptide assay has a sensitivity level of detection at 0.007 pmol/mL (0.02 ng/mL), and the interassay coefficient of variation for low-level C-peptide controls is 3.2%. Proinsulin and glucagon were determined by double-antibody radioimmunoassays (Millipore). Total GLP-1 and total GIP were measured by ELISA (Millipore). Plasma epinephrine was measured by HPLC with electrochemical detection. Enrichment of 6,6-2H2-glucose was measured by gas chromatography–mass spectrometry.
Continuous glucose monitoring.
CGM was performed blinded as a validated assessment of glycemic control during the month of metabolic study. The CGM device (Dexcom G4 Platinum with 505 software; Dexcom) measures interstitial glucose every 5 minutes from a subcutaneously inserted sensor in the range of 40–400 mg/dL. Participants wore CGMs for up to 7 days, during which they were instructed to monitor their blood glucose at least 3 times daily and calibrate the CGM device at least every 12 hours.
Calculations.
Incremental responses from the MMTT for C-peptide, glucagon, GLP-1, and GIP were calculated as peak minus baseline values.
Acute C-peptide, proinsulin, and glucagon responses to arginine during the 230-mg/dL glucose clamp (ACRarg, APRarg, and AGRarg, respectively) were calculated as the peak of the 2-, 3-, 4-, and 5-minute values minus the mean of the pre-arginine values (56). The fasting proinsulin/C-peptide ratio was calculated as the molar concentration of proinsulin divided by the molar concentration of C-peptide (59). We also examined the proinsulin secretory ratio (PISR) calculated as the molar concentration of the acute proinsulin response to arginine divided by the acute C-peptide response to arginine (59, 60).
The rates of appearance (Ra) and disposal (Rd) of glucose during the hyperinsulinemic-euglycemic–hypoglycemic clamp were calculated using Steele’s non–steady-state equation modified for the use of stable isotopes, as previously described (22). EGP was calculated from the difference between the Ra of glucose in the plasma and the infusion rate of exogenous glucose. Total-body (SI) and peripheral (SIP) insulin sensitivity were calculated from the last 30 minutes of EU as previously described (61, 62). Hepatic insulin sensitivity was determined from the percentage suppression of EGP as SIH = 1 – (EGP2/EGP1), where EGP1 and EGP2 are the endogenous glucose production at baseline and during the last 30 minutes, respectively. The magnitude of each hormonal, incremental symptom and EGP response to hypoglycemia was assessed as the change in values from the last 30 minutes of euglycemia to the last 30 minutes of hypoglycemia.
CGM variables were calculated for all participants with a minimum of 72 hours of daytime (0800–2200 hours) and 24 hours of nighttime (2200–0800 hours) data. Interstitial glucose data were summarized to provide mean glucose, glucose standard deviation (SD), coefficient of variation (CV), and percent (%) time with glucose in range 70–180 mg/dL, <70 mg/dL, and >180 mg/dL (63). CV for glucose was calculated from the glucose SD divided by the mean glucose.
Statistics.
Data are given as means ± SD except where otherwise noted. Comparison of results across the C-peptide groups was performed with the Kruskal-Wallis test, and when significant differences at P ≤ 0.05 were found, pairwise comparisons between groups were performed using the Mann-Whitney U test. Linear regression, ANCOVA, and Spearman’s rank correlations were used to evaluate continuous relationships among the different measures of islet function and glucose counterregulation.
Study approval.
The institutional review board of each participating site (Children’s Hospital Colorado, Benaroya Research Institute, Children’s Mercy Hospital, University of Pennsylvania, Yale University, Florida Hospital, and Indiana University) approved the study, and all participants provided written informed consent to participate.
Author contributions
MRR, CEM, and CJG designed the study, researched data, contributed to the statistical analyses, and wrote and edited the manuscript. HTB and AY researched data, contributed to the statistical analyses, and wrote and edited the manuscript. WH, KJN, MAC, JLS, TSH, REP, and VNS contributed to the study design, researched data, and reviewed and edited the manuscript. KMM researched data and reviewed and edited the manuscript. MRR and CJG are the guarantors of this work, and as such, had full access to all the data in the study and take responsibility for the integrity of the data and accuracy of the data analysis.
Supplementary Material
Acknowledgments
We thank Asa Davis, who was instrumental to the operations of this study under the auspices of the T1D Exchange Biobank. We are indebted to Santica Marcovina of the University of Washington Northwest Lipid Metabolism and Diabetes Research Laboratories for performance of the biochemical and immunoassays, to Heather Collins of the University of Pennsylvania Diabetes Research Center Radioimmunoassay & Biomarkers Core for performance of the high-performance liquid chromatography, and to John Millar and Huong-Lan Nguyen of the University of Pennsylvania Institute for Diabetes, Obesity & Metabolism Metabolic Tracer Resource for performance of the gas chromatography–mass spectrometry. A full list of participating study sites and investigators is provided in Supplemental Acknowledgments online. This work was supported by a grant from the Leona M. and Harry B. Helmsley Charitable Trust, and by Public Health Service research grants UL1 TR001878 (University of Pennsylvania Center for Human Phenomic Science) and P30 DK19525 (University of Pennsylvania Diabetes Research Center).
Version 1. 01/02/2020
In-Press Preview
Version 2. 03/03/2020
Electronic publication
Version 3. 04/01/2020
Print issue publication
Footnotes
Conflict of interest: The authors have declared that no conflict of interest exists.
Copyright: © 2020, American Society for Clinical Investigation.
Reference information: J Clin Invest. 2020;130(4):1850–1862.https://doi.org/10.1172/JCI134057.
Contributor Information
Michael R. Rickels, Email: rickels@pennmedicine.upenn.edu.
Carmella Evans-Molina, Email: cevansmo@iu.edu.
Henry T. Bahnson, Email: tbahnson@benaroyaresearch.org.
Alyssa Ylescupidez, Email: AYlescupidez@benaroyaresearch.org.
Kristen J. Nadeau, Email: Kristen.Nadeau@childrenscolorado.org.
Wei Hao, Email: WHao@benaroyaresearch.org.
Mark A. Clements, Email: maclements@cmh.edu.
Jennifer L. Sherr, Email: jennifer.sherr@yale.edu.
Richard E. Pratley, Email: richard.pratley.md@flhosp.org.
Tamara S. Hannon, Email: tshannon@iu.edu.
Viral N. Shah, Email: viral.shah@ucdenver.edu.
Kellee M. Miller, Email: kmiller@Jaeb.org.
Carla J. Greenbaum, Email: cjgreen@benaroyaresearch.org.
References
- 1.Greenbaum CJ, Prigeon RL, D’Alessio DA. Impaired beta-cell function, incretin effect, and glucagon suppression in patients with type 1 diabetes who have normal fasting glucose. Diabetes. 2002;51(4):951–957. doi: 10.2337/diabetes.51.4.951. [DOI] [PubMed] [Google Scholar]
- 2.Keymeulen B, et al. Insulin needs after CD3-antibody therapy in new-onset type 1 diabetes. N Engl J Med. 2005;352(25):2598–2608. doi: 10.1056/NEJMoa043980. [DOI] [PubMed] [Google Scholar]
- 3.Klöppel G, Löhr M, Habich K, Oberholzer M, Heitz PU. Islet pathology and the pathogenesis of type 1 and type 2 diabetes mellitus revisited. Surv Synth Pathol Res. 1985;4(2):110–125. doi: 10.1159/000156969. [DOI] [PubMed] [Google Scholar]
- 4.Butler AE, Galasso R, Meier JJ, Basu R, Rizza RA, Butler PC. Modestly increased beta cell apoptosis but no increased beta cell replication in recent-onset type 1 diabetic patients who died of diabetic ketoacidosis. Diabetologia. 2007;50(11):2323–2331. doi: 10.1007/s00125-007-0794-x. [DOI] [PubMed] [Google Scholar]
- 5.Löhr M, Klöppel G. Residual insulin positivity and pancreatic atrophy in relation to duration of chronic type 1 (insulin-dependent) diabetes mellitus and microangiopathy. Diabetologia. 1987;30(10):757–762. doi: 10.1007/BF00275740. [DOI] [PubMed] [Google Scholar]
- 6.Meier JJ, Bhushan A, Butler AE, Rizza RA, Butler PC. Sustained beta cell apoptosis in patients with long-standing type 1 diabetes: indirect evidence for islet regeneration? Diabetologia. 2005;48(11):2221–2228. doi: 10.1007/s00125-005-1949-2. [DOI] [PubMed] [Google Scholar]
- 7.Yu MG, et al. Residual β cell function and monogenic variants in long-duration type 1 diabetes patients. J Clin Invest. 2019;129(8):3252–3263. doi: 10.1172/JCI127397. [DOI] [PMC free article] [PubMed] [Google Scholar]
- 8.Coppieters KT, et al. Demonstration of islet-autoreactive CD8 T cells in insulitic lesions from recent onset and long-term type 1 diabetes patients. J Exp Med. 2012;209(1):51–60. doi: 10.1084/jem.20111187. [DOI] [PMC free article] [PubMed] [Google Scholar]
- 9.[No authors listed] Effects of age, duration and treatment of insulin-dependent diabetes mellitus on residual beta-cell function: observations during eligibility testing for the Diabetes Control and Complications Trial (DCCT). The DCCT Research Group. J Clin Endocrinol Metab. 1987;65(1):30–36. doi: 10.1210/jcem-65-1-30. [DOI] [PubMed] [Google Scholar]
- 10.Steffes MW, Sibley S, Jackson M, Thomas W. Beta-cell function and the development of diabetes-related complications in the Diabetes Control and Complications Trial. Diabetes Care. 2003;26(3):832–836. doi: 10.2337/diacare.26.3.832. [DOI] [PubMed] [Google Scholar]
- 11.[No authors listed] Hypoglycemia in the Diabetes Control and Complications Trial. The Diabetes Control and Complications Trial Research Group. Diabetes. 1997;46(2):271–286. [PubMed] [Google Scholar]
- 12.[No authors listed] Effect of intensive therapy on residual beta-cell function in patients with type 1 diabetes in the Diabetes Control and Complications Trial. A randomized, controlled trial. The Diabetes Control and Complications Trial Research Group. Ann Intern Med. 1998;128(7):517–523. doi: 10.7326/0003-4819-128-7-199804010-00001. [DOI] [PubMed] [Google Scholar]
- 13.Lachin JM, McGee P, Palmer JP, DCCT/EDIC Research Group Impact of C-peptide preservation on metabolic and clinical outcomes in the Diabetes Control and Complications Trial. Diabetes. 2014;63(2):739–748. doi: 10.2337/db13-0881. [DOI] [PMC free article] [PubMed] [Google Scholar]
- 14.Wang L, Lovejoy NF, Faustman DL. Persistence of prolonged C-peptide production in type 1 diabetes as measured with an ultrasensitive C-peptide assay. Diabetes Care. 2012;35(3):465–470. doi: 10.2337/dc11-1236. [DOI] [PMC free article] [PubMed] [Google Scholar]
- 15.Oram RA, et al. The majority of patients with long-duration type 1 diabetes are insulin microsecretors and have functioning beta cells. Diabetologia. 2014;57(1):187–191. doi: 10.1007/s00125-013-3067-x. [DOI] [PMC free article] [PubMed] [Google Scholar]
- 16.Davis AK, et al. Prevalence of detectable C-peptide according to age at diagnosis and duration of type 1 diabetes. Diabetes Care. 2015;38(3):476–481. doi: 10.2337/dc14-1952. [DOI] [PubMed] [Google Scholar]
- 17.Rickels MR, et al. Improvement in insulin sensitivity after human islet transplantation for type 1 diabetes. J Clin Endocrinol Metab. 2013;98(11):E1780–E1785. doi: 10.1210/jc.2013-1764. [DOI] [PMC free article] [PubMed] [Google Scholar]
- 18.Ganda OP, et al. Differential sensitivity to β-cell secretagogues in “early,” type I diabetes mellitus. Diabetes. 1984;33(6):516–521. doi: 10.2337/diab.33.6.516. [DOI] [PubMed] [Google Scholar]
- 19.Rickels MR, Naji A, Teff KL. Acute insulin responses to glucose and arginine as predictors of β-cell secretory capacity in human islet transplantation. Transplantation. 2007;84(10):1357–1360. doi: 10.1097/01.tp.0000287595.16442.a7. [DOI] [PubMed] [Google Scholar]
- 20.Rickels MR, Mueller R, Teff KL, Naji A. β-Cell secretory capacity and demand in recipients of islet, pancreas, and kidney transplants. J Clin Endocrinol Metab. 2010;95(3):1238–1246. doi: 10.1210/jc.2009-2289. [DOI] [PMC free article] [PubMed] [Google Scholar]
- 21.Sheikh S, et al. Reduced β-cell secretory capacity in pancreatic-insufficient, but not pancreatic-sufficient, cystic fibrosis despite normal glucose tolerance. Diabetes. 2017;66(1):134–144. doi: 10.2337/db16-0394. [DOI] [PMC free article] [PubMed] [Google Scholar]
- 22.Rickels MR, et al. Insulin sensitivity index in type 1 diabetes and following human islet transplantation: comparison of the minimal model to euglycemic clamp measures. Am J Physiol Endocrinol Metab. 2014;306(10):E1217–E1224. doi: 10.1152/ajpendo.00667.2013. [DOI] [PMC free article] [PubMed] [Google Scholar]
- 23.Bernroider E, et al. The role of intramyocellular lipids during hypoglycemia in patients with intensively treated type 1 diabetes. J Clin Endocrinol Metab. 2005;90(10):5559–5565. doi: 10.1210/jc.2004-1756. [DOI] [PubMed] [Google Scholar]
- 24.Rickels MR, et al. Restoration of glucose counterregulation by islet transplantation in long-standing type 1 diabetes. Diabetes. 2015;64(5):1713–1718. doi: 10.2337/db14-1620. [DOI] [PMC free article] [PubMed] [Google Scholar]
- 25.Battelino T, et al. Clinical targets for continuous glucose monitoring data interpretation: recommendations from the international consensus on time in range. Diabetes Care. 2019;42(8):1593–1603. doi: 10.2337/dci19-0028. [DOI] [PMC free article] [PubMed] [Google Scholar]
- 26.Bergman BC, et al. Features of hepatic and skeletal muscle insulin resistance unique to type 1 diabetes. J Clin Endocrinol Metab. 2012;97(5):1663–1672. doi: 10.1210/jc.2011-3172. [DOI] [PMC free article] [PubMed] [Google Scholar]
- 27.Robertson RP, et al. Assessment of β-cell mass and α- and β-cell survival and function by arginine stimulation in human autologous islet recipients. Diabetes. 2015;64(2):565–572. doi: 10.2337/db14-0690. [DOI] [PMC free article] [PubMed] [Google Scholar]
- 28.Henquin JC. The dual control of insulin secretion by glucose involves triggering and amplifying pathways in β-cells. Diabetes Res Clin Pract. 2011;93(suppl 1):S27–S31. doi: 10.1016/S0168-8227(11)70010-9. [DOI] [PubMed] [Google Scholar]
- 29.Robertson RP, et al. Arginine is preferred to glucagon for stimulation testing of β-cell function. Am J Physiol Endocrinol Metab. 2014;307(8):E720–E727. doi: 10.1152/ajpendo.00149.2014. [DOI] [PMC free article] [PubMed] [Google Scholar]
- 30.Hostens K, Ling Z, Van Schravendijk C, Pipeleers D. Prolonged exposure of human β-cells to high glucose increases their release of proinsulin during acute stimulation with glucose or arginine. J Clin Endocrinol Metab. 1999;84(4):1386–1390. doi: 10.1210/jcem.84.4.5621. [DOI] [PubMed] [Google Scholar]
- 31.Steenkamp DW, Cacicedo JM, Sahin-Efe A, Sullivan C, Sternthal E. Preserved proinsulin secretion in long-standing type 1 diabetes. Endocr Pract. 2017;23(12):1387–1393. doi: 10.4158/EP-2017-0009. [DOI] [PubMed] [Google Scholar]
- 32.Sims EK, et al. Proinsulin secretion is a persistent feature of type 1 diabetes. Diabetes Care. 2019;42(2):258–264. doi: 10.2337/dc17-2625. [DOI] [PMC free article] [PubMed] [Google Scholar]
- 33.Greenbaum CJ. Insulin resistance in type 1 diabetes. Diabetes Metab Res Rev. 2002;18(3):192–200. doi: 10.1002/dmrr.291. [DOI] [PubMed] [Google Scholar]
- 34.Thivolet C, Marchand L, Chikh K. Inappropriate glucagon and GLP-1 secretion in individuals with long-standing type 1 diabetes: effects of residual C-peptide. Diabetologia. 2019;62(4):593–597. doi: 10.1007/s00125-018-4804-y. [DOI] [PubMed] [Google Scholar]
- 35.Sherr JL, Ghazi T, Wurtz A, Rink L, Herold KC. Characterization of residual β cell function in long-standing type 1 diabetes. Diabetes Metab Res Rev. 2014;30(2):154–162. doi: 10.1002/dmrr.2478. [DOI] [PubMed] [Google Scholar]
- 36.Sherr J, et al. Evolution of abnormal plasma glucagon responses to mixed-meal feedings in youth with type 1 diabetes during the first 2 years after diagnosis. Diabetes Care. 2014;37(6):1741–1744. doi: 10.2337/dc13-2612. [DOI] [PMC free article] [PubMed] [Google Scholar]
- 37.Hao W, Woodwyk A, Beam C, Bahnson HT, Palmer JP, Greenbaum CJ. Assessment of β cell mass and function by airmax and intravenous glucose in high-risk subjects for type 1 diabetes. J Clin Endocrinol Metab. 2017;102(12):4428–4434. doi: 10.1210/jc.2017-01713. [DOI] [PMC free article] [PubMed] [Google Scholar]
- 38.Cooperberg BA, Cryer PE. Insulin reciprocally regulates glucagon secretion in humans. Diabetes. 2010;59(11):2936–2940. doi: 10.2337/db10-0728. [DOI] [PMC free article] [PubMed] [Google Scholar]
- 39.Williams JA, Goldfine ID. The insulin-pancreatic acinar axis. Diabetes. 1985;34(10):980–986. doi: 10.2337/diab.34.10.980. [DOI] [PubMed] [Google Scholar]
- 40.Campbell-Thompson M, Rodriguez-Calvo T, Battaglia M. Abnormalities of the exocrine pancreas in type 1 diabetes. Curr Diab Rep. 2015;15(10):79. doi: 10.1007/s11892-015-0653-y. [DOI] [PMC free article] [PubMed] [Google Scholar]
- 41.Augustine P, et al. Pancreas size and exocrine function is decreased in young children with recent-onset Type 1 diabetes. Diabet Med. doi: 10.1111/dme.13987. doi: 10.1111/dme.13987. [published online ahead of print May 15, 2019]. [DOI] [PubMed] [Google Scholar]
- 42.Cavalot F, et al. Pancreatic elastase-1 in stools, a marker of exocrine pancreas function, correlates with both residual beta-cell secretion and metabolic control in type 1 diabetic subjects. Diabetes Care. 2004;27(8):2052–2054. doi: 10.2337/diacare.27.8.2052. [DOI] [PubMed] [Google Scholar]
- 43.Gerich JE, Langlois M, Noacco C, Karam JH, Forsham PH. Lack of glucagon response to hypoglycemia in diabetes: evidence for an intrinsic pancreatic alpha cell defect. Science. 1973;182(4108):171–173. doi: 10.1126/science.182.4108.171. [DOI] [PubMed] [Google Scholar]
- 44.Arbelaez AM, et al. Blunted glucagon but not epinephrine responses to hypoglycemia occurs in youth with less than 1 yr duration of type 1 diabetes mellitus. Pediatr Diabetes. 2014;15(2):127–134. doi: 10.1111/pedi.12070. [DOI] [PMC free article] [PubMed] [Google Scholar]
- 45.Siafarikas A, Johnston RJ, Bulsara MK, O’Leary P, Jones TW, Davis EA. Early loss of the glucagon response to hypoglycemia in adolescents with type 1 diabetes. Diabetes Care. 2012;35(8):1757–1762. doi: 10.2337/dc11-2010. [DOI] [PMC free article] [PubMed] [Google Scholar]
- 46.Fukuda M, et al. Correlation between minimal secretory capacity of pancreatic beta-cells and stability of diabetic control. Diabetes. 1988;37(1):81–88. doi: 10.2337/diab.37.1.81. [DOI] [PubMed] [Google Scholar]
- 47.Madsbad S, et al. Hormonal, metabolic and cardiovascular responses to hypoglycaemia in Type 1 (insulin-dependent) diabetes with and without residual B cell function. Diabetologia. 1982;23(6):499–503. doi: 10.1007/BF00254298. [DOI] [PubMed] [Google Scholar]
- 48.Zenz S, et al. Impact of C-peptide status on the response of glucagon and endogenous glucose production to induced hypoglycemia in T1DM. J Clin Endocrinol Metab. 2018;103(4):1408–1417. doi: 10.1210/jc.2017-01836. [DOI] [PubMed] [Google Scholar]
- 49.Sjöberg S, Ahrén B, Bolinder J. Residual insulin secretion is not coupled to a maintained glucagon response to hypoglycaemia in long-term type 1 diabetes. J Intern Med. 2002;252(4):342–351. doi: 10.1046/j.1365-2796.2002.01043.x. [DOI] [PubMed] [Google Scholar]
- 50.Sherr J, et al. Lack of association between residual insulin production and glucagon response to hypoglycemia in youth with short duration of type 1 diabetes. Diabetes Care. 2013;36(6):1470–1476. doi: 10.2337/dc12-1697. [DOI] [PMC free article] [PubMed] [Google Scholar]
- 51.Rizza RA, Cryer PE, Gerich JE. Role of glucagon, catecholamines, and growth hormone in human glucose counterregulation. Effects of somatostatin and combined α- and β-adrenergic blockade on plasma glucose recovery and glucose flux rates after insulin-induced hypoglycemia. J Clin Invest. 1979;64(1):62–71. doi: 10.1172/JCI109464. [DOI] [PMC free article] [PubMed] [Google Scholar]
- 52.Sørensen JS, et al. Residual β-cell function 3-6 years after onset of type 1 diabetes reduces risk of severe hypoglycemia in children and adolescents. Diabetes Care. 2013;36(11):3454–3459. doi: 10.2337/dc13-0418. [DOI] [PMC free article] [PubMed] [Google Scholar]
- 53.Madsbad S, et al. The significance of the portal insulin secretion in insulin dependent patients with residual β-cell function: a safeguard against hormonal and metabolic derangement. Clin Endocrinol (Oxf) 1982;16(6):605–613. doi: 10.1111/j.1365-2265.1982.tb03177.x. [DOI] [PubMed] [Google Scholar]
- 54.Brooks AM, Oram R, Home P, Steen N, Shaw JA. Demonstration of an intrinsic relationship between endogenous C-peptide concentration and determinants of glycemic control in type 1 diabetes following islet transplantation. Diabetes Care. 2015;38(1):105–112. doi: 10.2337/dc14-1656. [DOI] [PubMed] [Google Scholar]
- 55.Rickels MR, et al. Defining outcomes for β-cell replacement therapy in the treatment of diabetes: a consensus report on the Igls Criteria From the IPITA/EPITA opinion leaders workshop. Transplantation. 2018;102(9):1479–1486. doi: 10.1097/TP.0000000000002158. [DOI] [PMC free article] [PubMed] [Google Scholar]
- 56.Ward WK, Halter JB, Beard JC, Porte D. Adaptation of B and A cell function during prolonged glucose infusion in human subjects. Am J Physiol. 1984;246(5 pt 1):E405–E411. doi: 10.1152/ajpendo.1984.246.5.E405. [DOI] [PubMed] [Google Scholar]
- 57.Ang M, Meyer C, Brendel MD, Bretzel RG, Linn T. Magnitude and mechanisms of glucose counterregulation following islet transplantation in patients with type 1 diabetes suffering from severe hypoglycaemic episodes. Diabetologia. 2014;57(3):623–632. doi: 10.1007/s00125-013-3120-9. [DOI] [PubMed] [Google Scholar]
- 58.Towler DA, Havlin CE, Craft S, Cryer P. Mechanism of awareness of hypoglycemia. Perception of neurogenic (predominantly cholinergic) rather than neuroglycopenic symptoms. Diabetes. 1993;42(12):1791–1798. doi: 10.2337/diab.42.12.1791. [DOI] [PubMed] [Google Scholar]
- 59.Loopstra-Masters RC, Haffner SM, Lorenzo C, Wagenknecht LE, Hanley AJ. Proinsulin-to-C-peptide ratio versus proinsulin-to-insulin ratio in the prediction of incident diabetes: the Insulin Resistance Atherosclerosis Study (IRAS) Diabetologia. 2011;54(12):3047–3054. doi: 10.1007/s00125-011-2322-2. [DOI] [PubMed] [Google Scholar]
- 60.Guldstrand M, Ahrén B, Adamson U. Improved beta-cell function after standardized weight reduction in severely obese subjects. Am J Physiol Endocrinol Metab. 2003;284(3):E557–E565. doi: 10.1152/ajpendo.00325.2002. [DOI] [PubMed] [Google Scholar]
- 61.Beard JC, Bergman RN, Ward WK, Porte D. The insulin sensitivity index in nondiabetic man. Correlation between clamp-derived and IVGTT-derived values. Diabetes. 1986;35(3):362–369. doi: 10.2337/diab.35.3.362. [DOI] [PubMed] [Google Scholar]
- 62.Bergman RN, Prager R, Volund A, Olefsky JM. Equivalence of the insulin sensitivity index in man derived by the minimal model method and the euglycemic glucose clamp. J Clin Invest. 1987;79(3):790–800. doi: 10.1172/JCI112886. [DOI] [PMC free article] [PubMed] [Google Scholar]
- 63.Danne T, et al. International consensus on use of continuous glucose monitoring. Diabetes Care. 2017;40(12):1631–1640. doi: 10.2337/dc17-1600. [DOI] [PMC free article] [PubMed] [Google Scholar]
Associated Data
This section collects any data citations, data availability statements, or supplementary materials included in this article.


