

Summary
Although autophagy is being pursued as a therapeutic target in clinical oncology trials, its effects on metastasis, the principal cause of cancer mortality, remain unclear. Here, we utilize mammary cancer models to temporally delete essential autophagy regulators during carcinoma progression. Though genetic ablation of autophagy strongly attenuates primary mammary tumor growth, impaired autophagy promotes spontaneous metastasis and enables the outgrowth of disseminated tumor cells into overt macro-metastases. Transcriptomic analysis reveals autophagy-deficiency elicits a subpopulation of otherwise luminal tumor cells exhibiting basal differentiation traits, which is reversed upon preventing accumulation of the autophagy cargo receptor, Neighbor to BRCA1 (NBR1). Furthermore, pharmacological and genetic induction of autophagy suppresses pro-metastatic differentiation and metastatic outgrowth. Analysis of human breast cancer data reveals that autophagy gene expression inversely correlates with pro-metastatic differentiation signatures and predicts overall and distant metastasis-free survival. Overall, these findings highlight autophagy-dependent control of NBR1 as a key determinant of metastatic progression.
Keywords: Autophagy, Metastasis, NBR1, Keratin14, TP63, Rubicon, Chloroquine, Breast cancer
Graphical Abstract

eTOC Blurb
Autophagy is a therapeutic target in cancer, but its role during metastasis remains incompletely understood. In mammary cancer models, Marsh et al. demonstrate that autophagic degradation of NBR1 suppresses metastatic outgrowth by restricting an aggressive, basal subpopulation of tumor cells. Enforced autophagy is a potential therapeutic approach to prevent metastases.
Introduction
Autophagy is a tightly controlled lysosomal degradation and recycling pathway critical for cellular homeostasis and adaptation to diverse cancer-relevant stressors. In cancer, autophagy has multi-faceted roles in primary tumor initiation and progression. While genetic evidence corroborates that autophagy can serve tumor suppressor functions, autophagy also promotes the survival and metabolic fitness of established tumors (Guo et al., 2013; Rao et al., 2014; Rosenfeldt et al., 2013; Takamura et al., 2011; Wei et al., 2011). This has generated significant interest in autophagy inhibition as a therapeutic strategy in cancer; recently, anti-malarials, such as hydroxychloroquine (HCQ), which impair autophagy by disrupting lysosomal function, have been repurposed as autophagy inhibitors in multiple clinical trials for the treatment of advanced cancers (Chude and Amaravadi, 2017). While early studies utilizing HCQ have shown initial therapeutic efficacy against primary tumors, the effects of autophagy inhibition on metastatic progression remain poorly understood.
During the highly complex multi-step process of metastasis, pre-clinical data suggests that metastatic colonization represents a key rate-limiting step in this cascade. Metastatic colonization includes the ability of disseminated tumor cells (DTCs) to regain aggressive growth characteristics in the metastatic microenvironment, ultimately resulting in the outgrowth of micro-metastases into overt macro-metastases (Cameron et al., 2000; Luzzi et al., 1998). In recent years, numerous in vitro studies implicate autophagy in supporting pro-metastatic behavior of tumor cells such as adhesionindependent survival, metabolic adaptation, and cell invasion and motility (Fung et al., 2008; Galavotti et al., 2013; Kenific et al., 2016; Rabinowitz and White, 2010). These diverse functions of autophagy are mediated, at least in part, by autophagy cargo receptors (ACRs; i.e., P62, NBR1, OPTN, NIX), which bind and specify particular cytosolic proteins and organelles for autophagic degradation; during this process, ACRs are concurrently degraded via autophagy (Zaffagnini and Martens, 2016). Recent work demonstrates that cytosolic accumulation of ACRs in autophagy-deficient cells can elicit pro-tumorigenic functions by serving as scaffolds that drive tumor-promoting signaling pathways. For example, P62 accumulation promotes the growth of autophagy-deficient primary tumors by regulating NF-κB signaling (Wei et al., 2014) and anti-oxidant pathways downstream of the NRF2-KEAP1 axis to overcome stressors associated with rapidly expanding primary tumors (Jain et al., 2010). Whether autophagic regulation of specific ACRs similarly impacts metastatic outgrowth in vivo remains largely unknown.
In the current study, we utilize genetic models to temporally delete essential autophagy genes during mammary tumor progression, which illuminates an unexpected role for tumor cell autophagy in restricting metastatic outgrowth. Impaired autophagy in both primary tumors and DTCs results in the accumulation of NBR1, which is specifically required for the development of an aggressive subpopulation of tumor cells expressing high levels of basal epithelial markers, including ΔN-TP63 and Keratin14 (CK14). NBR1-induced upregulation of basal traits in autophagy-deficient tumor cells elicits an increased propensity for spontaneous metastasis and macro-metastatic outgrowth of DTCs. Furthermore, pharmacological and genetic autophagy induction suppresses development of CK14+ cells and metastatic outgrowth of DTCs. Taken together, these findings highlight the opposing functions of tumor cell autophagy on primary tumor growth versus metastasis and uncover the autophagy cargo receptor NBR1 as a potential therapeutic target to combat metastatic progression.
Results
Tumor Cell Autophagy Restricts the Metastatic Outgrowth of DTCs
To address the role of tumor cell autophagy during metastatic outgrowth, we generated a transplantable, syngeneic MMTV-PyMT tumor model enabling tamoxifen-inducible deletion of floxed essential autophagy genes, Atg12 and Atg5, by Cre-recombinase, CAG-CreER (Figure S1A). Upon isolating primary tumor epithelium from compound transgenic donors (MMTV-PyMT;CAG-CreER;Atg12F/F or MMTV-PyMT;CAG-CreER;Atg5F/F), we confirmed efficient Atg deletion and autophagy inhibition ex vivo upon treatment with 4-hydroxytamoxifen (4-OHT). Cells lacking ATG5 or ATG12 demonstrated reduced levels of LC3-II, a marker of autophagosomes, and the accumulation of ACRs, including NBR1 and P62, consistent with impaired turnover of autophagic substrates (Figure S1B).
To model the outgrowth of DTCs into overt macro-metastases, we transplanted autophagy-competent, donor PyMT tumor cells into naïve, immunocompetent recipient mice via the systemic circulation and allowed seeding of the lung for one week. Animals were then administered tamoxifen for DTC-specific ablation of Atg12 or Atg5 and metastatic outgrowth was allowed to progress for an additional three weeks (Figure 1A). We observed a significant increase in the size of metastatic lesions resulting from Atg12 or Atg5 deletion (ATG12KO and ATG5KO) compared to autophagy-competent controls (ATG12F/F and ATG5F/F), whereas the total number of metastatic nodules remained unchanged (Figures 1B, 1C, and S1C). Macro-dissected metastases continued to exhibit impaired autophagy, evidenced by decreased levels of the ATG12-ATG5 complex, reduced LC3-II (Figure 1D) and P62 accumulation was observed throughout metastatic cells in situ (Figure 1E). Upon segregating the metastatic lesions into groups based on histological nodule area and classifying them as micro-, intermediate, and macro-metastases, animals bearing ATG12KO and ATG5KO tumor cells had significantly increased numbers of macro-metastases and corresponding decreased numbers of micro-metastases compared to autophagy-competent controls, further supporting that autophagy inhibition promotes the outgrowth of macro-metastatic lesions (Figures 1F and 1G). Importantly, in vivo administration of tamoxifen and consequent Cre activation did not impact the size or number of metastatic lesions in animals bearing PyMT cells with wild-type alleles of Atg12 (MMTV-PyMT;CAG-CreER;Atg12+/+) (Figure S1D and S1E).
Figure 1. Tumor Cell Autophagy Restricts Macro-metastatic Outgrowth of DTCs.

(A) Schematic of experimental design.
(B) Representative hematoxylin and eosin staining of lungs bearing metastases for indicated groups. Scale bar = 1 mm.
(C) Quantification of average metastatic size for indicated genotypes. Two pooled independent experiments. ATG12F/F (n=7 mice), ATG12KO (n=8), ATG5F/F (n=8), ATG5KO (n=9).
(D) Immunoblot of macro-dissected metastases from indicated genotypes at endpoint for the ATG12–5 complex, LC3 and GAPDH.
(E) Left, representative immunofluorescent staining of P62 (green) and nuclei (Hoechst, blue). Scale bar = 10 μm. Right, quantification of P62 aggregates normalized to number of cells. Number of metastases analyzed, ATG12F/F (n=34), ATG12KO (n=34).
(F) Histological groups of Micro- (1), Intermediate (2), and Macro- (3) metastatic lesions. Scale bar = 100 μm.
(G) Quantification of percent total metastases within indicated histological groups in (C) at endpoint.
(H) Representative immunofluorescent staining of phospho-histone H3 positive metastatic tumor cells (pHH3, red) and nuclei (Hoechst, blue). Metastases outlined with dashed line (yellow). Scale bar = 20 μm.
(I) Quantification of nuclei positive for pHH3 normalized to metastatic lesion area for indicated timepoints. N=3/genotype.
(J) Quantification of average metastatic size for indicated shRNAs in R221a and 4T1 cells. R221a, three pooled independent experiments. shCTRL (n=20 mice), shATG7 (n=19). 4T1, one experiment. shCTRL (n=7 mice), shATG12 (n=8).
Statistics: t-test (C)(E)(G, Micro-ATG5, Macro-ATG12, Macro-ATG5)(I)(J, 4T1), Mann-Whitney (G, Micro-ATG12)(J, R221a). Data are represented by mean ± S.E.M. Each dot represents 1 animal. ns = not significant. *p<0.05, **p<0.01, ***p<0.001. See also Figure S1.
To determine whether autophagy ablation confers continuous or acute effects on DTC outgrowth, we analyzed tumor cell proliferation by immunostaining for phosphor-Histone H3 (pHH3) at 1-week and 2-weeks post-Atg12 recombination in vivo. We observed an initial increase in tumor cell proliferation in ATG12KO relative to ATG12F/F metastases at 1-week post-recombination (Figures 1H, 1I, and S1F). Notably, these effects were no longer significant at 2-weeks post-recombination, suggesting that the ability of autophagy to suppress proliferation was limited to the initial stages of metastatic outgrowth in this model. Similar effects on macro-metastatic outgrowth were observed upon inhibiting autophagy in two additional mammary cancer models; stable knockdown of essential ATGs in the PyMT cell line R221a (Martin et al., 2008) and the mammary cancer cell line 4T1 both resulted in significantly increased size of metastatic lesions after inoculation into the systemic circulation of syngeneic hosts (Figure 1J and S1G). Taken together, these findings illuminate a previously unappreciated role for tumor cell autophagy in restricting the early proliferation and metastatic outgrowth of DTCs following their seeding at foreign tissue sites.
Tumor Cell Autophagy Restricts Basal Differentiation Transcriptional Programs During Metastasis
Given these unexpected findings that autophagy suppressed, rather than promoted, metastatic outgrowth, we assessed the impact of autophagy ablation on the mRNA expression profile of DTCs. To isolate metastatic cells from the lung, we prepared primary PyMT cells from animals harboring GFP-tagged LC3 (GFP-LC3) as well as MMTV-PyMT;CAG-CreER;Atg12F/F alleles and generated GFP+ ATG12F/F and ATG12KO metastases in secondary hosts as described previously. We prepared single-cell suspensions from lungs of PyMT bearing animals, isolated viable ATG12F/F and ATG12KO tumor cells by FACS (GFP+/MHC-I+/CD45−/CD31−/Ter119−) and processed them for RNA-sequencing (Figure S2A). We identified 301 significantly differentially expressed genes (p<0.005) between ATG12F/F and ATG12KO metastases (Figure 2A); upregulation of selected candidates of the top differentially expressed genes were validated by qRT-PCR (Figure S2B). Gene set enrichment analyses revealed autophagy-deficiency in the metastatic site to be negatively associated with mammary luminal progenitor signatures and positively associated with mammary stem cell-enriched (MaSC/Basal) signatures, which includes mammary stem cells, basal progenitors and mature myoepithelium (Figure 2B) (Lim et al., 2010). Moreover, these transcriptomes of autophagy-deficient metastases were positively associated with the targets of the basal mammary transcription factor, TP63α, as well as a previously described highly metastatic CK14+ basal subpopulation found at the leading edge of human and mouse mammary tumors (Figure 2B) (Barton et al., 2010; Cheung et al., 2016). Taken together, these results indicate that autophagy-deficiency elicits the acquisition of pro-metastatic, basal epithelial traits in an otherwise luminal progenitor population.
Figure 2. Tumor Cell Autophagy Restricts Basal Differentiation Transcriptional Programs and Proliferation During Metastasis.
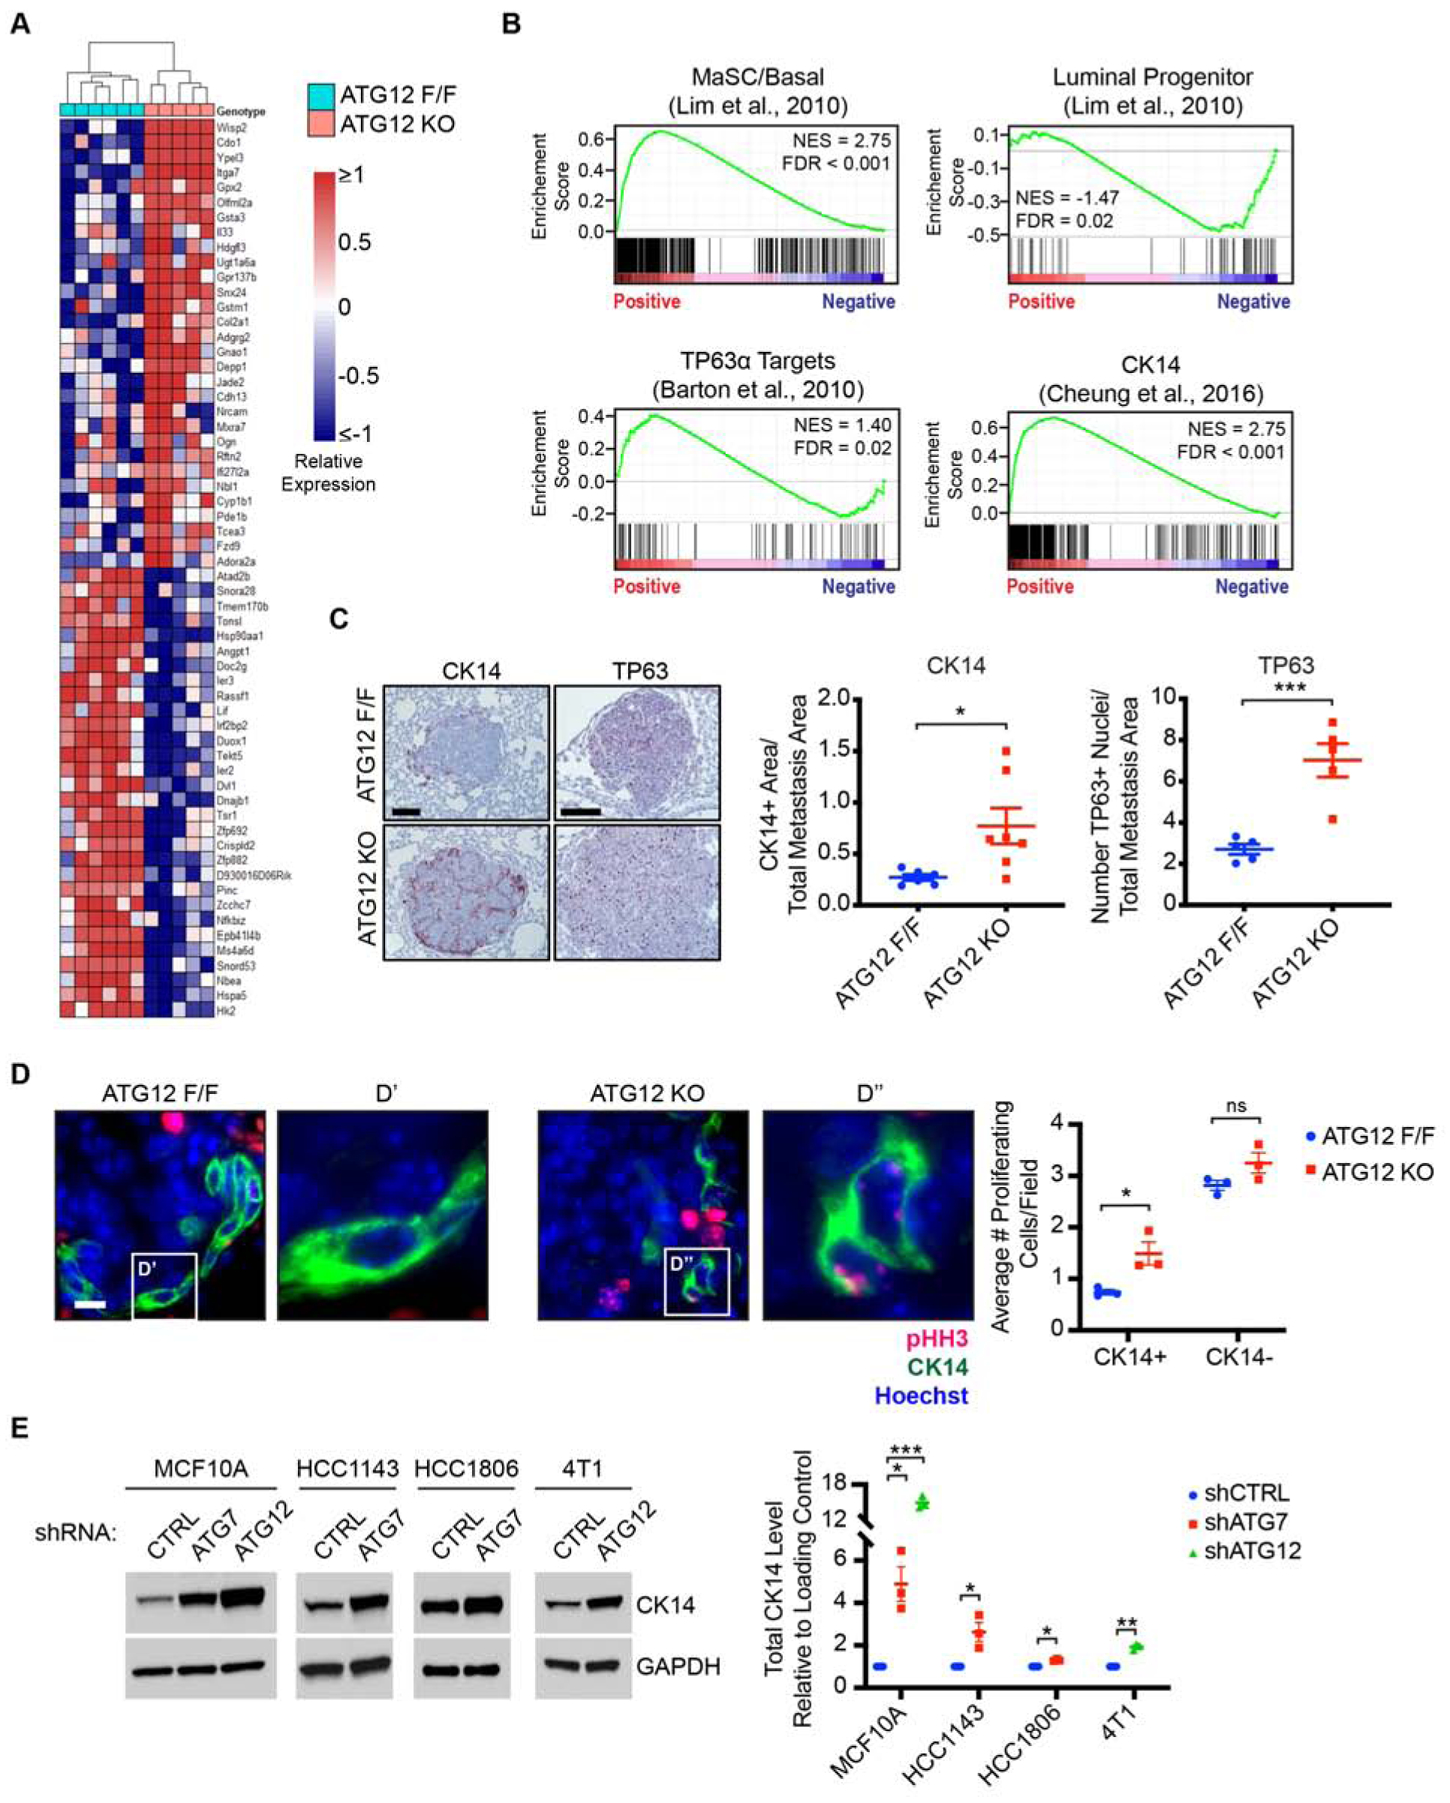
(A) Heatmap of top 30 differentially expressed genes (ranked by p-value) between ATG12F/F and ATG12KO metastases (scale indicates log2 transformed and median centered expression, p-value < 0.005). ATG12F/F (n= 6 mice), ATG12KO (n=5).
(B) Gene set enrichment analyses in ATG12KO relative to ATG12F/F metastases.
(C) Left, representative immunohistochemical staining of CK14 (red), TP63 (red), and counterstained with hematoxylin (blue) from animals in Figure 1C. Scale bar = 100 μm. Right, quantification of CK14 and TP63 staining area normalized to metastasis area. CK14; ATG12F/F (n=6 mice), ATG12KO (n=7). TP63; ATG12F/F (n=5), ATG12KO (n=5).
(D) Left, representative immunofluorescent staining of proliferating metastatic tumor cells (pHH3, red), CK14 (green) and nuclei (Hoechst, blue) from 2-week group in Figure 1I. Scale bar = 10 μm. Right, quantification of average proliferating cells/field for CK14+ and CK14− populations in indicated genotypes. 17–21 optical fields/animal.
(E) Left, immunoblots of CK14 and GAPDH in MCF10A, HCC1143, HCC1806 and 4T1 cells with indicated shRNAs. Right, quantification of CK14 normalized to GAPDH in triplicate.
Statistics: DESeq2 (A), false-discovery rate (B), t-test (C)(D)(E). Data represented by mean ± S.E.M. Each dot represents 1 animal or biological replicate. ns = not significant. *p<0.05, **p<0.01, ***p<0.001. See also Figure S2
In further support, the CK14 transcript, a direct transcriptional target of TP63, was 1.4-fold upregulated in autophagy-deficient metastatic cells and immunohistochemical staining of metastatic lesions corroborated a significant increase in the CK14+ and TP63+ subpopulations in autophagy-deficient metastases compared to controls (Figure 2C). Given our observation of increased proliferation in autophagy-deficient metastases, we assessed whether proliferative capacity was correlated with differentiation status of metastatic cells. Indeed, the CK14+ population exhibited increased proliferation in autophagy-deficient metastases, while there were no significant differences in proliferation of the CK14− population (Figure 2D), indicating that autophagy-deficiency elicits a highly proliferative basal population at the metastatic site. Additionally, upregulation of CK14 downstream of autophagy inhibition was not unique to the PyMT model. Upon stable knockdown of essential ATGs (Figure S2C), we observed increased CK14 expression in multiple human and mouse cell lines, including the human breast epithelial cell line MCF10A, the human basal breast cancer lines HCC1143 and HCC1806, and the mouse basal mammary cancer line 4T1 (Figure 2E). In contrast, we did not observe upregulation of CK14 in human luminal A breast cancer lines, MCF7 and T47d, upon autophagy knockdown (Figure S2D), suggesting this effect of autophagy inhibition manifests in tumor cells pre-disposed to undergo basal-like differentiation.
We also evaluated enriched gene ontology (GO) categories from significantly upregulated genes (p-value < 0.005, fold-change ≥ 2) in autophagy-deficient metastatic cells (Figure S2E). Biological adhesion and cellular projection organization categories were among the most significantly enriched GO Biological Process terms, consistent with the dysregulation of intermediate filaments (e.g., CK14) in these metastatic cells. There was also significant enrichment of GO Cellular Component and Molecular Function categories involved in regulation of the extracellular matrix and growth factor receptor signaling (Figure S2E). Overall, these findings indicate that inhibiting autophagy in mammary tumors leads to the emergence of subpopulations of tumor cells harboring basal differentiation traits that promote aggressiveness and metastasis.
Tumor Cell Autophagy Promotes Primary Orthotopic Mammary Tumor Generation
In contrast to these observed effects on metastatic outgrowth, previous work demonstrates that inhibiting autophagy via genetic deletion of the essential autophagy regulator, Fip200, suppresses PyMT-driven mammary tumorigenesis (Wei et al., 2011). Hence, we treated MMTV-PyMT;CAG-CreER;Atg12F/F or MMTV-PyMT;CAG-CreER;Atg5F/F primary cells with 4-OHT or vehicle transiently ex vivo, and orthotopically transplanted them into the mammary fat pads of naïve recipients (Figure S3A). Consistent with previous studies of Fip200, tumor cell autophagy ablation significantly impaired primary tumor growth and final tumor weight (Figures 3A and 3B). Autophagy-deficiency was retained at endpoint compared to controls (Figure 3C). Despite these differences in primary tumor size and burden, we did not observe obvious histological differences between autophagy-deficient and -competent primary tumors (Figure S3B). Compared to controls, autophagy-ablated tumors exhibited significantly decreased proliferation, but no changes in apoptotic cell death (Figure S3C).
Figure 3. Tumor Cell Autophagy Promotes Orthotopic Primary Mammary Tumor Formation.

(A) Tumor growth kinetics for indicated genotypes. One experiment for ATG12, three pooled experiments for ATG5.
(B) Tumor weight at endpoint for indicated genotypes from animals in (A).
(C) Immunoblots of primary tumors from indicated genotypes at endpoint for the ATG12-ATG5 complex, LC3 and GAPDH.
(D) Representative images of primary tumors stained for CK14 (red), CK5 (red) and counterstained with hematoxylin (blue). Inset, adjacent normal mammary duct. Scale bar = 100 μm.
(E) Representative images of primary tumors stained for CK14, Vimentin, Fibronectin, TP63, ΔN-TP63 (red), and counterstained with hematoxylin (blue). Inset, top – adjacent normal mammary duct. Inset, bottom – increased magnification. Scale bar = 100 μm.
(F) Left, representative immunofluorescent staining of proliferating primary tumor cells (pHH3, red), CK14 (green) and nuclei (Hoechst, blue) from (A). Scale bar = 20 μm. Middle, quantification of average proliferating cells/field for CK14+ and CK14− populations in indicated genotypes. 7–11 optical fields/animal. Right, quantification of percent total proliferating cells that express CK14 at indicated tumor sites for specified genotypes. Statistics: t-test (A)(B, ATG12)(F), Mann-Whitney (B, ATG5). Data represented by mean ± S.E.M. Each dot represents 1 animal. *p<0.05, **p<0.01, ***p<0.001. See also Figure S3 and S4.
We next assessed whether tumor cell autophagy impacted basal differentiation traits in primary tumors. Similar to our results from experimental metastasis assays, we observed profound increases in CK14+ tumor cells in autophagy-deficient primary tumors, whereas autophagy-competent tumors lacked this population except for rare CK14+ tumor cells enriched at the tumor periphery, as described previously (Figures 3D, 3E, S4A, S4B, and S4C) (Cheung et al., 2013). These CK14+ tumor cells, enriched in autophagy-deficient PyMT tumors, were positive for the basal mammary transcription factor TP63, specifically the ΔN-TP63 isoforms, which are proposed to be sufficient to induce basal phenotypes in luminal mammary cells (Figures 3E and S4A) (Yalcin-Ozuysal et al., 2010). We also examined Keratin 5 (CK5), the heterotypic partner of CK14 in normal basal mammary epithelium (Sun et al., 2010). Although CK5 co-labeling was observed in a subset of CK14+ cells, numerous CK14+, CK5-negative cells were evident within autophagy-deficient tumors, suggesting these cells exist in a spectrum of differentiation states (Figures 3D and S4C). We assessed proliferation in primary tumors based on differentiation state and uncovered a significant increase in proliferating CK14+ populations in autophagy-deficient tumors. In contrast, there was a robust decrease in proliferating CK14-, luminal populations, which constituted the majority of proliferative events at the primary tumor site (Figure 3F).
We next quantified the proportion of proliferating cells that express CK14 at the primary tumor versus metastatic site, which revealed an increased percentage of proliferating basal cells at the metastatic site relative to the primary tumor, an effect that was further exacerbated by autophagy inhibition (Figure 3F). Thus, autophagy-deficiency elicits the expansion of CK14+ populations at both the primary tumor and metastatic sites. In contrast, the genetic loss of autophagy impairs CK14− luminal population expansion, but these effects appear to be unique to the primary tumor.
Intriguingly, these autophagy-deficient CK14+ cells at the primary tumor were also positive for the mesenchymal marker vimentin (VIM) and tended to localize to tumor regions rich in fibronectin (FN) (Figures 3E and S4A). Nevertheless, immunofluorescence indicated a large proportion of CK14+ and Vimentin+ cells retained expression of E-cadherin, suggesting autophagy inhibition promoted mesenchymal differentiation, but failed to elicit a complete epithelial-to-mesenchymal transition (EMT) in this model (Figures S4D, S4E, and S4F). These findings demonstrate autophagy inhibition promotes the emergence of aggressive basal subpopulations that are predisposed to metastatic outgrowth and highlight the opposing functions of tumor cell autophagy in primary tumors versus metastases.
Tumor Cell Autophagy Restricts Local and Metastatic Recurrence Following Primary Tumor Excision
Since autophagy inhibition led to the acquisition of basal and mesenchymal traits associated with increased metastatic capacity in primary tumors, we hypothesized that autophagy-deficiency, despite inhibiting primary tumor growth, might ultimately promote metastasis in spontaneous models. Previous results utilizing Fip200 deletion to impair autophagy during PyMT tumorigenesis demonstrate decreased spontaneous lung metastasis (Wei et al., 2011), and we corroborated similar reductions in lung metastasis following orthotopic transplant of autophagy-deficient PyMT cells (Figure S4G). Nevertheless, both our current experiments described above and these previous studies did not control for the significant reductions in primary tumor burden observed in autophagy-deficient tumors.
To overcome these limitations, we controlled for primary tumor burden by surgically excising autophagy-deficient and -competent primary tumors at matched sizes, early in progression (1000 mm3), and thereafter, investigated the development of metastatic lesions over a 50-day window post-excision (Figure 4A). As expected, autophagy-deficient primary tumors displayed a significant growth impairment, requiring 56–69 days to reach the 1000 mm3 excision timepoint, compared to 42–46 days for matched autophagy-competent controls (Figure 4B). Within 50 days post-excision, we observed primary tumor recurrence at the orthotopic site of multiple animals originally bearing autophagy-deficient primary tumors, but never in animals that previously contained autophagy-competent tumors (Figure 4C). Furthermore, spontaneous pulmonary metastatic lesions were only observed in animals bearing autophagy-deficient primary tumors, irrespective of primary tumor recurrence (Figures 4C and 4D). Notably, autophagy inhibition promoted spontaneous metastasis in additional tumor models. Stable ATG12 knockdown in 4T1 cells did not impair primary tumor growth (Figure 4E), consistent with previous findings (Sharifi et al., 2016), but led to increased spontaneous lung metastases (Figure 4F) with elevated CK14+ staining (Figure 4G). Taken together, these findings further support a role for autophagy inhibition in generating highly aggressive cells which exhibit increased propensity for metastasis.
Figure 4. Tumor Cell Autophagy Restricts Local and Metastatic Recurrence Following Primary Tumor Excision.

(A) Schematic of experimental design.
(B) PyMT tumor growth kinetics for indicated genotypes. Two pooled independent experiments for ATG12, and one experiment for ATG5.
(C) Incidence of primary tumor recurrence and metastasis for indicated genotypes from animals in (B).
(D) Left, Quantification of average metastatic number for animals of indicated genotypes without primary tumor recurrence. ATG12F/F (n=7 mice), ATG12KO (n=7), ATG5F/F (n=5), ATG5KO (n=5). Right, representative hematoxylin and eosin staining of lung metastases for indicated genotypes. Scale bar = 2 mm.
(E) 4T1 tumor growth kinetics for indicated shRNAs. Two pooled independent experiments.
(F) Quantification of average 4T1 metastatic number for animals of indicated shRNAs. shCTRL (n=12 mice), shATG12 (n=13).
(G) Quantification of CK14 staining area normalized to metastasis area for indicated shRNAs. shCTRL (n=6 mice); shATG12 (n=7).
Statistics: t-test (B)(E)(F), Mann-Whitney (G). Data are represented by mean ± S.E.M. Each dot represents 1 animal. *p<0.05, **p<0.01, ***p<0.001.
The Autophagy Cargo Receptor NBR1, But Not P62, is Sufficient to Drive Metastatic Outgrowth
Emerging evidence suggests that ACRs mediate diverse cellular adaptations and behaviors critical for tumorigenesis (Duran et al., 2008; Qiang et al., 2014; Wei et al., 2014). Upon autophagy inhibition, the accumulation of ACRs within cells can act as complex signaling scaffolds promoting tumor cell proliferation, metabolism and survival (Hernandez et al., 2014; Moscat et al., 2016). Given ACRs function in a context- and cell type-dependent manner, we first assayed whether specific ACRs accumulate upon autophagy inhibition in PyMT cells. Two ACRs, NBR1 and P62, significantly accumulated following autophagy inhibition both in primary PyMT cells and the R221a cell-line using multiple distinct methods of genetic autophagy impairment (Figures 5A and 5B). We next asked whether NBR1 or P62 independently are sufficient to promote metastatic outgrowth in autophagy-competent, R221a PyMT tumor cells. Ectopically expressed, epitope-tagged NBR1 or P62 resulted in 1.5- and 2.6-fold increased protein expression, respectively; these levels closely mimicked the degree of ACR accumulation observed upon autophagy inhibition (Figures S5A and S5B). We then inoculated NBR1 and P62 overexpressing PyMT cells into the lateral tail vein and found that NBR1 overexpression was sufficient to promote metastatic outgrowth, whereas increased P62 had no effect on metastasis (Figures 5C, 5D, S5C, and S5D). We confirmed that NBR1 overexpression did not alter autophagic flux, evidenced by negligible effects on LC3-II processing and lysosomal turnover (Figure S5E). Hence, aberrant accumulation of NBR1, but not P62, is sufficient to promote metastatic progression, even in autophagy-competent tumor cells.
Figure 5. NBR1 Is Required for Metastatic Outgrowth and Basal Differentiation Upon Tumor Cell Autophagy Inhibition.

(A) Immunoblots for autophagy cargo receptors in autophagy-deficient and -competent primary and R221a PyMT cells of indicated genotypes and shRNAs, respectively.
(B) Quantification of autophagy cargo receptor protein levels normalized to GAPDH in autophagy-deficient cells relative to autophagy-competent cells from (A). Three pooled independent experiments.
(C) Quantification of average metastatic size for empty vector (EV, n=16 mice) or P62-overexpressing (n=18) R221a cells. Two pooled independent experiments.
(D) Quantification of average metastatic size for empty vector (EV, n=15 mice) or NBR1-overexpressing (n=15) R221a cells. Two pooled independent experiments.
(E) Quantification of average metastatic size for indicated shRNAs in R221a cells. Two pooled independent experiments. shCTRL (n=12 mice), shNBR1#1 (n=8), shNBR1#2 (n=10).
(F) Quantification of average metastatic size for indicated shRNAs in R221a cells. Three pooled independent experiments. shCTRL (n=15 mice); shATG7 (n=17); shATG7, shNBR1 (n=16).
(G) Quantification of average metastatic size for indicated shRNAs in 4T1 cells. One experiment. shCTRL (n=7 mice); shATG12 (n=6); shATG12, shNBR1 (n=7).
(H) Representative whole lung images after inoculation with R221a cells expressing indicated shRNAs. Scale bar = 2 mm.
(I) Representative images of CK14 staining in R221a metastases for indicated shRNAs. Metastases are outlined with dashed line (black). Scale bar = 100 μm.
(J) Quantification of CK14 staining area normalized to R221a metastasis area for indicated shRNAs. shCTRL (n=8 mice); shATG7 (n=9); shATG7, shNBR1 (n=8).
Statistics: t-test (B)(C), Mann-Whitney (D), ANOVA with Dunn’s post-hoc test (E)(F) or Tukey’s post-hoc test (G)(J). Data are represented by mean ± S.E.M. Each dot represents 1 animal or biological replicate. ns = not significant. *p<0.05, **p<0.01, ***p<0.001. See also Figure S5.
NBR1 Is Required for Metastatic Outgrowth and Basal Differentiation Upon Tumor Cell Autophagy Inhibition
As ectopic expression of NBR1 was sufficient to promote metastatic outgrowth, we next interrogated whether NBR1 was necessary for this process in both autophagy-competent and -deficient tumor cells. We generated R221a PyMT cells with two distinct shRNAs stably targeting Nbr1 (Figure S5F) and observed robust attenuation of metastatic outgrowth upon stable NBR1 knockdown compared to non-targeting controls (Figures 5E and S5G). We then determined whether preventing NBR1 accumulation in autophagy-deficient tumors was sufficient to reverse the metastatic outgrowth phenotype arising in the setting of autophagy inhibition by stably co-depleting NBR1 in autophagy-deficient R221a and 4T1 tumor cells. Preventing autophagy-dependent NBR1 accumulation (Figures S5H, S5I, S5J, and S5K) completely reversed the effects of autophagy inhibition on experimental metastasis (Figures 5F, 5G, and 5H) as well as the elevated levels of CK14+ metastatic cells resulting from autophagy-deficiency (Figures 5I and 5J). Overall, these findings indicate that autophagy-deficiency promotes metastatic outgrowth and pro-metastatic basal differentiation in tumor cells via the aberrant accumulation of NBR1.
Clinical Correlates of Autophagy Gene Expression Signatures in Breast Cancer Patients
Based on our results, we further scrutinized how autophagy status impacted differentiation state and disease outcomes in human breast cancer patients. We interrogated autophagy biogenesis gene signatures in TCGA breast cancer datasets and observed significant inverse correlations between autophagy-specific gene expression and MaSC/Basal gene signatures as well as TP63 transcriptional targets in Luminal A, Luminal B and Basal-like subtypes (Figure 6; autophagy gene set displayed in Table S1). We next determined whether autophagy gene signatures had prognostic significance on disease outcome across all subtypes of human breast cancer and found decreased overall survival and distant metastasis-free survival in cohorts with low expression of autophagy-specific genes (Figure 7A; Table S1). Taken together, these findings suggest that decreased autophagy in human breast cancers is associated with pro-metastatic differentiation and predictive of reduced survival.
Figure 6. Autophagy-Specific Genes Correlate with MaSC/Basal and TP63 Target Gene Expression Signatures.

Best-fit line and Pearson correlations between mean autophagy-specific gene expression in primary tumors and MaSC/Basal and TP63 Targets gene expression signatures for indicated PAM50 subtypes from TCGA datasets. The complete list of autophagy genes analyzed is listed in Table S1.
Statistics: F-test.
Figure 7. Clinical Correlates in Human Breast Cancer and Autophagy Induction in Mice.

(A) Kaplan-Meier plot of overall survival (OS; n=626) and distant metastasis-free survival (DMFS; n=664) probability in breast cancer patients stratified by high (red) and low (black) primary tumor mean expression of autophagy genes (ATG). Complete list of autophagy genes analyzed in Table S1.
(B) Schematic of experimental design.
(C) Quantification of average metastatic size for indicated treatments utilizing primary PyMT cells. Vehicle (n=6 mice), Chloroquine (CQ, n=6).
(D) Quantification of CK14 staining area normalized to metastasis area for indicated treatments. Vehicle (n=5 mice), Chloroquine (n=5).
(E) Representative whole lung images for indicated treatments. Scale bar = 2 mm.
(F) Quantification of average metastatic size for indicated treatments utilizing primary PyMT cells. Vehicle (n=5 mice), Rapamycin (RAP, n=5).
(G) Quantification of CK14 staining area normalized to metastasis area for indicated treatments. Vehicle (n=5 mice), Rapamycin (n=5).
(H) Quantification of average metastatic size for indicated shRNAs in R221a cells. Two pooled independent experiments. shCTRL (n=10 mice); shRUBCN (n=11); shATG7, shRUBCN (n=7).
(I) Quantification of CK14 staining area normalized to metastasis area for indicated shRNAs. shCTRL (n=4 mice); shRUBCN (n=4); shATG7, shRUBCN (n=4).
(J) Representative whole lung images for indicated genotypes. Scale bar = 2 mm.
Statistics: Log-rank test (A), t-test (C)(D)(G), Mann-Whitney (F), ANOVA with Tukey’s post-hoc test (H)(I). Data are represented by mean ± S.E.M. Each dot represents 1 animal. ns = not significant. *p<0.05, **p<0.01, ***p<0.001. See also Figure S6.
Effects of Pharmacological Autophagy Modulation on Metastatic Outgrowth
Pharmacological autophagy inhibitors (i.e., HCQ) are being utilized in clinical trials for patients with advanced cancers. HCQ prevents autophagy by impairing lysosomal acidification, resulting in the accumulation of LC3-II-positive autophagosomes. Thus, we evaluated whether systemic chloroquine (CQ) treatment increased metastatic outgrowth similar to our genetic models of tumor cell-specific autophagy ablation. Autophagy-competent primary PyMT cells were inoculated via lateral tail-vein and allowed to seed the lung for 1 week prior to daily treatment with CQ (60 mg/kg) or vehicle (Figure 7B). Interestingly, we observed no significant effects of CQ treatment on the size of metastases (Figure 7C). We confirmed CQ-induced lysosomal inhibition by immunoblotting for undigested autophagosomes, evidenced by LC3-II accumulation, in peripheral tissues of treated animals (Figure S6A). Moreover, CQ treatment had no effect on the abundance of CK14+ cells in metastatic lesions (Figures 7D and S6B). Postulating these effects of CQ may be due to autophagy inhibition in host non-tumor tissues (Haspel et al., 2011; Moulis and Vindis, 2017), we utilized Atg12F/F;CAG-CreER mice to inducibly delete Atg12 across all tissues within adult animals. We transiently administered tamoxifen or vehicle to 6-week-old mice to recombine Atg12 loci systemically, and after 2 weeks, inoculated autophagy-competent PyMT tumor cells via tail vein injection (Figure S6C). At the time of tumor cell injection, we confirmed systemic Atg12 deletion by immunoblotting for LC3 processing and the ATG12-ATG5 complex (Figure S6D). Similar to our results with CQ treatment, systemic Atg12 deletion did not impact metastatic outgrowth (Figure S6E). At endpoint, we confirmed systemic Atg12 deletion by PCR for the recombined Atg12 locus and immunoblotting for LC3 processing (Figures S6F and S6G). Thus, similar to systemic treatment with CQ, the genetic inhibition of stromal autophagy throughout the host does not potentiate metastatic outgrowth.
In parallel, we tested whether pharmacologically stimulating autophagy in both tumor cells and host tissues was sufficient to attenuate metastatic outgrowth. The mammalian target of rapamycin complex 1 (mTORC1) is a potent repressor of autophagy; as such, inhibition of mTORC1 with rapamycin (RAP) leads to heightened levels of autophagic flux across diverse cell types. We inoculated autophagy-competent primary PyMT cells via tail-vein and allowed them to seed the lung for 1 week before stimulating autophagy via continued administration of RAP (4mg/kg) (Figure 7B), which reduced S6 phosphorylation (Ser240/244) in host tissues (Figure S6H). RAP treatment robustly attenuated metastatic outgrowth compared to vehicle controls (Figures 7E and 7F) and decreased CK14 staining in metastatic lesions (Figures 7G and S6I).
Finally, we created a genetic model to more specifically stimulate autophagy induction within tumor cells. We generated PyMT cells stably depleted of Rubicon (Rubcn), a negative regulator of autophagosome biogenesis (Figure S6J), which significantly attenuated metastatic outgrowth (Figures 7H and 7J). Importantly, co-silencing Atg7 in Rubcn knockdown cells reversed these anti-metastatic effects, corroborating that the effects of enforced autophagy induction on metastasis by Rubcn required the capacity to form autophagosomes. Importantly, these metastatic phenotypes correlated with the abundance of CK14+ populations (Figures 7I and S6K). Overall, these results support that pharmacological and genetic induction of autophagy in tumor cells is able to potently suppress metastatic outgrowth of disseminated breast cancer cells.
Discussion
Here, we uncover a previously unrecognized role for autophagy in suppressing metastatic outgrowth and identify NBR1 as a mediator of autophagy-dependent outcomes during metastasis. Autophagy inhibition generates an aggressive CK14+ tumor cell population in an NBR1-dependent manner with increased ability to form recurrent tumors at both primary and metastatic sites. Moreover, pharmacological and genetic stimulation of autophagy suppresses the emergence of this aggressive CK14+ subpopulation and attenuated metastatic outgrowth of DTCs. Finally, consistent with the importance of autophagy during metastasis, reduced expression of autophagy biogenesis genes in human breast cancer samples correlates with increased basal transcriptional signatures as well as reduced overall and distant metastasis-free survival.
The paradox between functional outcomes of autophagy during primary and metastatic tumor growth highlights the exquisitely stage-specific role of autophagy during metastatic progression in breast cancer. Previous studies have observed increased LC3 puncta in human breast, melanoma, and hepatocellular carcinoma metastases compared to primary tumors, suggesting a differential requirement for autophagy in human primary tumors versus metastases (Hashemi-Sadraei et al., 2018; Lazova et al., 2012; Peng et al., 2013). Our results lend experimental support for this notion and provide additional evidence that autophagic impairment promotes metastasis through aberrant accumulation of NBR1. Interestingly, the archetypal ACR, P62, had no effect on metastatic outgrowth in this mammary cancer model despite its previously described pro-tumorigenic role in both autophagy-deficient primary mammary tumors and the regulation of EMT in squamous cell carcinoma (Qiang et al., 2014; Wei et al., 2014). Hence, NBR1 is a previously unrecognized autophagic substrate that potently controls metastatic potential in multiple pre-clinical models of mammary cancer.
RNA sequencing of autophagy-deficient metastatic PyMT cells identifies multiple downstream pro-metastatic effects of genetic autophagy inhibition during metastasis. Specifically, autophagy-deficient metastatic cells acquire pro-metastatic basal epithelial (i.e., CK14, TP63) transcriptional repertoires. Moreover, we show that acquisition of this basal state, marked by CK14, depends on NBR1 accumulation. Previous studies demonstrate that the CK14+ state facilitates the collective migration of breast cancer cells both in vitro and in vivo (Cheung et al., 2013). Additionally, studies from our lab found that NBR1 promotes focal adhesion disassembly and migration of mammary epithelial cells in vitro (Kenific et al., 2016). Thus, tumor cell autophagy likely has pleiotropic effects on motility and biological adhesions during metastatic outgrowth, as reflected in the GO analyses comparing autophagy-deficient versus autophagy-competent metastatic cells. Recent studies utilizing breast cancer cells highlight the dynamic interconversion between CK14+ and CK14− states in vitro and that CK14 is required for efficient metastasis in vivo; however, the mechanisms governing this plasticity remain unknown (Cheung et al., 2013; Cheung et al., 2016). We provide evidence that autophagy potently controls abundance of a proliferative CK14+ population in both primary and metastatic tumor cells, which underlie its effects on metastatic outgrowth. Future studies utilizing reversible autophagy impairment in tumor cells are required to determine whether this effect of autophagy on tumor cell plasticity and metastasis is a permanent conversion or if it is dynamically regulated.
Unlike genetic tumor cell-specific autophagy ablation, pharmacological inhibition of autophagy using CQ does not impact the metastatic outgrowth of DTCs. We postulate that these differences are at least partly explained by the fact that CQ systemically inhibits autophagy in diverse host non-tumor tissues; accordingly, our results corroborate that the genetic inhibition of stromal autophagy throughout the host does not potentiate metastatic outgrowth. Alternatively, CQ may differentially impact the localization of NBR1 when compared to the targeting of ATGs. Upon CQ-mediated lysosomal inhibition, NBR1 is sequestered within mature, undigested autophagosomes, whereas deletion of ATGs involved in autophagosome formation results in cytosolic NBR1 accumulation where it can act as a signaling scaffold. Lastly, it is important to recognize that CQ is predominantly being used in combination with other therapies in patients, which will likely yield distinct outcomes with regard to metastasis. Overall, dissecting how these various methods of autophagy-inhibition mechanistically impacts metastatic outgrowth remains an important area for future investigation. Nevertheless, our results using two independent strategies, the mTORC1 inhibitor rapamycin and genetic depletion of Rubcn, provide support that stimulating autophagy can prevent the metastatic outgrowth of DTCs. Based on these results, we propose that autophagy induction should be further evaluated as a potential therapeutic strategy for the prevention of metastasis. On the whole, as future pharmacological compounds that specifically induce or inhibit autophagy are developed for cancer treatment, their long-term effects on metastasis remain an important consideration.
STAR Methods
LEAD CONTACT AND MATERIALS AVAILABILITY
Further information and requests for resources and reagents should be directed to and will be fulfilled by the Lead Contact, Jayanta Debnath (jayanta.debnath@ucsf.edu)
EXPERIMENTAL MODEL AND SUBJECT DETAILS
Mice
All animal experiments were approved by the University of California, San Francisco IACUC under protocol AN170608. Mice were housed in the specific pathogen-free PSB facility (The University of California, San Francisco). To generate MMTV-PyMT;CAG-CreER;Atg12F/F or Atg5F/F compound transgenic mice, we first crossed male MMTV-PyMT (Guy et al., 1992) and female CAG-CreER mice. Male MMTV-PyMT;CAG-CreER offspring were subsequently bred to female mice harboring either Atg12F/F (Malhotra et al., 2015) or Atg5F/F (Hara et al., 2006) alleles. We generated a second cohort of mice with the above alleles that also harbored GFP-LC3 by intercrossing MMTV-PyMT;CAG-CreER;Atg12F/F males with homozygous GFP-LC3 females (Mizushima et al., 2004). For all cohorts, compound transgenic offspring were backcrossed to C57BL/6 mice for two generations, bred for homozygosity of Atg12 and Atg5, and tested for C57BL/6 congenicity (Jackson Laboratory). All tested compound transgenic mice were >97% congenic with the C57BL/6 strain. PCR primer sequences for genotyping of strains can be found in Table S2. Naive C57BL/6, FVB and BALB/c female mice were purchased commercially at 6-weeks of age.
Cell Line and Primary Cell Culture
R221a (female) (Martin et al., 2008), MCF7 (female), HEK293t (female) and Phoenix (female) cells were maintained in DMEM supplemented with 10% FBS and 1% penicillin/streptomycin. 4T1 (female), HCC1143 (female), HCC1806 (female), and T47D (female) cells were maintained in RPMI supplemented with 10% FBS and 1% penicillin/streptomycin. MCF10A (female) cells were maintained in DMEM/F12 supplemented with 5% horse serum, 20 ng/ml EGF, 0.5 μg/ml hydrocortisone, 100 ng/ml cholera toxin, 10 μg/ml insulin, and 1% penicillin/streptomycin. Primary PyMT (female) cells of indicated genotypes were maintained in DMEM:F12 supplemented with 50 ng/ml EGF, 1 μg/ml hydrocortisone, 10 μg/ml insulin, 1% penicillin/streptomycin and 10% FBS. All cells were cultured in 5% CO2 in a humidified incubator at 37°C. Human and mouse cell lines were authenticated annually using Short Tandem Repeat (STR) profiling and mouse primary cells using PCR genotyping.
METHOD DETAILS
Isolation and Ex Vivo Recombination of Primary PyMT Cells
MMTV-PyMT;CAG-CreER;Atg12F/F, MMTV-PyMT;CAG-CreER;Atg5F/F and MMTV-PyMT;CAG-CreER;Atg12F/F;GFP-LC3+/− compound transgenic mice were monitored starting at 2 months of age and tumors were measured by caliper until the largest tumor diameter equaled 2 cm. Female animals were then sacrificed and tissue from all mammary glands was harvested. Primary mammary tumor epithelium was prepared using an established protocol using 200 ml of digest media per donor animal (Fata et al., 2007). Resulting primary PyMT cell organoids were viably frozen in FBS with 10% DMSO. For ex vivo recombination of Atg12F/F or Atg5F/F in PyMT cells, primary cells of indicated genotypes were thawed and plated on tissue culture plates for 72 hours in the presence of 2 μM 4-hydroxytamoxifen (4-OHT) or ethanol (vehicle).
Transplants and In Vivo Recombination of Primary PyMT Cells
Primary PyMT, R221a and 4T1 cells were trypsinized into single-cell suspensions, counted for viable cells and washed with PBS prior to injection. For orthotopic transplant, primary PyMT cells (5 × 10⁵) or 4T1 cells (1 × 10⁵) were resuspended in 20 μl PBS with 50% Matrigel and injected into the #4 mammary fat pads of 6–8-week-old C57BL/6 or Balb/C female mice, respectively, using a Hamilton syringe. For PyMT cells, only one tumor was generated per host. For 4T1 cells, two tumors were generated in contralateral #4 mammary fat pads per host. Tumor volume was calculated as volume = 0.5 × width × (length^2). For tail-vein injection, primary PyMT cells (5 × 10⁵), R221a cells (1 × 10⁶), or 4T1 cells (5 × 10⁴) were resuspended in 150 μl PBS and injected into 6–8 week-old female mice (C57BL/6, FVB, and Balb/C, respectively) via lateral tail-vein. Unless otherwise indicated, animals receiving tail vein injections of primary PyMT, R221a, and 4T1 cells were sacrificed at 4-, 2-, and 1-weeks post-injection, respectively. For in vivo recombination of Atg12F/F or Atg5F/F in primary PyMT cells, female animals harboring indicated tumor cells were treated with tamoxifen (0.2 mg/g mouse) or peanut oil (vehicle) by oral gavage for 5 consecutive days starting at 1-week post tumor cell injection. In all experiments, animal weight loss of >15% resulted in removal from study and euthanasia.
Quantification of Metastasis and Ex Vivo Lung Imaging
For histological quantification of pulmonary metastasis, we generated hematoxylin and eosin (H&E) stained sections of tumor bearing lungs. All mice from each experiment were quantified. H&E stained sections were scanned using an Aperio XT Whole Slide Scanner (Leica) and metastatic nodules were manually annotated using the Aperio ImageScope software. Metastasis number and size were averaged on a mouse-by-mouse basis and subjected to indicated statistical testing. For some experiments, we utilized a Leica M165 fluorescent dissecting microscope to image whole lungs ex vivo using stadium lighting or indicated fluorescent channels.
Quantitative RT-PCR
Quantitative RT-PCR was performed using iTAQ Universal SYBR Green Supermix on the StepOnePlus Real-Time PCR system (Applied Biosystems) in accordance with manufacturers’ instructions. Fold change was determined using the ΔΔCT method normalized to housekeeping gene, Gapdh. Primers used for RT-qPCR can be found in Table S3.
Immunoblots
For immunoblot analysis, cells were washed twice with PBS and lysed in RIPA buffer containing: protease inhibitor cocktail, 10 mM NaF, 10 mM β-glycerophosphate, 1 mM Na3VO4, and 10 nM calyculin A. The insoluble fraction and cell debris were cleared via centrifugation for 30 minutes at 4°C and protein qu antity was measured by bicinchoninic acid assay. Equal amounts of protein were boiled in sample buffer, resolved on SDS-PAGE mini gels, and transferred onto PVDF membrane. Membranes were blocked in 5% milk or bovine serum albumin in PBS with 0.1% Tween20 (PBST) for 30 minutes at room temperature prior to overnight incubation with indicated primary antibody at 4°C in blocking solution. Membranes were washed in PBST prior to incubation with HRP-conjugated secondary antibodies (1:5,000) in blocking solution for 1 hour at room temperature, washed again with PBST and developed via enhanced chemiluminescence.
Immunohistochemistry and Immunofluorescence Staining
Harvested tissues were incubated in 3.7% aqueous buffered zinc formalin for 24 hours at room temperature before being transferred to 70% ethanol, processed, paraffin-embedded, and cut at 5μM for mounting onto slides. Slides were stained with H&E or Masson’s Trichrome (The University of California, San Francisco Mouse Pathology Core, San Francisco, CA). For immunohistochemical (IHC) and immunofluorescent (IF) staining, paraffin-embedded sections were subjected to antigen heat retrieval with citrate buffer (pH = 6) in a decloaking chamber, blocked in 3% hydrogen peroxide for 30 minutes, blocked in 10% serum for 1 hour (serum species determined by secondary antibody host), and incubated for 1 hour at room temperature with indicated primary antibodies. For IHC, biotinylated secondary antibodies and ABC reagents were used according to manufacturer’s protocol (Vector Laboratories) and HRP was developed using NovaRed (Vector Laboratories). Sections were counterstained with Hematoxylin, dehydrated and mounted. IHC stained sections were imaged using an Olympus BX53 microscope. For IF, sections were incubated with AlexaFluor secondary antibodies (1:200) for 1 hour at room temperature prior to counterstaining with Hoechst (1:5,000) and mounting onto slides. IF stained sections were imaged using a confocal DeltaVision Elite (General Electric).
Quantification of IHC/IF Staining
For quantification of P62 aggregates in metastases by IF, images were loaded into ImageJ, thresholded and quantified using the Analyze Particles function. The number of aggregates was normalized to cell number. For quantification of phospho-histone H3 (pHH3) in metastases by IF, we imaged 10 representative metastases/animal for indicated number of animals. Positive nuclei were counted manually in ImageJ and normalized to area of metastasis. For quantification of CK14 in metastases by IHC, slides stained for CK14 by IHC were scanned using an Aperio XT Whole Slide Scanner (Leica). Whole slide scans were loaded in Aperio ImageScope (Leica) and all metastases from 2–3 lung lobes were manually annotated. We then utilized the Positive Pixel Count v9 algorithm (provided with ImageScope) to measure positively stained pixels within the metastasis annotation layer. Positively stained pixels were then normalized to corresponding metastasis area. For quantification of TP63 levels in metastases by IHC, we imaged 10 representative metastases/animal for the indicated number of animals. Images were loaded into ImageJ, subjected to Color Deconvolution with the RGB vector, thresholded and quantified using the Analyze Particles function. TP63 signal was then normalized to metastasis area. Quantification of vimentin and E-cadherin as well as pHH3 and CK14 co-labeling by IF was performed manually in ImageJ. For quantification of cleaved-caspase3 (CC3) and pHH3 in primary tumors by IHC, we imaged 4–8 non-necrotic tumor regions at the periphery of the tumor. Positively stained cells were counted manually in ImageJ and normalized to area.
High-Throughput RNA Sequencing
For all mice, lungs were perfused with 20 ml of 1 mM EDTA/PBS through the cardiac right ventricle. Whole lung GFP-LC3 signal was imaged on a Leica M165 fluorescent dissecting scope prior to tissue dissociation and FACS staining. Tissues were mechanically chopped with scalpels and transferred into 10 ml of digest media (RPMI with 3% FBS, containing 0.5 mg/ml collagenase-IV, 20 U/ml of DNAse-I). They were then digested for 1 hour at 37°C. The resulting sus pension was washed and dissociated with 4 ml 0.25% trypsin/EDTA for 6 min at 37°C, samples were filtered through a 70-μm filter before proceeding to FACS staining. Antibody staining was performed in RPMI medium supplemented with 2% FBS. Antibodies for extracellular surface markers included mouse antigens: CD45(PE), Ter119(PE), CD31(PE), MHC-I(APC). Dead cells were eliminated by staining samples with Ghost Dye and Cell viability reagent (V450). Viable mouse breast cancer cells identified as GFP(+), MHC-I(+), CD45(−), Ter119(−), CD31(−) were sorted into Qiagen lysis buffer using a FACSAriaII instrument (BD Biosciences) and RNA was extracted using the Qiagen RNeasy Micro Kit (Qiagen Cat#74004).
Full length cDNA synthesis and amplification from polyA+ extracted RNA was carried out using Smart-Seq2 protocol (Picelli et al., 2014). cDNAs were processed for sequencing using the lllumina Nextera XT DNA sample preparation kit (Illumina Cat# FC-131-1096) prior to paired-end, 150-bp sequencing on a HiSeq 4000 (The University of California, San Francisco Center for Advanced Technology, San Francisco, CA). Raw reads were mapped to the mouse reference genome (GRCm38/mm10) and counts estimated using Kallisto v0.44.0 (Bray et al., 2016). Differential expression analysis was performed using DESeq2 v3.8 (Love et al., 2014). Heatmap for top 30 significantly upregulated and downregulated genes in ATG12KO versus ATG12F/F metastases were plotted with the R package Pheatmap v1.0.10 using transcripts per million (TPM) outputs from Kallisto, values were log2 transformed and median centered. Gene set enrichment analysis (GSEA; v6.2) was performed using publicly available software from the Broad Institute (http://www.broad.mit.edu/gsea/), FDR was calculated using gene set permutation for 1,000 iterations. Gene ontology (GO; v6.2) analysis was performed using publicly available software from the Broad Institute with transcripts significantly upregulated in ATG12KO compared to ATG12F/F (p-value < 0.005, fold-change ≥ 2) using the C5:GO gene sets with FDR q-value below 0.05.
Expression Vectors and RNA Interference
For stable RNA interference, commercially available plKO.1-puro lentiviral shRNA (Moffat et al., 2006) and non-targeting plasmids were purchased from Sigma-Aldrich. ShRNA targeting murine Rubcn was generated by annealing together four separate primers: 5’-CCGGATTACTGGCAGTTTGTGAAAGCTCGAG-3’, 5’-CTTTCACAAACTGCCAGTAATTTTTTG-3’, 5’-CTTTCACAAACTGCCAGTAAT-3’, 5’- AATTCAAAAAATTACTGGCAGTTTGTGAAAGCTCGAG-3’ to generate a double stranded DNA (dsDNA) insert (5’-CCGG ATTACTGGCAGTTTGTGAAAG CTCGAG CTTTCACAAACTGCCAGTAAT TTTTTG-3’) and then phosphorylated on the exposed 5’ hydroxyl groups using T4 PNK. Subsequently, the phosphorylated dsDNA insert was cloned into pLKO.1 between AgeI and EcoRI restriction sites. To generate pLKO.1-blast for double knockdown studies, we replaced the puromycin resistance cassette between the BamHI and KpnI restriction sites of pLKO.1 with the blasticidin resistance gene. For double knockdown studies using pLKO.1-puro and pLKO.1-blast, target cells were sequentially infected and selected in antibiotic. For overexpression studies of NBR1 and P62, the pWZL-hygro retroviral packaging plasmid was used. The murine pWZL-3xFlag-NBR1 plasmid was a gift from Jorge Moscat (Hernandez et al., 2014). pWZL-3xFlag-P62 was generated by cloning murine P62 from pMXs-GFP-P62 (Itakura and Mizushima, 2011) between the BamHI and EcoRI restriction sites of pWZL downstream of sequences encoding an N-terminal 3xFlag epitope tag. Lenti- and retro-viral expression vectors were packaged in HEK293T and Phoenix cells, respectively. Viral supernatants were collected from packaging cells 48h post-transfection and incubated with target cells for 24h in the presence of Polybrene. Stably transduced cells were then selected using the appropriate antibiotics.
Drug Treatment and Systemic Deletion of ATG12
Female animals subjected to pharmacological treatments received tail-vein injections of tumor cells one week prior to receipt of pharmacological agent. For studies using chloroquine, animals received 60 mg/kg mouse chloroquine or PBS (vehicle) daily until end point by intraperitoneal injection. For studies using rapamycin, animals received 4 mg/kg mouse rapamycin or 5% PEG400/ 5% Tween80/2% ethanol (vehicle) every other day until endpoint by intraperitoneal injection. Female animals subjected to systemic deletion of Atg12 received 0.2 mg/g mouse tamoxifen or peanut oil (vehicle) for 5 consecutive days by oral gavage 2 weeks prior to tumor cell inoculation. At endpoint tail was harvested and PCR for the recombined Atg12 allele was performed using the PCR primers: 5’-ACTCTGAAGGCGTTCACGGC-3’, 5’-CACCCTGCTTTTACGAAGCCCA-3’.
QUANTIFICATION AND STATISTICAL ANALYSIS
Biostatistical Analysis
HTSeq counts RNASeq data and associated PAM50 subtype annotation of 1222 patients from the TCGA BRCA patient cohort were obtained using TCGAbiolinks v2.8.2. Patients with available PAM50 subtype annotation were included in the analysis. For correlation analysis between mean autophagy gene expression and MaSC and TP63 targets signatures, the p-value was calculated using F-test. KM Plotter (kmplot.com) was used to interrogate overall survival and distant metastasis-free survival (DMFS) for mean expression of autophagy-specific gene signatures stratified by the “auto select best cutoff” option. Exact cutoff values for ATG low and ATG high groups used in analyses were 929.12 for the probe mean expression range 413–1364 (OS) and 979.85 for the probe mean expression range 540–1529 (DMFS).
Statistics
Statistical analysis was performed with GraphPad Prism v8. Data distribution was assessed using Shapiro-Wilk’s normality test. Data was analyzed using a two-tailed student’s t-test for single comparisons or ANOVA for multiple comparisons. Statistical tests for individual experiments are specified at the end of each figure legend. Data are represented by mean ± S.E.M. unless otherwise noted. P-values of less than 0.05 were considered statistically significant.
DATA AND CODE AVAILABILITY
Accession Numbers
RNA sequencing raw counts and annotated DESeq2 analysis in this study (displayed in Figure 2) can be found on the NCBI Gene Expression Omnibus (#GSE124209). Raw sequencing data is available on NCBI Sequence Read Archive.
Supplementary Material
KEY RESOURCES TABLE
| REAGENT or RESOURCE | SOURCE | IDENTIFIER |
|---|---|---|
| Antibodies | ||
| Rabbit polyclonal anti-ATG12 | Cell Signaling | Cat# 2011; RRID: AB_ 2059085 |
| Rabbit monoclonal anti-ATG12 (D88H11) | Cell Signaling | Cat# 4180; RRID:AB_ 1903898 |
| Rabbit polyclonal anti-ATG7 | Cell Signaling | Cat# 2631; RRID:AB_10235047 |
| Goat polyclonal anti-ATG7 (N-20) | Santa Cruz Biotechnology | Cat# 8668; RRID:AB_ 2062169 |
| Rabbit polyclonal anti-ATG5 | Novus Biologicals | Cat# NB110–53818; RRID: AB_828587 |
| Rabbit polyclonal anti-LC3 | Generated in Debnath Laboratory; commercially available from Millipore | Cat# ABC232; RRID: N/A |
| Mouse monoclonal anti-NBR1 (4BR) | Santa Cruz Biotechnology | Cat# 130380; RRID: AB_2149402 |
| Guinea pig polyclonal anti-P62 | Progen Biotechnik GmbH | Cat# GP62C; RRID: AB_ 2687531 |
| Rabbit monoclonal anti-S6 (5G10) | Cell Signaling | Cat# 2217; RRID: AB_331355 |
| Rabbit polyclonal anti-phospho-S6 (S240/244) | Cell Signaling | Cat# 2215; RRID: AB_ 331682 |
| Rabbit polyclonal anti-OPTN | Abcam | Cat# 23666; RRID: AB_ 447598 |
| Rabbit polyclonal anti-NIX | Sigma-Aldrich | Cat# N0399; RRID: AB_260744 |
| Mouse monoclonal anti-FLAG (M2) | Sigma-Aldrich | Cat# F1804; RRID: AB_ 262044 |
| Rabbit monoclonal anti-α-TUBULIN (11H10) | Cell Signaling | Cat# 2125; RRID: AB_ 2619646 |
| Mouse monoclonal anti-GAPDH (6C5) | Millipore | Cat# MAB374; RRID: AB_2107445 |
| Rabbit polyclonal anti-phospho-HistoneH3 (Ser10) | Cell Signaling | Cat# 9701; RRID: AB_ 331535 |
| Rabbit polyclonal anti-cleaved-Caspase3 (Asp175) | Cell Signaling | Cat# 9661; RRID: AB_ 2341188 |
| Rabbit polyclonal anti-Keratin14 (Poly19053) | Covance | Cat# PRB-155p; RRID: AB_ 292096 |
| Mouse monoclonal anti-Keratin14 (LL002) | Abcam | Cat# ab7800; RRID:AB 306091 |
| Rabbit polyclonal anti-Keratin5 (Poly19055) | Covance | Cat# PRB-160p-100; RRID: AB_ 291581 |
| Rabbit monoclonal anti-Vimentin (EPR3776) | Abcam | Cat# 92547; RRID: AB_ 10562134 |
| Rabbit polyclonal anti-Fibronectin | Abcam | Cat# 23750; RRID: AB_ 447655 |
| Rabbit polyclonal anti-TP63 (N2C1) | Genetex | Cat# 102425; RRID: AB_ 1952344 |
| Rabbit polyclonal anti-TP63-ΔN (Poly6190) | Biolegend | Cat# 619002; RRID: AB_2207170 |
| Mouse monoclonal anti-E-Cadherin (36/E) | BD Biosciences | Cat# 610182; RRID: AB_ 397581 |
| Peroxidase AffiniPure Donkey anti-Rabbit | Jackson Immunoresearch | Cat# 711-035-152; RRID: AB_ 10015282 |
| Peroxidase AffiniPure Donkey anti-Guinea Pig | Jackson Immunoresearch | Cat# 706-035-148; RRID: AB_ 2340447 |
| Peroxidase AffiniPure Donkey anti-Mouse | Jackson Immunoresearch | Cat# 715-035-150; RRID: AB_ 2340770 |
| Alexa Fluor 594 goat anti-Mouse | Thermo Fisher Scientific | Cat# A11032; RRID: AB_ 2534091 |
| Alexa Fluor 488 goat anti-Rabbit | Thermo Fisher Scientific | Cat# A11034; RRID: AB_ 2576217 |
| Alexa Fluor 488 goat anti-Guinea Pig | Thermo Fisher Scientific | Cat# A11073; RRID: AB_2534117 |
| Alexa Fluor 594 goat anti-Rabbit | Thermo Fisher Scientific | Cat# A11037; RRID: AB_ 2534095 |
| Mouse monoclonal anti-MHC-I (28-14-8) APC conjugated | Thermo Fisher Scientific | Cat# 17-5999-80; RRID: AB_2573251 |
| Rat monoclonal anti-CD45 (30-F11) PE conjugated | Thermo Fisher Scientific | Cat# 12-0451-83; RRID: AB_ 465669 |
| Rat monoclonal anti-CD31 (Mec 13.3) PE conjugated | BD Biosciences | Cat# 553373; RRID: AB_ 394819 |
| Rat monoclonal anti-Ter-119 (Ter119) PE conjugated | eBioscience | Cat# 12-5921-81; RRID: AB_ 466041 |
| Ghost Dye Violet 450 | Tonbo Biosciences | Cat# 13–0863; RRID: N/A |
| Bacterial and Virus Strains | ||
| One Shot Top10 Chemically Competent E. coli | Invitrogen | Cat# C404003; RRID: N/A |
| Chemicals, Peptides, and Recombinant Proteins | ||
| Chloroquine diphosphate salt | Sigma-Aldrich | Cat# C6628; CAS: 50-63-5 |
| Rapamycin | LC Laboratories | Cat# R-5000; CAS: 53123-88-9 |
| Tamoxifen | Sigma-Aldrich | Cat# T5648; CAS: 10540-29-1 |
| 4-hydroxytamoxifen (4-OHT) | Sigma-Aldrich | Cat# H7904; CAS: 68047-06-3 |
| Collagenase-IV | Sigma-Aldrich | Cat# C5138; CAS: 9001-12-1 |
| Critical Commercial Assays | ||
| Pierce Bicinchoninic acid assay (BCA) | Thermo Fisher Scientific | Cat# 23225 |
| Enhanced chemiluminescence (ECL) | Thermo Fisher Scientific | Cat# 32106 |
| Vectastain Elite ABC HRP Kit (Rabbit) | Vector Labs | Cat# pk-6101 |
| Vectastain Elite ABC HRP Kit (Mouse) | Vector Labs | Cat# pk-6102 |
| NovaRed Substrate Kit | Vector Labs | Cat# sk-4800 |
| RNeasy Micro Kit | Qiagen | Cat# 74004 |
| Nextera XT DNA Library Preparation Kit | Illumina | Cat# FC-131–1096 |
| Nextera XT Index Kit | Illumina | Cat# FC-131–1002 |
| iTaq Universal SYBR Green Supermix | BioRad | Cat# 1725120 |
| Deposited Data | ||
| Mouse RNAseq data | This manuscript | GEO: #GSE124209 |
| Experimental Models: Cell Lines | ||
| R221a | Laboratory of Barbara Fingleton (Martin et al., 2008) | N/A |
| Hek293t | ATCC | CRL-3216; RRID: CVCL_0063 |
| Phoenix | ATCC | CRL-3213; RRID: CVCL_H716 |
| 4T1 | ATCC | CRL-2539; RRID:CVCL_0125 |
| HCC1143 | ATCC | CRL-2321; RRID:CVCL_1245 |
| HCC1806 | ATCC | CRL-2335; RRID:CVCL_1258 |
| MCF10A | ATCC | CRL-10317; RRID:CVCL_0598 |
| T47D | ATCC | HTB-133; RRID:CVCL_0553 |
| MCF7 | ATCC | HTB-22; RRID:CVCL_0031 |
| Experimental Models: Organisms/Strains | ||
| Mouse (C57BL/6): MMTV-PyMT; Tg(MMTV-PyVT)634Mul/LellJ | Laboratory of Zena Werb (Guy et al., 1992), The Jackson Laboratory | Stock# 022974; RRID: IMSR_JAX:022974 |
| Mouse (C57BL/6): ATG12F/F; Atg12tmt1.1Jdth | Generated in Debnath Laboratory (Malhotra et al., 2015) | MGI# 5784706; RRID: N/A |
| Mouse (C57BL/6): ATG5 F/F; Atg5tm1Myok | Laboratory of Noboru Mizushima (Hara et al., 2006) | MGI# 5784717; RRID: MGI:5784717 |
| Mouse (C57BL/6): GFP-LC3; Tg(CAG-EGFP/Map1lc3b)53Nmz/NmzRbrc | Laboratory of Noboru Mizushima (Mizushima et al., 2004) | MGI# 3759813; RRID: IMSR_RBRC00806 |
| Mouse (C57BL/6): CAG-CreER; B6.Cg-Tg(CAG-cre/Esr1*)5Amc/J | The Jackson Laboratory | Stock# 004682; RRID: IMSR_JAX:004682 |
| Mouse (C57BL/6): Naïve; C57BL/6J | The Jackson Laboratory | Stock# 000664; RRID: IMSR_JAX:000664 |
| Mouse (FVB): Naïve; FVB/NJ | The Jackson Laboratory | Stock# 001800; RRID: N/A |
| Mouse (BALB/c): Naïve; BALB/cJ | The Jackson Laboratory | Stock# 000651; RRID: IMSR_JAX:000651 |
| Oligonucleotides | ||
| shATG7 (mouse) | Sigma-Aldrich | TRCN0000092163 |
| shATG12 (mouse) | Sigma-Aldrich | TRCN0000257708 |
| shNBR1 #1 (mouse) | Sigma-Aldrich | TRCN0000123384 |
| shNBR1 #2 (mouse) | Sigma-Aldrich | TRCN0000123388 |
| shP62/SQSTM1 #1 (mouse) | Sigma-Aldrich | TRCN0000098617 |
| shP62/SQSTM1 #2 (mouse) | Sigma-Aldrich | TRCN0000098618 |
| shRUBCN (mouse) | This manuscript | N/A |
| shATG7 (human) | Sigma-Aldrich | TRCN0000007584 |
| shATG12 (human) | Sigma-Aldrich | TRCN0000007394 |
| shCTRL | Sigma-Aldrich | SHC002 |
| siATG7 (human) | Dharmacon | L-020112-00-0005 |
| siCTRL | Dharmacon | D-001810-10-20 |
| Mouse genotyping primer sequences, see Supplementary Table 2 | N/A | N/A |
| RT-qPCR primer sequences, see Supplementary Table 3 | N/A | N/A |
| Recombinant DNA | ||
| plKO.1 TRC Cloning vector | Addgene (Moffat et al., 2006) | Cat# 10878; RRID: Addgene 10878 |
| pWZL-3xFlag-N B R1 | Laboratory of Jorge Moscat (Hernandez et al., 2014) | N/A |
| pMXs-GFP-p62/SQSTM1 | Addgene (Itakura and Mizushima, 2011) | Cat# 38277; RRID: Addgene 38277 |
| pWZL-3xFlag-p62/SQSTM 1 | This manuscript | N/A |
| Software and Algorithms | ||
| ImageJ Fiji v2.0.0-rc-68/1.52h | (Schindelin et al., 2012) | https://fiii.sc/; RRID: SCR 002285 |
| Aperio ImageScope v12.2.2.5015 | Leica Biosystems | https://www.leicabiosystems.com/digitahpathology/manage/aperio-imagescope/; RRID: SCR 014311 |
| Kallisto v0.44.0 | (Bray et al., 2016) | https://pachterlab.github.io/kallisto/download; RRID:SCR 016582 |
| DeSeq2 v3.8 | (Love et al., 2014) | https://bioconductor.org/packages/release/bioc/html/DESeq2.html; RRID: SCR 015687 |
| GSEA v6.2 | (Subramanian et al., 2005) | http://software.broadinstitute.org/gsea/; RRID: SCR 003199 |
| GO Analysis v6.2 | (Subramanian et al., 2005) | http://software.broadinstitute.org/gsea/msigdb/; RRID: N/A |
| Pheatmap v1.0.10 | CRAN | https://cran.r-proiect.org/web/packages/pheatmap/; RRID: SCR_016418 |
| GraphPad Prism v8 | GraphPad Inc. | http://araphpad.com; RID: SCR_002798 |
Highlights.
Autophagy promotes primary tumor growth, yet suppresses metastatic outgrowth.
Autophagy-deficiency elicits a pro-metastatic basal tumor cell subpopulation.
NBR1 accumulation mediates the effects of autophagy inhibition on metastasis.
Enforced autophagy induction prevents the outgrowth of disseminated tumor cells.
Acknowledgments:
This study was supported by the University of California, San Francisco cores: Cancer Center Tissue, Parnassus Flow Cytometry (P30DK063720), and the Center for Advanced Technology. This study was funded by grants from the National Cancer Institute (CA201849, CA126792, CA213775 to J.D., and CA057621 to Z.W.), Department of Defense BCRP (W81XWH-11-1-0130 to J.D.), Samuel Waxman Cancer Research Foundation (to J.D.), and Oncology Research Fund (to Z.W. and H.G.), and by fellowship support from the National Cancer Institute (F31CA217015 to T.M, F31CA167905 to C.M.K., and T32CA108462 to E.R.S.), the Becas Chile Postdoctoral Fellowship (to H.G.), and the Cancer Research Society Scholarship for Next Generation of Scientists (to A.M.L).
Footnotes
Publisher's Disclaimer: This is a PDF file of an unedited manuscript that has been accepted for publication. As a service to our customers we are providing this early version of the manuscript. The manuscript will undergo copyediting, typesetting, and review of the resulting proof before it is published in its final form. Please note that during the production process errors may be discovered which could affect the content, and all legal disclaimers that apply to the journal pertain.
Declaration of Interests: Jayanta Debnath is a Scientific Advisory Board Member for Vescor Therapeutics, LLC. Zena Werb is a Scientific Advisory Board Member for Maverick Therapeutics, Inc.
References
- Barton CE, Johnson KN, Mays DM, Boehnke K, Shyr Y, Boukamp P, and Pietenpol JA (2010). Novel p63 target genes involved in paracrine signaling and keratinocyte differentiation. Cell Death Dis 1, e74. [DOI] [PMC free article] [PubMed] [Google Scholar]
- Bray NL, Pimentel H, Melsted P, and Pachter L (2016). Near-optimal probabilistic RNAseq quantification. Nat Biotechnol 34, 525–527. [DOI] [PubMed] [Google Scholar]
- Cameron MD, Schmidt EE, Kerkvliet N, Nadkarni KV, Morris VL, Groom AC, Chambers AF, and MacDonald IC (2000). Temporal progression of metastasis in lung: cell survival, dormancy, and location dependence of metastatic inefficiency. Cancer Res 60, 2541–2546. [PubMed] [Google Scholar]
- Cheung KJ, Gabrielson E, Werb Z, and Ewald AJ (2013). Collective invasion in breast cancer requires a conserved basal epithelial program. Cell 155, 1639–1651. [DOI] [PMC free article] [PubMed] [Google Scholar]
- Cheung KJ, Padmanaban V, Silvestri V, Schipper K, Cohen JD, Fairchild AN, Gorin MA, Verdone JE, Pienta KJ, Bader JS, et al. (2016). Polyclonal breast cancer metastases arise from collective dissemination of keratin 14-expressing tumor cell clusters. Proc Natl Acad Sci U S A 113, E854–863. [DOI] [PMC free article] [PubMed] [Google Scholar]
- Chude CI, and Amaravadi RK (2017). Targeting Autophagy in Cancer: Update on Clinical Trials and Novel Inhibitors. Int J Mol Sci 18. [DOI] [PMC free article] [PubMed] [Google Scholar]
- Duran A, Linares JF, Galvez AS, Wikenheiser K, Flores JM, Diaz-Meco MT, and Moscat J (2008). The signaling adaptor p62 is an important NF-kappaB mediator in tumorigenesis. Cancer Cell 13, 343–354. [DOI] [PubMed] [Google Scholar]
- Fata JE, Mori H, Ewald AJ, Zhang H, Yao E, Werb Z, and Bissell MJ (2007). The MAPK(ERK-1,2) pathway integrates distinct and antagonistic signals from TGFalpha and FGF7 in morphogenesis of mouse mammary epithelium. Dev Biol 306, 193–207. [DOI] [PMC free article] [PubMed] [Google Scholar]
- Fung C, Lock R, Gao S, Salas E, and Debnath J (2008). Induction of autophagy during extracellular matrix detachment promotes cell survival. Mol Biol Cell 19, 797–806. [DOI] [PMC free article] [PubMed] [Google Scholar]
- Galavotti S, Bartesaghi S, Faccenda D, Shaked-Rabi M, Sanzone S, McEvoy A, Dinsdale D, Condorelli F, Brandner S, Campanella M, et al. (2013). The autophagy-associated factors DRAM1 and p62 regulate cell migration and invasion in glioblastoma stem cells. Oncogene 32, 699–712. [DOI] [PubMed] [Google Scholar]
- Guo JY, Karsli-Uzunbas G, Mathew R, Aisner SC, Kamphorst JJ, Strohecker AM, Chen G, Price S, Lu W, Teng X, et al. (2013). Autophagy suppresses progression of K-ras-induced lung tumors to oncocytomas and maintains lipid homeostasis. Genes Dev 27, 1447–1461. [DOI] [PMC free article] [PubMed] [Google Scholar]
- Guy CT, Cardiff RD, and Muller WJ (1992). Induction of mammary tumors by expression of polyomavirus middle T oncogene: a transgenic mouse model for metastatic disease. Mol Cell Biol 12, 954–961. [DOI] [PMC free article] [PubMed] [Google Scholar]
- Hara T, Nakamura K, Matsui M, Yamamoto A, Nakahara Y, Suzuki-Migishima R, Yokoyama M, Mishima K, Saito I, Okano H, et al. (2006). Suppression of basal autophagy in neural cells causes neurodegenerative disease in mice. Nature 441, 885–889. [DOI] [PubMed] [Google Scholar]
- Hashemi-Sadraei N, Muller-Greven GM, Abdul-Karim FW, Ulasov I, Downs-Kelly E, Burgett ME, Lauko A, Qadan MA, Weil RJ, Ahluwalia MS, et al. (2018). Expression of LC3B and FIP200/Atg17 in brain metastases of breast cancer. J Neurooncol. [DOI] [PubMed] [Google Scholar]
- Haspel J, Shaik RS, Ifedigbo E, Nakahira K, Dolinay T, Englert JA, and Choi AM (2011). Characterization of macroautophagic flux in vivo using a leupeptin-based assay. Autophagy 7, 629–642. [DOI] [PMC free article] [PubMed] [Google Scholar]
- Hernandez ED, Lee SJ, Kim JY, Duran A, Linares JF, Yajima T, Muller TD, Tschop MH, Smith SR, Diaz-Meco MT, et al. (2014). A macrophage NBR1-MEKK3 complex triggers JNK-mediated adipose tissue inflammation in obesity. Cell Metab 20, 499–511. [DOI] [PMC free article] [PubMed] [Google Scholar]
- Itakura E, and Mizushima N (2011). p62 Targeting to the autophagosome formation site requires self-oligomerization but not LC3 binding. J Cell Biol 192, 17–27. [DOI] [PMC free article] [PubMed] [Google Scholar]
- Jain A, Lamark T, Sjottem E, Larsen KB, Awuh JA, Overvatn A, McMahon M, Hayes JD, and Johansen T (2010). p62/SQSTM1 is a target gene for transcription factor NRF2 and creates a positive feedback loop by inducing antioxidant response elementdriven gene transcription. J Biol Chem 285, 22576–22591. [DOI] [PMC free article] [PubMed] [Google Scholar]
- Kenific CM, Stehbens SJ, Goldsmith J, Leidal AM, Faure N, Ye J, Wittmann T, and Debnath J (2016). NBR1 enables autophagy-dependent focal adhesion turnover. J Cell Biol 212, 577–590. [DOI] [PMC free article] [PubMed] [Google Scholar]
- Lazova R, Camp RL, Klump V, Siddiqui SF, Amaravadi RK, and Pawelek JM (2012). Punctate LC3B expression is a common feature of solid tumors and associated with proliferation, metastasis, and poor outcome. Clin Cancer Res 18, 370–379. [DOI] [PMC free article] [PubMed] [Google Scholar]
- Lim E, Wu D, Pal B, Bouras T, Asselin-Labat ML, Vaillant F, Yagita H, Lindeman GJ, Smyth GK, and Visvader JE (2010). Transcriptome analyses of mouse and human mammary cell subpopulations reveal multiple conserved genes and pathways. Breast Cancer Res 12, R21. [DOI] [PMC free article] [PubMed] [Google Scholar]
- Love MI, Huber W, and Anders S (2014). Moderated estimation of fold change and dispersion for RNA-seq data with DESeq2. Genome Biol 15, 550. [DOI] [PMC free article] [PubMed] [Google Scholar]
- Luzzi KJ, MacDonald IC, Schmidt EE, Kerkvliet N, Morris VL, Chambers AF, and Groom AC (1998). Multistep nature of metastatic inefficiency: dormancy of solitary cells after successful extravasation and limited survival of early micrometastases. Am J Pathol 153, 865–873. [DOI] [PMC free article] [PubMed] [Google Scholar]
- Malhotra R, Warne JP, Salas E, Xu AW, and Debnath J (2015). Loss of Atg12, but not Atg5, in pro-opiomelanocortin neurons exacerbates diet-induced obesity. Autophagy 11, 145–154. [DOI] [PMC free article] [PubMed] [Google Scholar]
- Martin MD, Carter KJ, Jean-Philippe SR, Chang M, Mobashery S, Thiolloy S, Lynch CC, Matrisian LM, and Fingleton B (2008). Effect of ablation or inhibition of stromal matrix metalloproteinase-9 on lung metastasis in a breast cancer model is dependent on genetic background. Cancer Res 68, 6251–6259. [DOI] [PMC free article] [PubMed] [Google Scholar]
- Mizushima N, Yamamoto A, Matsui M, Yoshimori T, and Ohsumi Y (2004). In vivo analysis of autophagy in response to nutrient starvation using transgenic mice expressing a fluorescent autophagosome marker. Mol Biol Cell 15, 1101–1111. [DOI] [PMC free article] [PubMed] [Google Scholar]
- Moffat J, Grueneberg DA, Yang X, Kim SY, Kloepfer AM, Hinkle G, Piqani B, Eisenhaure TM, Luo B, Grenier JK, et al. (2006). A lentiviral RNAi library for human and mouse genes applied to an arrayed viral high-content screen. Cell 124, 1283–1298. [DOI] [PubMed] [Google Scholar]
- Moscat J, Karin M, and Diaz-Meco MT (2016). p62 in Cancer: Signaling Adaptor Beyond Autophagy. Cell 167, 606–609. [DOI] [PMC free article] [PubMed] [Google Scholar]
- Moulis M, and Vindis C (2017). Methods for Measuring Autophagy in Mice. Cells 6. [DOI] [PMC free article] [PubMed] [Google Scholar]
- Peng YF, Shi YH, Shen YH, Ding ZB, Ke AW, Zhou J, Qiu SJ, and Fan J (2013). Promoting colonization in metastatic HCC cells by modulation of autophagy. PLoS One 8, e74407. [DOI] [PMC free article] [PubMed] [Google Scholar]
- Perera RM, Stoykova S, Nicolay BN, Ross KN, Fitamant J, Boukhali M, Lengrand J, Deshpande V, Selig MK, Ferrone CR, et al. (2015). Transcriptional control of autophagy-lysosome function drives pancreatic cancer metabolism. Nature 524, 361–365. [DOI] [PMC free article] [PubMed] [Google Scholar]
- Picelli S, Faridani OR, Bjorklund AK, Winberg G, Sagasser S, and Sandberg R (2014). Full-length RNA-seq from single cells using Smart-seq2. Nat Protoc 9, 171–181. [DOI] [PubMed] [Google Scholar]
- Qiang L, Zhao B, Ming M, Wang N, He TC, Hwang S, Thorburn A, and He YY (2014). Regulation of cell proliferation and migration by p62 through stabilization of Twist1. Proc Natl Acad Sci U S A 111, 9241–9246. [DOI] [PMC free article] [PubMed] [Google Scholar] [Retracted]
- Rabinowitz JD, and White E (2010). Autophagy and metabolism. Science 330, 1344–1348. [DOI] [PMC free article] [PubMed] [Google Scholar]
- Rao S, Tortola L, Perlot T, Wirnsberger G, Novatchkova M, Nitsch R, Sykacek P, Frank L, Schramek D, Komnenovic V, et al. (2014). A dual role for autophagy in a murine model of lung cancer. Nat Commun 5, 3056. [DOI] [PubMed] [Google Scholar]
- Rosenfeldt MT, O’Prey J, Morton JP, Nixon C, MacKay G, Mrowinska A, Au A, Rai TS, Zheng L, Ridgway R, et al. (2013). p53 status determines the role of autophagy in pancreatic tumour development. Nature 504, 296–300. [DOI] [PubMed] [Google Scholar]
- Schindelin J, Arganda-Carreras I, Frise E, Kaynig V, Longair M, Pietzsch T, Preibisch S, Rueden C, Saalfeld S, Schmid B, et al. (2012). Fiji: an open-source platform for biological-image analysis. Nat Methods 9, 676–682. [DOI] [PMC free article] [PubMed] [Google Scholar]
- Sharifi MN, Mowers EE, Drake LE, Collier C, Chen H, Zamora M, Mui S, and Macleod KF (2016). Autophagy Promotes Focal Adhesion Disassembly and Cell Motility of Metastatic Tumor Cells through the Direct Interaction of Paxillin with LC3. Cell Rep 15, 1660–1672. [DOI] [PMC free article] [PubMed] [Google Scholar]
- Subramanian A, Tamayo P, Mootha VK, Mukherjee S, Ebert BL, Gillette MA, Paulovich A, Pomeroy SL, Golub TR, Lander ES, et al. (2005). Gene set enrichment analysis: a knowledge-based approach for interpreting genome-wide expression profiles. Proc Natl Acad Sci U S A 102, 15545–15550. [DOI] [PMC free article] [PubMed] [Google Scholar]
- Sun P, Yuan Y, Li A, Li B, and Dai X (2010). Cytokeratin expression during mouse embryonic and early postnatal mammary gland development. Histochem Cell Biol 133, 213–221. [DOI] [PMC free article] [PubMed] [Google Scholar]
- Takamura A, Komatsu M, Hara T, Sakamoto A, Kishi C, Waguri S, Eishi Y, Hino O, Tanaka K, and Mizushima N (2011). Autophagy-deficient mice develop multiple liver tumors. Genes Dev 25, 795–800. [DOI] [PMC free article] [PubMed] [Google Scholar]
- Wei H, Wang C, Croce CM, and Guan JL (2014). p62/SQSTM1 synergizes with autophagy for tumor growth in vivo. Genes Dev 28, 1204–1216. [DOI] [PMC free article] [PubMed] [Google Scholar]
- Wei H, Wei S, Gan B, Peng X, Zou W, and Guan JL (2011). Suppression of autophagy by FIP200 deletion inhibits mammary tumorigenesis. Genes Dev 25, 1510–1527. [DOI] [PMC free article] [PubMed] [Google Scholar]
- Yalcin-Ozuysal O, Fiche M, Guitierrez M, Wagner KU, Raffoul W, and Brisken C (2010). Antagonistic roles of Notch and p63 in controlling mammary epithelial cell fates. Cell Death Differ 17, 1600–1612. [DOI] [PubMed] [Google Scholar]
- Zaffagnini G, and Martens S (2016). Mechanisms of Selective Autophagy. J Mol Biol 428, 1714–1724. [DOI] [PMC free article] [PubMed] [Google Scholar]
Associated Data
This section collects any data citations, data availability statements, or supplementary materials included in this article.
Supplementary Materials
Data Availability Statement
Accession Numbers
RNA sequencing raw counts and annotated DESeq2 analysis in this study (displayed in Figure 2) can be found on the NCBI Gene Expression Omnibus (#GSE124209). Raw sequencing data is available on NCBI Sequence Read Archive.