

Abstract
Rodents have at least five carboxylesterase 1 (Ces1) genes, whereas there is only one CES1 gene in humans, raising the question as to whether human CES1 and mouse Ces1 genes share the same functions. In this study, we investigate the role of human CES1 in the development of steatohepatitis or dyslipidemia in C57BL/6 mice. Hepatocyte‐specific expression of human CES1 prevented Western diet or alcohol‐induced steatohepatitis and hyperlipidemia. Mechanistically, human CES1 induced lipolysis and fatty acid oxidation, leading to a reduction in hepatic triglyceride and free fatty acid levels. Human CES1 also reduced hepatic‐free cholesterol levels and induced low‐density lipoprotein receptor. In addition, human CES1 induced hepatic lipoprotein lipase and apolipoprotein C‐II expression. Conclusion: Hepatocyte‐specific overexpression of human CES1 attenuates diet‐induced steatohepatitis and hyperlipidemia.
Human CES1 has triglyceride hydrolase activity and promotes fatty acid oxidation. Hepatocyte‐specific overexpression of human CES1 attenuates Western diet or alcohol‐induced steatohepatitis and hyperlipidemia.
Abbreviations
- AAV8
adeno‐associated virus serotype 8
- Abcg
ATP‐binding cassette group G
- AFLD
alcoholic fatty liver disease
- ALT
alanine aminotransferase
- AST
aspartate aminotransferase
- ApoC‐II
apolipoprotein C‐II
- CASP3
caspase 3
- CD36
cluster differentiation factor 36
- CEH
cholesteryl ester hydrolase
- CES1
carboxylesterase 1
- Cpt1/2
carnitine palmitoyltransferase 1 and 2
- CYP7A1
cholesterol 7α‐hydroxylase
- EtOH
ethanol
- FAO
fatty acid oxidation
- FC
free cholesterol
- FFA
free fatty acid
- FLD
fatty liver disease
- FPLC
fast protein liquid chromatography
- FXR
farnesoid X receptor
- GC‐MS
gas chromatography–mass spectrometry
- HDL‐C
high‐density lipoprotein cholesterol
- IL
interleukin
- LDL‐C
low‐density lipoprotein cholesterol
- LDLR
low‐density lipoprotein receptor
- LPL
lipoprotein lipase
- MDA
malondialdehyde
- NAFLD
nonalcoholic fatty liver disease
- PCR
polymerase chain reaction
- Pdk4
pyruvate dehydrogenase kinase isozyme 4
- PPARα
peroxisome proliferator‐activated receptor α
- ROS
reactive oxygen species
- Smad2/3
mothers against decapentaplegic homolog family members 2 and 3
- SREBP‐2
sterol regulatory element‐binding protein 2
- TC
total cholesterol
- TG
triglyceride
- TGH
triglyceride hydrolase
- TNFα
tumor necrosis factor α
- TUNEL
triglyceride terminal deoxynucleotidyl transferase–mediated deoxyuridine triphosphate nick‐end labeling
- VLDL
very low density lipoprotein
Fatty liver disease (FLD), characterized by abnormal lipid accumulation within hepatocytes, can be classified into nonalcoholic fatty liver disease (NAFLD) and alcoholic fatty liver disease (AFLD). FLD ranges from simple steatosis to steatohepatitis, which may further progress to cirrhosis and hepatocellular carcinoma.1, 2 Despite extensive research, the pathophysiology of FLD is not well understood.
In addition, no Food and Drug Administration–approved therapies are available for treatment of FLD.
Carboxylesterase 1 (CES1) is a drug‐metabolizing enzyme that has the ability to hydrolyze amide or ester bonds.3 Mouse Ces1 has eight genes that are expressed in a wide variety of cell types and tissues.4 Among the eight mouse Ces1 genes, Ces1d and Ces1g are relatively well‐characterized, which share 78% and 74% homology in amino acids with human CES1, respectively. Mouse Ces1g has been shown to display triglyceride hydrolase (TGH) activity,5 and global or hepatocyte‐specific inactivation of mouse Ces1g causes fatty liver and a pro‐atherogenic lipid profile.5, 6 On the contrary, hepatic expression of Ces1g improves liver steatosis, dyslipidemia, and insulin signaling.5, 7, 8 Global inactivation of Ces1g is also shown to aggravate alcohol‐deficient or methionine/choline‐deficient diet‐induced liver inflammation and liver injury.9
In contrast to Ces1g, global or liver‐specific Ces1d−/− mice show reduced hepatic triglyceride accumulation and improved dyslipidemia and insulin sensitivity.10, 11, 12, 13 Interestingly, global loss of Ces1g or Ces1d attenuates the development of atherosclerosis in low‐density lipoprotein receptor (Ldlr−/−) mice.12, 14 In mice with global Ces1g deficiency, intestinal cholesterol and fat absorption is inhibited, whereas macrophage cholesterol efflux is increased,14 which may account for the athero‐protective effect of global Ces1g deficiency. Given that Ces1d and Ces1g have differing functions in lipid metabolism and that the functions of other Ces1 isoforms remain to be characterized, it is essential to investigate the role of human CES1 in lipid metabolism directly.
Human CES1 is abundantly expressed in liver and has been shown to have cholesteryl ester hydrolase (CEH) activities.15 Liver‐specific transgenic expression of human CES1 attenuates atherosclerosis in Ldlr−/− mice by promoting high‐density lipoprotein–mediated reverse cholesterol transport.16 In addition, macrophage‐selective overexpression of human CES1 also reduces atherosclerosis in Ldlr−/− mice through increased cholesterol efflux.17 So far, the role of human CES1 in regulating FLD or dyslipidemia remains to be determined.
In this report, we show that adeno‐associated virus serotype 8 (AAV8)–mediated overexpression of human CES1 in hepatocytes protects against high‐fat/high‐cholesterol/high‐fructose diet–induced or alcohol‐induced steatohepatitis and hyperlipidemia. We also investigated the underlying mechanisms. Our data suggest that human CES1 in hepatocytes is protective against metabolic disorders.
Materials and Methods
Mice and Diets
Twelve‐week‐old male C57BL/6J mice were purchased from the Jackson Laboratory (Bar Harbor, ME). Mice were fed for 16 weeks a high‐fat/high‐cholesterol/high‐fructose diet (Western diet) containing 40% fat/0.2% cholesterol (AIN‐76A; TestDiet, St. Louis, MO) and 4.2% fructose (in drinking water). The Lieber‐DeCarli diet was purchased from Bio‐Serv (Flemington, NJ). All of the animals received human care according to the criteria outlined in the “Guide for the Care and Use of Laboratory Animals” prepared by the National Academy of Sciences and published by the National Institutes of Health. Mice were fasted for 5 to 6 hours before euthanasia during the light cycle. All of the animal studies were approved by the Institutional Animal Care and Use Committee at Northeast Ohio Medical University.
Adeno‐associated Viruses
The coding sequence of human CES1 was amplified by polymerase chain reaction (PCR) and cloned into an AAV vector under the control of a mouse albumin promoter (AAV8‐ALB‐hCES1). The creation of AAV8‐ALB‐Null has been described previously.18 AAV8‐ALB‐hCES1 or AAV8‐ALB‐Null (control) was produced by packaging AAV plasmids into serotype 8 and titrated by Vector Biolabs (Malvern, PA). Each mouse was intravenously injected with 3 × 10¹¹ genomic copies of AAVs.
Chronic Plus Binge Alcohol Drinking
The chronic plus binge alcohol drinking was performed as described previously.9, 19 Briefly, C57BL/6J mice were administered a Lieber‐DeCarli control liquid diet (Cat # F1259SP; BioServ) for 5 days. On the sixth day, mice were fed a Lieber‐DeCarli liquid diet (Cat # F1258SP; BioServ) containing 5% (vol/vol) ethanol or pair‐fed a Lieber‐DeCarli control liquid diet for 10 days. On the 16th day, mice were gavaged with a single dose of ethanol (3 g/kg body weight) or isocaloric maltose dextrin.
Hepatic Biochemical Analyses and Staining
Approximately 100 mg of liver tissues were homogenized in methanol, and lipids were extracted in chloroform/methanol (2:1 vol/vol) as described.20 Hepatic triglycerides (TGs) and total cholesterol (TC) were measured using Infinity reagents from Thermo Fisher Scientific (Waltham, MA). Hepatic total free fatty acids (FFAs) and free cholesterol (FC) were determined using kits from Wako Chemicals USA (Richmond, VA). Hepatic fatty acid composition was analyzed by gas chromatography–mass spectrometry (GC‐MS) as previously described.21 Hepatic hydroxyproline level was quantified using a kit from Cell Biolabs (STA675; San Diego, CA). Hepatic malondialdehyde (MDA) levels were measured using a thiobarbituric acid reactive substances assay kit (STA‐330; Cell BioLabs), and hepatic reactive oxygen species (ROS) were measured using an OxiSelect in vitro ROS/RNS Assay kit (STA‐347; Cell BioLabs) as described.9, 18 Liver apoptosis was detected using a kit from Abcam (Cat # ab206386; Cambridge, United Kingdom). Hepatic neutral lipid accumulation, morphology, and fibrosis were determined by Oil Red O staining, hematoxylin and eosin staining, and picrosirius red staining, respectively, and images were acquired using an Olympus microscope.
Analysis of Plasma Lipids, Lipoproteins, and Biochemistry
Plasma levels of triglycerides, cholesterol, alanine aminotransferase (ALT) and aspartate aminotransferase (AST) were measured using Infinity reagents (Thermo Fisher Scientific). Plasma lipoprotein profile was analyzed by fast protein liquid chromatography (FPLC) as previously described.22 Plasma high‐density lipoprotein cholesterol (HDL‐C) and non‐HDL‐C levels were determined using a high‐density lipoprotein and low‐density lipoprotein/very low density lipoprotein (VLDL) quantification kit from BioVision Inc. (Cat # K613; Milpitas, CA). Plasma tumor necrosis factor α (TNFα), interleukin (IL)‐6, and IL‐1β levels were quantified using enzyme‐linked immunosorbent assay kits from PeproTech (Rocky Hill, NJ).
Real‐Time PCR and Western Blot Assays
Total RNA was isolated with TRIzol reagent (Thermo Fisher Scientific), and mRNA levels were quantified by quantitative real‐time PCR using Powerup SYBR Master mix (Thermo Fisher Scientific) on a 7500 Real Time PCR machine (Applied Biosystems, Foster City, CA). mRNA expression levels were normalized to 36B4. Western blot assays were performed using total cell lysates, microsomes, or nuclear extracts of the liver samples, as described previously.21 Antibodies against CES1 (cat # ab45957) and Tubulin (cat # ab4074) were purchased from Abcam. Antibodies against histone (Cat # 9671) or caspase 3 (CASP3; total [cat # 9661] or cleaved [cat # 9662]) were purchased from Cell Signaling Technology (Danvers, MA). Antibodies against LDLR (cat # NBP1‐06709), scavenger receptor group B type 1 (cat # NB400‐101), sterol regulatory element‐binding protein 2 (SREBP‐2; cat # NBP2‐20481), or calnexin (cat # NB1001965) were purchased from Novus Biologicals (Littleton, CO). Cluster differentiation factor 36 (CD36) antibody (cat # PA116813) was purchased from Thermo Fisher Scientific. Cholesterol 7α‐hydroxylase (CYP7A1) antibody was a gift from Dr. David Russell at the University of Texas Southwestern Medical School.
Bile Acid Extraction and Measurement
Bile acids in the liver, intestine, and gallbladder were extracted using ethanol. Bile acid levels in the liver, intestine, or gallbladder were determined using a bile acid kit (Diazyme, San Diego, CA). Total bile acids are the sum of bile acids in the liver, intestine, and gallbladder.
TGH Activity Assays
Hepatic microsome proteins were isolated, and TGH activity was measured using 3H‐triolein as substrates, as described previously.21
Fatty Acid Oxidation
C57BL/6 mice were injected intravenously with AAV8‐ALB‐NULL or AAV8‐ALB‐hCES1 at a dose of 3 × 10¹¹ genomic copies per mouse. After 72 hours, mouse primary hepatocytes were isolated and cultured in Dulbecco’s modified Eagle’s medium containing 10% fetal bovine serum in 12‐well dishes. Hepatocytes were then treated for 36 hours with media in the presence or absence of 100 mM ethanol. Fatty acid oxidation (FAO) was performed using 3H‐palmitate as substrates, as described previously.5
Body Fat Content Measurement
Body fat content was detected using Echo‐MRI (Echo‐MRI, LLC, Houston, TX) as described.23
Statistical Analysis
Statistical significance was analyzed using unpaired Student t test and analysis of variance (GraphPad Prism, GraphPad Software, San Diego, CA). All data were expressed as mean ± SEM. Differences were considered statistically significant at P < 0.05.
Results
Hepatocyte‐Specific Expression of Human CES1 Reduces Liver Steatosis by Promoting FAO in Western Diet–Fed Mice
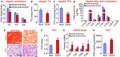
Given that multiple Ces1 genes exist in mice and they do not appear to function similarly, we reasoned that it was critical to investigate human CES1 functions directly. We therefore generated an AAV that expressed human CES1 under the control of a mouse albumin promoter (AAV8‐ALB‐hCES1). AAV8‐ALB‐hCES1 or AAV8‐ALB‐Null was injected intravenously into C57BL/6 mice, which were then fed a Western diet for 16 weeks. Overexpression of hCES1 in hepatocytes had no effect on body weight (Supporting Fig. S1A), but reduced body fat content (Supporting Fig. S1B) and hepatic levels of TC, FC (Fig. 1A), TGs (Fig. 1B), and FFAs (Fig. 1C). Analysis of hepatic fatty acid composition using GC‐MS showed that human CES1 overexpression reduced C16:1, C18:0, and C18:1 fatty acids by 48%, 38% and 44%, respectively, in Western diet–fed mice (Fig. 1D). Histological staining studies showed that human CES1 overexpression reduced neutral lipid accumulation and improved liver histology (Fig. 1E).
Figure 1.
Hepatocyte‐specific expression of human CES1 prevents Western diet–induced hepatosteatosis by promoting lipolysis and FAO. C57BL/6 mice were injected intravenously with AAV8‐ALB‐Null or AAV8‐ALB‐hCES1 at a dose of 3 × 10¹¹ genomic copies/mouse and fed a Western diet for 16 weeks (n = 8). (A) Hepatic cholesterol levels. (B) Hepatic TG levels. (C) Hepatic FFA levels. (D) Hepatic fatty acid composition analyzed by GC‐MS (n = 6‐8). (E) Representative images of liver sections stained with Oil Red O (top panel) or hematoxylin and eosin (bottom panel). (F) Liver microsome proteins were isolated and TGH activity was measured using 3H‐triolein as substrates. (G) Hepatic mRNA levels were quantified by quantitative real‐time PCR. (H) Mouse primary hepatocytes were isolated from C57BL/6 mice injected with AAV8‐ALB‐Null or AAV8‐ALB‐hCES1. FAO was determined using 3H‐palmitic acid as substrates (n = 5). *P < 0.05, **P < 0.01. Abbreviations: CE, cholesteryl ester; H&E, hematoxylin and eosin; ORO, Oil Red O.
Consistent with a reduced hepatic TG levels, overexpression of human CES1 increased hepatic TGH activity by 166% (Fig. 1F). Newly released FFAs from lipolysis are known to serve as ligands for peroxisome proliferator‐activated receptor α (PPARα) to activate FAO.5, 21, 24 Consistent with these findings, overexpression of human CES1 increased hepatic mRNA levels of Pparα and its target genes Cpt1 (carnitine palmitoyltransferase 1), Cpt2 and Pdk4 (pyruvate dehydrogenase kinase isozyme 4) (Fig. 1G), and increased FAO (Fig. 1H). The increased FAO may account for the reduced hepatic FFA levels (Fig. 1C). There was no change in hepatic levels of Ces1d, Ces1g or Hnf4α (Supporting Fig. S1C), or genes involved in de novo lipogenesis (Srebp1c, Cebpα, Acc, and Fasn) or VLDL secretion (Apob and Mttp) (Supporting Fig. S1D,E).
We have previously shown that fasting represses CES1 protein expression in the liver, likely due to reduced glucose availability.8 Consistent with this finding, fasting repressed the mRNA levels of Ces1d and Ces1g (Supporting Fig. S2). Thus, although CES1 has TGH activity, hepatic CES1 likely promotes lipolysis during the fed state, as glucose is shown to induce CES1 expression.8 In addition, we could not fully rule out the possibility that CES1 also regulates de novo lipogenesis. Taken together, the data of Fig. 1 demonstrate that human CES1 prevents Western diet–induced hepatosteatosis, likely by inducing lipolysis and FAO.
Hepatocyte‐Specific Expression of Human CES1 Ameliorates Western Diet–Induced Liver Inflammation, Apoptosis, and Fibrosis
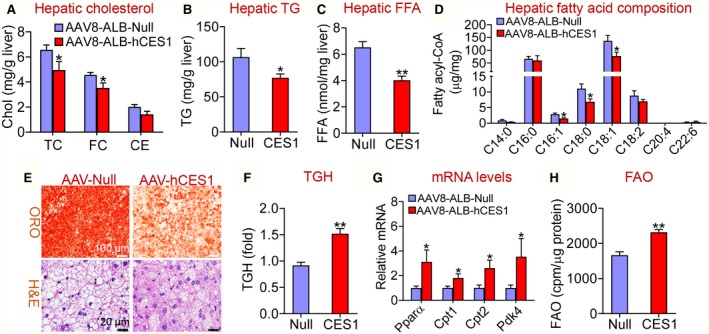
Excessive FFAs or FC can cause endoplasmic reticulum stress, mitochondrial dysfunction, apoptosis and inflammation,25, 26, 27 which play a key role in the progression of FLD from simple steatosis to steatohepatitis. The data of Fig. 1 and Table 1 indicate that human CES1 overexpression reduces hepatic FFA and FC levels, leading us to investigate whether human CES1 regulated apoptosis, inflammation, and liver injury. Hepatocyte‐specific overexpression of human CES1 reduced plasma ALT (Fig. 2A) and AST levels (Fig. 2B), and inhibited hepatic mRNA levels of inflammatory genes (Tnfα, Il‐6, Il‐1β, and Mcp1 [monocyte chemoattractant protein 1]) (Fig. 2C) and fibrogenic genes (Tgfβ [transforming growth factor β], α‐Sma [α smooth muscle actin], Timp1 [tissue inhibitor of metalloproteinase 1], Col1a1 [alpha‐1 type I collagen], and Col1a2 [alpha‐2 type I collagen]) (Fig. 2D).
Table 1.
Hepatic Fatty Acid Composition in Mice Fed an Alcohol Diet (μg/mg)
| Fatty Acids | Control Diet | Control Diet | EtOH Diet | EtOH Diet |
|---|---|---|---|---|
| AAV‐Null | AAV‐hCES1 | AAV‐Null | AAV‐hCES1 | |
| C14:0 | 0.128 ± 0.02 | 0.106 ± 0.017 | 0.308 ± 0.09‡ | 0.121 ± 0.02§ |
| C16:0 | 21.93 ± 3.36 | 37.49 ± 10.17 | 48.38 ± 4.98‡ | 34.26 ± 2.73§ |
| C16:1 | 0.338 ± 0.05 | 0.366 ± 0.06 | 0.768 ± 0.205 | 0.178 ± 0.037|| |
| C18:0 | 7.68 ± 0.31 | 6.2 ± 0.35*, † | 12.85 ± 1.13*, † | 8.41 ± 0.38|| |
| C18:1 | 25.27 ± 3.63 | 27.36 ± 3.22 | 61.71 ± 10.41*, † | 42.77 ± 0.65 |
| C18:2 | 11.64 ± 1.85 | 10.7 ± 1.26 | 43.36 ± 5.85‡ | 27.31 ± 1.78§ |
| C20:4 | 0.53 ± 0.15 | 0.146 ± 0.04*, † | 0.225 ± 0.05*, † | 0.023 ± 0.007|| |
| C22:6 | 7.99 ± 2.26 | 2.57 ± 0.51*, † | 3.34 ± 0.776*, † | 0.912 ± 0.05§ |
C57BL/6 mice were injected with AAV8‐ALB‐Null or AAV8‐ALB‐hCES1 and fed a control diet or EtOH diet. Hepatic fatty acid composition was analyzed by GC‐MS.
P < 0.05 versus control diet–fed AAV‐Null group.
P < 0.05.
P < 0.01 versus control diet–fed AAV‐Null group.
P < 0.05.
P < 0.01 versus EtOH diet–fed AAV‐Null group.
Figure 2.
Hepatocyte‐specific expression of human CES1 protects against Western diet–induced liver inflammation, apoptosis, and fibrosis in mice. C57BL/6 mice were injected intravenously with AAV8‐ALB‐Null or AAV8‐ALB‐hCES1 and fed a Western diet for 16 weeks (n = 8 per group). (A) Plasma ALT levels. (B) Plasma AST levels. Hepatic mRNA levels involved in inflammation (C) or fibrogenesis (D) were quantified by quantitative real‐time PCR. Hepatic proteins involved in apoptosis were detected by immunoblots (E) and quantified (F). (G) Apoptotic cells and fibrosis in the liver were stained by TUNEL assays (upper panel) and picrosirius red staining (bottom panel), respectively. (H) Quantification of apoptotic cells (percentage of total cells counted). (I) Hepatic hydroxyproline levels. (J) Hepatic 2′,7′‐dichlorodihydrofluorescein (ROS) levels. (K) Hepatic MDA levels. *P < 0.05, **P < 0.01. Abbreviations: DCF, 2′,7′‐dichlorodihydrofluorescein; P‐Smad, phosphorylated Smad2/3; T‐Smad, total Smad 2/3.
Smad2 and Smad3 (mothers against decapentaplegic homolog 2/3 [Smad2/3]) are closely related downstream effectors in TGFβ‐induced apoptosis.28, 29 Consistent with the inhibition of Tgfβ expression (Fig. 2D), phosphorylated Smad2/3 levels as well as CASP3 levels were significantly reduced by human CES1 overexpression (Fig. 2E,F). TUNEL (terminal deoxynucleotidyl transferase–mediated deoxyuridine triphosphate nick‐end labeling) studies showed that human CES1 overexpression significantly suppressed apoptosis (Fig. 2G,H). Overexpression of human CES1 also reduced fibrosis (Fig. 2G), hydroxyproline levels (Fig. 2I), reactive oxygen species (ROS) (Fig. 2J), and MDA levels (Fig. 2K) in the liver. These data demonstrate that hepatocyte‐specific expression of human CES1 attenuates Western diet–induced steatohepatitis by inhibiting ROS production, lipid peroxidation, apoptosis, and inflammation.
Hepatocyte‐Specific Expression of Human CES1 Improves Hyperlipidemia in Western Diet–Fed Mice
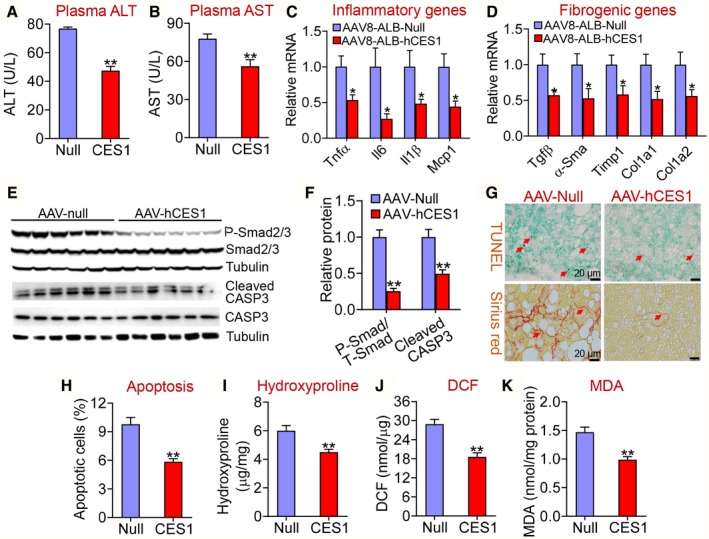
In addition to attenuating steatohepatitis, hepatocyte‐specific overexpression of human CES1 also reduced plasma levels of non‐HDL‐C (Fig. 3A), TG (Fig. 3B), and FFAs (Fig. 3C). Analysis of plasma lipoprotein profiles by FPLC showed that human CES1 reduced plasma low‐density lipoprotein cholesterol (LDL‐C) levels (Fig. 3D). In the liver, overexpression of human CES1 significantly induced the mRNA levels of Srebp2, Ldlr, Cyp7a1, ATP‐binding cassette group G type 5 (Abcg5), Abcg8, apolipoprotein C‐II (Apoc2), and lipoprotein lipase (Lpl), but repressed Cd36 mRNA levels (Fig. 3E). In addition, overexpression of human CES1 increased hepatic protein levels of LDLR, CYP7A1, and mature SREBP2 by 2.7, 2.2 and 2.9 fold, respectively, but reduced hepatic CD36 protein levels by 58% (Fig. 3F,G). Consistent with the induction of hepatic CYP7A1 expression, overexpression of human CES1 significantly increased bile acid levels in the intestine, liver, and gallbladder (Fig. 3H). The increased Abcg5 and Abcg8 expression may account for the reduced hepatic FC levels, which may subsequently promote the induction of SREBP2 and LDLR expression and a decrease in plasma LDL‐C levels. The induction in hepatic Apoc2 and Lpl may account for the reduced plasma TG levels.
Figure 3.
Hepatocyte‐specific expression of human CES1 ameliorates Western diet–induced hyperlipidemia by inducing LDLR, ApoC‐II, and LPL. C57BL/6 mice were injected intravenously with AAV8‐ALB‐Null or AAV8‐ALB‐hCES1 and fed a Western diet for 16 weeks (n = 8 per group). Plasma levels of cholesterol (A), TG (B), and FFA were measured. (D) Plasma cholesterol lipoprotein profile was analyzed by FPLC. Hepatic mRNA levels were quantified by quantitative real‐time PCR (E). (F,G) Hepatic protein levels were determined by Western blotting. (H) Bile acid levels in the small intestine, gallbladder, or liver were measured, and total bile acid levels were determined. *P < 0.05, **P < 0.01. Abbreviations: GB, gallbladder; SI, small intestine.
Hepatocyte‐Specific Expression of Human CES1 Increases Lipolysis and FAO and Attenuates Alcohol‐Induced Hepatosteatosis
Although NAFLD and AFLD share the similar pathogenic spectrum (simple steatosis and steatohepatitis), their pathogenic causes are completely different. To investigate whether human CES1 also had a similar effect on AFLD, we fed C57BL/6 mice with a Lieber‐Decarli diet containing 5% ethanol or pair‐fed a control diet following a National Institute on Alcohol Abuse and Alcoholism protocol.19 The chronic plus binge ethanol feeding did not affect mouse body weight (Supporting Fig. S3A) or body fat content (Supporting Fig. S3B). Ethanol feeding significantly increased plasma levels of ALT (Fig. 4A) and AST (Fig. 4B) as well as hepatic levels of TG (Fig. 4C) and FFA (Fig. 4D). These increases were significantly attenuated by hepatocyte‐specific overexpression of human CES1 (Fig. 4A‐D). Oil red O staining showed that human CES1 reduced ethanol‐induced neutral lipid accumulation (Fig. 4E). In contrast, overexpression of human CES1 had no effect on ethanol‐induced changes in genes involved in de novo lipogenesis (Srebp1c, Acc, and Fasn) or VLDL secretion (Apob and Mttp) (Supporting Fig. S3C‐G).
Figure 4.
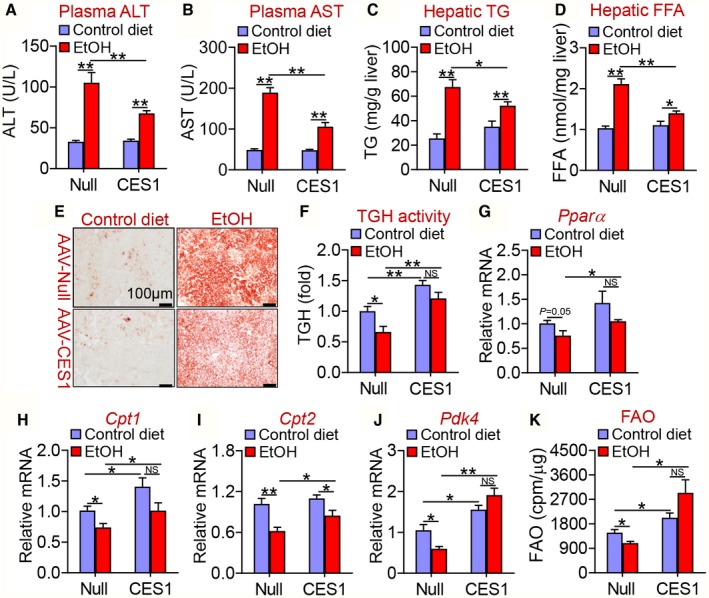
Hepatocyte‐specific expression of human CES1 protects against alcohol‐induced liver steatosis. C57BL/6 mice were injected intravenously with AAV8‐ALB‐Null or AAV8‐ALB‐hCES1 (n = 16). After 2 weeks, the mice were fed a Lieber‐DeCarli control liquid diet for 5 days, followed by a Lieber‐DeCarli ethanol diet or pair‐fed a control diet for 10 days (n = 8). On the 16th day, a single dose of ethanol (3 g/kg) or isocaloric maltose dextrin was administered. Plasma levels of ALT (A) and AST (B) as well as hepatic levels of TG (C) and FFA (D) were determined. (E) Hepatic neutral lipids were stained by Oil Red O. (F) Hepatic TGH activity was analyzed. Hepatic mRNA levels of Pparα (G), Cpt1 (H), Cpt2 (I), and Pdk4 (J) were quantified by quantitative real‐time PCR. (K) C57BL/6 mice were injected intravenously with AAV8‐ALB‐null or AAV8‐ALB‐hCES1. After 72 hours, mouse primary hepatocytes were isolated and treated for 36 hours with 100 mM ethanol or control media. FAO was determined using 3H‐palmitic acid as substrates (n = 4‐5). *P < 0.05, **P < 0.01. Abbreviation: EtOH, ethanol.
Ethanol feeding repressed hepatic TGH activity (Fig. 4F) and hepatic genes involved in FAO, including Pparα (Fig. 4G), Cpt1 (Fig. 4H), Cpt2 (Fig. 4I) and Pdk4 (Fig. 4J), which were all normalized by overexpression of human CES1 in hepatocytes (Fig. 4F‐J). In line with these findings, ethanol inhibited FAO in hepatocytes, which was normalized by overexpression of human CES1 (Fig. 4K). Thus, human CES1 attenuates alcohol‐induced hepatosteatosis likely by enhancing lipolysis and FAO.
In addition, we also analyzed hepatic fatty acid composition by GC‐MS. Alcohol treatment markedly increased C14:0, C16:0, C18:0, C18:1, and C18:2 fatty acid levels by 167%‐372%, and interestingly decreased C20:4 and C22:6 fatty acid levels, but did not change C16:1 fatty acid levels (Table 1). Overexpression of human CES1 in hepatocytes significantly attenuated alcohol‐induced increases in C14:0, C16:0, C16:1, C18:0, and C18:2 fatty acid levels, and reduced C20:4 and C22:6 fatty acid levels (Table 1). These data are consistent with a role of human CES1 in promoting FAO. Together, our data indicate that human CES1 attenuates alcohol‐induced hepatosteatosis likely by enhancing lipolysis and FAO.
Hepatocyte‐Specific Expression of Human CES1 Ameliorates Alcohol‐Induced Hyperlipidemia
In addition to improving alcohol‐induced hepatosteatosis, human CES1 expression also reduced ethanol‐induced increases in plasma non‐HDL‐C levels (Fig. 5A). There was no change in plasma HDL‐C levels (Fig. 5B). In addition, human CES1 normalized ethanol‐induced increases in plasma TG (Fig. 5C) and FFA (Fig. 5D) levels. Consistent with these findings, overexpression of human CES1 normalized or increased hepatic expression of Ldlr (Fig. 5E), Cyp7a1 (Fig. 5F), Srebp2 (Fig. 5G), Abcg5 (Fig. 5H), or Abcg8 (Fig. 5I) in alcohol‐fed mice. Alcohol increased Cd36 mRNA levels, which were completely normalized by human CES1 (Fig. 5J). In addition, human CES1 increased Apoc2 (Fig. 5K) and Lpl (Fig. 5L) expression in alcohol‐fed mice. Our western blot assays further confirmed the mRNA expression data shown for Ldlr, Cyp7a1, and Srebp2 (Fig. 5M).
Figure 5.
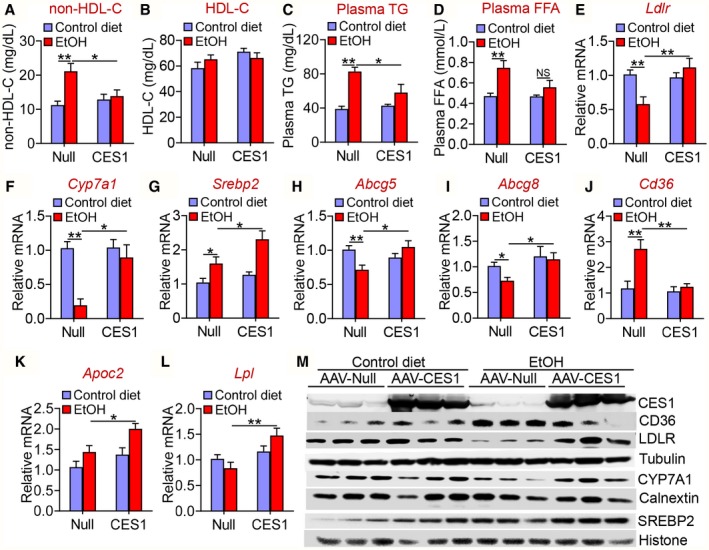
Human CES1 prevents alcohol‐induced hyperlipidemia. C57BL/6 mice were fed a control diet or alcohol as described in Fig. 4 (n = 8 per group). Plasma levels of non‐HDL‐C (A), HDL‐C (B), TG (C), and FFA (D) were determined. Hepatic mRNA levels of Ldlr (E), Cyp7a1 (F), Srebp2 (G), Abcg5 (H), Abcg8 (I), Cd36 (J), Apoc2 (K), and Lpl (L) were quantified by quantitative real‐time PCR. (M) Hepatic proteins were analyzed by western blotting. *P < 0.05, **P < 0.01.
Hepatocyte‐Specific Expression of Human CES1 Inhibits Inflammation in Alcohol‐Fed Mice
Inflammation plays an important role in the pathogenesis of alcoholic liver disease. Alcohol feeding significantly increased hepatic mRNA levels of inflammatory genes including Tnfα (Fig. 6A), Il‐6 (Fig. 6B), Il‐1β (Fig. 6C) and Mcp1 (Fig. 6D), as well as fibrogenic genes including Tgfβ (Fig. 6E), α‐Sma (Fig. 6F), Col1a1 (Fig. 6G), and Col1a2 (Fig. 6H). Overexpression of human CES1 decreased or normalized alcohol‐induced increases in these inflammatory or fibrogenic gene expression (Fig. 6A‐H). In addition, overexpression of human CES1 also normalized alcohol‐induced increases in plasma levels of TNFα (Fig. 6I), IL‐6 (Fig. 6J), and IL‐1β (Fig. 6K). Thus, human CES1 can prevent alcohol‐induced inflammatory response.
Figure 6.
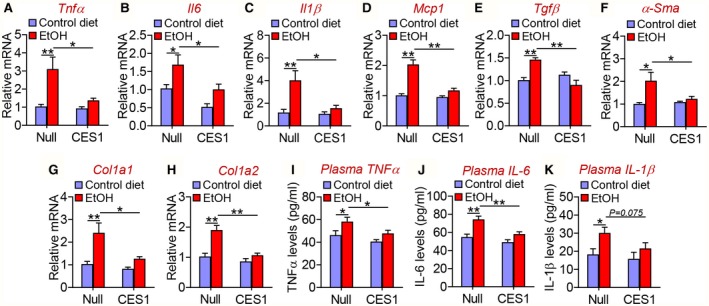
Human CES1 prevents alcohol‐induced increases in pro‐inflammatory and fibrogenic genes. C57BL/6 mice were fed a control diet or alcohol as described in Fig. 4 (n = 8 per group). Hepatic mRNA levels (A‐H) and plasma levels of TNFα (I), IL‐6 (J), and IL‐1β (K) were determined. *P < 0.05, **P < 0.01.
Human CES1 Prevents Alcohol‐Induced Apoptosis
Alcohol‐induced apoptosis plays an important role in the development of AFLD. Alcohol significantly induced hepatic apoptosis, which was blunted by human CES1 overexpression (Fig. 7A,B). In addition, human CES1 also attenuated alcohol‐induced increases in hepatic MDA (Fig. 7C) and ROS (Fig. 7D) levels. Consistent with these observations, alcohol induced hepatic phosphorylated Smad2/3 and cleaved CASP3 levels, which were normalized or attenuated by overexpression of human CES1 (Fig. 7E‐G). Thus, hepatocyte‐specific expression of human CES1 prevents alcohol‐induced apoptosis likely by inhibiting ROS production, lipid peroxidation, and the TGFβ‐Smad2/3 pathway.
Figure 7.
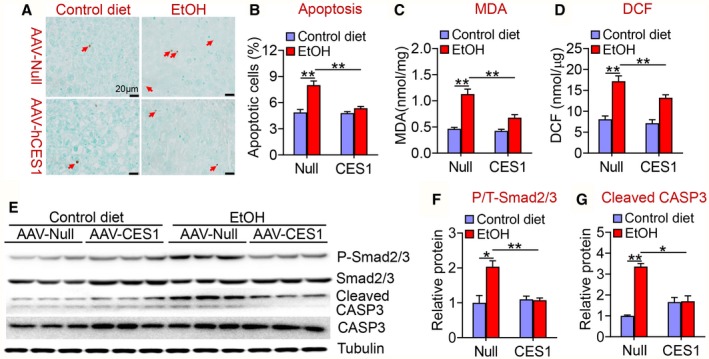
Human CES1 reduces alcohol‐induced apoptosis and ROS formation. C57BL/6 mice were fed a control diet or alcohol as described in Fig. 4 (n = 8 per group). (A) Representative images of TUNEL staining. (B) Hepatic apoptotic cells (percentage). (C) Hepatic MDA levels. (D) Hepatic 2',7'‐dichlorodihydrofluorescein levels. Hepatic proteins were detected by western blot assays (E), and hepatic phosphorylated versus total Smad2/3 (P/T‐Smad2/3) levels (F) and CASP3 levels (G) were determined. *P < 0.05, **P < 0.01. Abbreviation: DCF, 2',7'‐dichlorodihydrofluorescein.
Discussion
FLD is one of the most common chronic liver diseases worldwide. So far, the pathogenic mechanisms remain to be determined. In patients with alcoholic liver disease, hepatic CES1 expression is reduced by 75%.9 However, the role of human CES1 in FLD remains unknown. Because mice have eight Ces1 genes (Ces1a‐Ces1h) that have shown inconsistent functions, it is unlikely to infer what functions human CES1 may have based on mouse studies in which specific mouse Ces1 gene is overexpressed or depleted. Therefore, it is imperative to investigate human CES1 using an appropriate approach. In this study, we overexpressed human CES1 specifically in mouse hepatocytes in vivo. Our data show that hepatocyte‐specific expression of human CES1 protects against Western diet or alcohol‐induced steatohepatitis, thus suggesting a role of human CES1 in the pathogenesis of FLD.
Previous studies have shown that human CES1 has CEH activity.19 When human CES1 hydrolyzes, cholesterol esters release FC, which may be oxidized to serve as a ligand for liver X receptors (LXRs). Activation of LXRs is known to induce the expression of CYP7A1,30 ABCG5, and ABCG8.31 When CYP7A1 is induced, more FC is converted to bile acids, leading to a reduction in hepatic FC levels. The reduced hepatic FC levels can induce SREBP2 expression and processing, leading to an increase in LDLR expression and uptake of LDL by hepatocytes. As a result, overexpression of human CES1 in the liver reduces plasma LDL‐C levels. In addition, human CES1 also induces hepatic ApoC‐II and LPL expression, which may account for the reduced plasma TG levels. Bile acids are endogenous ligands for farnesoid X receptor (FXR). Activation of the FXR is known to induce ApoC‐II,32 a co‐activator of LPL. Because human CES1 induces CYP7A1 expression and bile acid synthesis, CES1 induces ApoC‐II expression likely by activation of FXR.
In addition to the CEH activity shown by the Ghosh et al.,19 we demonstrate that human CES1 has TGH activity. By hydrolyzing TG to release FFAs, human CES1 promotes FAO to lower hepatic TG and FFA levels. Interestingly, human CES1 does not regulate genes involved in de novo lipogenesis or VLDL secretion. Although we cannot fully rule out the possibility that human CES1 may regulate de novo lipogenesis or VLDL secretion, our data suggest that human CES1 lowers hepatic TG levels likely by inducing lipolysis and subsequent FAO.
The progression of FLD from simple steatosis to steatohepatitis needs additional “hits,” such as ROS, apoptosis, and/or inflammation. FFA or FC‐induced lipotoxicity contributes to lipid peroxidation, ROS production, apoptosis, and inflammation.25, 26, 27 In our current study, we demonstrate that human CES1 overexpression reduces hepatic FFA and FC levels, lipid peroxidation, ROS production, apoptosis and inflammation, which together help address how human CES1 overexpression attenuates steatohepatitis.
In summary, our present data have demonstrated an important role of human CES1 in the pathogenesis of FLD and hyperlipidemia. Importantly, we have also uncovered the underlying mechanisms, which likely involve both the CEH and TGH activities of CES1. Our data suggest that human CES1 may be a useful drug target for treatment of FLD and related hyperlipidemia.
Supporting information
This work was supported by the National Institutes of Health grants R21AA024946 (Y.Z.), R01DK102619 (Y.Z.), R01HL103227 (Y.Z. and L.Y), R01HL142086 (Y.Z.), and R01DK118941 (Y.Z.)
Potential conflict of interest: Nothing to report.
References
Author names in bold designate shared co‐first authorship.
- 1. Li Y, Jadhav K, Zhang Y. Bile acid receptors in non‐alcoholic fatty liver disease. Biochem Pharmacol 2013;86:1517‐1524. [DOI] [PMC free article] [PubMed] [Google Scholar]
- 2. Scaglioni F, Ciccia S, Marino M, Bedogni G, Bellentani S. ASH and NASH. Dig Dis 2011;29:202‐210. [DOI] [PubMed] [Google Scholar]
- 3. Satoh T, Hosokawa M. The mammalian carboxylesterases: from molecules to functions. Annu Rev Pharmacol Toxicol 1998;38:257‐288. [DOI] [PubMed] [Google Scholar]
- 4. Holmes RS, Wright MW, Laulederkind SJ, Cox LA, Hosokawa M, Imai T, et al. Recommended nomenclature for five mammalian carboxylesterase gene families: human, mouse, and rat genes and proteins. Mamm Genome 2010;21:427‐441. [DOI] [PMC free article] [PubMed] [Google Scholar]
- 5. Xu J, Li Y, Chen WD, Xu Y, Yin L, Ge X, et al. Hepatic carboxylesterase 1 is essential for both normal and farnesoid X receptor‐controlled lipid homeostasis. Hepatology 2014;59:1761‐1771. [DOI] [PMC free article] [PubMed] [Google Scholar]
- 6. Quiroga AD, Li L, Trotzmuller M, Nelson R, Proctor SD, Kofeler H, et al. Deficiency of carboxylesterase 1/esterase‐x results in obesity, hepatic steatosis, and hyperlipidemia. Hepatology 2012;56:2188‐2198. [DOI] [PubMed] [Google Scholar]
- 7. Bahitham W, Watts R, Nelson R, Lian J, Lehner R. Liver‐specific expression of carboxylesterase 1g/esterase‐x reduces hepatic steatosis, counteracts dyslipidemia and improves insulin signaling. Biochim Biophys Acta 2016;1861:482‐490. [DOI] [PubMed] [Google Scholar]
- 8. Xu J, Yin L, Xu Y, Li Y, Zalzala M, Cheng G, et al. Hepatic carboxylesterase 1 is induced by glucose and regulates postprandial glucose levels. PLoS One 2014;9:e109663. [DOI] [PMC free article] [PubMed] [Google Scholar]
- 9. Xu J, Xu Y, Li Y, Jadhav K, You M, Yin L, et al. Carboxylesterase 1 is regulated by hepatocyte nuclear factor 4alpha and protects against alcohol‐ and MCD diet‐induced liver injury. Sci Rep 2016;6:24277. [DOI] [PMC free article] [PubMed] [Google Scholar]
- 10. Wei E, Ben Ali Y, Lyon J, Wang H, Nelson R, Dolinsky VW, et al. Loss of TGH/Ces3 in mice decreases blood lipids, improves glucose tolerance, and increases energy expenditure. Cell Metab 2010;11:183‐193. [DOI] [PubMed] [Google Scholar]
- 11. Lian J, Wei E, Wang SP, Quiroga AD, Li L, Di Pardo A, et al. Liver specific inactivation of carboxylesterase 3/triacylglycerol hydrolase decreases blood lipids without causing severe steatosis in mice. Hepatology 2012;56:2154‐2162. [DOI] [PubMed] [Google Scholar]
- 12. Lian J, Quiroga AD, Li L, Lehner R. Ces3/TGH deficiency improves dyslipidemia and reduces atherosclerosis in Ldlr(−/−) mice. Circ Res 2012;111:982‐990. [DOI] [PubMed] [Google Scholar]
- 13. Lian J, Wei E, Groenendyk J, Das SK, Hermansson M, Li L, et al. Ces3/TGH deficiency attenuates steatohepatitis. Sci Rep 2016;6:25747. [DOI] [PMC free article] [PubMed] [Google Scholar]
- 14. Xu J, Xu Y, Xu Y, Yin L, Zhang Y. Global inactivation of carboxylesterase 1 (Ces1/Ces1g) protects against atherosclerosis in Ldlr−/− mice. Sci Rep 2017;7:17845. [DOI] [PMC free article] [PubMed] [Google Scholar]
- 15. Ghosh S, St Clair RW, Rudel LL. Mobilization of cytoplasmic CE droplets by overexpression of human macrophage cholesteryl ester hydrolase. J Lipid Res 2003;44:1833‐1840. [DOI] [PubMed] [Google Scholar]
- 16. Bie J, Wang J, Yuan Q, Kakiyama G, Ghosh SS, Ghosh S. Liver‐specific transgenic expression of cholesteryl ester hydrolase reduces atherosclerosis in Ldlr−/− mice. J Lipid Res 2014;55:729‐738. [DOI] [PMC free article] [PubMed] [Google Scholar]
- 17. Zhao B, Song J, Chow WN, St Clair RW, Rudel LL, Ghosh S. Macrophage‐specific transgenic expression of cholesteryl ester hydrolase significantly reduces atherosclerosis and lesion necrosis in Ldlr mice. J Clin Invest 2007;117:2983‐2992. [DOI] [PMC free article] [PubMed] [Google Scholar]
- 18. Xu Y, Zhu Y, Jadhav K, Li Y, Sun H, Yin L, et al. Lipocalin‐2 protects against diet‐induced nonalcoholic fatty liver disease by targeting hepatocytes. Hepatol Commun 2019;3:763‐775. [DOI] [PMC free article] [PubMed] [Google Scholar]
- 19. Bertola A, Mathews S, Ki SH, Wang H, Gao B. Mouse model of chronic and binge ethanol feeding (the NIAAA model). Nat Protoc 2013;8:627‐637. [DOI] [PMC free article] [PubMed] [Google Scholar]
- 20. Bligh EG, Dyer WJ. A rapid method of total lipid extraction and purification. Can J Biochem Physiol 1959;37:911‐917. [DOI] [PubMed] [Google Scholar]
- 21. Li Y, Zalzala M, Jadhav K, Xu Y, Kasumov T, Yin L, et al. Carboxylesterase 2 prevents liver steatosis by modulating lipolysis, endoplasmic reticulum stress, and lipogenesis and is regulated by hepatocyte nuclear factor 4 alpha in mice. Hepatology 2016;63:1860‐1874. [DOI] [PMC free article] [PubMed] [Google Scholar]
- 22. Yin L, Ma H, Ge X, Edwards PA, Zhang Y. Hepatic hepatocyte nuclear factor 4alpha is essential for maintaining triglyceride and cholesterol homeostasis. Arterioscler Thromb Vasc Biol 2011;31:328‐336. [DOI] [PMC free article] [PubMed] [Google Scholar]
- 23. Zhang Y, Ge X, Heemstra LA, Chen WD, Xu J, Smith JL, et al. Loss of FXR protects against diet‐induced obesity and accelerates liver carcinogenesis in ob/ob mice. Mol Endocrinol 2012;26:272‐280. [DOI] [PMC free article] [PubMed] [Google Scholar]
- 24. Sapiro JM, Mashek MT, Greenberg AS, Mashek DG. Hepatic triacylglycerol hydrolysis regulates peroxisome proliferator‐activated receptor alpha activity. J Lipid Res 2009;50:1621‐1629. [DOI] [PMC free article] [PubMed] [Google Scholar]
- 25. Marra F, Svegliati‐Baroni G. Lipotoxicity and the gut‐liver axis in NASH pathogenesis. J Hepatol 2018;68:280‐295. [DOI] [PubMed] [Google Scholar]
- 26. Ioannou GN. The role of cholesterol in the pathogenesis of NASH. Trends Endocrinol Metab 2016;27:84‐95. [DOI] [PubMed] [Google Scholar]
- 27. Savary S, Trompier D, Andreoletti P, Le Borgne F, Demarquoy J, Lizard G. Fatty acids—induced lipotoxicity and inflammation. Curr Drug Metab 2012;13:1358‐1370. [DOI] [PubMed] [Google Scholar]
- 28. Jang CW, Chen CH, Chen CC, Chen JY, Su YH, Chen RH. TGF‐beta induces apoptosis through Smad‐mediated expression of DAP‐kinase. Nat Cell Biol 2002;4:51‐58. [DOI] [PubMed] [Google Scholar]
- 29. Nakao A, Imamura T, Souchelnytskyi S, Kawabata M, Ishisaki A, Oeda E, et al. TGF‐beta receptor‐mediated signalling through Smad2, Smad3 and Smad4. EMBO J 1997;16:5353‐5362. [DOI] [PMC free article] [PubMed] [Google Scholar]
- 30. Gupta S, Pandak WM, Hylemon PB. LXR alpha is the dominant regulator of CYP7A1 transcription. Biochem Biophys Res Commun 2002;293:338‐343. [DOI] [PubMed] [Google Scholar]
- 31. Repa JJ, Berge KE, Pomajzl C, Richardson JA, Hobbs H, Mangelsdorf DJ. Regulation of ATP‐binding cassette sterol transporters ABCG5 and ABCG8 by the liver X receptors alpha and beta. J Biol Chem 2002;277:18793‐18800. [DOI] [PubMed] [Google Scholar]
- 32. Kast HR, Nguyen CM, Sinal CJ, Jones SA, Laffitte BA, Reue K, et al. Farnesoid X‐activated receptor induces apolipoprotein C‐II transcription: a molecular mechanism linking plasma triglyceride levels to bile acids. Mol Endocrinol 2001;15:1720‐1728. [DOI] [PubMed] [Google Scholar]
Associated Data
This section collects any data citations, data availability statements, or supplementary materials included in this article.
Supplementary Materials