

Abstract
Alcoholic liver disease (ALD) is a leading cause of cirrhosis in the United States, which is characterized by extensive deposition of extracellular matrix proteins and formation of a fibrous scar. Hepatic stellate cells (HSCs) are the major source of collagen type 1 producing myofibroblasts in ALD fibrosis. However, the mechanism of alcohol‐induced activation of human and mouse HSCs is not fully understood. We compared the gene‐expression profiles of primary cultured human HSCs (hHSCs) isolated from patients with ALD (n = 3) or without underlying liver disease (n = 4) using RNA‐sequencing analysis. Furthermore, the gene‐expression profile of ALD hHSCs was compared with that of alcohol‐activated mHSCs (isolated from intragastric alcohol‐fed mice) or CCl4‐activated mouse HSCs (mHSCs). Comparative transcriptome analysis revealed that ALD hHSCs, in addition to alcohol‐activated and CCl4‐activated mHSCs, share the expression of common HSC activation (Col1a1 [collagen type I alpha 1 chain], Acta1 [actin alpha 1, skeletal muscle], PAI1 [plasminogen activator inhibitor‐1], TIMP1 [tissue inhibitor of metalloproteinase 1], and LOXL2 [lysyl oxidase homolog 2]), indicating that a common mechanism underlies the activation of human and mouse HSCs. Furthermore, alcohol‐activated mHSCs most closely recapitulate the gene‐expression profile of ALD hHSCs. We identified the genes that are similarly and uniquely up‐regulated in primary cultured alcohol‐activated hHSCs and freshly isolated mHSCs, which include CSF1R (macrophage colony‐stimulating factor 1 receptor), PLEK (pleckstrin), LAPTM5 (lysosmal‐associated transmembrane protein 5), CD74 (class I transactivator, the invariant chain), CD53, MMP9 (matrix metallopeptidase 9), CD14, CTSS (cathepsin S), TYROBP (TYRO protein tyrosine kinase‐binding protein), and ITGB2 (integrin beta‐2), and other genes (compared with CCl4‐activated mHSCs). Conclusion: We identified genes in alcohol‐activated mHSCs from intragastric alcohol‐fed mice that are largely consistent with the gene‐expression profile of primary cultured hHSCs from patients with ALD. These genes are unique to alcohol‐induced HSC activation in two species, and therefore may become targets or readout for antifibrotic therapy in experimental models of ALD.
We identified genes in alcohol‐activated mHSCs from IG alcohol‐fed mice that are largely consistent with the gene‐expression profile of primary cultured hHSCs from patients with ALD. These genes are unique to alcohol‐induced HSC activation in two species, and therefore may become targets or readout for antifibrotic therapy in experimental models of ALD.

Abbreviations
- ADA2
adenosine deaminase 2
- aHSC
activated HSC
- APF
anti‐perinuclear factor
- BMI
body mass index
- CAV1
caveolin 1
- CD74
class I transactivator, the invariant chain
- COL1A1
collagen type I alpha 1 chain
- CSF1R
macrophage colony‐stimulating factor 1 receptor
- CTSS
cathepsin S
- CYBA
cytochromeb‐245 light chain
- CYP2E1
cytochrome P450 family 2 subfamily E member 1
- DES
desmin
- EMILIN
elastin microfibril interface
- GFAP
glial fibrillary acidic protein
- hHSC
human HSC
- HSC
hepatic stellate cell
- IG
intragastric
- IGFBP3
insulin‐like growth factor binding protein 3
- IL‐6
interleukin‐6
- ITGB2
integrin beta‐2
- LAPTM5
lysosmal‐associated transmembrane protein 5
- LOX
lysyl oxidase
- LRAT
lecithin retinol acyltransferase
- mHSC
mouse HSC
- MMP9
matrix metallopeptidase 9
- mRNA
messenger RNA
- NASH
nonalcoholic steatohepatitis
- NTAM
neurotrimin
- PAI1
plasminogen activator inhibitor‐1
- PLEK
pleckstrin
- qHSC
quiescent HSC
- RNA‐Seq
RNA‐sequencing
- Spp1
secreted phosphoprotein 1
- TGFβ1
transforming growth factor beta
- Timp1
tissue inhibitor of metalloproteinase 1
- TLR
toll‐like receptor
- TREM2
triggering receptor expressed on myeloid cells 2
- TYROBP
TYRO protein tyrosine kinase‐binding protein
- α‐SMA
a‐smooth muscle actin
Alcoholic liver disease (ALD) progresses from hepatic steatosis to steatohepatitis, fibrosis, cirrhosis, and hepatocellular carcinoma.1 The incidence of ALD is on the rise. In the United States, ALD often occurs in patients with a body mass index (BMI) higher than 25‐272 with nonalcoholic steatohepatitis (NASH), and can synergistically facilitate the development of liver fibrosis/cirrhosis. Therefore, new strategies for treatment of patients with ALD are urgently needed. The limited progress in treatment of alcoholic steatohepatitis and liver fibrosis in patients with ALD can be attributed, at least in part, to the lack of studies on primary healthy and alcohol‐injured human hepatic stellate cells (hHSCs),3 primarily due to challenges with hHSC isolation. Therefore, hHSC‐derived immortalized cell lines are used widely to study hHSC biology, but do not fully recapitulate hHSC functions.
Hepatic stellate cells (HSCs) are the major source of fibrogenic myofibroblasts in alcohol‐damaged liver. Under physiological conditions, HSCs exhibit a quiescent phenotype (qHSC), reside in the space of Disse, store vitamin A in lipid droplets, and function as liver pericytes.1 In response to chronic alcoholic injury, HSCs lose vitamin A storage, and down‐regulate the expression of quiescence‐associated genes (PPARγ [peroxisome proliferator‐activated receptor gamma], GFAP [glial fibrillary acidic protein], NGFR1 [nerve growth factor receptor], LRAT [lecithin retinol acyltransferase], CYGB [cytoglobin], and others), up‐regulate the expression of fibrogenic genes (α‐SMA [α‐smooth muscle actin], FN1 [fibronectin], LOX [lysyl oxidase], Spp1 [secreted phosphoprotein 1]), and activate into collagen type 1–expressing myofibroblasts/activated HSCs (aHSCs).4 Other cellular populations, such as activated portal fibroblasts (CD34+ Thy‐1+ APFs [anti‐perinuclear factors]) and fibrocytes (CD45+ CD34+ bone marrow–derived cells), were also shown to contribute to a small fraction of hepatic myofibroblasts in alcohol‐injured liver.4
The characteristics of qHSCs and aHSCs (versus APFs and fibrocytes) were determined based on the gene‐expression profiling of mouse HSCs (mHSCs) activated in response to experimental models of toxic liver injury in mice, such as CCl4, a hepatotoxin that causes hepatocyte apoptosis without changing their metabolic properties, or the intragastric (IG) model of alcohol infusion, which causes hepatotoxic and metabolic damage of hepatocytes.5 Similar to patients with ALD (and specifically patients with ALD with NASH), IG alcohol‐fed mice develop steatosis, steatohepatitis, and liver fibrosis. Mice fed ad libitum alcohol‐containing Western liquid diet with weekly alcohol binge develop milder liver fibrosis, and the transcriptome of aHSCs/myofibroblasts isolated from this model has recently been examined in relation to epigenetic regulation.6 Although aHSCs were implicated in the fibrogenesis of both CCl4 and alcohol‐induced liver fibrosis, it remains unknown whether alcohol can uniquely activate HSCs in mouse models of ALD and in patients. In fact, no studies have been conducted to assess the comparative gene‐expression profile of alcohol‐activated hHSCs and mHSCs (vs. CCl4‐injured mHSCs).
Here, we isolated and characterized primary cultured hHSCs (from donor livers declined for transplantation) using RNA‐sequencing (RNA‐Seq) and quantitative real‐time PCR. Normal hHSCs were isolated from donor livers with no history of liver disease and were compared with ALD hHSCs (from donors with alcohol‐induced liver fibrosis). The comparative analysis of alcohol‐activated hHSCs and mHSCs identified that a common mechanism underlying activation of hHSCs and mHSCs, such as expression of fibrogenic markers (Col4a1 [collagen type IV alpha 1 chain], Col1a1 [collagen type I alpha 1 chain], TIMP1 [tissue inhibitor of metalloproteinase 1], Lox, PDGFRβ [platelet‐derived growth factor receptor‐beta]), was universally induced in both. We also identified a unique set of genes (CSF1R [macrophage colony‐stimulating factor 1 receptor], PLEK [pleckstrin], LAPTM5 [lysosmal‐associated transmembrane protein 5], CD74 [class I transactivator, the invariant chain], CD53, MMP9 [matrix metallopeptidase 9], CD14, CTSS [cathepsin S], TYROBP [TYRO protein tyrosine kinase‐binding protein], and ITGB2 [integrin beta‐2]) that is uniquely up‐regulated in both alcohol‐activated mHSCs and hHSCs (but not by CCl4). These genes may serve as targets for antifibrotic therapy in ALD, but the physiological role of these genes in preclinical models of patients with alcohol‐induced liver fibrosis and ALD remains to be determined. Alternatively, translating our findings in humans to mice, down‐regulation of these genes in mHSCs might serve as a readout of successful treatment of alcohol‐induced liver fibrosis in experimental models of ALD.
Materials and Methods
Isolation of ALD and Normal Human HSCs
Livers declined for transplantation (internal review board 171883XX, approved on November 9, 2017, in collaboration with the Lifesharing [http://www.lifesharing.org; San Diego, CA] organ procurement organization [OPO]), were graded for steatosis, inflammation, and fibrosis by a pathologist using a double‐blinded method,7 and identified as ALD or normal. Primary hHSCs were purified from livers using pronase/collagenase perfusion and gradient centrifugation method,8 cultured for 3 weeks (P0), passaged once (P1) or twice (P2), and analyzed by immunocytochemistry and quantitative real‐time PCR.
Isolation of Mouse HSCs
Col1a1YFP mice (male, C57BL6, 12 weeks old) were generated by crossing Col1a1Cre × Rosa26f/f‐YFP mice and were subjected to CCl4‐induced liver fibrosis (1:4 in corn oil, 200 μL, 12 times over 6 weeks, oral gavage, n = 6) or corn oil (control). Col1a1GFP transgenic mice9 were subjected to alcoholic hepatitis and fibrosis by hybrid feeding ad libidum of a diet high in cholesterol and saturated fat, and IG feeding of alcohol liquid diet plus weekly alcohol binge (IG alcohol‐fed mice). See Supporting Information for details.
Immunohistochemistry
Human livers (formalin‐fixed, paraffin‐embedded) were stained with the anti‐CD68 (ab955; Abcam, Cambridge, United Kingdom), anti‐α‐SMA (ab5694, Abcam), and anti‐DES (desmin; Rb‐9014‐P0; Thermo Fisher Scientific, Waltham, MA) Abs. See Supporting Information for details.
RNA‐Seq Analysis
RNA‐Seq analysis of alcohol‐activated hHSCs and mHSCs. Strand‐specific messenger RNA (mRNA)‐sequencing libraries (polyA+) were generated using Illumina TruSeq stranded mRNA library prep kits (San Diego, CA) and sequenced on an Illumina HiSeq2500 to a depth of approximately 25 million reads. See Supporting Information for details.
Functional Enrichment Analysis
Functional enrichment analysis was conducted using the ToppGene suite10 on the top 500 most differentially expressed genes identified in alcohol‐activated (vs. normal) hHSCs, alcohol‐activated (vs. quiescent) mHSCs, and CCl4‐activated (vs. quiescent) mHSCs.
Pathway Analysis
Pathway analysis was conducted using the ToppGene suite, which contains a collection of pathways from various sources. The pathways from KEGG and REACTOME, along with some other smaller databases of pathways (including BIOCARTA and the pathway interaction database) are used as the collection of gene sets to enrich against. Essentially, the ToppGene collection of pathways contains the union of pathways from each database. The P value was corrected for the total number of pathways in the database.
Network Analysis
Thirty‐five genes that were commonly dysregulated in alcohol‐activated hHSCs/mHSCs were integrated with the STRING protein–protein interaction network using the STRING web interface, with all edges of medium or high confidence (https://string-db.org).11 This network was further pruned to a highly connected core set of genes by taking the subset of genes with two or more connections to form the ALD signature gene set.
Statistical Analyses
Statistical analyses were conducted using the R project for statistical computing (https://www.r-project.org/) and python (https://www.python.org/). See Supporting Information for details.
Results
Characterization of ALD Livers Versus Normal Livers
Non‐transplanted donor livers were obtained through collaboration with the Lifesharing OPO. A liver pathologist assessed the histology in a double‐blinded manner. Donors with no underlying liver disease (n = 4, average age = 43 years, BMI = 27.8) were considered as normal. Donors with ALD (n = 3, average age = 49 years, BMI = 30.8) were identified based on patient history (excessive alcohol consumption > 5 drinks daily), liver function, steatosis grade (1‐3, hematoxylin and eosin [H&E]), lobular inflammation score (scale 0‐3), and fibrosis stage (n = 2, stage 2; n = 1, stage 4; scale 0‐4, Brunt‐Keiner methodology, Fig. 1A). Specifically, ALD was diagnosed based on elevated serum aspartate aminotransferase (average 225 vs. normal 37), increased fibrosis (positive area of sirius red staining: 13.2% ± 1.5% vs. normal 1.5% ± 0.1%), activation of α‐SMA+ aHSCs/myofibroblasts (positive area 26.7% ± 3.1% vs. normal 11.9% ± 1%), and CD68+ myeloid cells (positive area, 4.4% ± 0.5% vs. normal 2.9% ± 0.1%, Fig. 1B).
Figure 1.
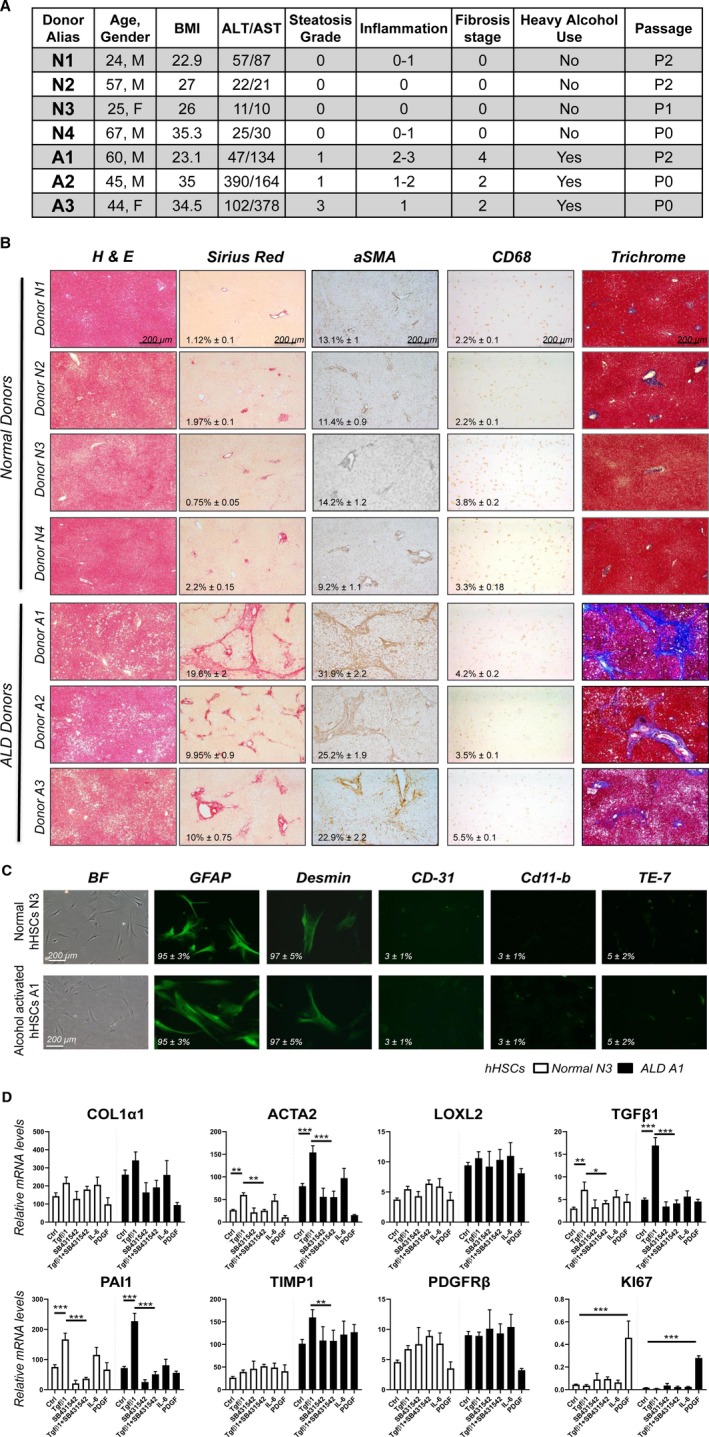
Primary cultured alcohol‐activated hHSCs exhibit a more activated phenotype than normal hHSCs. (A) Donor information: donors without underlying liver disease (N1‐N4). Donors with ALD (A1‐A3) were diagnosed based on liver function, histology, and history of alcohol abuse. (B) Human livers (healthy [n = 4] or ALD [n = 3]) were stained for H&E, sirius red, α‐SMA, CD68, and trichrome. Positive area was calculated as a percentage; representative micrographs are shown (×4 objective). (C) Primary human HSCs were immunostained for GFAP, DES, CD31, CD11b, and elastin (TE‐7 antibody). (D) Alcohol‐activated hHSCs (A1) and normal hHSCs (N3) were stimulated ± TGFβ1 (5 ng/mL), SB431542 (10 µM), IL‐6 (10 ng/mL), and PDGFβ (10 ng/mL) for 24 hours, and analyzed by quantitative real‐time PCR (*P < 0.05, **P < 0.01, ***P < 0.001), Student t test, and one‐way analysis of variance. Abbreviations: ALT, alanine aminotransferase; AST, aspartate aminotransferase; BF, Bright‐Field; Ctrl, control.
High Purity of Primary hHSC Cultures Was Achieved
Human HSCs were isolated from normal or ALD livers. Normal hHSCs (n = 4) and alcohol‐activated hHSCs (n = 3) were cultured for more than 3 weeks and characterized. Both alcohol‐activated hHSCs and normal hHSCs exhibited stellate shape and expressed HSC‐specific markers (number of GFAP+ stained cells = 95% ± 3%; DES = 85% ± 5%; Fig. 1C), and lacked expression of albumin (marker of hepatocytes), CD45 (bone marrow–derived cells), CD11b (myeloid cells), PECAM1 (platelet and endothelial cell adhesion molecule 1; CD31, endothelial cells), and TE‐7 (a marker of APFs (5% ± 2%; Fig. 1C), indicative of a high purity of hHSC cultures.
ALD Human HSCs Exhibit a More Activated Phenotype Compared With Normal Human HSCs
Despite hHSC culturing, elevated basal levels of TGFβ1 (transforming growth factor beta), Col1a1, α‐SMA, TIMP1, and LoxL2 (lysyl oxidase homolog 2) mRNA were detected in ALD hHSCs, compared with normal hHSCs, using quantitative real‐time PCR (Fig. 1D). Stimulation with TGFβ1 (5 ng/mL, 24 hours) further increased expression of TGFβ1, Col1a1, α‐SMA, and PAI1 (plasminogen activator inhibitor‐1) mRNA in ALD hHSCs (compared with a level higher than in normal hHSCs), and this effect was blocked in the presence of the TGFβ1 inhibitor SB431542 (10 µM). Expression of Col1a1 and α‐SMA mRNA was also induced in ALD hHSCs in response to interleukin‐6 (IL‐6; 10 ng/mL, 24 hours). In turn, PDGFβ (10 ng/mL, 24 hours) exhibited similar responses in both normal and ALD hHSCs, as shown by up‐regulation of the marker of proliferation Ki‐67 RNA. Despite prolonged culture, primary alcohol‐activated hHSCs retained an activated phenotype compared with normal hHSCs.
RNA‐Seq‐Based Analyses Identified Differences in the Gene‐Expression Profiles of ALD Human HSCs and Normal Human HSCs
Transcriptomes of normal and alcohol‐activated hHSCs were compared using RNA‐Seq and analyzed using a tiered approach, starting with the most stringent analysis of the transcriptome‐wide similarities between samples using multidimensional scaling analysis of 12,649 genes expressed in hHSCs (Fig. 2A), and demonstrated that ALD hHSCs were separated from normal hHSCs, suggesting that the gene‐expression profile of ALD hHSCs is significantly altered compared with normal hHSCs. Differential expression analysis of all expressed genes identified 11 genes that were highly and significantly up‐regulated or down‐regulated in ALD hHSCs versus normal hHSCs, after correcting for multiple tests (Benjamini‐Hochberg adjusted; P < 0.3; Fig. 2A). Eight genes were up‐regulated (ADA2 [adenosine deaminase 2], MEX3B [Mex‐3 RNA binding family member B], STARD5 [StAR‐related lipid transfer domain containing 5], OPN3 [opsin 3], TRIM58 [tripartite motif containing 58], MAN1C1 [mannosidase alpha class 1C member 1], BST2 [bone marrow stromal cell antigen 2], and ID3 [inhibitor of DNA binding 3, HLH protein]), and three genes were down‐regulated (IGFBP3 [insulin‐like growth factor binding protein 3], TNFAIP6 [tumor necrosis factor alpha induced protein 6], and NTM [neurotrimin]) in ALD hHSCs compared with normal hHSCs (Fig. 2A), suggesting that dysregulation of these genes discriminates ALD hHSCs from normal hHSCs.
Figure 2.
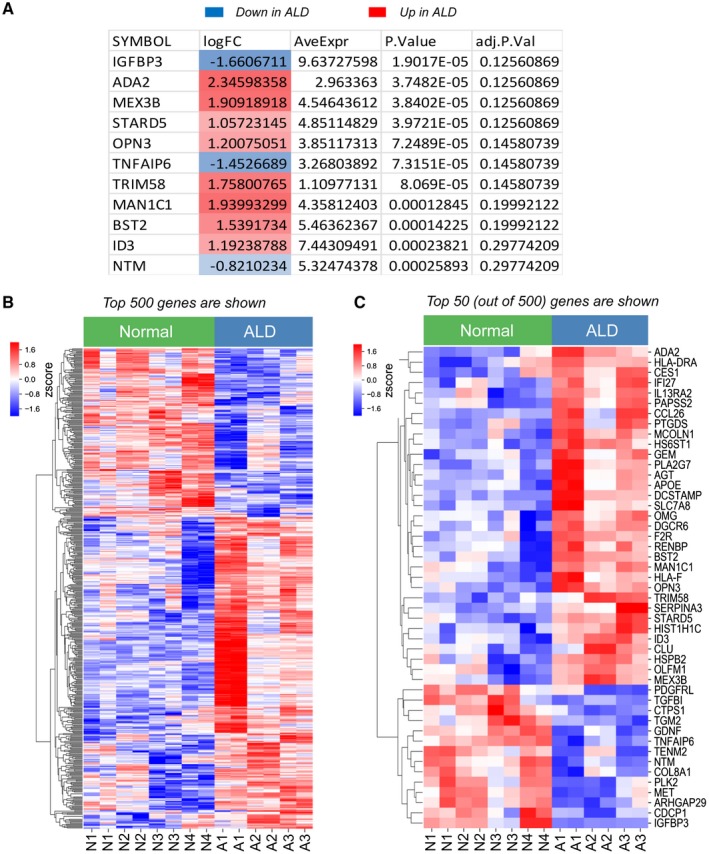
Eleven most dysregulated genes that best discriminate ALD hHSCs from normal hHSCs. (A) Eleven genes that are significantly differentially expressed (red, up‐regulated; blue, down‐regulated) between ALD and normal hHSCs. (B,C) Heatmap showing the relative gene expression between the top 500 (B) or top 50 (C) most differentially expressed genes in normal and ALD hHSCs. The genes were grouped by similarity to each other using hierarchical clustering. The Benjamini‐Hochberg method for multiple test corrections was applied to differentiate the expression results. Eleven genes were changed significantly with the Benjamini‐Hochberg method (adjusted P < 0.3). Abbreviations: adj.P.Val, multiple‐test‐corrected P value using the method of Benjamini‐Hochberg; AveExpr, average expression across all samples; logFC, log fold change in expression between ALD and normal hHSCs; P.Value, P value for the comparison. Abbreviations: ADA2, adenosine deaminase 2; AGT, angiotensinogen; APOE, apolipoprotein E; ARHGAP29, rho GTPase activating protein 29; BST2, bone marrow stromal cell antigen 2; CCL26, C‐C motif chemokine ligand 26; CDCP1, CUB domain containing protein 1; CES1, carboxylesterase 1; CLU, clusterin; COL8A1, collagen type VIII alpha 1 chain; CTPS1, CTP synthase 1; DCSTAMP, dendrocyte expressed seven transmembrane protein; DGCR6, DiGeorge syndrome critical region gene 6; F2R, coagulation factor II thrombin receptor; GDNF, glial cell derived neurotrophic factor; GEM, GTP binding protein overexpressed in skeletal muscle; HIST1H1C, H1.2 linker histone, cluster member; HLA‐DRA, major histocompatibility complex, class II, DR alpha; HLA‐F, major histocompatibility complex, class I, F; HS6ST1, heparan sulfate 6‐O‐sulfotransferase 1; HSPB2, heat shock protein family B (small) member 2; ID3, inhibitor of DNA binding 3; IFI27, interferon alpha inducible protein 27; IGFBP3, insulin like growth factor binding protein 3; IL13RA2, interleukin 13 receptor subunit alpha 2; MAN1C1, mannosidase alpha class 1C member 1; MCOLN1, mucolipin 1; MET, MET proto‐oncogene, receptor tyrosine kinase; MEX3B, mex‐3 RNA binding family member B; NTM, neurotrimin; OLFM1, olfactomedin 1; OMG, oligodendrocyte myelin glycoprotein; OPN3, opsin 3; PAPSS2, 3,‐phosphoadenosine 5,‐phosphosulfate synthase 2; PDGFRL, platelet derived growth factor receptor like; PLA2G7, phospholipase A2 group VII; PLK2, polo like kinase 2; PTGDS, prostaglandin D2 synthase; RENBP, renin binding protein; SERPINA3, serpin family a member 3; SLC7A8, solute carrier family 7 member 8; STARD5, StAR related lipid transfer domain containing 5; TENM2, teneurin transmembrane protein 2; TGFBI, transforming growth factor beta induced; TGM2, transglutaminase 2; TNFAIP6, tumor necrosis factor‐alpha‐induced protein; TRIM58, Tripartite motif containing 58.
Human samples are variable, and other sources of variation likely exist in the samples, as hHSCs are derived from donors in whom the primary sources of variation are associated not only with alcohol consumption but also with other underlying health issues. To identify more genes related to ALD, we relaxed the differential expression criterion to an unadjusted P value of 0.05 and took the top 500 gene results to identify genes that best distinguish ALD hHSCs from normal hHSCs. We found a strong separation between the gene expression in normal and ALD hHSCs (Fig. 2B). This indicates that many of the nominally significant genes truly differentiate the normal and diseased states, and that many of our findings will become significant in larger sample sizes. For this reason we used the set of 500 most differentially expressed genes as the basis of the following analysis. The same separation pattern is seen in the 50 most up‐regulated or down‐regulated genes that were most differentially expressed between ALD hHSCs and normal hHSCs (Fig. 2C). This separation observed at all levels of stringency suggests that the phenotype of alcohol‐activated hHSCs differs from that observed in normal hHSCs, despite undergoing culturing on plastic dishes.
Thirty‐Nine Pathways Were Dysregulated in Alcohol‐Activated Human HSCs (Versus Normal Human HSCs)
Functional enrichment analysis of the top 500 most differentially expressed genes for significant overlap with known biological pathways (using the KEGG and REACTOME pathway databases) identified 39 enriched pathways that were significantly dysregulated in alcohol‐activated hHSCs (vs. normal hHSCs). (The top 15 up‐regulated pathways are shown in Fig. 3A.) These pathways included genes implicated in the regulation of fibrogenic responses (extracellular matrix [ECM] organization, rheumatoid arthritis pathways), TGFβ1 production (hemostasis, platelet degranulation, and activation pathways), innate responses (activation of toll‐like receptor [TLR] signaling; Staph. aureus infection, phagosomal and lysosomal pathways), and acquired immunity (antigen presentation and cytokine signaling pathways). Given the high purity of hHSCs, our data suggest that in addition to ECM deposition, ALD hHSCs might mediate immune responses (compared with normal hHSCs).
Figure 3.
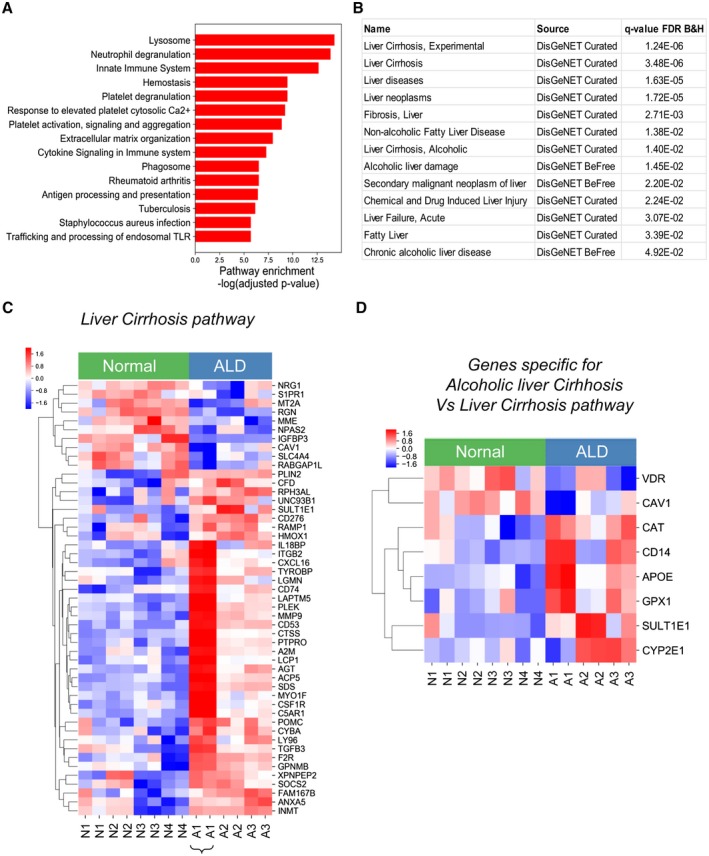
Fibrogenic and immune pathways are dysregulated in alcohol‐activated hHSCs (compared with normal hHSCs). (A) Functional enrichment analysis of the top 500 most differentially expressed genes between ALD and normal hHSCs identified 39 dysregulated pathways. The top 15 up‐regulated pathways (out of 39) are shown. The significance of the pathway enrichment is shown on the x axis (negative log Benjamini‐Hochberg–adjusted P value). (B) The top 500 differentially expressed genes demonstrate a significant association with curated liver disease gene sets (DisGeNet, http://www.disgenet.org/dbinfo). The q‐value false discovery rate is the Benjamini‐Hochberg–adjusted P value for the gene‐set enrichment. (C,D) Heatmap showing the relative expression between ALD and healthy HSCs for genes in the liver cirrhosis experimental DisGeNet gene set (C) or differentially expressed genes in the alcoholic liver cirrhosis DisGeNet gene set (compared with the liver cirrhosis experimental DisGeNet gene set). (D). The genes were grouped by similarity to each other using hierarchical clustering. Pathway significance and disease gene‐set significance was assessed using hypergeometric tests to compare the significance of the observed overlap in genes. P values are corrected for multiple testing with the Benjamini‐Hochberg method (adjusted P < 0.05). Abbreviations: B&H, Benjamini‐Hochberg; FDR, false discovery rate. Abbreviations: A2M, alpha‐2‐macroglobulin; ACP5, acid phosphatase 5; AGT, angiotensinogen; ANXA5, annexin A5; APOE, apolipoprotein E; C5AR1, complement C5a receptor 1; CAT, catalase; CAV1, caveolin 1; CD14, CD14 molecule; CD276, CD276 molecule; CD53, CD53 molecule; CD74, CD74 molecule; CFD, complement factor D; CSF1R, colony stimulating factor 1 receptor; CTSS, cathepsin S; CXCL16, C‐X‐C motif chemokine ligand 16; CYBA, cytochrome b‐245 alpha chain; CYP2E1, cytochrome P450 family 2 subfamily E member 1; F2R, coagulation factor II thrombin receptor; FAM167B, family with sequence similarity 167 member B; GPNMB, glycoprotein nmb; GPX1, glutathione peroxidase 1; HMOX1, heme oxygenase 1; IGFBP3, insulin like growth factor binding protein 3; IL18BP, interleukin 18 binding protein; INMT, indolethylamine N‐methyltransferase; ITGB2, integrin subunit beta 2; LAPTM5, lysosomal protein transmembrane 5; LCP1, lymphocyte cytosolic protein 1; LGMN, legumain; LY96, lymphocyte antigen 96; MME, membrane metalloendopeptidase; MMP9, matrix metallopeptidase 9; MT2A, metallothionein 2A; MYO1F, myosin IF; NPAS2, neuronal PAS domain protein 2; NRG1, neuregulin 1; PLEK, pleckstrin; PLIN2, perilipin 2; POMC, proopiomelanocortin; PTPRO, protein tyrosine phosphatase receptor type O; RABGAP1L, RAB GTPase activating protein 1 like; RAMP1, receptor activity modifying protein 1; RGN, regucalcin; RPH3AL, rabphilin 3A like; S1PR1, sphingosine‐1‐phosphate receptor 1; SDS, serine dehydratase; SLC4A4, solute carrier family 4 member 4; SOCS2, suppressor of cytokine signaling 2; SULT1E1, sulfotransferase family 1E member 1; TGFB3, transforming growth factor beta 3; TYROBP, TYRO protein tyrosine kinase binding protein; UNC93B1, unc‐93 homolog B1; VDR, vitamin D receptor; XPNPEP2, X‐prolyl minopeptidase 2.
Pathway Dysregulation in ALD hHSCs Correlates With Alcoholic Liver Cirrhosis
Next, we tested whether the pathways detected in ALD hHSCs (vs. normal hHSCs) were associated with specific human diseases. Indeed, analysis of a curated database of disease‐gene associations (DisGeNET, http://www.disgenet.org) revealed a strong enrichment of the top 500 most differentially expressed genes in the alcohol‐activated hHSCs for human genes related to liver cirrhosis, alcoholic and nonalcoholic cirrhosis and fibrosis, alcoholic liver damage, chronic alcoholic liver disease, liver failure, and liver neoplasms (Fig. 3B).
Analysis of the liver cirrhosis gene set revealed that 49 genes from the top 500 most differentially expressed between ALD hHSCs (vs. normal hHSCs) overlapped with the genes in the liver cirrhosis gene set (false discovery rate–adjusted P value = 1.24−6; Fig. 3C). These 49 genes included NRG1 (neuregulin 1), S1PR1 (sphingosine‐1‐phosphate receptor 1), MT2A (metallothionein 2A), PGN (peptidoglycan), MME (membrane metalloendopeptidase), NPAS2 (neuronal PAS domain protein 2), IGFBP3, CAV1 (caveolin 1), SLC4A4 (solute carrier family 4 member 4), and RABGAP (Rab GTPase‐activating protein), which were up‐regulated in normal hHSCs, and genes PLIN2 (perilipin 2), RPH3AL (rabphilin 3A [without C2 domains]), SULT1E1 (sulfotransferase family 1E member 1), CD276, RAMP1 (receptor activity modifying protein 1), and HMOX1 (heme oxygenase 1), which were up‐regulated in ALD hHSCs. Moreover, the up‐regulation of liver cirrhosis–associated genes (IL18BP, Cxcl16 [C‐X‐C motif chemokine ligand 16], CD74, CD53, CSF1R, Ly96 [lymphocyte antigen 96], TGFβ3, PLEK, MYO1F [myosin IF], MMP9, TYROBP, Acp5 [acid phosphatase 5, tartrate resistant], PTPRO [protein tyrosine phosphatase receptor type O], POMC [proopiomelanocortin], GPNMB [glycoprotein Nmb], FAM167B [family with sequence similarity 167 member B]) was observed in ALD hHSCs (A1, from donor with stage 4 liver fibrosis, Fig. 3C), suggesting that the expression level of these genes might reflect the activation status of ALD hHSCs. Moreover, comparison of the alcoholic liver cirrhosis and liver cirrhosis gene clusters revealed that ALD hHSCs uniquely up‐regulated alcohol‐metabolizing enzyme CYP2E1 (cytochrome P450 family 2 subfamily E member 1), GPX1 (glutathione peroxidase 1), and APOE (apolipoprotein E), and down‐regulated vitamin D receptor (Fig. 3D), whereas expression of CAV1 and SULT1E1 was strongly induced (in comparison with liver cirrhosis).
Mouse and Human HSCs Express Similar Activation Markers
To translate our findings in humans to mice, the gene‐expression profiles of ALD hHSCs and mHSCs, activated either by IG alcohol feeding or CCl4, were compared (development of liver fibrosis in these mice is shown in Supporting Fig. S1). The hHSCs and mHSCs showed striking similarities in gene‐expression profiles. A comparison of ALD hHSCs (Fig. 4A) with alcohol‐activated and CCl4‐activated mHSCs (Fig. 4B,C) demonstrated that expression of fibrogenic genes (such as Col4a1, Col1a1, TIMP1, Lox, and PDGFRβ) was highly conserved among species, whereas expression of quiescent markers (particularly LRAT, NGFR1, CYGB, and others) was slightly diverged in human versus mouse aHSCs, perhaps reflecting that the hHSCs had been cultured.
Figure 4.
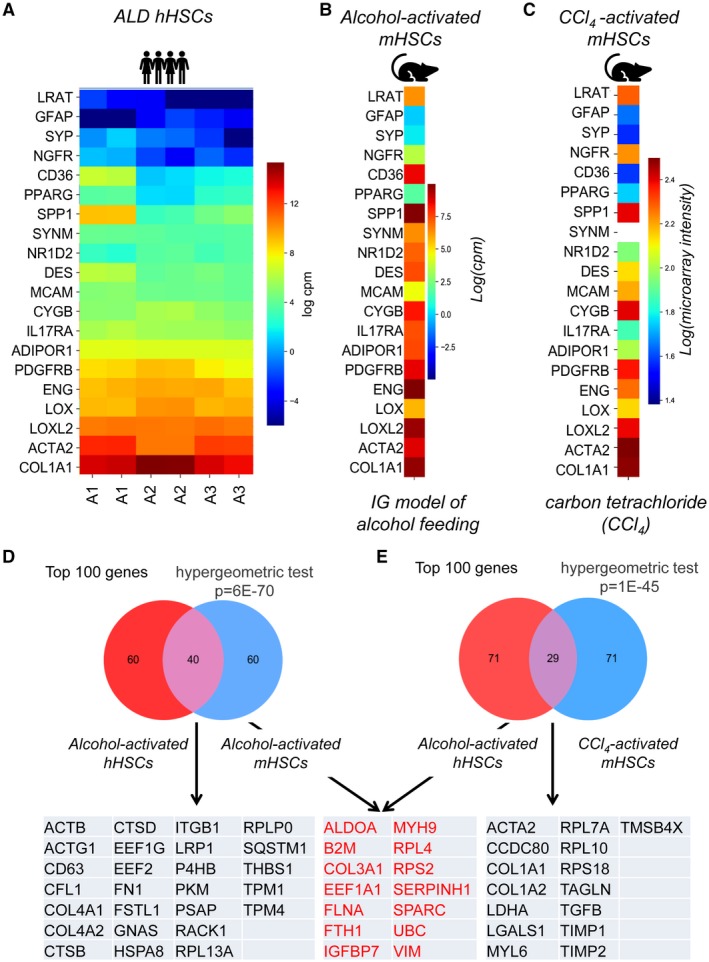
Expression of activation markers is conserved among ALD hHSCs, alcohol‐activated, and CCl4‐activated mHSCs. (A‐C) Heatmap displaying the expression of HSC‐specific markers in ALD hHSC (A), alcohol‐activated (B), and CCl4‐activated mHSCs (C). (D,E) Venn diagrams demonstrate the overlapping genes (from the top 100 most highly expressed genes) between alcohol‐activated hHSCs and mHSCs (D) (P = 6−70) or alcohol‐activated hHSCs and CCl4‐activated mHSCs (E) (P = 1−45). Genes expressed in both pools of overlapping genes are shown in red; unique genes are shown in black. Overlap significance was assessed with the hypergeometric test, to compare the observed overlap with what is expected, given the randomly selected gene sets. Abbreviations: ACTA2, actin alpha 2, smooth muscle; ACTB, actin beta; ACTG1, actin gamma 1; ADIPOR1, adiponectin receptor 1; ALDOA, aldolase, fructose‐bisphosphate A; B2M, beta‐2‐microglobulin; CCDC80, coiled‐coil domain containing 80; CD36, CD36 molecule; CD63, CD63 molecule; CFL1, cofilin 1; COL1A1, collagen type I alpha 1 chain; COL1A2, collagen type I alpha 2 chain; COL3A1, collagen type III alpha 1 chain; COL4A1, collagen type IV alpha 1 chain; COL4A2, collagen type IV alpha 2 chain; CTSB, cathepsin B; CTSD, cathepsin D; CYGB, cytoglobin; DES, desmin; EF1A1, eukaryotic translation elongation factor 1 alpha 1; EEF1G, eukaryotic translation elongation factor 1 gamma; EEF2, eukaryotic translation elongation factor 2; ENG, endoglin; FLNA, filamin A; FN1, fibronectin 1; FSTL1, follistatin like 1; FTH1, ferritin heavy chain 1; GFAP, glial fibrillary acidic protein; GNAS, GNAS complex locus; HSPA8, heat shock protein family A (Hsp70) member 8; IGFBP7, insulin like growth factor binding protein 7; IL17RA, interleukin 17 receptor A; ITGB1, integrin subunit beta 1; LDHA, lactate dehydrogenase A; LGALS1, galectin 1; LOX, lysyl oxidase; LOXL2, lysyl oxidase like 2; LRAT, lecithin retinol acyltransferase; LRP1, LDL receptor related protein 1; MCAM, melanoma cell adhesion molecule; MYH9, myosin heavy chain 9; MYL6, myosin light chain 6; NGFR, nerve growth factor receptor; NR1D2, nuclear receptor subfamily 1 group D member 2; P4HB, prolyl 4‐hydroxylase subunit beta; PDGFRB, platelet derived growth factor receptor beta; PKM, pyruvate kinase M1/2; PPARG, peroxisome proliferator activated receptor gamma; PSAP, prosaposin; RACK1, receptor for activated C kinase 1; RPL7A, ribosomal protein L7a; RPL10, ribosomal protein L10; RPL13A, ribosomal protein L13a; RPL4, ribosomal protein L4; RPLP0, ribosomal protein lateral stalk subunit P0; RPS18, ribosomal protein S18; RPS2, ribosomal protein S2; SERPINH1, serpin family H member 1; SPARC, secreted protein acidic and cysteine rich; SPP1, secreted phosphoprotein 1; SQSTM1, sequestosome 1; SYNM, synemin; SYP, synaptophysin; TAGLN, transgelin; TGFB, TGFB2 overlapping transcript 1; TIMP1, TIMP metallopeptidase inhibitor 1; TIMP2, TIMP metallopeptidase inhibitor 2; TMSB4X, thymosin beta 4 X‐linked; TPM1, tropomyosin 1; TPM4, tropomyosin 4; UBC, ubiquitin C; VIM, vimentin.
ALD Human HSCs Share More Similarities With Alcohol‐Activated Mouse HSCs Than With CCl4‐Activated Mouse HSCs
Both IG alcohol feeding and CCl4 induce hepatotoxic injury in mice, but the underlying etiology of mHSC activation differs between these two models. We hypothesized that IG alcohol feeding most closely recapitulates ALD in patients, and therefore, alcohol‐activated hHSCs and mHSCs should share expression of a specific gene set that distinguishes them from CCl4‐activated mHSCs. Alcohol‐activated hHSCs and mHSCs were compared at the level of overall gene expression (by measuring the number of shared genes among the most highly expressed genes) or differential gene expression (by comparing three sets of genes that discriminate alcohol‐activated hHSCs from normal hHSCs, and alcohol‐activated and CCl4‐activated mHSCs from appropriate control mHSCs).
Of the 500 most differentially expressed genes, 249 genes overlapped between ALD hHSCs and alcohol‐activated mHSCs (49.8%, hypergeometric test, P = 1−279), whereas 196 genes were shared between ALD hHSCs and CCl4‐activated mHSCs (39.2%, P = 2−188, not shown). Specifically, of the top 100 most differentially expressed genes, 40 genes were similarly expressed in ALD hHSCs and mHSCs (40.0%, hypergeometric test, P = 6−70, Fig. 4D), and 29 genes overlapped in ALD hHSCs and CCl4‐activated mHSCs (29.0%, P = 1−45, Fig. 4E). We concluded that ALD hHSCs share more similarities with alcohol‐activated mHSCs than with CCl4‐activated mHSCs.
Dysregulated Gene Ontology Term/Pathways Are Highly Conserved Between Alcohol‐Activated Human HSCs and Mouse HSCs
To identify a specific set of alcohol‐induced genes, the pathways found to be significantly altered in ALD hHSCs (vs. normal hHSCs, such as the 39 pathways depicted in Fig. 3B) were compared with the Gene Ontology (GO) term/pathways in alcohol‐activated or CCl4‐activated mHSCs (identified by functional enrichment analysis of the top 500 most differentially expressed genes vs. appropriate control mHSCs). Of the 39 pathways, only 11 pathways were shared between ALD hHSCs and CCl4‐activated mHSCs, whereas 32 pathways were shared between ALD hHSCs and alcohol‐activated mHSCs (vs. normal hHSCs/control mHSCs, Fig. 5A,B). These 32 pathways were largely up‐regulated in both alcohol‐activated hHSCs/mHSCs (vs. normal HSCs/control mHSCs) and were associated with fibrogenesis (11 pathways), coagulation (6 pathways), inflammation (8 pathways), antigen presentation (4 pathways), and antibacterial response (3 pathways, Fig. 5C). The magnitude of dysregulation was stronger in alcohol‐activated mHSCs than in ALD hHSCs, likely because of the greater heterogeneity in human samples. Hence, the significant overlap in biological processes pointed toward a strong consistency in the effect of alcohol‐induced liver injury in humans and mice, further supporting our conclusion that the IG model of alcohol feeding in mice is suitable to study ALD.
Figure 5.
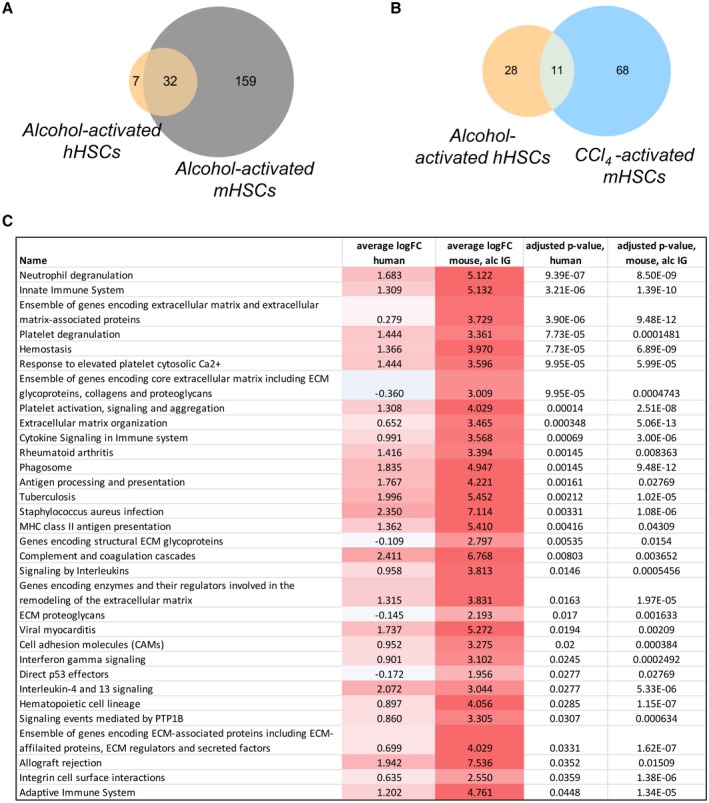
Pathways are shared between alcohol‐activated hHSCs and mHSCs. (A,B) Pathways commonly dysregulated in alcohol‐activated hHSCs and mHSCs (A) in alcohol‐activated hHSCs and CCl4‐activated mHSCs (B), shown as Venn diagrams. (Pathways that were significantly enriched in the top 500 most differentially expressed genes between alcohol‐activated and control HSCs were identified using the hypergeometric test–adjusted P < 0.05). (C) Thirty‐two pathways shared between alcohol‐activated hHSCs and mHSCs. The top 500 differentially expressed genes were used for pathway analysis. Abbreviations: Average logFC human, average log fold change between ALD and normal hHSCs for genes in the pathway; average logFC mouse, alc IG, average log fold change between alcohol‐activated and quiescent mHSCs (from IG alcohol‐fed mice) for genes in the pathway; adjusted P value, human, significance of the pathway enrichment in human, adjusted for multiple tests using the method of Benjamini‐Hochberg; adjusted P value, mouse, alc IG, significance of the pathway enrichment in mouse intragastric model, adjusted for multiple tests using the method of Benjamini‐Hochberg.
Alcohol‐Activated Human HSCs/Mouse HSCs Shared Expression of 35 Alcohol‐Induced Genes (Versus CCl4‐Injured Mouse HSCs)
We searched for the genes that can distinguish alcohol‐activated hHSCs/mHSCs from HSCs activated by other etiologies. To identify genes uniquely expressed only in alcohol‐activated hHSCs/mHSCs, the 500 genes most differentially expressed in ALD hHSCs (vs. normal hHSCs), alcohol‐activated, and CCl4‐activated mHSCs (vs. appropriate control mHSCs) were compared. From this comparison, we identified the overlapping genes that were shared among pools. Thirty‐three genes were commonly dysregulated in ALD hHSCs and CCl4‐activated mHSCs (P = 0.002, Fig. 6A). However, of these 33, only 14 genes were dysregulated in the same direction (including down‐regulation of IGFBP3 and up‐regulation of Spp1 and TGFβ3), indicating that functional pathways differ in ALD hHSCs and CCl4‐induced mHSCs.
Figure 6.
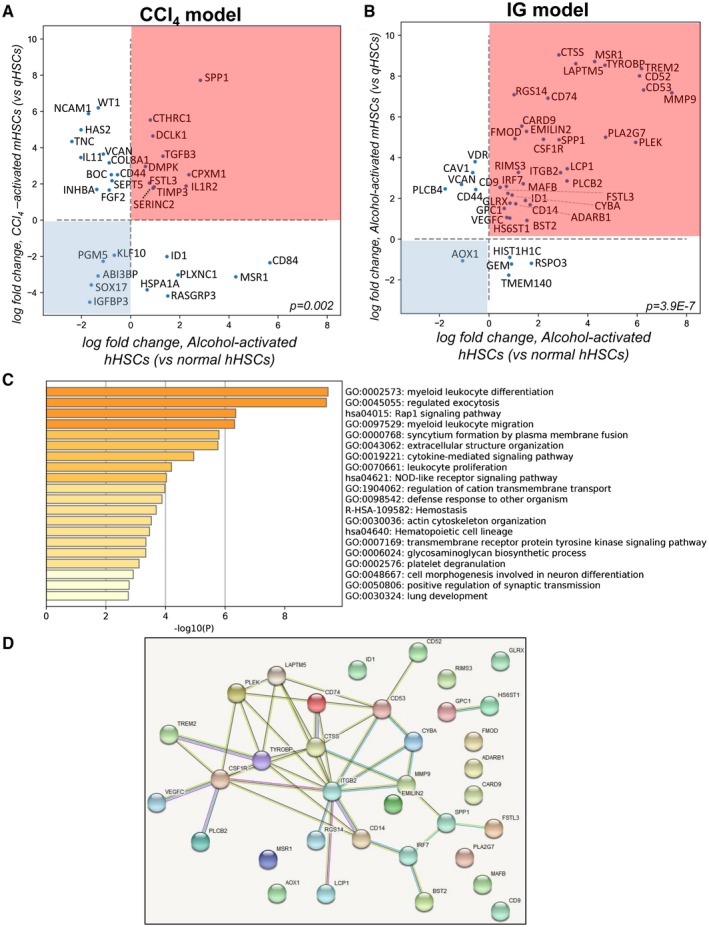
Expression of 35 genes distinguishes alcohol‐activated hHSCs and mHSCs from CCl4‐activated mHSCs. (A) Scatterplot shows 33 overlapping genes from the top 500 genes in ALD (vs. normal) hHSCs and CCl4‐activated (vs. quiescent) mHSCs (hypergeometric test, P = 0.002). Fourteen genes were dysregulated in the same direction. Genes located in the pink square are up‐regulated, and those in the blue square are down‐regulated, in both hHSCs and mHSCs. (B) Scatterplot shows 44 overlapping genes from the top 500 genes ALD (vs. normal) hHSCs and alcohol‐activated (vs. quiescent) mHSCs (P = 3.9−7). Thirty‐five genes dysregulated in the same direction are shown in the pink (up‐regulated) and blue (down‐regulated) squares in both alcohol‐activated hHSCs and mHSCs. (C) GO term/pathway analysis of 35 genes overlapping between alcohol‐activated hHSCs/mHSCs. (D) Thirty‐five genes were grouped in a cross‐species protein–protein interaction network (https://https//string-db.org). Significantly more connections were found among the genes than expected by chance (P < 1−16, permutation test). Abbreviations: ABI3BP, ABI family member 3 binding protein; ADARB1, adenosine deaminase RNA specific B1; AOX1, aldehyde oxidase 1; BOC, BOC cell adhesion associated; BST2, bone marrow stromal cell antigen 2; CARD9, caspase recruitment domain family member 9; CAV1, caveolin 1; CD14, CD14 molecule; CD44, CD44 molecule; CD52, CD52 molecule; CD53, CD53 molecule; CD74, CD74 molecule; CD84, CD84 molecule; CD9, CD9 molecule; COL8A1, collagen type VIII alpha 1 chain; CPXM1, carboxypeptidase X, M14 family member 1; CSF1R, colony stimulating factor 1 receptor; CTHRC1, collagen triple helix repeat containing 1; CTSS, cathepsin S; CYBA, cytochrome b‐245 alpha chain; DCLK1, doublecortin like kinase 1; DMPK, DM1 protein kinase; EMILIN2, elastin microfibril interfacer 2; FGF2, fibroblast growth factor 2; FMOD, fibromodulin; FSTL3, follistatin like 3; GEM, GTP binding protein overexpressed in skeletal muscle; GLRX, glutaredoxin; GPC1, glypican 1; HAS2, hyaluronan synthase 2; HIST1H1C, H1.2 linker histone, cluster member; HS6ST1, heparan sulfate 6‐O‐sulfotransferase 1; HSPA1A, heat shock protein family A (Hsp70) member 1A; ID1, inhibitor of DNA binding 1; IGFBP3, insulin like growth factor binding protein 3; IL11, interleukin 11; IL1R2, interleukin 1 receptor type 2; INHBA, inhibin subunit beta A; IRF7, interferon regulatory factor 7; ITGB2, integrin subunit beta 2; KLF10, kruppel like factor 10; LAPTM5, lysosomal protein transmembrane 5; LCP1, lymphocyte cytosolic protein 1; MAFB, MAF bZIP transcription factor B; MMP9, matrix metallopeptidase 9; MSR1, macrophage scavenger receptor 1; NCAM1, neural cell adhesion molecule 1; PGM5, phosphoglucomutase 5; PLA2G7, phospholipase A2 group VII; PLCB2, phospholipase C beta 2; PLCB4, phospholipase C beta 4; PLEK, pleckstrin; PLXNC1, plexin C1; RASGRP3, RAS guanyl releasing protein 3; RGS14, regulator of G protein signaling 14; RIMS3, regulating synaptic membrane exocytosis 3; RSPO3, R‐spondin 3; SEPT5, Septin 5; SERINC2, serine incorporator 2; SOX17, SRY‐box transcription factor 17; SPP1, secreted phosphoprotein 1; TGFB3, transforming growth factor beta 3; TIMP3, TIMP metallopeptidase inhibitor 3; TMEM140, transmembrane protein 140; TNC, tenascin C; TREM2, triggering receptor expressed on myeloid cells 2; TYROBP, TYRO protein tyrosine kinase binding protein; VCAN, versican; VDR, vitamin D receptor; VEGFC, vascular endothelial growth factor C; WT1, WT1 transcription factor.
In contrast, 44 genes were commonly dysregulated in alcohol‐activated hHSCs and mHSCs (Fig. 6B, P = 3.9−7), with 35 genes being dysregulated in the same direction (including Trem2 [triggering receptor expressed on myeloid cells 2], Tyrobp, PLEK, LAPTM5, CD74, CTSS, ITGB2, and CSFR1 [colony stimulating factor receptor 1]). Interestingly, the genes that are traditionally associated with HSC activation (such as Col1a1, TIMP1, and TGFβ) were not included in this pool, with the exception of Spp1 and Emilin (elastin microfibril interface), suggesting that these 35 genes might be uniquely induced in alcohol‐activated hHSCs/mHSCs.
Alcohol‐Specific Human HSC/Mouse HSC Genes Are Linked to Fibrogenesis and Regulation of Immune Responses
Using pathway analysis, functional properties of 35 alcohol‐associated genes were accessed (Fig. 6C) and associated with fibrogenesis (e.g., extracellular structure organization, actin cytoskeleton organization, platelet degranulation, glycosaminoglycan biosynthesis, cell morphogenesis, lung development) and immune responses (e.g., defense response, cytokine‐mediated signaling pathway, myeloid/leukocyte differentiation, proliferation, migration). Specifically, some of these genes were linked by the GO annotations to fibrosis (FSTL3 [follistatin like 3], EMILIN2, HS6ST1 [heparan sulfate 6‐O‐sulfotransferase 1], GPC1 [glypican 1], PLA2g7 [phospholipase A2 group VII], FMOD [fibromodulin], MMP9, MAFB [MAF BZIP transcription factor B], IRF7 [interferon regulatory factor 7], CD9, Spp1, and LCP1 [lymphocyte cytosolic protein 1]), angiogenesis (VEGFC [vascular endothelial growth factor C]), antigen presentation (CD74 and CTSS), innate immunity (CSF1R, CD14, CARD9 [caspase recruitment domain family member 9], TYROBP, and TREM2), phagocytosis (CYBA [cytochromeb‐245 light chain], MSR1 [macrophage scavenger receptor types I and II], LAPTM5, BST2, and RIMS3 [regulating synaptic membrane exocytosis 3]), and reactive oxygen species (AOX1 [aldehyde oxidase 1] and GLRX [glutaredoxin]).
A Minimal Combination of 14 Genes Identified the Signature Genes of Alcohol‐Activated Human HSCs/Mouse HSCs
The interconnection among these 35 genes was further defined using a cross‐species protein–protein interaction network (https://string-db.org/cgi/network; Fig. 6D). There were 40 connections among these 35 genes, greatly exceeding the expected number of four connections (P < 1−16, permutation test), indicating that the identified alcohol‐specific hHSC/mHSC genes are representative of common underlying pathways and known functional processes.
A number of genes (such as AOX1, MSR1, PLA2G7, MAFB, CD9, CARD9, ADARB1 [adenosine deaminase RNA specific B1], FMOD, GLRX, RIMS3, EMILIN2, and ID1 [inhibitor of DNA binding 1, HLH protein]) showed no known connections to other genes (with the network of 35 genes), and despite high expression, were not a part of the network. Therefore, we narrowed the network of 35 genes by including the most highly connected genes (≥2 connections in the network), and identified 14 genes (CD14, CSF1R, TYROBP, PLEK, LAPTM5, CD53, CYBA, MMP9, CD14, ITGB2, CTSS, Spp1, and IRF7) that formed the core of a provisionary protein network. Based on the central position within the network and high ties to other proteins, 3 of the 14 core genes (ITGB2, TYROBP, and CTSS) appeared to play a regulatory role within the network, meaning that they may have the largest effect on connection between genes/pathways. Overall, CSF1R, PLEK, LAPTM5, CD74, CD53, MMP9, CD14, CTSS, TYROBP, and ITGB2 were identified as “signature genes” of alcohol‐activated hHSCs/mHSCs (Fig. 7A), which are functionally linked to fibrogenic responses (osteoclast differentiation, ECM, and collagen binding pathways) and immune responses (TLR cascade and signaling, exocytosis, lysosome, and adaptive and innate immunity pathways) (Fig. 7B). Similar results were obtained using another cohort of normal and ALD human HSCs (cultured to P0; see Supporting Fig. S2 and Supporting Information text). Our data indicate that high expression of CD74, TYROBP, TREM2, and CTSS is associated with ALD hHSCs (Fig. 7C,D). These genes alone, or in combination with others, may become therapeutic targets, or serve as a readout for successful treatment of experimental models of ALD. Expression of selected genes was confirmed in alcohol‐activated mHSCs (isolated from IG alcohol‐fed mice; Supporting Fig. S3) and hHSCs (n = 3) (vs. normal hHSCs, n = 3) isolated from different donors (A4‐A6 and N5‐N7, cultured to P1; Fig. 7D), suggesting that expression of identified genes distinguishes alcohol‐activated human HSCs from normal HSCs despite culture activation.
Figure 7.

Fourteen genes were identified as the signature genes of alcohol‐activated hHSCs/mHSCs. (A) Fourteen genes with 2 or fewer connections within the network were identified as signature genes of alcohol‐activated hHSCs/mHSCs. The P value and Benjamini‐Hochberg–adjusted P value of alcohol‐activated (vs. normal) hHSCs are shown. (B) Functional enrichment analysis identified pathways associated with these 14 genes (six pathways are shown) and were grouped in a cross‐species protein–protein interaction network (https://https//string-db.org). The pathways shown are significantly enriched for these 14 genes with Benjamini‐Hochberg–adjusted P < 0.05. (C) Expression of selected genes was analyzed by quantitative real‐time PCR in normal hHSCs (n = 3, N5, N6, N7) and ALD hHSCs (n = 3, A3, A4, A5) isolated from a different set of donors (*P < 0.05, **P < 0.01, ***P < 0.001; Student t test and one‐way analysis of variance). (D) Donor information: N5‐N7, donors without underlying liver disease; A4‐A6, donors with ALD who were diagnosed based on liver function, histology, and history of alcohol abuse. Abbreviations: ALT, alanine aminotransferase; AST, aspartate aminotransferase. Abbreviations: CD14, CD14 molecule; CD53, CD53 molecule; CD74, CD74 molecule; CSF1R, Colony stimulating factor 1 receptor; CTSS, Cathepsin S; CYBA, Cytochrome b‐245 alpha chain; IRF7, Interferon regulatory factor 7; ITGB2, Integrin subunit beta 2; LAPTM5, Lysosomal protein transmembrane 5; MMP9, Matrix metallopeptidase 9; PLEK, Pleckstrin; SPP1, Secreted phosphoprotein 1; TREM2, Teneurin transmembrane protein 2; TYROBP, TYRO protein tyrosine kinase binding protein.
Discussion
We examined the transcriptomic differences between primary hHSCs isolated from ALD livers or normal livers. Despite the heterogeneity of the ALD and normal donors, primary cultured ALD hHSCs remained transcriptionally distinct from normal hHSCs, suggesting that hHSCs maintain specific epigenetic characteristics in culture that determine their phenotype (quiescent or activated). Then we compared hHSCs and mHSCs, and identified that primary alcohol‐activated mHSCs, freshly isolated from livers of IG alcohol‐fed mice, most closely recapitulate the gene‐expression profile of primary cultured ALD hHSCs. Moreover, we identified the genes that are similarly and uniquely up‐regulated in alcohol‐activated hHSCs and mHSCs, suggesting that these genes may serve as targets for antifibrotic therapy in ALD.
Because isolation of primary hHSCs is challenging, most studies rely on immortal human HSC cell lines, such as LX2 or hTERT, which retain some but not all features of hHSCs. Primary hHSCs can be isolated from resected livers by cell outgrowth from liver slices. In addition to hHSCs, this technique might produce myofibroblasts through epithelial‐to‐mesenchymal transition of plastic activated hepatic cells. Alternatively, hHSCs are purified using pronase/collagenase digestion and gradient centrifugation, which is based on the buoyancy of the vitamin‐A lipid droplets in HSCs. The number and viability of purified hHSCs can be diminished by the small volume of resected livers and by tissue hypoxia. Human HSCs isolated from patients with ALD (or NASH) are often contaminated with fatty hepatocytes, thereby precluding gene‐expression profiling of the freshly isolated hHSC cultures, unless single‐cell RNA‐Seq is performed. The whole‐liver single‐cell RNA‐Seq effectively identified genes that are characteristic for activated hHSCs, but the depth of sequencing failed to identify unique and disease‐specific genes. Single‐cell RNA analysis of human livers recently revealed novel markers of human HSCs.12 Although the single‐cell analysis identified genes that distinguish HSCs from other hepatic cell types, we identified some of the same genes in our study (including CTSS, CD74, CYBA, ID1, FSTL3, and FMOD). Moreover, our study identified genes that differentiate ALD hHSCs from normal hHSCs.
Here we analyzed the transcriptome of ALD and normal hHSCs from donor livers declined for transplantation. These livers were preserved (perfused with Wisconsin solution [ViaSpan; Bristol Meyers Squibb, New York, NY] and kept less than 24 hours on ice to reduce tissue hypoxia). Human HSCs were isolated from the whole liver lobe to ensure high quality and heterogeneity of the hHSC population. The hHSCs were cultured to eliminate contaminating pronase‐injured hepatocytes, and to expand the hHSC population. Although expression of some genes (LOX, TIMP1, and others) was induced in cultured ALD and normal hHSCs, expression of other genes was not affected by plastic activation, and clearly discriminated between ALD from normal hHSCs. This gene set was used to identify the similarities between cultured ALD hHSCs and alcohol‐activated mHSCs. Notably, purification of mHSCs from alcohol‐damaged livers has similar problems as described for ALD hHSCs, but can be overcome by cell sorting of freshly isolated mHSCs for collagen α1(I)‐GFP+ reporter9 and ultraviolet‐excited vitamin A fluorescence, which eliminates contaminating steatotic hepatocytes.6 Overall, we identified genes that highly overlap in cultured ALD hHSCs (and not changed by plastic activation) and primary freshly isolated alcohol‐activated mHSCs.
A tiered stringency approach was used to interrogate the gene‐expression profiles of ALD and normal hHSCs, starting with the most stringent analysis of genes significantly changed, accounting for multiple testing, and then expanding the list of differentially expressed genes by decreasing the stringency of the inclusion criteria to include the top 500 most differentially expressed genes. Expression of highly up‐regulated genes in ALD hHSCs (ADA2, MEX3B, TRIM58 and MAN1C1) or down‐regulated genes (IGFBP3 and NTM) discriminate between the alcohol‐activated and normal hHSCs, accounting for multiple test corrections.
IGFBP3 and NTM were implicated in the maintenance of the qHSC phenotype. Consistent with previous observations,13, 14, 15, 16, 17 expression of IGFBP3 and NTM were strongly down‐regulated in alcohol‐activated hHSCs (vs. normal hHSCs). In turn, ADA2, a growth factor for endothelial cells and a promoter of differentiation of M2 macrophages,18 was highly induced in ALD HSCs. Although this is the first observation of the role of ADA2 in HSC biology, our findings extend the positive correlation between activation of HSCs and stimulation of liver sinusoidal endothelial cells. Previous studies have demonstrated that activated HSCs produce the angiogenic factors vascular endothelial factor19 and angiopoietin 1.20
Functional enrichment analysis of a large pool of the top differentially expressed genes reveals significant up‐regulation of 39 pathways in ALD HSCs, including cytokine signaling, platelet activation, and ECM organization, all of which are known to be up‐regulated in mouse models of fibrotic liver disease,21 as well as significant associations with known liver‐disease gene sets. Comparison of the alcoholic cirrhosis versus cirrhosis gene sets revealed that CYP2E1, CD14, and CAV1 were strongly induced in alcohol‐activated hHSCs. Similarly, alcohol‐activated HSCs up‐regulate CYP2E1 (an alcohol metabolizing enzyme) in response to chronic liver injury. This effect is associated with activation of TLR4/CD14 signaling in aHSCs and Kupffer cells,8 whereas expression of CAV1, implicated in lipid droplet formation in hHSCs and intracellular trafficking,22, 23 was reduced in ALD hHSCs compared with normal hHSCs.
Previous studies have focused primarily on characterization of either mouse or human HSCs.21, 24 Using high‐confidence mHSC data to extract relevant signal from noisy hHSC data, we identified the most differentially and significantly expressed genes in both hHSCs and mHSCs, indicating that the IG model of alcohol feeding most closely recapitulates ALD hHSCs. This approach was fully untargeted, so the results are an unbiased summary of the genes that are commonly dysregulated by alcohol across species and interconnected in known protein–protein interaction networks. Similar approaches have been used previously,25 but to our knowledge, this is the first systematic analysis of the common protein interaction networks common for alcohol‐activated hHSCs and mHSCs, showing how the identified genes are functionally connected.
Specifically, a general concordance among the expression of known HSC signature genes was observed in hHSCs and mHSCs. Of the genes typically associated with activated or quiescent hHSC and mHSC phenotypes, expression of LRAT was notably suppressed in cultured ALD hHSCs compared with mHSCs and can be attributed to a true organismal difference at the level of gene expression or metabolic processes. Dietary differences may also contribute differential LRAT gene expression in hHSCs and mHSC.26
Significant similarities were detected between ALD hHSCs and alcohol‐activated mHSCs (vs. CCl4‐activated mHSCs). Of the 35 genes that were uniquely up‐regulated in alcohol‐activated hHSCs/mHSCs, CSF1R, PLEK, LAPTM5, CD74, CD53, MMP9, CD14, CTSS, TYROBP, and ITGB2 were identified as signature genes of alcohol‐activated hHSCs/mHSCs, and their functions were linked to fibrogenic/ECM‐associated pathways and immuno‐regulatory pathways in myofibroblasts.27, 28, 29 By studying these pathways, we can target genes downstream of potential HSC activators and inhibit the response to injury. The ECM is a component of all mammalian tissues, consisting of the proteins collagen, elastin, and fibronectin.30 Secretion of abundant ECM proteins is a hallmark of fibrosis, and as expected, the ECM organization pathway was significantly up‐regulated in both alcohol‐activated mHSCs and hHSCs. Our study implicates alcohol‐activated hHSCs and mHSCs in the mediation of fibrosis‐associated immune processes, and in particular activation of the innate immune system,8 whereas some of the identified pathways are novel for HSC biology. Thus, the role of TYROBP, TREM2, and ITGB2 genes in regulation of adaptive/innate immune responses has recently been proposed. TYROBP/TREM2 binding was shown to suppresses the release of pro‐inflammatory cytokines, and activate phagocytosis of apoptotic cells by myeloid/microglial cells.31, 32 Moreover, expression of CD74,33 CTSS,34 and LAPTM5 was linked in MHC class I endolysosomal antigen presentation. Although aHSCs were shown to mediate antigen presentation and phagocytosis,35, 36 these functions appear to be highly amplified in alcohol‐activated hHSCs/mHSCs. These signals might regulate ALD hHSC/mHSC activation, motility, and the cross talk between alcohol‐damaged hepatocytes and Kupffer cells/macrophages. Remarkably, a combination of five to six of these genes was associated with astroglial sensome in Alzheimer's disease,37 amyotrophic lateral sclerosis,38 and osteoclasts differentiation,39 outlining the functional commonalities of these genes for disease manifestation in various tissues.
This study provides evidence that alcohol‐activated hHSCs and mHSCs share expression of specific alcohol‐induced signature genes, suggesting that IG alcohol‐fed mice serve as the best preclinical experimental model of alcohol‐induced liver fibrosis in mice to study human ALD.
Supporting information
Acknowledgments
We thank Lifesharing and Lisa Stocks for their collaboration, and the La Jolla Institute of Immunology Sequencing Facility, University of Southern California, and University of California San Diego cell sorting facilities.
Grant support: Supported by the National Institutes of Health (R01 DK101737, U01 AA022614, R01 DK099205, and P50AA011999 to T.K. and D.A.B. and U01AA018663, U01AA027681, I01BX001991, IK6BX004205, R24AA012885, and P50AA011999 to H.T.).
Accession number: http://www.ncbi.nlm.nih.gov/geo/query/acc.cgi?acc=GSE141100
Potential conflict of interest: Dr. Dorko owns stock in and is employed by Ambys Medicines. He consults for Cytostrategy. Dr. Tsukamoto consults for EA Pharma, Sekisui Chemical, and Otsuka Pharmaceutical Factory.
Contributor Information
Xiao Liu, Email: xil094@ucsd.edu.
Tatiana Kisseleva, Email: tkisseleva@ucsd.edu.
References
Author names in bold designate shared co‐first authorship.
- 1. Gao B, Bataller R. Alcoholic liver disease: pathogenesis and new therapeutic targets. Gastroenterology 2011;141:1572‐1585. [DOI] [PMC free article] [PubMed] [Google Scholar]
- 2. Brandl K, Hartmann P, Jih LJ, Pizzo DP, Argemi J, Ventura‐Cots M, et al. Dysregulation of serum bile acids and FGF19 in alcoholic hepatitis. J Hepatol 2018;69:396‐405. [DOI] [PMC free article] [PubMed] [Google Scholar]
- 3. Shang L, Hosseini M, Liu X, Kisseleva T, Brenner DA. Human hepatic stellate cell isolation and characterization. J Gastroenterol 2018;53:6‐17. [DOI] [PubMed] [Google Scholar]
- 4. Xu J, Liu X, Koyama Y, Wang P, Lan T, Kim IG, et al. The types of hepatic myofibroblasts contributing to liver fibrosis of different etiologies. Front Pharmacol 2014;5:1‐12. [DOI] [PMC free article] [PubMed] [Google Scholar]
- 5. Ueno A, Lazaro R, Wang PY, Higashiyama R, Machida K, Tsukamoto H. Mouse intragastric infusion (iG) model. Nat Protoc 2012;7:771‐781. [DOI] [PMC free article] [PubMed] [Google Scholar]
- 6. Page A, Paoli PP, Hill SJ, Howarth R, Wu R, Kweon SM, et al. Alcohol directly stimulates epigenetic modifications in hepatic stellate cells. J Hepatol 2015;62:388‐397. [DOI] [PMC free article] [PubMed] [Google Scholar]
- 7. Kleiner DE, Brunt EM, Van Natta M, Behling C, Contos MJ, Cummings OW, et al. Design and validation of a histological scoring system for nonalcoholic fatty liver disease. Hepatology 2005;41:1313‐1321. [DOI] [PubMed] [Google Scholar]
- 8. Seki E, De Minicis S, Osterreicher CH, Kluwe J, Osawa Y, Brenner DA, et al. TLR4 enhances TGF‐beta signaling and hepatic fibrosis. Nat Med 2007;13:1324‐1332. [DOI] [PubMed] [Google Scholar]
- 9. Yata Y, Scanga A, Gillan A, Yang L, Reif S, Breindl M, et al. DNase I‐hypersensitive sites enhance alpha1(I) collagen gene expression in hepatic stellate cells. Hepatology 2003;37:267‐276. [DOI] [PubMed] [Google Scholar]
- 10. Chen J, Bardes EE, Aronow BJ, Jegga AG. ToppGene Suite for gene list enrichment analysis and candidate gene prioritization. Nucleic Acids Res 2009;37:W305‐W311. [DOI] [PMC free article] [PubMed] [Google Scholar]
- 11. Szklarczyk D, Morris JH, Cook H, Kuhn M, Wyder S, Simonovic M, et al. The STRING database in 2017: quality‐controlled protein‐protein association networks, made broadly accessible. Nucleic Acids Res 2017;45:D362‐D368. [DOI] [PMC free article] [PubMed] [Google Scholar]
- 12. MacParland SA, Liu JC, Ma XZ, Innes BT, Bartczak AM, Gage BK, et al. Single cell RNA sequencing of human liver reveals distinct intrahepatic macrophage populations. Nat Commun 2018;9:4383. [DOI] [PMC free article] [PubMed] [Google Scholar]
- 13. Boers W, Aarrass S, Linthorst C, Pinzani M, Elferink RO, Bosma P. Transcriptional profiling reveals novel markers of liver fibrogenesis: gremlin and insulin‐like growth factor‐binding proteins. J Biol Chem 2006;281:16289‐16295. [DOI] [PubMed] [Google Scholar]
- 14. Svegliati‐Baroni G, Ridolfi F, Di Sario A, Casini A, Marucci L, Gaggiotti G, et al. Insulin and insulin‐like growth factor‐1 stimulate proliferation and type I collagen accumulation by human hepatic stellate cells: differential effects on signal transduction pathways. Hepatology 1999;29:1743‐1751. [DOI] [PubMed] [Google Scholar]
- 15. Kim HS, Ingermann AR, Tsubaki J, Twigg SM, Walker GE, Oh Y. Insulin‐like growth factor‐binding protein 3 induces caspase‐dependent apoptosis through a death receptor‐mediated pathway in MCF‐7 human breast cancer cells. Cancer Res 2004;64:2229‐2237. [DOI] [PubMed] [Google Scholar]
- 16. De Minicis S, Seki E, Uchinami H, Kluwe J, Zhang Y, Brenner DA, et al. Gene expression profiles during hepatic stellate cell activation in culture and in vivo. Gastroenterology 2007;132:1937‐1946. [DOI] [PubMed] [Google Scholar]
- 17. Mannaerts I, Schroyen B, Verhulst S, Van Lommel L, Schuit F, Nyssen M, et al. Gene expression profiling of early hepatic stellate cell activation reveals a role for Igfbp3 in cell migration. PLoS ONE 2013;8:e84071. [DOI] [PMC free article] [PubMed] [Google Scholar]
- 18. Fields RD, Burnstock G. Purinergic signalling in neuron‐glia interactions. Nat Rev Neurosci 2006;7:423‐436. [DOI] [PMC free article] [PubMed] [Google Scholar]
- 19. Lee JS, Semela D, Iredale J, Shah VH. Sinusoidal remodeling and angiogenesis: a new function for the liver‐specific pericyte? Hepatology 2007;45:817‐825. [DOI] [PubMed] [Google Scholar]
- 20. Taura K, De Minicis S, Seki E, Hatano E, Iwaisako K, Osterreicher CH, et al. Hepatic stellate cells secrete angiopoietin 1 that induces angiogenesis in liver fibrosis. Gastroenterology 2008;135:1729‐1738. [DOI] [PubMed] [Google Scholar]
- 21. Zhang DY, Goossens N, Guo J, Tsai MC, Chou HI, Altunkaynak C, et al. A hepatic stellate cell gene expression signature associated with outcomes in hepatitis C cirrhosis and hepatocellular carcinoma after curative resection. Gut 2016;65:1754‐1764. [DOI] [PMC free article] [PubMed] [Google Scholar]
- 22. Yokomori H, Ando W, Oda M. Caveolin‐1 is related to lipid droplet formation in hepatic stellate cells in human liver. Acta Histochem 2019;121:113‐118. [DOI] [PubMed] [Google Scholar]
- 23. Singh S, Liu S, Rockey DC. Caveolin‐1 is upregulated in hepatic stellate cells but not sinusoidal endothelial cells after liver injury. Tissue Cell 2016;48:126‐132. [DOI] [PMC free article] [PubMed] [Google Scholar]
- 24. Gutierrez Sanchez LH, Tomita K, Guo Q, Furuta K, Alhuwaish H, Hirsova P, et al. Perinatal nutritional reprogramming of the epigenome promotes subsequent development of nonalcoholic steatohepatitis. Hepatol Commun 2018;2:1493‐1512. [DOI] [PMC free article] [PubMed] [Google Scholar]
- 25. AbdulHameed MD, Tawa GJ, Kumar K, Ippolito DL, Lewis JA, Stallings JD, et al. Systems level analysis and identification of pathways and networks associated with liver fibrosis. PLoS ONE 2014;9:e112193. [DOI] [PMC free article] [PubMed] [Google Scholar]
- 26. Ross AC. Diet in vitamin A research. Methods Mol Biol 2010;652:295‐313. [DOI] [PMC free article] [PubMed] [Google Scholar]
- 27. Ji J, Yu F, Ji Q, Li Z, Wang K, Zhang J, et al. Comparative proteomic analysis of rat hepatic stellate cell activation: a comprehensive view and suppressed immune response. Hepatology 2012;56:332‐349. [DOI] [PubMed] [Google Scholar]
- 28. Vastrad B, Vastrad C, Tengli A, Iliger S. Identification of differentially expressed genes regulated by molecular signature in breast cancer‐associated fibroblasts by bioinformatics analysis. Arch Gynecol Obstet 2018;297:161‐183. [DOI] [PubMed] [Google Scholar]
- 29. Maubach G, Lim MC, Kumar S, Zhuo L. Expression and upregulation of cathepsin S and other early molecules required for antigen presentation in activated hepatic stellate cells upon IFN‐gamma treatment. Biochim Biophys Acta 2007;1773:219‐231. [DOI] [PubMed] [Google Scholar]
- 30. Wells RG. The role of matrix stiffness in regulating cell behavior. Hepatology 2008;47:1394‐1400. [DOI] [PubMed] [Google Scholar]
- 31. Ma J, Jiang T, Tan L, Yu JT. TYROBP in Alzheimer's disease. Mol Neurobiol 2015;51:820‐826. [DOI] [PubMed] [Google Scholar]
- 32. Zhong L, Chen XF, Zhang ZL, Wang Z, Shi XZ, Xu K, et al. DAP12 stabilizes the C‐terminal fragment of the triggering receptor expressed on myeloid cells‐2 (TREM2) and protects against LPS‐induced pro‐inflammatory response. J Biol Chem 2015;290:15866‐15877. [DOI] [PMC free article] [PubMed] [Google Scholar]
- 33. Basha G, Omilusik K, Chavez‐Steenbock A, Reinicke AT, Lack N, Choi KB, et al. A CD74‐dependent MHC class I endolysosomal cross‐presentation pathway. Nat Immunol 2012;13:237‐245. [DOI] [PMC free article] [PubMed] [Google Scholar]
- 34. Weiskirchen R, Tacke F. Cellular and molecular functions of hepatic stellate cells in inflammatory responses and liver immunology. Hepatobiliary Surg Nutr 2014;3:344‐363. [DOI] [PMC free article] [PubMed] [Google Scholar]
- 35. Bataller R, Schwabe RF, Choi YH, Yang L, Paik YH, Lindquist J, et al. NADPH oxidase signal transduces angiotensin II in hepatic stellate cells and is critical in hepatic fibrosis. J Clin Invest 2003;112:1383‐1394. [DOI] [PMC free article] [PubMed] [Google Scholar]
- 36. Muhanna N, Doron S, Wald O, Horani A, Eid A, Pappo O, et al. Activation of hepatic stellate cells after phagocytosis of lymphocytes: a novel pathway of fibrogenesis. Hepatology 2008;48:963‐977. [DOI] [PMC free article] [PubMed] [Google Scholar]
- 37. Hickman SE, Kingery ND, Ohsumi TK, Borowsky ML, Wang LC, Means TK, et al. The microglial sensome revealed by direct RNA sequencing. Nat Neurosci 2013;16:1896‐1905. [DOI] [PMC free article] [PubMed] [Google Scholar]
- 38. Andres‐Benito P, Moreno J, Dominguez R, Aso E, Povedano M, Ferrer I. Inflammatory gene expression in whole peripheral blood at early stages of sporadic amyotrophic lateral sclerosis. Front Neurol 2017;8:546. [DOI] [PMC free article] [PubMed] [Google Scholar]
- 39. Amarasekara DS, Yun H, Kim S, Lee N, Kim H, Rho J. Regulation of osteoclast differentiation by cytokine networks. Immune Netw 2018;18:e8. [DOI] [PMC free article] [PubMed] [Google Scholar]
Associated Data
This section collects any data citations, data availability statements, or supplementary materials included in this article.
Supplementary Materials