

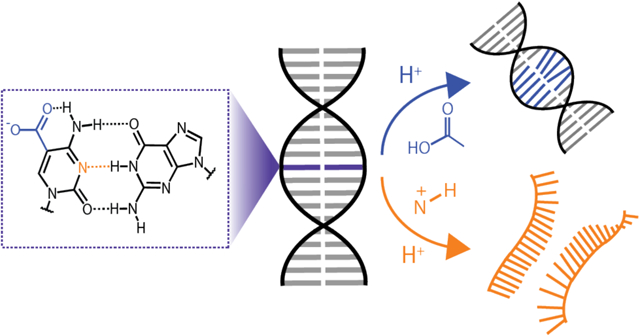
Abstract
Applications associated with nucleobase protonation events are grounded in their fundamental impact on DNA thermodynamics, structure, and hybridization dynamics. Of the canonical nucleobases, N3 protonation of cytosine (C) is the most widely utilized in both biology and nanotechnology. Naturally occurring C derivatives that shift the N3 pKa introduce an additional level of tunability. The epigenetic nucleobase 5-carboxylcytosine (caC) presents a particularly interesting example since this derivative forms Watson-Crick base pairs of similar stability and displays pH-dependent behavior over the same range as the canonical nucleobase. However, the titratable group in caC corresponds to the exocyclic carboxyl group rather than N3, and the implications of these divergent protonation events toward DNA hybridization thermodynamics, kinetics, and base pairing dynamics remain poorly understood. Here, we study the pH-dependence of these physical properties using model oligonucleotides containing C and caC with FTIR and temperature-jump IR spectroscopy. We demonstrate that N3 protonation of C completely disrupts duplex stability, leading to large shifts in the duplex/single-strand equilibrium, a reduction in the cooperativity of melting, and an acceleration in the rate of duplex dissociation. In contrast, while increasing 5-carboxyl protonation in caC-containing duplexes induces an increase in base pair fluctuations, the DNA duplex can tolerate substantial protonation without significant perturbation to the duplex/single-strand equilibrium. However, 5-carboxyl protonation has a large impact on hybridization kinetics by reducing the transition state free energy. Our thermodynamic and kinetic analysis provides new insight on the impact of two divergent protonation mechanisms in naturally occurring nucleobases on the biophysical properties of DNA.
Graphical Abstract
Introduction
The physical and biological properties of DNA are highly sensitive to environmental factors such as temperature,1–4 counterions,5 and pH.6–9 In particular, pH effects can greatly impact nucleic acids through direct protonation or de-protonation of specific nucleobase sites, leading to changes in secondary structure6, 10–11 and duplex dissociation.7, 12–13 Proton concentrations across different intracellular compartments are highly regulated and vary substantially from pH 8.0 in mitochondria to pH 7.2 in the nucleus to pH 4.7 in lysosomes.14 Different local environments regulate DNA properties and can potentially lead to damage. Even before the determination of DNA’s double helical structure,15 it had been shown that polymeric DNA dissociates under alkaline and acidic conditions.8 Since then, many details related to the identities of protonated species,6–7, 16–18 conformational changes,7, 16 and their thermodynamic impact on duplex DNA (dsDNA) have been investigated.7, 13, 19 It has been demonstrated that the thermal melting temperature of DNA is greatly reduced under acidic conditions and largely stems from perturbations to G:C base pairing.6, 17–18, 20 As a result, the degree of protonation tolerated in dsDNA and its thermodynamic impact is highly-dependent on the level of G:C content.
In general, the pH-dependent properties of nucleic acids observed in biology are driven by protonation at the N3 position (Fig. 1) of cytosine (C) due to its relatively high and tunable pKa compared to other protonatable bases.10 In addition to initiating mismatches and G:C Hoogsteen base pairs,21 N3 protonation drives the formation of C quadruplex structures known as intercalated motifs (i-motifs).10 Recently, i-motif structures have been observed in vivo, particularly in human promoter regions, suggesting that they may play a significant role in gene regulation.22
Figure 1:
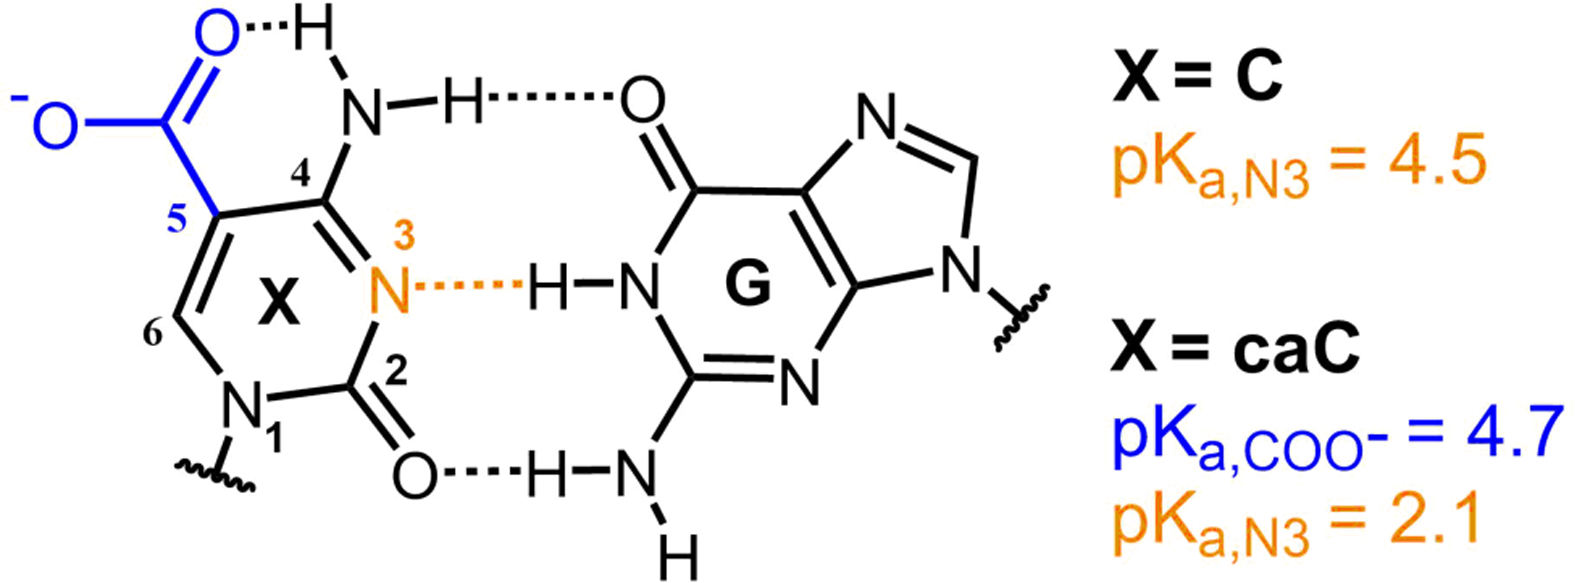
Chemical structure of X:G base pair, where X corresponds to cytosine (C) or 5-carboxylcytosine (caC). Titratable groups for C and caC are shown with their respective pKa values for the isolated nucleoside in solution.23
While N3 protonation of C is correlated to most pH-induced function of canonical nucleic acids, numerous modified nucleobases exist in vivo that have unique pH-dependent properties. For example, 5-bromination lowers the pKa of uracil from ~10 to ~8,24 allowing for significant N3 deprotonation under physiological conditions that may facilitate damage to nucleic acids.25 More recently, cytosine derivatives involved in the active DNA demethylation pathway, where 5-methylcytosine (mC) is sequentially oxidized to 5-hydroxymethylcytosine (hmC), 5-formylcytosine (fC), and finally 5-carboxylcytosine (caC),26–27 have been discovered in mammals. In this context fC and caC are selectively excised by thymine DNA glycosylase (TDG) to give an abasic site which is repaired with C by a base excision repair (BER) pathway to complete the demethylation cycle.27 Neither mC nor hmC are associated with significant shifts in N3 pKa (pKa,N3). In contrast, fC exhibits a reduced pKa,N3 of 2.4 but shows no pH-dependence in its excision activity, while caC has two titratable groups with pKa values of 2.1–2.4 (pKa,N3) and 4.2–4.8 (C5-COO−, ),23, 28–29 and shows accelerated excision under mildly acidic conditions.28, 30 The pH-dependent behavior of the caC nucleobase stands out among the epigenetic cytosine derivatives since it has a pKa in a similar range to C, but the titratable group associated with this protonation is the exocyclic carboxyl group rather than N3. While addition of a proton at N3 occupies a hydrogen bond acceptor site that blocks the formation of a Watson-Crick base pair (Fig. 1), protonation of the exocyclic carboxyl group situated in the major groove would appear less perturbative, but could nevertheless lead to unique pH-dependent thermodynamic or kinetic effects in modified dsDNA.
In nucleic acid nanotechnology, the sensitivity of DNA to C protonation has motivated the design of numerous pH-driven nanodevices.31–32 In particular, the formation of i-motif and DNA triple helices in C- and CG-rich sequences, respectively, require C protonation and offer tunability of nucleic acid secondary structure.10, 32 These secondary structures are highly sensitive to sequence composition and environmental factors, which can shift pKa,N3 by 0.5–1 units.10 Such shifts allow for the construction of uniquely pH-sensitive DNA tools for a variety of applications. For example, pH-driven conformational switches have been used to enhance the location specificity of drug-delivery agents,33 increase control over DNA strand displacement equilibria,34 and develop sensors to map the pH of biological environments.35 While C N3 protonation is the primary mechanism behind these pH-devices, more recent work has demonstrated enhanced tunability through the incorporation of modified nucleobases.36–38 In particular, substitution of C to caC has been shown to destabilize i-motif formation in many sequences with high sensitivity to the position of modification as well as destabilize DNA triplex formation under physiological conditions.38–39 Destabilization of each type of structure is most likely due to the reduction in pKa,N3 upon 5-carboxylation. However, the dynamic properties, such as folding rate and mechanism, of pH-driven devices are also essential to their function. As has been shown for 5-bromocytidine,36 caC may be able to tune specific aspects of i-motif folding or DNA triplex association dynamics important for nanotechnology.
The pH-dependent properties of canonical and modified DNA utilized in biology and nanotechnology are determined by the impact of nucleobase protonation on local and global base pairing properties. Therefore, a detailed understanding of the pH-dependence of hybridization thermodynamics, kinetics, and structural dynamics is warranted. The incorporation of caC may lead to unique pH-dependences in these properties compared to canonical DNA that are nevertheless tunable over the same pH range due to the fact that is similar to pKa,N3 in C, the 5-position is oriented in the major groove, and protonation of the exocyclic carboxyl group may not directly disturb caC:G base pairing. So far, the biophysical impact of caC has primarily been studied at neutral pH, showing only minor perturbations to double-stranded DNA.39–42 However, the protonated carboxyl group is much more electron-withdrawing43 and caC has a reduced pKa,N3, which has been proposed to weaken G:caC base pairing.23 Additionally, simulations have suggested that 5-carboxyl protonation may tune local solvation and increase local base pair fluctuations.42
Despite interest in the pH-dependent properties of C and caC, a detailed understanding of nucleobase protonation on duplex dissociation, particularly the kinetics and base pairing dynamics involved in the process, remains incomplete. Here, we characterize the role of 5-carboxyl and N3 protonation on DNA duplex thermodynamics and dehybridization dynamics of a ten-nucleotide sequence using FTIR and temperature-jump infrared (IR) spectroscopy. The mid-IR spectrum of nucleic acids is sensitive to nucleobase-specific changes in base pairing and protonation,23, 44–48 making IR spectroscopy particularly useful for the study of pH-dependent hybridization of DNA. We demonstrate that N3 protonation of C drastically shifts the duplex/single-strand equilibrium and reduces the barrier to dissociation without significantly impacting the hybridization transition state energy. In contrast, caC-modified dsDNA can handle essentially complete protonation of the 5-carboxyl sites without significantly shifting the duplex-to-single-strand transition. Instead, 5-carboxyl protonation leads to highly sloped melting curve baselines that are interpreted as a reduction in the internal base pairing within duplexes. Protonation of caC still leads to a large reduction in the dissociation barrier, but, in contrast to N3 protonation of C, does so through lowering the transition state free energy rather than destabilizing the duplex state. Our results demonstrate that caC and C impart distinct pH-dependent properties onto dsDNA, providing insight into the biological function of these protonation events as well as their potential utility in nucleic acid nanotechnology.
Results
pH-Dependent FTIR Melting Experiments on caC- and C-Containing Oligonucleotides
As an initial assessment of the pH dependence of hybridization, Fig. 2 shows FTIR temperature series of the sequence 5′-TAXGXGXGTA-3′, when X = caC (Fig. 2a,b), and when X = C (Fig. 2d,e), prepared at pH* 6.8 and 3.7 and ranging from 3 to 97 °C in ca. 4.5 °C steps. Samples are prepared in deuterated buffer to eliminate the background from the H2O bend vibration.49 D2O has been shown to have a negligible influence on DNA thermodynamics relative to H2O.50 The solution pD is 0.44 greater than the measured pH*,51 so the deuteron concentration at pH* 6.8 corresponds to standard physiological values. The in-plane ring vibrations, carbonyl stretches, and −ND2 bends of the nucleobases absorb in the 1500–1750 cm−1 frequency range and each base contributes a unique vibrational fingerprint to the oligonucleotide spectrum.44, 46–47
Figure 2:

FTIR temperature series of 5′-TAXGXGXGTA-3′ for X = caC prepared at (a) pH* 6.8 and (b) pH* 3.7 from 3 to 97 °C. Colored windows indicate in-plane nucleobase vibration contributions to each frequency region with the degree of contribution decreasing from top to bottom within a region. (c) Normalized 2nd components from singular value decomposition (SVD) across FTIR temperature series from pH* 6.8 to 3.5. (d,e,f) Corresponding figures for X = C at pH* 6.8 and 3.7.
At pH* 6.8 and 3 °C, both sequences exist overwhelmingly as duplexed DNA. The corresponding spectra of these XG-rich duplexes (Fig. 2a,d) appear similar to one another, although the carboxyl group of caC mixes strongly with the in-plane base vibrations and results in an additional absorption near 1570 cm−1.23 As the temperature increases, the spectrum in this frequency range is reshaped significantly and several prominent changes are indicative of dehybridization. Below 1600 cm−1, the spectrum is dominated by G ring mode absorptions whose intensity increases as X:G base pairing is disrupted. A similar increase corresponding to A ring mode absorption is observed near 1625 cm−1. At higher frequency, the spectrum is congested with multiple overlapping peaks, with the growth in intensity near 1665 cm−1 corresponding to T, X, and G carbonyl absorptions. The increase due to G at this frequency is accompanied by a drop in absorption near 1685 cm−1 since this G carbonyl mode is shifted 20 cm−1 when engaged in a Watson-Crick base pair. The highest frequency T carbonyl at 1690 cm−1 can also contribute to this intensity reduction upon the loss of T:A base pairing.
Reducing the pH* of the oligonucleotide solution significantly alters the FTIR spectrum, particularly at low temperature, as evident through comparison of the pH* 6.8 spectra in Fig. 2a,d against the pH* 3.7 spectra in Fig. 2b,e. FTIR spectra measured at intermediate pH* points at both low and high temperature are shown in Fig. S1. When X = caC, a loss in absorbance is observed near 1575 and 1625 cm−1 as well as a shift of the 1650 cm−1 feature to higher frequency and gain at 1700 cm−1. These spectral changes are consistent with the pH*-dependent FTIR spectra of 2′-deoxy-5′-carboxylcytidine (dcaC) (Fig. S1c & S2). Therefore, we can assign the pH*-dependent changes of X = caC to protonation of the caC nucleobase. Adenine (AMP N1 pKa: 3.9–4.0) and guanine (GMP N7 pKa: 3.0–3.3) can also be protonated under acidic conditions,52–53 but comparison of the spectra in Fig. 2b,e against the pH-dependent FTIR spectra of these nucleosides suggests there is little of these protonation events over the studied pH* range (Fig. S4). The FTIR spectra of X = caC additionally reveal a reduction in amplitude and shift of the 1685 cm−1 guanine mode to lower frequency as caC is protonated. The loss of this feature at neutral pH reports on DNA duplex dissociation, and is always accompanied by an increase in absorbance of the G peaks centered at 1575 and 1665 cm−1, as discussed above. For X = caC, the absorption at 1575 cm−1 instead decreases in amplitude due to shifts in the caC ring vibration upon protonation, suggesting that the loss of the 1685 cm−1 feature at low temperature does not result from duplex dissociation. The frequency and amplitude of the 1685 cm−1 peak is known to be sensitive to DNA conformation as well as the local base pairing and stacking environment,44–45, 47, 54–55 and therefore numerous factors (Fig. S6 & S7) could be responsible for its modulation as discussed in the SI.
From pH* 6.8 to 3.5, X = C exhibits a shift in the 1650 cm−1 peak to higher frequency and growth of a band near 1700 cm−1 at low temperature (Fig. 2e). Both of these spectral changes are consistent with pH*-dependent FTIR spectra of 2′-deoxycytidine (dC), suggesting N3 of C is protonated when X = C over this pH* range, in agreement with the reported pKa,N3 of 4.2–4.5.17, 23, 29 The significant loss and gain at 1685 and 1660 cm−1, respectively, as well as the intensity gain at 1575 cm−1 also suggest changes to guanine either through protonation or a reduction in base pairing. The pKa of guanine’s N7 position (3–3.3) is much lower than pKa,N3 of C,52 and signatures of guanine protonation (Fig. S4) are not present in either the low or high-temperature oligomer spectra. Instead, the intensity changes in the guanine features must be attributed to the loss of G:C base pairing due to N3 protonation of C.
To further characterize the pH*-dependent spectral changes from N3 protonation, we performed an FTIR titration of the X = C sequence from pH* 6.8 to 1.8 at 3 °C (Fig. 3a). Over this pH* range, DNA dissociates to single strands due to protonation of C, A, G, and the phosphate backbone. The spectral changes as the pH* of the solution decreases in Fig. 3a are dominated by features that indicate the loss of G:C base pairing coincident with N3 protonation of C, as assigned above. Evidence of N1 and N7 protonation of A and G, respectively, is only observed at the lowest pH* points sampled (Fig. S4 & S5). Therefore, the 2nd SVD component of the FTIR spectra across this pH* range should report on the N3 C protonation-driven duplex-to-single-strand transition and can be used to estimate the fraction of intact duplexes at 3 °C as a function of pH*. When fit to a Henderson-Hasselbalch equation, the 2nd SVD component duplex-to-single-strand and N3 protonation trend show an inflection point of 3.9 ± 0.1 that corresponds to the acid denaturation melting point (pHm) of the duplex/single-strand equilibrium at 3 °C. In analogy to the melting temperature (Tm) in thermal denaturation experiments, pHm corresponds to the pH where half of the possible duplex species are intact. The value of pHm for X = C is consistent with those previously measured for polymeric DNA.7
Figure 3:

(a) FTIR titration of X = C from pH* 6.8 to 1.8 at 3 °C. (b) 2nd SVD component of FTIR titration on X = C (orange) and X = caC (blue). The 2nd SVD component of X = C and X = caC are fit to eq. S10 and eq. S6, respectively, to extract the inflection point and degree of protonation in the duplex and single-strand. The error in pHm and represent the 95% confidence interval of the fit. (c) Protonated sites per duplex (χ) calculated for X = caC (blue) and X = C (orange) as a function of pH*. Details behind the derivation of eq. S6 and S10 are presented in the SI.
Our pH*-dependent FTIR measurements of X = C and X = caC may be used to estimate the number of protonated C and caC sites, respectively, per duplex (χ) as a function of pH*. For X = caC, an apparent of 5.1 is determined from SVD across pH* at 3 °C (Fig. 3b). The apparent shows no measurable change from 3 to 97 °C (Fig. S3), suggesting that of the X = caC duplex and single-strand are similar. Therefore, we assume that the 5-carboxyl protonation equilibrium for X = caC is identical in the duplex and single-strand and does not strongly depend on temperature. The small change in with temperature is consistent with previous temperature-dependent measurements of nucleic acid protonation.56 Additionally, the X = caC sequence is assumed to be highly duplexed at low temperature across the pH* range studied here based on the spectroscopic signatures consistent with extensive caC:G base pairing observed at pH* 3.7 at 3 °C discussed above. The resulting degree of X = caC duplex protonation as a function of pH* is shown in Fig. 3c. The X = caC duplex is almost completely deprotonated at pH* 6.8 whereas an average of 5+ sites per duplex are protonated below pH* 4.4. Further details regarding our estimation of the degree of protonation are presented in the SI.
As discussed above, the pH*-induced duplex-to-single-strand transition in the X = C sequence appears to be driven by N3 protonation of C. The convolution of these two processes indicates that N3 protonation of C occurs over the same pH*-range as duplex denaturation, but it is not clear how protonation is distributed among duplex and single-strand species. Assuming the effective pKa,N3 and pHm at 3 °C are equivalent for X = C, the fraction of intact duplex species (θext) and degree of N3 protonation in the duplex and single-strand can be related as a function of pH* (See SI for details). As shown in Fig. 3c, X = C is essentially only protonated in the single-strand while the duplex cannot tolerate N3 protonation at even one site. This result may also be interpreted as a significant reduction of pKa,N3 in the duplex relative to the single-strand,57 leading to a sharp decline in duplex fraction at pH* values where single-strand protonation becomes favorable.
Having identified the spectroscopic signatures of dehybridization and nucleobase protonation, we can assess the pH* dependent melting behavior of the two model sequences. To take into account the global changes to the spectrum upon melting, a SVD is performed on the FTIR temperature series at each pH* to determine a melting curve.45, 58 The melting curves measured from pH* 6.8 to 3.5 are shown in Fig. 2c and 2f for the X = caC and C sequences, respectively. While the two sequences have nearly identical melting profiles at pH* 6.8, they exhibit starkly different trends with decreasing pH*. The X = caC melting profile shows only minor shifts in the inflection point of the sigmoidal melting transition with descending pH*, but the low-temperature baseline slope steepens significantly under acidic conditions. In contrast, the melting transition of X = C shifts drastically to lower temperature and broadens as pH* is reduced. Baseline slopes are often observed in thermal melting curves and are attributed to factors such as evaporation, temperature-dependent changes in sample path length, or DNA base solvation.59–60 However, a comparison of spectral changes along the low-temperature baseline when X = caC (Fig. S8) reveals gains in intensity at 1575 and 1660 cm−1, indicating the loss of G:C base pairing, at pH* 3.7 that are not observed under neutral conditions. This observation as well as the abnormally large changes in baseline slope with decreasing pH* when X = caC suggest that the low-temperature baseline is related to changes in base pairing and base stacking within the duplex state. Based on the pH* and temperature dependence of the mid-IR spectra, the pH* dependence of the melting curves, and the assignment of the extent of protonation in the duplex state, we conclude that there is distinct pH-dependent melting behavior due to divergent protonation events in C- and caC-containing duplexes. Whereas the X = C sequence protonates at N3 C over this pH* range and appears unable to tolerate protonation in the duplex state, the X = caC sequence protonates at the exocyclic 5-carboxyl group, resulting in a duplex much more robust to reductions in pH.
pH-Dependent Relaxation Kinetics Monitored with Temperature-Jump Spectroscopy
In addition to equilibrium melting experiments, we employed transient temperature jump (T-jump) measurements to assess the kinetic and dynamic impact of nucleobase protonation in the X = C and caC oligonucleotides. The difference heterodyned dispersed vibrational echo (t-HDVE) spectrum, which can be interpreted like a pump-probe difference spectrum,61 is used to track changes to the DNA ensemble at delays following the T-jump. Illustrative time traces tracked at the most intense difference feature of 1670 cm−1, which contains contributions from G:C and A:T base pairing, are shown for the X = C and caC sequences at pH* 6.8 and 3.7 in Fig. 4. For both sequences and at each pH*, three distinct timescales are observed: (1) a small amplitude rise within ~200 ns (λns), (2) a larger rise near ~100 μs (λμs), and (3) decay of the difference signal due to thermal relaxation and re-hybridization in ~ 2 ms. As shown in the SI using temperature-jump two-dimensional IR spectroscopy (t-2DIR, Fig. S9), λns is primarily assigned to fraying of the A:T termini while λμs corresponds to the duplex-to-single-strand transition. Previous T-jump measurements of short DNA oligomers containing A:T termini have revealed a 10–100 ns AT response that was assigned to fraying of the termini.45, 62 Spectral changes associated with λμs are similar to an equilibrium thermal difference spectrum (Fig. S9) between the initial (Ti) and final (Tf) temperatures, indicating the response corresponds to the duplex-to-single-strand transition.
Figure 4:

(a) Temperature ranges for T-jump experiments of X = caC along the 2nd SVD components from FTIR temperature series at pH* 6.8 (blue) and 3.7 (orange). Kinetic traces probed at 1670 cm−1 from the t-HDVE spectra (Figs. S10 & S11) for each T-jump range at (b) pH* 6.8 and (c) pH* 3.7. (d-f) Corresponding plots for X = C at pH* 6.8 and 3.7. Kinetic traces at intermediate pH* values are shown in Figs. S12 & S13.
For each sequence and pH* condition, T-jump experiments were performed with a fixed jump magnitude (ΔT ≈15 °C) and varying Ti along the duplex-to-single-strand transition region (Fig. 4a,d). Under neutral conditions, X = C and X = caC show similar temperature-dependent relaxation kinetics. In each case, λμs increases exponentially with temperature, as observed in previous T-jump experiments of DNA dissociation.1–2, 58, 62–65 Additionally, the magnitude of the λ μs response varies with the expected change in equilibrium base pairing (Fig. 4a,d) between Ti and Tf. In contrast to λμs, the temperature-dependence of λns is negligible within our experimental resolution. The magnitude of the λns response remains unchanged across the low Ti sampled, but sharply reduces at high temperature. Since λns primarily corresponds to fraying of the A:T termini as well as other changes in base pairing, the amplitude of its response is expected to decrease as Ti approaches a condition where the remaining duplexes in solution are largely frayed at equilibrium. More details relating the signal change of λns to duplex thermodynamics are discussed in the SI.
As the solution pH* is reduced, both X = C and X = caC exhibit drastically different relaxation kinetics compared to those at neutral conditions. The λμs response becomes increasingly non-exponential (Fig. S14) and faster. Additionally, the variation of λμs and its associated signal amplitude with temperature are greatly reduced, signifying a reduction in the barrier to dissociation and cooperativity of the duplex-to-single-strand transition, respectively. For X = caC, the signal change of the duplex/single-strand response decreases at low pH*, consistent with the apparent change in the melting curve shown in Fig. 4d and adds further support that the highly sloped low-temperature baseline observed upon 5-carbxoyl protonation arises from changes in internal duplex base pairing. Overall, our results demonstrate N3 and 5-carboxyl protonation have distinct and significant impacts on DNA duplex stability and dehybridization kinetics.
Self-Consistently Modeling pH-Dependent DNA Hybridization Thermodynamics and Kinetics
To quantify the impact of protonation on the hybridization of our model sequences and to provide a consistent framework with which to discuss all of the experimental results, we propose a model that self-consistently describes the thermodynamics and kinetics of duplex formation. The melting of short oligonucleotides is typically assumed to occur in an all-or-nothing fashion, where DNA strands are fully base paired or separated.60, 66 However, the apparent loss of A:T and G:C base pairing at low temperature and asymmetric melting curves exhibited by X = caC suggests a degree of pH-dependent pre-melting within the DNA duplex. To account for both the sigmoidal duplex-to-single-strand transition and the loss of base pairing at lower temperatures that gives rise to a sloping baseline, we interpret the melting curve as a total base pairing fraction, θ(T) that can be separated into external (θext) and internal (θint) contributions (see SI for additional details):67–68
| (1) |
Here, θext refers to the fraction of intact duplexes containing at least one base pair and is related to the duplex/single-strand (D ⇋ 2S) equilibrium constant, Kd, that can be described by an external enthalpy (ΔH°ext) and entropy (ΔS°ext). The average fraction of intact base pairs within the duplex is given by θint. For polymeric DNA, reductions in θint are the dominant factor in duplex dissociation and typically exhibit a more gradual and less cooperative dependence on temperature relative to θext.67 The low temperature changes in base pairing that manifest as asymmetry in the melting curve also appear to accumulate non-cooperatively with temperature, consistent with the expected profile of θint. For the purpose of modelling θint, we derive an expression for the average fraction of intact base pairs with respect to the equilibrium constant for forming or breaking a single base pair (see SI for details) that is described by an internal enthalpy (ΔH°int) and entropy (ΔS°int).However, it is an oversimplification to assign low-temperature loss of base pairing to the discrete loss of base pair contacts for such a short duplex. Instead, it is more likely that the steepening duplex baseline of X = caC upon 5-carboxyl protonation corresponds to loosening of caC:G base pairing along continuous structural coordinates or an increase in base pair structural fluctuations as suggested previously.42
The model can be extended to incorporate the T-jump results by assuming a two-state equilibrium of self-complementary oligomers, where the observed relaxation rate λμs is related to the association (ka) and dissociation (kd) rates:69
| (2) |
The single-strand concentration ([S]) at the final temperature (Tf) is obtained from the melting curve. In practice, we use a maximum entropy inverse-Laplace transform approach (MEM-iLT)70 to extract λns and λμs, the observed rates of each process (Fig. S15). To determine both the activation enthalpy (ΔHǂ) and entropy (ΔSǂ) of hybridization we fit ka and kd to a Kramers model in the high friction limit:71
| (3) |
| (4) |
where λns is the observed rate of the 10–100 ns response measured in the t-HDVE kinetic traces, and η(T) is the temperature-dependent viscosity of D2O.72 Here, λns is taken as an estimate for the rate of diffusive hybridization in analogy to similar treatments in protein folding studies.73–75 This stems from our assignment of λns as largely corresponding to terminal A:T fraying dynamics, which have been shown to be diffusive in nature.62 The temperature-dependence of λns is negligible within the error of our measurement over the surveyed temperature range, therefore the mean over the lowest three Ti is used in the Kramers analysis. An additional unit parameter is included in the dissociation (C°d) and association (C°a) pre-exponential factor fixed at 1 Pa∙s and 1 Pa∙s∙M−1, respectively, which amounts to assuming that the pre-exponential factor is equivalent for association and dissociation, effectively placing any additional contributions into ΔSǂ.
For a two-state process on a 1D free energy surface, the standard free energy difference between the duplex and single-strand states (ΔG°ext) is equal to the difference between the dissociation (ΔGǂd) and association (ΔGǂa) activation free energies. Therefore, the duplex/single-strand equilibrium constant can be expressed in terms of enthalpic and entropic barriers:
| (5) |
where the numerators in the arguments of the exponentials are equal to ΔS°ext and ΔH°ext, respectively. Using eqs. 1–5, the thermodynamic and kinetic data can be globally fit to self-consistently describe the pH*-dependent hybridization thermodynamics and kinetics of X = C and X = caC. In total, the thermodynamic and kinetic data is described by six parameters: ΔHǂd, ΔHǂa, ΔSǂd, ΔSǂa, ΔHint, ΔSint. An additional parameter (A) that scales the melting 2nd SVD components by a value between 0 and 1 at the lowest temperature measured is also needed (See SI). In an all-or-nothing melting model, thermal melting curves are normalized to 1 along the duplex baseline, reflecting that all duplexes are intact at the lowest temperature. However, sequences with substantial changes in internal base pairing prior to duplex dissociation may not be fully intact at the lowest temperature measured, and the normalization amplitude (A) used in fitting the thermal melting curves is proposed to report on the degree of internal base pairing at the lowest temperature sampled (3 °C).
Fig. 5 shows fits using eqs. 1–5 to the 2nd SVD component melting curves and λμs across temperature for X = caC and X = C. T-jump experiments were performed at select pH* points among the measured equilibrium melting experiments. Therefore, melting 2nd SVD components acquired at pH* 6.0, 5.5, and 3.5 were fit without λμs to eq. 1 using ΔH°ext, ΔS°ext, ΔH°int, and ΔS°int. As shown in Fig. S16 & S17, consistent thermodynamic values are determined when fitting the 2nd SVD components with or without kinetic data. The profiles of θint and θext determined from the fits for X = caC are shown in Fig. 5c. Upon a reduction in pH*, the profile of θext exhibits a small shift toward lower temperature and broadens slightly while θint becomes more sharply decreasing along temperature. The value of A for X = caC is assumed to account for deviations in θint from 1 at 3 °C and was found to be insensitive to pH* within the accuracy of our measurement and model (Fig. S16). Therefore, the average value of 1/A across pH* (0.825) was applied to each 2nd SVD component and the average fit error across pH* is used to estimate the error in A.
Figure 5:

(a,b) Fits (solid lines) to the 2nd SVD components from FTIR temperature series and observed relaxation rates (λμs) from T-jump measurements of X = caC using eqs. 1–5. 2nd SVD components at pH* 6.0, 5.5, and 3.5 were not globally fit with λμs because T-jump measurements were not performed at those pH* conditions. Error bars in (b) represent the amplitude-weighted standard deviation in λμs across probe frequency. (c) Extracted profiles of θext (solid line) and θint (dashed line) from pH* 6.8 to 3.5. θint is normalized to 0.825, which is the average value of 1/A across pH* for X = caC (Fig. S16). The error bar in the value of θint at 3 °C is the mean error in 1/A across pH*. (d-f) Corresponding plots for X = C.
A comparison of the FTIR temperature series from pH* 6.8 to 3.5 for X = C (Fig. 2f) shows substantial broadening and shifting of the melting transition as pH* is reduced, indicating a loss of melting cooperativity and overall destabilization of the duplex, respectively. This provides further evidence that the low pH* samples do not begin from a duplex fraction of unity at 3 °C. The thermal 2nd SVD components measured for the X = C sequence can be modeled using eq. 1, where both θint and θext contribute to the melting profile. However, our FTIR titration analysis suggests that the X = C sequence cannot tolerate N3 protonation in the duplex state, and it is a reasonable approximation that θint is independent of pH*. Therefore, we fit the pH* 6.8 2nd SVD component to eq. 1, determining θint, θext, and a 3 °C normalization offset of 0.825. Under neutral conditions, the slope of θint is expected to arise from fraying of the A:T termini (Fig. S8). The normalized 2nd SVD components at all pH* points were scaled at 3 °C (Fig. 5d) by the value of θext determined from the FTIR titration of X = C (Fig. 3a) and the form of θint at pH* 6.8 (dashed line in Fig. 5f) was assumed constant across all values of pH*. As shown in Fig. 5, both the thermal 2nd SVD components and temperature trend in λμs are well fit within this treatment.
Fig. 6 presents the trends in thermodynamic and kinetic parameters determined from the fits to thermal 2nd SVD components and λμs across pH* for X = caC and X = C. Over the studied pH* range, X = caC exhibits reductions in ΔH°ext and ΔS°ext of ca. 40 kJ/mol and 150 J/molK, respectively. X = C shows substantially greater reductions in ΔH°ext and ΔS°ext of ca. 140 kJ/mol and 400 kJ/mol, further demonstrating the large disruption of duplex formation upon N3 protonation shown here and by others.7, 12–13 5-carboxyl protonation also leads to a reduction in θint as well as increase in ΔH°int and ΔS°int. The dissociation barriers ΔHǂd and ΔSǂd both decrease upon 5-carboxyl and N3 protonation while opposite trends are observed in ΔHǂa and ΔSǂa between the two types of protonation. At pH* 6.8, each sequence exhibits negative association barriers as observed for DNA hybridization in many previous works.1, 62–64, 76 However, ΔHǂa and ΔSǂa each become more negative upon 5-carboxyl protonation and less negative upon N3 protonation. Overall, the activation parameters resemble those in activation energy (E) and pre-exponential factor (A) determined from an Arrhenius analysis of the kinetic data (Fig. S19–S21). Further discussion of the hybridization thermodynamic and kinetic parameter trends with pH* follows.
Figure 6:

Thermodynamic and kinetic parameters determined from fits to melting 2nd SVD components and temperature trends in λμs. (a) External enthalpy (ΔH°ext, solid lines) and enthalpic dissociation barrier (ΔHǂd, dashed lines) for X = C (orange) and X = caC (blue). Parameters for X = caC are fit to the Hill equation. Corresponding plots for (b) enthalpic association barrier (ΔHǂa), (c) internal enthalpy (ΔH°int), (d) external entropy (ΔS°ext, solid lines) and entropic dissociation barrier (ΔSǂd, dashed lines), (e) entropic association barrier (ΔSǂa), and (f) internal entropy (ΔS°int). Hill coefficients (n) from fits to X = caC parameters are shown in (c) and (f).
Examining the trends in thermodynamic and kinetic parameters in Fig. 6 across pH* reveals distinct behavior due to 5-carboxyl and N3 protonation. For X = caC, each parameter remains almost unchanged between pH* 6.8 and 5.0 and then changes sharply across lower pH* values with titration-like behavior. In contrast, X = C exhibits large, but more gradual changes across the pH* window studied. The trends for X = caC can each be well fit by the Hill equation77 with consistent apparent pKa values of ca. 4.5 and variable Hill coefficients (n). For fitting of binding curves, n > 1 indicates positive cooperativity between binding sites that leads to sharpening of the binding transition. The trends in external thermodynamics as well as enthalpic and entropic barriers reveal sharp transitions that fit to values of n > 1.
Discussion
Impact of N3 and 5-Carboxyl Protonation on the Thermodynamic Stability of DNA
Similar to previous studies,6–7, 12–13 the X = C duplex is greatly destabilized as a result of N3 protonation, and our analysis suggests that this specific sequence essentially cannot tolerate any protonation in the duplex state. However, the degree of duplex destabilization from N3 protonation and maximum number of protonated C bases is expected to vary with sequence composition. Previous work with polymeric DNA and short RNA sequences has shown that duplex stability is dependent on the GC content in the sequence.7, 12–13, 18 UV CD measurements suggested that up to 50% of C bases in polymeric DNA could be protonated prior to signs of complete duplex dissociation at low temperature.6 Instead, C protonation leads to disruption of many GC base pairs prior to full dissociation of the duplex.18 It is clear that N3 protonation generally destabilizes the duplex state, but the degree and nature of the destabilization will depend on the context of the GC base pairs. Therefore, while X = C completely dissociates upon a N3 protonation event, other sequences may be able to tolerate some degree of protonation depending on the number and location of GC base pairs present. Regardless, it is well-established that the thermodynamics of nucleic acid hybridization in both polymers and oligonucleotides is additive and can be decomposed into the nearest-neighbor contributions of discrete dinucleotide steps.78–79 It is thus reasonable to expect the present results to apply generally for these base pairs and their local sequence context whether in short duplexes or longer polymeric DNA.
In contrast to the X = C sequence, protonation of the exocyclic carboxyl group of caC is much less perturbative to the duplex/single-strand equilibrium, shifting the melting inflection point down by ~6 °C in going from pH* 6.8 to 3.5. As a result, the X = caC duplex can tolerate near complete protonation of caC sites (Fig. 3), and this leads to measurable changes in internal base pairing in the duplex. As caC is protonated, clear signatures of the loss of G:C base pairing appear along the low-temperature baseline of X = caC (Fig. S8). For short oligonucleotides like those studied here, it is unlikely that the low-temperature G:C changes correspond to complete loss of discrete base pair contacts. Instead, these signatures suggest loosening of hydrogen bonding or base stacking along continuous structural coordinates. Recent MD simulations of caC-containing duplexes demonstrated that 5-carboxyl protonation increases the degree of structural fluctuations within the modified X:G base pair.42 Motions along these structural coordinates alter the intramolecular base pair distance and orientation, which are expected to alter guanine and C vibrational modes. Therefore such structural fluctuations may account for the observed melting curve baselines.47 The physical origin for this base pair loosening may stem from weakened caC:G base pairing due to the electron-withdrawing nature of the protonated carboxylic acid group, consistent with similar base pair loosening observed for DNA containing 5-formylcytosine.68
Assignment of the two pKa values observed for caC (2.1–2.4 and 4.2–4.8) has been debated in recent reports.23, 80–81 Using FTIR titrations and simulated IR spectra of 2’-deoxy-5-carboxylcytosine, we previously concluded that the pKa values at 4.2–4.8 and 2.1–2.4 correspond to protonation of the 5-carboxyl and N3 positions, respectively.23 The pH-dependent behavior of X = C and X = caC observed in the current study further support these assignments. Overall, protonation of X = C is shown disrupt the DNA duplex to a much greater degree than protonation of X = caC from pH* 6.8 – 3.5. If X = caC was protonated at the N3 position in the studied pH* range, similar pH-dependent behavior to X = C would be expected. Therefore, we confidently assign the pKa value at 4.2–4.8 in the caC nucleobase and within duplex DNA to protonation of the 5-carboxyl position.
N3 and 5-Carboxyl Protonation Distinctly alter DNA Hybridization Kinetics
To date, the impact of nucleobase protonation on dissociation and hybridization has remained elusive from a dynamical perspective, despite the importance of these processes in biology and nanotechnology applications. Not only do our results add insight to how N3 protonation impacts the stability of short oligonucleotides as well as the tunability of base pairing stabilities through caC protonation, but we have also characterized the impact on the kinetics of hybridization.
Just as N3 protonation greatly destabilizes the DNA duplex, it also increases the rate of duplex dissociation. For example, kd increases by nearly a factor of 500 at Ti 55 °C between pH* 6.8 and 3.7 (Fig. S19). 5-carboxyl protonation leads to a far more modest increase in the dissociation rate at Ti 55 °C by a factor of 7–10 (Fig. S20) between pH* 6.8 and 3.7. Global fitting of the kinetics and thermodynamics indicate that both N3 and 5-carboxyl protonated oligonucleotides are still well described by a two-state duplex/single-strand model. Over the pH* range studied, each type of protonation results in a similar reduction of 80–100 kJ/mol in ΔHǂd and 200–250 J/mol∙K in ΔSǂd. The trend upon N3 protonation suggests that ΔHǂd and ΔSǂd would continue to decrease at pH* <3.5. However, due to significant protonation of adenine and eventually guanine at pH* <3.5, we have restricted our study to the pH* window between 6.8 and 3.7. In contrast to the dissociation barriers, both ΔHǂa and ΔSǂa become less negative for X = C and more negative for X = caC as pH* decreases.
For both dissociation and association, the enthalpy and entropy are highly pH*-dependent, and therefore simplistic free energy diagrams may be informative for understanding the impact from each type of protonation. Fig. 7 presents free energy plots along a 1D hybridization coordinate for X = C and X = caC at 37 °C. These three-level surfaces are composed of the duplex/single-strand free energy change (left), hybridization transition state (TS, center), and single-strand (right). The single-strand free energy is assumed to be independent of pH* and is set as the reference state. At 37 °C, X = C and X = caC exhibit reductions in ΔGǂd of 25 and 20 kJ/mol, respectively, in going from pH* 6.8 to 3.7. ΔGǂa is essentially independent of N3 protonation at this temperature. Across the studied pH* range, linear relationships are observed between ΔGǂd/ΔGǂa and ΔG°ext for each sequence (Fig 7c). For X = C, a slope of 1.04 is observed when plotting ΔGǂd against ΔG°ext and a slope of 0.06 is observed when plotting ΔGǂa against ΔG°ext, indicating that reduction in ΔGǂd at low pH* is due to destabilization of the duplex relative to the single-strand rather than a change in the transition state energy. In contrast, X = caC exhibits a slope of 1.77 for ΔGǂd vs. ΔG°ext and 0.77 for ΔGǂa vs. ΔG°ext, indicating that both destabilization of the duplex relative to the single-strand and a reduction in transition state free energy occur upon 5-carboxyl protonation.
Figure 7:

Representative 1D free energy plots for (a) X = C and (b) X = caC at 37 °C constructed using the association (ΔGǂa) and dissociation (ΔGǂd) free energy barriers determined from global fitting between T-jump and FTIR temperature series results. (c) Relationship between ΔGǂd (circles) and ΔGǂa (diamonds) and ΔG°ext at 37 °C for X = C (orange) and X = caC (blue). Solid lines indicate linear fits.
Proposed Mechanistic Impact of N3 and 5-Carboxyl Protonation on DNA Hybridization
One can gain further insight into the mechanistic implications of the thermodynamic and kinetic results if we assume that the hybridization transition state involves the formation of some small subset of native contacts followed by rapid downhill formation of the remaining base pairs, in analogy to the classic nucleation-zipper mechanism of helix-to-coil transitions in biomolecules.2–3 At neutral pH*, both sequences exhibit negative values of ΔHǂa (Fig. 6b). This result has been observed routinely in DNA hybridization,1–2, 4, 58, 62–64, 76 and is assumed to account for base pair formation in the transition state. A large entropic penalty due to loss of translational and configuration freedom accompanies this initial base pair formation, causing the rate of association to decrease as temperature increases.
Interestingly, ΔHǂa approaches 0 kJ/mol and ΔSǂa becomes less negative with increasing N3 protonation of the X = C oligonucleotide. Multiple possibilities could account for the reduction in magnitude of ΔHǂa. The X = C single-strand is expected to become highly protonated as pH* decreases, as evidenced by the pH-driven denaturation observed in Fig. 3. For GC-rich sequences such as the one studied here, hybridization is assumed to initiate at C:G base pairs, but protonation at N3 interferes with the ability to form C:G contacts. Therefore, the number of contacts in the transition state may remain unchanged but offer less enthalpic stabilization due to the competition between base pair hydrogen bonding and protonation at N3. In addition, the reduction in magnitude of ΔSǂa may result from changes in solvation and sodium cation environment around the protonated single-strand as noted previously.82 As more N3 sites are protonated, the negative charge density of the single-strand is reduced, and the number of bound sodium cations and excluded chloride and phosphate anions decrease. Analysis of the FTIR titration (Fig. 3) on X = C suggests that N3 protonation can only occur in the single-strand. As a result, the charge density and counterion environment around the protonated single-strand and deprotonated duplex are quite different, and hybridization of the former must involve the loss of N3 protons, gain of associated sodium cations, and exclusion of additional anions. These changes likely contribute to the thermodynamic and kinetic effects observed for N3 protonation in the X = C sequence.
The decrease in the magnitude of ΔHǂa and ΔSǂa at low pH* could also reflect a reduction in the number of base pairs formed in the hybridization transition state. ΔHǂa ranges from −35 to 0 kJ/mol over the pH* range studied here. The average enthalpic benefit associated with forming a base pair in the CG region of X = C is estimated to be −21 kJ/mol based on the unified nearest-neighbor parameters for DNA hybridization.78 Therefore, the change in ΔHǂa suggests that the number of base pair contacts in the transition state shifts from ~2 to 0 upon protonation. For the X = C sequence, the reduction of ΔHǂa to 0 kJ/mol would suggest that no base pairs are formed in the transition-state at low pH*. Even in this case, ka is 100 times slower (~107 M−1s−1) than the estimated diffusion-limited association rate constant determined from fluorescence correlation spectroscopy (FCS) measurements of short oligonucleotides,76 indicating that an entropic barrier to duplex formation dictates DNA hybridization kinetics even without the formation of base pair contacts in the transition state.
While protonation of the X = caC sequence also increases the rate of duplex association, ΔHǂa and ΔSǂa are both observed to increase in magnitude as pH* is lowered. Again, this could be interpreted as changes to the energetics of initial contact formation or reflect a change in the structure of the hybridization transition state. 5-carboxyl protonation has the potential to impact intra- and inter-strand electrostatics, caC:G base pairing, base stacking, and major groove solvation. Our pH*-dependent FTIR results indicate that caC sites within X = caC are essentially completely deprotonated at pH* 6.8, adding substantial negative charge to the duplex and single-strand states. Protonation of caC should reduce electrostatic repulsion between the exocyclic carboxyl group and the phosphate backbone. However, the absence of negative charge may alter the degree of hydration in the major groove. Our model for internal base pairing suggests that 5-carboxyl protonation increases the enthalpic stabilization of base pair formation (Fig. 6c) even though contacts become loosened overall. Such an increase in ΔH°int may explain the increase in magnitude of ΔHǂa as pH* decreases, but not the increase in entropic penalty. The change in ΔSǂa is more complex as 5-carboxyl protonation can alter factors such as base hydration and single-strand flexibility.83 Both the increase in magnitude of ΔHǂa and ΔSǂa and decrease in ΔHǂd and ΔSǂd could also be explained by an increase in the number of base pair contacts associated with the hybridization transition state, which could in turn result from the increased structural fluctuation of caC:G base pairs upon 5-carboxyl protonation.42
Our results demonstrate that N3 and 5-carboxyl protonation significantly perturb DNA hybridization and dissociation kinetics, but in a nucleobase-specific manner that can be rationalized in terms of duplex destabilization and changes to the transition state for a two-state process. However, it is important to note that while the nature of the transition state may change, so too may the distribution of transition states. As shown in Fig. 4 & S14, both sequences exhibit non-exponential relaxation kinetics at low pH* that may stem from inhomogeneity among the duplex ensemble or the transition state. This spread of rates may be modulated by base pairing fluctuations, solvent and ion interactions, as well as distributions of protonated species. A more detailed discussion regarding the origin of the non-exponential kinetics is presented in the SI.
Protonated caC Sites Cooperatively Impact Duplex-to-Single-Strand Thermodynamics and Kinetics
5-carboxyl protonation reduces the overall magnitude of the thermodynamic parameters for duplex dissociation (ΔH°ext, ΔS°ext, ΔG°ext) in an apparently cooperative manner. As shown in Fig. 6, trends in ΔH°ext, ΔS°ext, and ΔG°ext for X = caC follow a Hill profile with Hill coefficient >1, signifying positive cooperativity. Typically, Hill equations are applied to identify cooperativity in binding problems,84 but here the protonation of X = caC is noncooperative (n = 1, Fig. 3). Instead, 5-carboxyl protonation seems to cooperatively shift the thermodynamics of the duplex-to-single-strand transition. Our analysis indicates that nearly all caC sites in the duplex state become protonated from pH* 6.8 to 3.5, and therefore it is possible that multiple protonated caC:G base pairs interact. It seems most likely that such cooperativity would arise from adjacent protonated base pairs, where increased structural fluctuations of each may amplify the weakening of hydrogen bonding and base stacking interactions. Similar effects were predicted for C methylation in which simulations of adjacent methylated CpG dinucleotides influenced base pair fluctuations in a more than additive manner.85
Similar to the shifts in duplex/single-strand equilibrium, 5-carboxyl protonation appears to alter DNA hybridization kinetics in a cooperative manner as both dissociation and association barriers show sharp transitions as a function of pH* and exhibit a Hill coefficient greater than 1 (Fig. 6). Additionally, the pH* trends in dissociation barrier show a sharper transition (larger Hill coefficient) than observed for the external thermodynamic terms. As shown in the 1D free energy surfaces (Fig. 7b), the pH*-dependence of ΔGǂd at 37 °C has contributions from duplex destabilization and a reduction in free energy of the transition state as pH* is lowered. The former corresponds to ΔG°ext while the latter is only captured by ΔGǂd and ΔGǂa. Therefore, the more cooperative manner in which ΔGǂd varies as a function of pH* relative to ΔG°ext suggests that protonation of multiple 5-carboxyl sites leads to a cooperative change in the free energy of the hybridization transition state in addition to the duplex state. A comparison of ΔHǂd with ΔH°ext and ΔSǂd with ΔS°ext reveal the same trends in apparent cooperativity with 5-carboxyl protonation.
N3 protonation leads to a larger reduction in DNA duplex stability and dissociation barrier than 5-carboxyl protonation, but it does so almost linearly as a function of pH* (Fig. 6a) over the range studied. This more gradual reduction reflects a non- or anti-cooperative impact of N3 protonation on the duplex-to-single-strand transition and is consistent with our FTIR titration results that estimate the X = C duplex cannot tolerate N3 protonation, making cooperative interactions between multiple protonated sites in the duplex very unlikely.
Conclusions
We have investigated the impact of cytosine and 5-carboxylcytosine protonation on the thermodynamics and kinetics of DNA dissociation and hybridization using FTIR and optically-induced temperature-jump IR spectroscopy. Our results demonstrate that between pH* 6.8 and 3.5, DNA containing C and caC are predominantly protonated at the N3 and 5-carboxyl positions, respectively. Each protonation is shown to have a distinct impact on the thermodynamics and kinetics of dissociation and association between model DNA oligonucleotides. Protonation at N3 completely disrupts the ability of the DNA to duplex, shifts the melting inflection point by >20 °C, and reduces the cooperativity of the duplex-to-single-strand transition. These thermodynamic properties are accompanied by a speedup in the rate of duplex dissociation and increasingly stretched exponential kinetics at low pH*, with the reduction in dissociation barrier primarily achieved through destabilization of the duplex state. 5-carboxyl protonation leads to highly sloped melting baselines that reflect an accumulation of disrupted base pairing contacts in the duplex state, but perturbations to the duplex/single-strand equilibrium are comparatively minor. Regardless of the identity of X, the dissociation free energy barrier is reduced to a similar degree over the pH* range studied. However, N3 protonation does reduces the barrier through destabilization of the DNA duplex while 5-carboxyl protonation reduces the dehybridization transition state energy. Unlike with N3 protonation, X = caC duplexes can be highly protonated, and protonation of multiple sites is observed to alter duplex/single-strand thermodynamics and kinetics in a cooperative manner.
Protonation of N3 in cytosine plays critical roles in DNA damage, triplex association, and i-motif formation and is utilized to create pH-driven nanodevices. Additionally, the potential importance of the protonation equilibrium of 5-carboxylcytosine in cytosine demethylation has recently come to light. Each of these functions and applications rely on protonation-driven perturbations to double helical DNA, and this work demonstrates the unique ability of N3 and 5-carboxyl protonation to alter the stability, hybridization kinetics, and base pairing dynamics of nucleic acids. The loosening of caC:G base pairing and reduction in dissociation barrier initiated by caC protonation may assist in its selective recognition within the cytosine demethylation pathway.27–28, 30, 86 Such pH-dependent base pair loosening as well as the overall reduction of pKa,N3 upon substitution of caC for C may also prove useful in tuning the physical properties of DNA triplex and i-motif formation. Recent work has shown that caC can effectively fine tune the thermodynamic stability of both structures,38–39 and the results and analysis in the present work provide physical insight into the observed thermodynamic response of the DNA triplex and i-motif to incorporation of caC as well as the prediction of pH-dependent dynamical behavior upon protonation of the 5-carboxyl group.
Materials and Methods
Synthesis and Purification of 5′-TA(caC)G(caC)G(caC)GTA-3′
Unmodified and 5caC phosphoramidites were purchased from Glen Research and DNA oligomers were synthesized at 1 μmol scale in several batches. After oligomer synthesis, the beads were treated with 0.1 M K2CO3 in 1:1 MeOH/water at 42 °C for 16 hours, and then acetic acid was added to neutralize the pH to 7.0. Oligomers were subsequently purified with dialysis in ultrapure water at 4 °C for 48 hours and lyophilized to a powder form.
Oligonucleotide Sample Preparation
The sequence 5′-TACGCGCGTA-3′ was purchased from Integrated DNA Technologies (IDT) at desalt grade purity. Samples were purified further with 3 kD cutoff centrifugal filters (Amicon). For IR spectroscopic measurements, all labile protons were exchanged in deuterium oxide (D2O, Cambridge Isotopes, 99.9%). Samples were prepared at a concentration of 1 mM in deuterated 20 mM sodium phosphate buffer at pH* 6.8 with 16 mM NaCl. Units of pH* indicate the measured pH of a deuterated solution using a standard glass electrode pH meter. The pKa values reported here were first converted to represent the value that would be determined in a non-deuterated solution.51 Solutions were prepared at reported pH* values through the addition of concentrated DCl. To minimize HOD content, samples were lyophilized after addition of DCl and re-dissolved in the appropriate volume of pure D2O.
Equilibrium FTIR and 2D IR Measurements
FTIR spectra were measured with a Bruker Tensor FTIR spectrometer at 1 cm−1 resolution. Samples were placed between two 1 mm thick CaF2 windows separated by a 50 μm Teflon spacer enclosed within a home-built brass jacket. The jacket temperature is controlled with a recirculating chiller (Ministat 125, Huber). The sample temperature for a given chiller bath temperature was determined using a thermocouple attached to the center of the CaF2 window. The FTIR titration of X = C was performed using a home-built flow cell with a 50 μm path length and 1 mm CaF2 windows. Samples prepared at each pH* condition were flowed into the sample cell using a syringe pump (Harvard Apparatus).
Two-dimensional (2D IR) measurements were performed on a previously described setup with a BOXCAR geometry.87–88 2D IR spectra were collected with ZZZZ polarization and at a fixed waiting time (τ2) of 150 fs. The coherence time (τ1) was scanned from −60 to 2500 fs and −60 to 2000 fs for rephasing and non-rephasing surfaces, respectively, with a 4 fs step size.
Transient T-jump IR Spectroscopy
The details of our temperature-jump (T-jump) spectrometer have previously been described in detail.87–88 In brief, the output of a frequency-doubled Nd:YAG (YG 980, Quantel) was sent through an optical parametric oscillator (OPO) to generate 2 μm pulses (5 ns, 20 mJ, 20 Hz) used to pump the O-D stretch overtone of D2O. Time-dependent changes to the DNA structure are monitored between 5 ns and 50 ms with nonlinear infrared spectroscopy. Transient heterodyne detected vibrational echo (t-HDVE) infrared spectra were acquired in ZZZZ polarization and the local oscillator was stepped in 5 fs intervals between −10 and 10 fs relative to maximum interference with the DVE signal. t-HDVE spectra were processed with Fourier Transform Spectral Interferometry,61, 89 and the recovered dispersed pump-probe (t-DPP) is used throughout the study. Transient 2D IR (t-2DIR) measurements were acquired with undersampling along τ1 at a fixed τ2 of 150 fs. A τ1 step size of 16 fs was used. Rephasing and non-rephasing FIDs were scanned from −60 to 1750 fs and −60 to 1250 fs, respectively. Initial temperatures (Ti) were set using a recirculating chiller connected to a brass sample jacket as for FTIR measurements. The temperature-jump magnitude (ΔT) was determined through monitoring the change in mid-IR D2O transmission and was set by adjusting the voltages applied to the Nd:YAG flashlamps or by using a polarizer to attenuate the 2 μm output. In this study, ΔT was set to ~15 °C for each measurement.
Supplementary Material
Acknowledgements
B.A., P.J.S., and A.T. acknowledge the National Science Foundation (Grant No. CHE-1856684) and the National Institute of General Medical Sciences of the National Institutes of Health (Award No. R01GM118774) for support of this research. B.A. acknowledges support from the NSF GRFP. Q.D. was supported by the National Institutes of Health (Grant No. 5K01HG006699). C.H. acknowledges the National Institutes of Health (Award No. R01HG006827). The authors also thank Ram Itani for design and construction of the flowcell used for FTIR titration measurements.
Footnotes
Supporting Information
Detailed description and interpretation of pH-dependent FTIR spectra; Assignment of observed T-jump timescales using T-jump 2D IR spectroscopy (t-2DIR); T-jump data of intermediate pH* samples for X = C and X = caC; Description of T-jump rate extraction using maximum entropy inverse Laplace transform (MEM-iLT) approach; Description and interpretation of stretched-exponential T-jump relaxation kinetics; Correlation between θint and λns; Arrhenius analysis of T-jump kinetic data. This information is available free of charge via the Internet at http://pubs.acs.org.
The authors declare no competing financial interest.
References
- 1.Chen C; Wang W; Wang Z; Wei F; Zhao XS, Influence of secondary structure on kinetics and reaction mechanism of DNA hybridization. Nucleic Acids Res. 2007, 35, 2875–2884. [DOI] [PMC free article] [PubMed] [Google Scholar]
- 2.Craig ME; Crothers DM; Doty P, Relaxation kinetics of dimer formation by self complementary oligonucleotides. J. Mol. Biol 1971, 62, 383–401. [DOI] [PubMed] [Google Scholar]
- 3.Pörschke D; Uhlenbeck O; Martin F, Thermodynamics and kinetics of the helix-coil transition of oligomers containing GC base pairs. Biopolymers 1973, 12, 1313–1335. [Google Scholar]
- 4.Wetmur JG; Davidson N, Kinetics of renaturation of DNA. J. Mol. Biol 1968, 31, 349–370. [DOI] [PubMed] [Google Scholar]
- 5.Anderson CF; Record MT Jr, Salt-nucleic acid interactions. Annu. Rev. Phys. Chem 1995, 46, 657–700. [DOI] [PubMed] [Google Scholar]
- 6.Zimmer C; Luck G; Venner H; Frič J, Studies on the conformation of protonated DNA. Biopolymers 1968, 6, 563–574. [DOI] [PubMed] [Google Scholar]
- 7.Zimmer C; Venner H, Protonation of cytosine in DNA. Biopolymers 1966, 4, 1073–1079. [DOI] [PubMed] [Google Scholar]
- 8.Gulland JM; Jordan D; Taylor H, 213. Deoxypentose nucleic acids. Part II. Electrometric titration of the acidic and the basic groups of the deoxypentose nucleic acid of calf thymus. J. Chem. Soc 1947, 1131–1141. [DOI] [PubMed] [Google Scholar]
- 9.Mergny J-L; Lacroix L; Han X; Leroy J-L; Helene C, Intramolecular folding of pyrimidine oligodeoxynucleotides into an i-DNA motif. J. Am. Chem. Soc 1995, 117, 8887–8898. [Google Scholar]
- 10.Abou Assi H; Garavís M; González C; Damha MJ, i-Motif DNA: structural features and significance to cell biology. Nucleic Acids Res. 2018, 46, 8038–8056. [DOI] [PMC free article] [PubMed] [Google Scholar]
- 11.Frank-Kamenetskii MD; Mirkin SM, Triplex DNA structures. Annu. Rev. Biochem 1995, 64, 65–95. [DOI] [PubMed] [Google Scholar]
- 12.Mariani A; Bonfio C; Johnson CM; Sutherland JD, pH-Driven RNA strand separation under prebiotically plausible conditions. Biochemistry 2018, 57, 6382–6386. [DOI] [PMC free article] [PubMed] [Google Scholar]
- 13.Woodbury C; Record M Jr, A range of G+ C‐independent denaturation solvents for DNA. Biopolymers 1975, 14, 2417–2420. [Google Scholar]
- 14.Casey JR; Grinstein S; Orlowski J, Sensors and regulators of intracellular pH. Nat. Rev. Mol. Cell Biol 2010, 11, 50–61. [DOI] [PubMed] [Google Scholar]
- 15.Watson JD; Crick FH, Molecular structure of nucleic acids. Nature 1953, 171, 737–738. [DOI] [PubMed] [Google Scholar]
- 16.Courtois Y; Fromageot P; Guschlbauer W, Protonated polynucleotide structures: 3. An optical rotatory dispersion study of the protonation of DNA. Eur. J. Biochem 1968, 6, 493–501. [DOI] [PubMed] [Google Scholar]
- 17.González-Olvera JC; Durec M; Marek R; Fiala R; Morales-García M d. R. J.; González-Jasso, E.; Pless, R. C., Protonation of Nucleobases in Single-and Double-Stranded DNA. ChemBioChem 2018, 19, 2088–2098. [DOI] [PubMed] [Google Scholar]
- 18.Smol’janinova T; Zhidkov V; Sokolov G, Analysis of difference spectra of protonated DNA: determination of degree of protonation of nitrogen bases and the fractions of disordered nucleotide pairs. Nucleic Acids Res. 1982, 10, 2121–2134. [DOI] [PMC free article] [PubMed] [Google Scholar]
- 19.Sorokin VA; Gladchenko GO; Valeev VA, DNA protonation at low ionic strength of solution. Macromol. Chem. Phys 1986, 187, 1053–1063. [Google Scholar]
- 20.Tajmir-Riahi H; Ahmad R; Naoui M; Diamantoglou S, The effect of HCl on the solution structure of calf thymus DNA: a comparative study of DNA denaturation by proton and metal cations using Fourier transform IR difference spectroscopy. Biopolymers 1995, 35, 493–501. [DOI] [PubMed] [Google Scholar]
- 21.Nikolova EN; Goh GB; Brooks III CL; Al-Hashimi HM, Characterizing the protonation state of cytosine in transient G· C Hoogsteen base pairs in duplex DNA. J. Am. Chem. Soc 2013, 135, 6766–6769. [DOI] [PMC free article] [PubMed] [Google Scholar]
- 22.Zeraati M; Langley DB; Schofield P; Moye AL; Rouet R; Hughes WE; Bryan TM; Dinger ME; Christ D, I-motif DNA structures are formed in the nuclei of human cells. Nat. Chem 2018, 10, 631–637. [DOI] [PubMed] [Google Scholar]
- 23.Dai Q; Sanstead PJ; Peng CS; Han D; He C; Tokmakoff A, Weakened N3 hydrogen bonding by 5-formylcytosine and 5-carboxylcytosine reduces their base-pairing stability. ACS Chem. Biol 2015, 11, 470–477. [DOI] [PMC free article] [PubMed] [Google Scholar]
- 24.Privat EJ; Sowers LC, A proposed mechanism for the mutagenicity of 5-formyluracil. Mutat. Res 1996, 354, 151–156. [DOI] [PubMed] [Google Scholar]
- 25.Driggers P; Beattie K, Effect of pH on the base-mispairing properties of 5-bromouracil during DNA synthesis. Biochemistry 1988, 27, 1729–1735. [DOI] [PubMed] [Google Scholar]
- 26.Ito S; Shen L; Dai Q; Wu SC; Collins LB; Swenberg JA; He C; Zhang Y, Tet proteins can convert 5-methylcytosine to 5-formylcytosine and 5-carboxylcytosine. Science 2011, 333, 1300–1303. [DOI] [PMC free article] [PubMed] [Google Scholar]
- 27.Zhang L; Lu X; Lu J; Liang H; Dai Q; Xu G-L; Luo C; Jiang H; He C, Thymine DNA glycosylase specifically recognizes 5-carboxylcytosine-modified DNA. Nat. Chem. Biol 2012, 8, 328–330. [DOI] [PMC free article] [PubMed] [Google Scholar]
- 28.Maiti A; Michelson AZ; Armwood CJ; Lee JK; Drohat AC, Divergent mechanisms for enzymatic excision of 5-formylcytosine and 5-carboxylcytosine from DNA. J. Am. Chem. Soc 2013, 135, 15813–15822. [DOI] [PMC free article] [PubMed] [Google Scholar]
- 29.La Francois CJ; Jang YH; Cagin T; Goddard WA; Sowers LC, Conformation and proton configuration of pyrimidine deoxynucleoside oxidation damage products in water. Chem. Res. Toxicol 2000, 13, 462–470. [DOI] [PubMed] [Google Scholar]
- 30.Hashimoto H; Hong S; Bhagwat AS; Zhang X; Cheng X, Excision of 5-hydroxymethyluracil and 5-carboxylcytosine by the thymine DNA glycosylase domain: its structural basis and implications for active DNA demethylation. Nucleic Acids Res. 2012, 40, 10203–10214. [DOI] [PMC free article] [PubMed] [Google Scholar]
- 31.Dong Y; Yang Z; Liu D, DNA nanotechnology based on i-motif structures. Acc. Chem Res 2014, 47, 1853–1860. [DOI] [PubMed] [Google Scholar]
- 32.Idili A; Vallée-Bélisle A; Ricci F, Programmable pH-triggered DNA nanoswitches. J. Am. Chem. Soc 2014, 136, 5836–5839. [DOI] [PubMed] [Google Scholar]
- 33.Porchetta A; Idili A; Vallée-Bélisle A; Ricci F, General strategy to introduce pH-induced allostery in DNA-based receptors to achieve controlled release of ligands. Nano Lett. 2015, 15, 4467–4471. [DOI] [PMC free article] [PubMed] [Google Scholar]
- 34.Amodio A; Zhao B; Porchetta A; Idili A; Castronovo M; Fan C; Ricci F, Rational design of pH-controlled DNA strand displacement. J. Am. Chem. Soc 2014, 136, 16469–16472. [DOI] [PubMed] [Google Scholar]
- 35.Modi S; Nizak C; Surana S; Halder S; Krishnan Y, Two DNA nanomachines map pH changes along intersecting endocytic pathways inside the same cell. Nat. Nanotechnol 2013, 8, 459–467. [DOI] [PubMed] [Google Scholar]
- 36.Lannes L; Halder S; Krishnan Y; Schwalbe H, Tuning the pH Response of i-Motif DNA Oligonucleotides. ChemBioChem 2015, 16, 1647–1656. [DOI] [PubMed] [Google Scholar]
- 37.Zamiri B; Mirceta M; Bomsztyk K; Macgregor RB Jr; Pearson CE, Quadruplex formation by both G-rich and C-rich DNA strands of the C9orf72 (GGGGCC) 8•(GGCCCC) 8 repeat: effect of CpG methylation. Nucleic Acids Res. 2015, 43, 10055–10064. [DOI] [PMC free article] [PubMed] [Google Scholar]
- 38.Wright EP; Abdelhamid MAS; Ehiabor MO; Grigg MC; Irving K; Smith NM; Waller ZAE, Epigenetic modification of cytosines fine tunes the stability of i-motif DNA. Nucleic Acids Res. 2019, DOI: 10.1093/nar/gkz1082. [DOI] [PMC free article] [PubMed] [Google Scholar]
- 39.Sumino M; Ohkubo A; Taguchi H; Seio K; Sekine M, Synthesis and properties of oligodeoxynucleotides containing 5-carboxy-2′-deoxycytidines. Bioorg. Med. Chem. Lett 2008, 18, 274–277. [DOI] [PubMed] [Google Scholar]
- 40.Münzel M; Lischke U; Stathis D; Pfaffeneder T; Gnerlich FA; Deiml CA; Koch SC; Karaghiosoff K; Carell T, Improved synthesis and mutagenicity of oligonucleotides containing 5-hydroxymethylcytosine, 5-formylcytosine and 5-carboxylcytosine. Chem. Eur. J 2011, 17, 13782–13788. [DOI] [PubMed] [Google Scholar]
- 41.Szulik MW; Pallan PS; Nocek B; Voehler M; Banerjee S; Brooks S; Joachimiak A; Egli M; Eichman BF; Stone MP, Differential stabilities and sequence-dependent base pair opening dynamics of Watson–Crick base pairs with 5-hydroxymethylcytosine, 5-formylcytosine, or 5-carboxylcytosine. Biochemistry 2015, 54, 1294–1305. [DOI] [PMC free article] [PubMed] [Google Scholar]
- 42.Ngo TT; Yoo J; Dai Q; Zhang Q; He C; Aksimentiev A; Ha T, Effects of cytosine modifications on DNA flexibility and nucleosome mechanical stability. Nat. Commun 2016, 7, 10813. [DOI] [PMC free article] [PubMed] [Google Scholar]
- 43.Hansch C; Leo A; Taft R, A survey of Hammett substituent constants and resonance and field parameters. Chem. Rev 1991, 91, 165–195. [Google Scholar]
- 44.Banyay M; Sarkar M; Gräslund A, A library of IR bands of nucleic acids in solution. Biophys. Chem 2003, 104, 477–488. [DOI] [PubMed] [Google Scholar]
- 45.Sanstead PJ; Stevenson P; Tokmakoff A, Sequence-dependent mechanism of DNA oligonucleotide dehybridization resolved through infrared spectroscopy. J. Am. Chem. Soc 2016, 138, 11792–11801. [DOI] [PubMed] [Google Scholar]
- 46.Peng CS; Jones KC; Tokmakoff A, Anharmonic vibrational modes of nucleic acid bases revealed by 2D IR spectroscopy. J. Am. Chem. Soc 2011, 133, 15650–15660. [DOI] [PubMed] [Google Scholar]
- 47.Lee C; Cho M, Vibrational dynamics of DNA. II. Deuterium exchange effects and simulated IR absorption spectra. J. Chem. Phys 2006, 125, 114509. [DOI] [PubMed] [Google Scholar]
- 48.Stelling AL; Xu Y; Zhou H; Choi SH; Clay MC; Merriman DK; Al-Hashimi HM, Robust IR-based detection of stable and fractionally populated G-C+ and A-T Hoogsteen base pairs in duplex DNA. FEBS Lett. 2017, 591, 1770–1784. [DOI] [PMC free article] [PubMed] [Google Scholar]
- 49.Falk M; Ford T, Infrared spectrum and structure of liquid water. Can. J. Chem 1966, 44, 1699–1707. [Google Scholar]
- 50.Albergo DD; Marky LA; Breslauer KJ; Turner DH, Thermodynamics of (dG-dC) 3 double-helix formation in water and deuterium oxide. Biochemistry 1981, 20, 1409–1413. [DOI] [PubMed] [Google Scholar]
- 51.Krȩżel A; Bal W, A formula for correlating pKa values determined in D2O and H2O. J. Inorg. Biochem 2004, 98, 161–166. [DOI] [PubMed] [Google Scholar]
- 52.Benoit RL; Fréchette M, Protonation of hypoxanthine, guanine, xanthine, and caffeine. Can. J. Chem 1985, 63, 3053–3056. [Google Scholar]
- 53.Major DT; Laxer A; Fischer B, Protonation studies of modified adenine and adenine nucleotides by theoretical calculations and 15N NMR. J. Org. Chem 2002, 67, 790–802. [DOI] [PubMed] [Google Scholar]
- 54.Krummel AT; Zanni MT, DNA vibrational coupling revealed with two-dimensional infrared spectroscopy: insight into why vibrational spectroscopy is sensitive to DNA structure. J. Phys. Chem. B 2006, 110, 13991–14000. [DOI] [PubMed] [Google Scholar]
- 55.Peng CS Two-dimensional infrared spectroscopy of nucleic acids: application to tautomerism and DNA aptamer unfolding dynamics Ph.D. Dissertation, Massachusetts Institute of Technology, Cambridge, MA, 2014. [Google Scholar]
- 56.Siegfried NA; O’Hare B; Bevilacqua PC, Driving forces for nucleic acid pKa shifting in an A+· C wobble: effects of helix position, temperature, and ionic strength. Biochemistry 2010, 49, 3225–3236. [DOI] [PubMed] [Google Scholar]
- 57.Crothers DM, Statistical thermodynamics of nucleic acid melting transitions with coupled binding equilibria. Biopolymers 1971, 10, 2147–2160. [DOI] [PubMed] [Google Scholar]
- 58.Menssen RJ; Tokmakoff A, Length-dependent melting kinetics of short DNA oligonucleotides using temperature-jump IR spectroscopy. J. Phys. Chem. B 2019, 123, 756–767. [DOI] [PubMed] [Google Scholar]
- 59.Amunson KE; Anderson BA; Kubelka J, Temperature effects on the optical path length of infrared liquid transmission cells. Appl. Spec 2011, 65, 1307–1313. [DOI] [PubMed] [Google Scholar]
- 60.Mergny J-L; Lacroix L, Analysis of thermal melting curves. Oligonucleotides 2003, 13, 515–537. [DOI] [PubMed] [Google Scholar]
- 61.Jones KC; Ganim Z; Tokmakoff A, Heterodyne-detected dispersed vibrational echo spectroscopy. J. Phys. Chem. A 2009, 113, 14060–14066. [DOI] [PubMed] [Google Scholar]
- 62.Sanstead PJ; Tokmakoff A, Direct observation of activated kinetics and downhill dynamics in dna dehybridization. J. Phys. Chem. B 2018, 122, 3088–3100. [DOI] [PubMed] [Google Scholar]
- 63.Pörschke D; Eigen M, Co-operative non-enzymatic base recognition III. Kinetics of the helix—coil transition of the oligoribouridylic· oligoriboadenylic acid system and of oligoriboadenylic acid alone at acidic pH. J. Mol. Biol 1971, 62, 361–381. [DOI] [PubMed] [Google Scholar]
- 64.Williams AP; Longfellow CE; Freier SM; Kierzek R; Turner DH, Laser temperature-jump, spectroscopic, and thermodynamic study of salt effects on duplex formation by dGCATGC. Biochemistry 1989, 28, 4283–4291. [DOI] [PubMed] [Google Scholar]
- 65.Holmstrom ED; Dupuis NF; Nesbitt DJ, Pulsed IR heating studies of single-molecule DNA duplex dissociation kinetics and thermodynamics. Biophys. J 2014, 106, 220–231. [DOI] [PMC free article] [PubMed] [Google Scholar]
- 66.Owczarzy R, Melting temperatures of nucleic acids: discrepancies in analysis. Biophys. Chem 2005, 117, 207–215. [DOI] [PubMed] [Google Scholar]
- 67.Wartell RM; Benight AS, Thermal denaturation of DNA molecules: a comparison of theory with experiment. Phys. Rep 1985, 126, 67–107. [Google Scholar]
- 68.Sanstead PJ; Ashwood B; Dai Q; He C; Tokmakoff A, Oxidized Derivatives of 5-Methylcytosine Alter the Stability and Dehybridization Dynamics of Duplex DNA. Submitted. [DOI] [PMC free article] [PubMed] [Google Scholar]
- 69.Bernasconi C, Relaxation kinetics. Academic Press: New York 1976. [Google Scholar]
- 70.Kumar AT; Zhu L; Christian J; Demidov AA; Champion PM, On the rate distribution analysis of kinetic data using the maximum entropy method: Applications to myoglobin relaxation on the nanosecond and femtosecond timescales. J. Phys. Chem. B 2001, 105, 7847–7856. [Google Scholar]
- 71.Kramers HA, Brownian motion in a field of force and the diffusion model of chemical reactions. Physica 1940, 7, 284–304. [Google Scholar]
- 72.Cho C; Urquidi J; Singh S; Robinson GW, Thermal offset viscosities of liquid H2O, D2O, and T2O. J. Phys. Chem. B 1999, 103, 1991–1994. [Google Scholar]
- 73.Chung HS; Tokmakoff A, Temperature‐dependent downhill unfolding of ubiquitin. I. Nanosecond-to-millisecond resolved nonlinear infrared spectroscopy. Proteins 2008, 72, 474–487. [DOI] [PubMed] [Google Scholar]
- 74.Jäger M; Nguyen H; Crane JC; Kelly JW; Gruebele M, The folding mechanism of a β-sheet: The WW domain. J. Mol. Biol 2001, 311, 373–393. [DOI] [PubMed] [Google Scholar]
- 75.Crane JC; Koepf EK; Kelly JW; Gruebele M, Mapping the transition state of the WW domain β-sheet. J. Mol. Biol 2000, 298, 283–292. [DOI] [PubMed] [Google Scholar]
- 76.Dupuis NF; Holmstrom ED; Nesbitt DJ, Single-molecule kinetics reveal cation-promoted DNA duplex formation through ordering of single-stranded helices. Biophys. J 2013, 105, 756–766. [DOI] [PMC free article] [PubMed] [Google Scholar]
- 77.Hill AV, The combinations of haemoglobin with oxygen and with carbon monoxide. I. Biochem. J 1913, 7, 471–480. [DOI] [PMC free article] [PubMed] [Google Scholar]
- 78.SantaLucia J, A unified view of polymer, dumbbell, and oligonucleotide DNA nearest-neighbor thermodynamics. Proc. Natl. Acad. Sci 1998, 95, 1460–1465. [DOI] [PMC free article] [PubMed] [Google Scholar]
- 79.Spasic A; Berger KD; Chen JL; Seetin MG; Turner DH; Mathews DH, Improving RNA nearest neighbor parameters for helices by going beyond the two-state model. Nucleic Acids Res. 2018, 46, 4883–4892. [DOI] [PMC free article] [PubMed] [Google Scholar]
- 80.Hardwick JS; Lane AN; Brown T, Epigenetic modifications of cytosine: biophysical properties, regulation, and function in mammalian DNA. BioEssays 2018, 40, 1700199. [DOI] [PubMed] [Google Scholar]
- 81.Drohat AC; Coey CT, Role of base excision “repair” enzymes in erasing epigenetic marks from DNA. Chem. Rev 2016, 116, 12711–12729. [DOI] [PMC free article] [PubMed] [Google Scholar]
- 82.Mingot F, Quantitative test of Record’s theory for proton-induced lowering of DNA melting temperature. Biopolymers 1981, 20, 2121–2136. [DOI] [PubMed] [Google Scholar]
- 83.Chen H; Meisburger SP; Pabit SA; Sutton JL; Webb WW; Pollack L, Ionic strength-dependent persistence lengths of single-stranded RNA and DNA. Proc. Natl. Acad. Sci 2012, 109, 799–804. [DOI] [PMC free article] [PubMed] [Google Scholar]
- 84.Weiss JN, The Hill equation revisited: uses and misuses. FASEB J. 1997, 11, 835–841. [PubMed] [Google Scholar]
- 85.Teng X; Hwang W, Effect of methylation on local mechanics and hydration structure of DNA. Biophys. J 2018, 114, 1791–1803. [DOI] [PMC free article] [PubMed] [Google Scholar]
- 86.Pidugu LS; Dai Q; Malik SS; Pozharski E; Drohat AC, Excision of 5-carboxylcytosine by Thymine DNA Glycosylase. J. Am. Chem. Soc 2019, 141, 18851–18861. [DOI] [PMC free article] [PubMed] [Google Scholar]
- 87.Jones KC; Ganim Z; Peng CS; Tokmakoff A, Transient two-dimensional spectroscopy with linear absorption corrections applied to temperature-jump two-dimensional infrared. J. Opt. Soc. Am. B 2012, 29, 118–129. [Google Scholar]
- 88.Chung HS; Khalil M; Smith AW; Tokmakoff A, Transient two-dimensional IR spectrometer for probing nanosecond temperature-jump kinetics. Rev. Sci. Instrum 2007, 78, 063101. [DOI] [PubMed] [Google Scholar]
- 89.Lepetit L; Chériaux G; Joffre M, Linear techniques of phase measurement by femtosecond spectral interferometry for applications in spectroscopy. J. Opt. Soc. Am. B 1995, 12, 2467–2474. [Google Scholar]
Associated Data
This section collects any data citations, data availability statements, or supplementary materials included in this article.