

Abstract
It is well known that statistics using cumulative data are insensitive to changes. World Health Organization (WHO) estimates of fatality rates are of the above type, which may not be able to reflect the latest changes in fatality due to treatment or government policy in a timely fashion. Here, the authors propose an estimate of a real-time fatality rate based on a chain multinomial model with a kernel function. It is more accurate than the WHO estimate in describing fatality, especially earlier in the course of an epidemic. The estimator provides useful information for public health policy makers for understanding the severity of the disease or evaluating the effects of treatments or policies within a shorter time period, which is critical in disease control during an outbreak. Simulation results showed that the performance of the proposed estimator is superior to that of the WHO estimator in terms of its sensitivity to changes and its timeliness in reflecting the severity of the disease.
Keywords: disease outbreaks; epidemiologic methods; fatality rate; models, statistical; multinomial model; severe acute respiratory syndrome
Keywords: SARS, severe acute respiratory syndrome; WHO, World Health Organization
The 2003 outbreak of severe acute respiratory syndrome (SARS) affected more than 28 countries, with a total of 8,098 reported cases and 774 reported fatalities as of July 31, 2003 (1). The areas worst hit by SARS included Hong Kong, China; Singapore; Taiwan; Toronto, Canada; and Beijing, China. Estimation of fatality rates for an outbreak or epidemic of an emerging disease is not straightforward. This was particularly true for the SARS outbreak, in which clinicians all over the world had to deal with this highly contagious and frightening pneumonic illness with almost no knowledge about its etiology, pathogenesis, clinical features, management, or prognosis, other than anecdotal information obtained from colleagues in China (2–4).
The World Health Organization (WHO) estimated SARS fatality rates in Hong Kong on March 30, April 30, May 25, and June 30, 2003, to be 2.5 percent, 9.9 percent, 15.8 percent, and 17.0 percent, respectively (5). These discrepancies do not reflect a change in the severity of the disease; rather, they are an artifact of WHO methodology. The WHO estimate of the fatality rate is the ratio of the cumulative number of deaths to the total number of cases diagnosed. In the early part of the epidemic, few patients died from SARS, since their infection had not run its course; hence, the estimated fatality rate was low. As the epidemic developed, more people reached the terminal stage of the disease and died, but more people were being diagnosed, so the estimated rate was still low. It was only towards the end of the epidemic, when there were relatively few new cases arising, that the WHO estimate could be expected to perform well. Apparently, this problem is known to public health professionals; for example, it was acknowledged in the cautious paragraph published along with the definition of “case fatality rate” in Last's Dictionary of Epidemiology (6). However, no viable alternative has been suggested in the literature. Underestimation of the fatality rate might affect how seriously an outbreak is taken and subsequent vaccination efforts aimed at controlling the epidemic.
This deficiency in the WHO estimate of the fatality rate of a disease motivated us to write this paper. We developed a new estimator using a chain multinomial model of an emerging epidemic. In this model, in time period t, hospital inpatients either die with probability p1t, recover with probability p2t, or remain in the hospital. The transition probabilities are assumed to depend on calendar time (days since the start of the epidemic) rather than chronologic time related to the onset of disease for each individual, since the latter times often are not known or cannot be obtained quickly, especially in the case of a new emerging disease. There is no need to model the number of infectious disease patients if our interest is in the fatality inflicted by the epidemic. The fatality rate πt = p1t/(p1t + p2t) is the conditional probability of death given either recovery or death. Simple estimates of p1t and p2t may be obtained at each stage of the epidemic. However, these estimates may be based on limited numbers of cases and may be quite variable. We propose applying a kernel smoothing method to the simple estimates of the probabilities of recovery and death. Then, a simple transformation of the estimated transition probabilities yields an estimate of the fatality rate in real time. The variance of this estimator and associated pointwise confidence limits for the fatality rate are also given here.
THE ESTIMATOR
We take the time periods to be days. Time is measured in the number of days since the first case of the disease was diagnosed or reported. Suppose that we observe the numbers N1t and N2t of the Ht−1 inpatients at the start of day t who respectively die from the disease or recover on day t. Note that the number of inpatients Ht−1 includes new SARS admissions on day t − 1 as well as existing inpatients who neither die nor recover. On day t, an inpatient dies or recovers with probabilities p1t and p2t, respectively. Using the information on the number of inpatients at the end of day t − 1, N1t, N2t|Ht−1 ∼ multinomial (Ht−1, p1t, p2t) (see Becker (7) and Yip and Huggins (8)). Consequently, Nit and Njs are conditionally uncorrelated for s ≠ t, i, j = 1, 2. Simple estimators for p1t and p2t are N1t/Ht−1 and N2t/Ht−1, respectively. The estimated variances of p̂it are given by p̂it(1−p̂it)/Ht−1 for i = 1, 2, and the covariance between p̂1t and p̂2t is −p̂1tp̂2t/Ht−1. A simple estimator for the fatality rate at time t, πt, is
 |
A plot of these unsmoothed estimates for the Hong Kong data is given in figure 1. These daily estimates are highly variable, and there is no long-term trend in the estimated fatality rates. The daily estimates are generally larger than the WHO estimates, which increase throughout the course of the epidemic. We propose to reduce the variability and hence clarify the long-term trend by computing smooth estimates.
FIGURE 1.

Unsmoothed estimates of the death rate, p̂1t (top left), the recovery rate, p̂2t (top right), and the ratio of the death rate to the recovery rate, p̂1t/p̂2t (bottom left), for the outbreak of severe acute respiratory syndrome in Hong Kong, China, 2003. Also shown are the estimated fatality rate, p̂1t/(p̂1t+p̂2t), and the World Health Organization estimate (thin line) of the fatality rate (bottom right).
For computation of smooth estimates of the recovery and death rates for SARS, a kernel method was applied to p̂1t and p̂2t. Let Kb(x) = b−1K(x/b) be a kernel function of bandwidth b, with support in [−1.1]. The Nadaraya-Watson estimator (9, 10) for pit is given by
 |
where T is the last day of the epidemic. Because p̂it and p̂is are conditionally uncorrelated for s ≠ t, the variances of the p̃it, i = 1, 2, are given by
 |
and the covariance of p̃1t and p̃2t is
 |
An estimator for the ratio of the death and recovery transition probabilities is given by θ̃t = p̃1t/p̃2t, and its variance can be obtained by the standard δ method (11, p. 388):
 |
Then, we estimate πt by
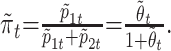 |
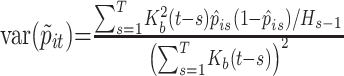
The δ method yields a variance estimator for π̃t as
 |
and approximate (1 − α) × 100 percent pointwise confidence limits for π̃t can be obtained as π̃t ± z1−α/2SE(π̃t), where z1−α/2 is the normal quartile at the significance level α/2 and SE is the standard error.
APPLICATIONS
Let K be the Epanechnikov kernel function K(x) = (3/4)(1 − x2)I(|x| < 1). To choose the bandwidth b, we selected a local bandwidth using the empirical bias bandwidth selection method to minimize the empirical mean square error (12). In our application, we restricted the choice of the bandwidths within the set {3, 5, 7, 10, 15, 20, 30, 40}. In general, the bandwidth tends to be larger when the data are more sparse or variable. It is well known that the choice of kernel function in smoothing is less important than the choice of the bandwidth.
Hong Kong
The first SARS case in Hong Kong was diagnosed on March 12, 2003, and 1,755 Hong Kong patients were hospitalized over the course of the epidemic (13). Of these cases, 1,456 patients were discharged and 299 patients died from SARS by July 31, 2003.
The top panels of figure 2 show real-time transition probabilities and associated 95 percent confidence intervals. The estimated death rate, p̃1t, peaked in mid-March, decreased for approximately 2 weeks, and then increased again until mid-May. The estimated recovery rate p̃2t, shown in the top right panel, rose in April, when the majority of SARS patients (mostly health-care workers) from a regional hospital (Prince of Wales Hospital) were discharged, and was then relatively steady until late June. The bottom left panel depicts the ratio of the two estimated transitional probabilities θ̃t, and the bottom right panel plots the estimated fatality rate at time t, π̃t, along with the WHO fatality rate over the course of the epidemic for comparison.
FIGURE 2.

Kernel estimates of the death rate, p̃1t (top left), the recovery rate, p̃2t (top right), and the ratio of the death rate to the recovery rate, θ̃t (bottom left), for the outbreak of severe acute respiratory syndrome in Hong Kong, China, 2003. Also shown are the estimated fatality rate, π̃t, and the World Health Organization estimate (thin line) of the fatality rate (bottom right). Dashed lines, 95% confidence interval.
The proposed estimate of the fatality rates was high at the beginning of the outbreak. This may reflect that the patients who were initially admitted were quite ill but, as the epidemic progressed, patients were admitted earlier in the progression of their disease. The estimated fatality rate stabilized at the beginning of April, and until mid-June it fluctuated between 15 percent and 25 percent. The stabilization of the estimated fatality rate could reflect a more mature approach in the diagnosis and treatment of SARS, although the efficacy of using high-dose corticosteroid and ribavirin to deal with lung parenchymal inflammation and the coronavirus itself is controversial (14–16). Alternatively, it could reflect a stationary distribution of the chain multinomial model. The WHO-adopted estimate increased gradually over the course of the epidemic and converged to the final overall fatality rate, which was approximately 17 percent.
Beijing
SARS data from Beijing have been available on the WHO website (http://www.who.int/csr) since April 21, 2003. By July 2, 2003, there had been 191 deaths among the 2,521 cases. Our estimates are plotted in the bottom right panel of figure 3. As in Hong Kong, the fatality rate was estimated to be high in the early stage of the epidemic. It then continuously improved over the course of the epidemic, with an overall fatality rate of approximately 8 percent. The reduction in the fatality rate is possibly related to the use of different treatments by the Chinese authorities, who also implemented effective measures to prevent infection in the community and in hospitals during the epidemic. In Beijing, a special hospital was built within 2 weeks of the start of the epidemic to treat SARS patients. Here, the WHO fatality rate overestimates the fatality rate in the latter part of the epidemic. The use of traditional Chinese medicine has also been suggested to have contributed to the low rate of fatality in Beijing, and glycyrrhizin, an active component of licorice root, has been shown to inhibit the replication of SARS-associated coronavirus (17).
FIGURE 3.

Kernel estimates of the death rate, p̃1t (top left), the recovery rate, p̃2t (top right), and the ratio of the death rate to the recovery rate,  t (bottom left), for the outbreak of severe acute respiratory syndrome in Beijing, China, 2003. Also shown are the estimated fatality rate,
  t, and the World Health Organization estimate (thin line) of the fatality rate (bottom right). Dashed lines, 95% confidence interval.
SIMULATED DATA
We simulated data under various scenarios to compare the proposed real-time fatality rate with the WHO fatality rate. In the simulation, we used the daily number of inpatients in the Hong Kong SARS epidemic as the basis for simulation for each day so that the infection process was not simulated. The numbers of deaths and recoveries for each day were then simulated according to the assumed multinomial probabilities under different scenarios. We chose bandwidths for the estimator by means of the empirical bias bandwidth selection method.
Scenario I assumes constant death and recovery rates on each day, with values of 0.01 and 0.1, respectively. This can be the situation if no effective treatment is available and/or the lethality of the disease does not change over time. Scenario II is similar to scenario I except for the appearance of a sudden increase in the death rate from 0.01 to 0.03 at 30 days after the start of the epidemic. This mirrors the Amoy Gardens outbreak in Hong Kong, where the strain of the SARS virus was found to be more lethal. In this scenario, it is assumed that the death rate then drops back to its initial level after a period of time. Scenario III assumes a consistently decreasing death rate and an increasing recovery rate. In this scenario, the fatality rate would decrease monotonically.
The left panels in figure 4 show the true death and recovery rates under the different scenarios. The right panels show the corresponding true daily fatality rate p1t /(p1t + p2t), the average over 100 simulations of the proposed real-time fatality rate, and the WHO fatality rate. In all cases, the mean of the proposed fatality rate estimated the true fatality rate quite well and captured the trend or sudden changes in the true fatality for the first and third scenarios. In the second scenario, the abrupt change was not totally captured, but this is to be expected.
FIGURE 4.

Simulation results from estimations of the real-time fatality rate for severe acute respiratory syndrome in three different scenarios with constant (top panels), stepwise (middle panels), and decreasing (bottom panels) fatality rates, 2003. True death rates (thick lines) and recovery rates (thin lines) are shown in the left panels. Also shown are the average real-time fatality rates (thick solid lines) and average World Health Organization estimates (thin lines) of the case fatality rate in 100 simulations (right panels). The true fatality rates are shown by the thick dotted lines (right panels).
In scenario I, the WHO fatality rate increased consistently during the first 60 days and then stabilized, so it was underestimating the true fatality rate in the earlier period of the epidemic. In scenario II, the WHO fatality rate could only gradually reflect the sudden increase in the true fatality rate, but it still underestimated this rate. In addition, the WHO fatality rate did not reflect the later decrease in the fatality rate. In scenario III, after an initial increase, the WHO fatality rate was relatively constant and underestimated the decrease in the fatality rate.
DISCUSSION
We have shown that a real-time fatality rate estimated by means of kernel smoothing methods has major advantages over the traditional WHO estimate during the course of an epidemic. An iteratively reweighted kernel estimator
 |
where
 |
is the weight to be iterated until convergence, can also be used. This estimator should be more efficient, but the improvement is expected to be marginal. In general, the weight function, which puts emphasis on the information in different periods or characteristics contributed to the estimator, does not affect the estimator much in comparison with the choice of bandwidth.
Our simulation studies show that variations in clinical outcome measures—resulting from improved treatment modalities, for example—are not accurately detected by the WHO estimator. On the other hand, our method reflects the possible impact of such factors, including variation in clinical management and other exogenous factors over the course of the outbreak. The spread of the SARS epidemic in Hong Kong was similar to that of scenario I, in which the recovery and mortality rates are nearly constant. In addition, the situation in Beijing was similar to that of scenario III, in which constant improvement in rates of recovery and death was observed. However, as was shown in the simulation, the WHO estimate fails to reflect the time-varying fatality rate in all regions.
The WHO estimates are simply not suitable for monitoring the fatality rate over the course of an emerging epidemic. The present formulation is also different from traditional survival analysis, which adopts chronologic time on the individual level rather than calendar time on the population level and thus requires more detailed data. The proposed chain multinomial model of using the real-time case fatality rate should allow epidemiologists to monitor not only SARS but also other emerging infections and conditions in the future. It can provide a timely and accurate estimate of the number of fatalities inflicted by an epidemic, especially in the earlier period when decisions on health policy and treatment are most critical. It works satisfactorily if the durations of hospital stays for recoveries and deaths are not that different. Yip et al. (18) adopted a competing risk model to provide an estimate of the real-time fatality for SARS using a counting process approach. In the absence of data from controlled clinical trials on SARS treatment, it is interesting to speculate as to whether the different estimated fatality rates between Hong Kong and Beijing could be related to the different clinical treatment protocols used.
Acknowledgments
The authors would like to pay tribute to all of the frontline health-care workers in the affected areas who have contributed to the control of SARS.
References
- 1.World Health Organization. Cumulative number of reported probable cases of SARS. Geneva, Switzerland: World Health Organization, 2003. (World Wide Web URL: http://www.who.int/csr/sars/country/2003_07_11/en/).
- 2.Tsang KW, Lam WK. Management of severe acute respiratory syndrome: the Hong Kong University experience. Am J Respir Crit Care Med 2003;168:417–24. [DOI] [PubMed] [Google Scholar]
- 3.Lee N, Hui D, Wu A, et al. A major outbreak of severe acute respiratory syndrome in Hong Kong. N Engl J Med 2003;348:1986–94. [DOI] [PubMed] [Google Scholar]
- 4.Karlberg J, Chong DS, Lai WY. Do men have a higher case fatality rate of severe acute respiratory syndrome than women do? Am J Epidemiol 2004;159:229–231. [DOI] [PMC free article] [PubMed] [Google Scholar]
- 5.World Health Organization. Cumulative number of reported probable cases of severe acute respiratory syndrome (SARS). Geneva, Switzerland: World Health Organization, 2003. (World Wide Web URL: http://www.who.int/csr/sars/country/en/).
- 6.Last JM, ed. A dictionary of epidemiology. 3rd ed. New York, NY: Oxford University Press, 1995:24.
- 7.Becker NG. Analysis of infectious data. New York, NY: Chapman and Hall, Inc, 1989.
- 8.Yip P, Huggins R. Some aspects of inference for chain binomial models. Stoch Anal Appl 1995;13:355–67. [Google Scholar]
- 9.Nadaraya EA. On estimating regression. Theor Prob Appl 1964;19:186–90. [Google Scholar]
- 10.Simonoff JS. Smoothing methods in statistics. New York, NY: John Wiley and Sons, Inc, 1996.
- 11.Rao CR. Linear statistical inference. New York, NY: John Wiley and Sons, Inc, 1973.
- 12.Ruppert D. Empirical-bias bandwidths for local polynomial nonparametric regression and density estimation. J Am Stat Assoc 1997;92:1049–62. [Google Scholar]
- 13.Hong Kong Department of Health. Latest figures on 2003 severe acute respiratory syndrome outbreak. Hong Kong, China: Hong Kong Department of Health, 2003. (World Wide Web URL: http://www.info.gov.hk/dh/diseases/ap/eng/infected.htm).
- 14.Booth CM, Matukas LM, Tomlinson GA, et al. Clinical features and short-term outcomes of 144 patients with SARS in the greater Toronto area. JAMA 2003;289:2801–9. [DOI] [PubMed] [Google Scholar]
- 15.Wenzel RP, Edmond MB. Managing SARS amidst uncertainty. N Engl J Med 2003;348:1947–8. [DOI] [PubMed] [Google Scholar]
- 16.Cyranoski D. Critics slam treatment for SARS as ineffective and perhaps dangerous. Nature 2003;423:4. [DOI] [PMC free article] [PubMed] [Google Scholar]
- 17.Cinatl J, Morgenstern B, Bauer G, et al. Glycyrrhizin, an active component of liquorice roots, and replication of SARS-associated coronavirus. Lancet 2003;361:2045–6. [DOI] [PMC free article] [PubMed] [Google Scholar]
- 18.Yip PS, Lam KF, Lau EH, et al. A comparison study of realtime fatality rates: severe acute respiratory syndrome in Hong Kong, Singapore, Taiwan, Toronto and Beijing, China. J R Stat Soc A 2005;168:233–43. [DOI] [PMC free article] [PubMed] [Google Scholar]