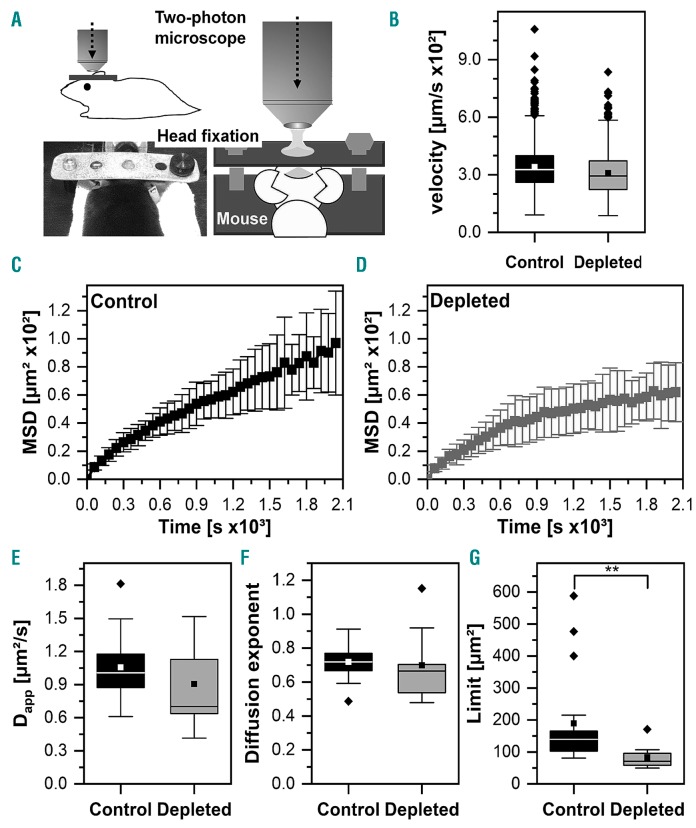
Figure 5.
Intravital imaging reveals decreased mobility of neutrophils in platelet-depleted mice. (A) Scheme of two-photon microscopy of the bone marrow 72 h after the induction of platelet depletion (or mock injection) through a 1 cm open cranial window (thinned skull) using a head-fixation in a stereotactic holder as illustrated. (B) Instantaneous velocities of neutrophils (62-149 per mouse) tracked in mice depleted of platelets (n=3 mice, 0.034 ± 0.011 μm/s) and the control group (n=5, 0.031 ± 0.011 μm/s). (C, D) Mean and standard deviation of the time-dependent mean squared displacement of the control group and the megakaryocyte-depleted mice. (E-F) The apparent diffusion coefficient, Dapp, and diffusion exponent, α, for the control group (Dapp= 106 ± 32 μm2, α = 0.72 ± 0.10) and megakaryocyte-depleted mice (Dapp = 90.5 ± 38.4 μm2, α = 0.70 ± 0.21) as obtained from equation 3. P=0.129 for Dapp and P=0.092 for α (Mann-Whitney test). (E) Saturation limit, L, for the control group (L = 189 ± 150 μm2) and megakaryocyte-depleted mice (L = 82.7 ± 38.0 μm2, P=0.0018) as obtained from equation 2. MSD: mean squared displacement.

