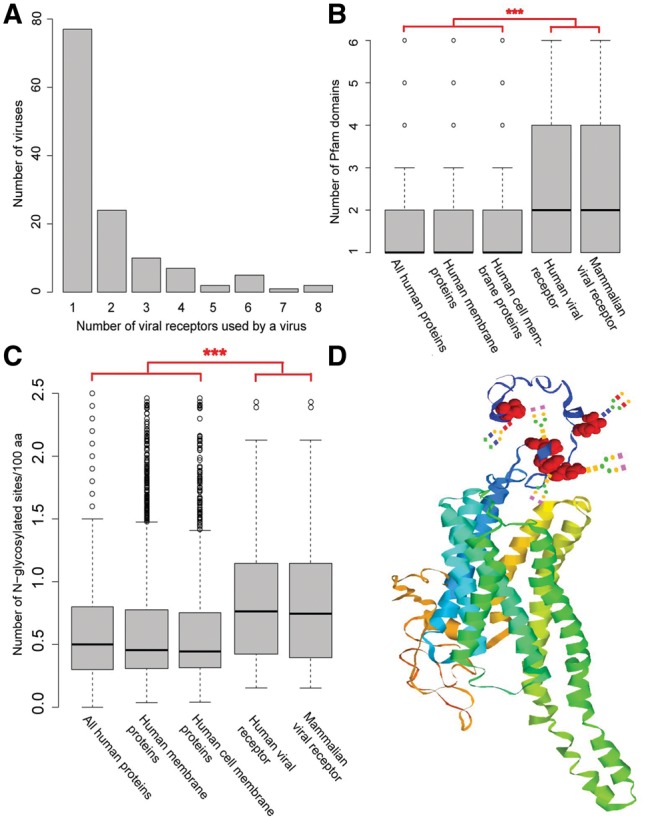
Fig. 1.

Analysis of structure features of mammalian virus receptors. (A) Distribution of the number of receptors used by a virus. (B) Comparing the number of Pfam domains within a protein for the set of human proteins, human membrane proteins, human cell membrane proteins, human viral receptors and mammalian viral receptors. For clarity, all the outliers greater than six were removed from the figure. “***”, P-value < 0.001. (C) Comparison of the N-glycosylation level between mammalian viral receptors, human viral receptors, human cell membrane proteins, human membrane proteins and all human proteins. For clarity, the outliers greater than 2.5 were removed. “***”, P-value < 0.001. (D) The modeled 3D-structure of HTR2A. Five N-glycosylation sites are highlighted in black. Artificial glycans were manually added onto the site
