Abstract
Mean total symptom severity scores for subjects with experimental rhinovirus colds peak 48 h after viral inoculation. Also, total symptom scores for natural rhinovirus and nonrhinovirus colds peaked on day 2 of illness in a long-term, noncompensated epidemiology study. In contrast, the mean total symptom scores for compensated patients receiving placebo in natural cold treatment trials peaked on day 1. Comparisons by day indicated that scores for symptoms reported as occurring on day 1 in the natural cold treatment trials corresponded with experimental cold scores for symptoms reported 48 h after viral inoculation. Comparisons of frequency and cumulative distribution scores for the 2 groups indicated that natural colds in the treatment trials were of longer duration than reported. A mean total symptom severity score of ⩽7 would capture 95% of experimental colds 24 h after inoculation while excluding 30.5% of natural colds on day 1 of illness. Histories given by compensated patients in natural cold treatment trials are inaccurate.
Investigators conducting treatment trials that involve patients with natural colds perceive that there is a difficulty in enrolling patients during the early stage of illness [1]. Cold illnesses are short-lived and self-limited. On average, total cold symptom scores indicate a peak in severity 48 h after initiation of experimental infection and then decrease [2]. It is undesirable to enroll patients into therapy trials if the cold exceeds 24 h in duration, because the potential for maximum therapeutic benefit has been lost. Also, in this situation, any beneficial effect associated with treatment can only be compared with the status of the illness in control subjects in whom symptom severity is improving spontaneously.
In the rhinovirus challenge model, virus is inoculated into the nose of susceptible volunteers to produce an experimentally induced infection. Therefore, the incubation period of the infection and the illness are known. For subjects enrolled in challenge studies, payment is assured; thus, there is no monetary incentive to falsify symptoms. In this model, treatment can be started in the early phase of the illness when it will be most beneficial and when the magnitude of its effect can be most accurately measured. In contrast, it is not possible to know when infection begins with natural colds or to determine with certainty the duration of the illness at the time that the patient presents for enrollment. The investigator depends on the timeliness and accuracy of the symptom reporting by the patient but has no means of verifying the accuracy of this information. Thus, an element of uncertainty is always present in the results of treatment trials that involve patients with naturally occurring colds.
This study was conducted to determine whether symptom data collected from previous rhinovirus challenge studies, in which onsets of infection and illness were known, will provide clues for determining the duration of illness in patients with natural colds. Symptom patterns for subjects with experimental colds were compared with those for patients with natural colds. This analysis provides information that may be useful for more-accurate determination of the time of onset of natural colds.
Materials and Methods
Data Sources
The data came from earlier studies of experimental and natural colds [3–10]. In some studies, subjects reported the presence or absence of symptoms; in others, the severity of cold symptoms was quantified by the modified method of Jackson [11]. In 2 studies [9, 10], the peak symptom score and the maximum percentage of patients with symptoms were compared and were found to occur on the same day.
The symptoms evaluated with use of the Jackson method are sneezing, rhinorrhea, nasal obstruction, sore/scratchy throat, cough, headache, malaise, and chilliness. Subjects are asked to grade the severity of symptoms as “absent” (0), “ mild” (1), “moderate” (2), “severe” (3), and, in some experiments, “very severe” (4) on a daily basis. A daily total symptom severity score is obtained by adding the severity scores for the individual symptoms. The diagnosis of a cold is made if the subject has a minimum total symptom score of 6 during the 5 days of observation and believes that he or she has a cold and/or has reported rhinorrhea for ∼3 days.
In the first analysis, times of peak expression of total and individual symptoms were compared using the results of 5 studies of experimental colds [3–7] and 3 studies of natural colds [8–10]. Next, data from 141 subjects with experimental colds who received placebo in 2 representative rhinovirus challenge studies [4, 5] were compared with data from 105 patients who received placebo in a representative natural cold clinical trial [10]. The symptom severity for subjects in both the experimental and natural cold groups had been quantified by the modified Jackson method [11]. Patients with natural colds had been instructed to report for enrollment for treatment at the recognition of the first symptoms that they believed might represent the onset of a cold. Data from the 2 groups were compared for mean total and individual symptom severity by day. Time is reported as hours after virus inoculation for subjects with experimental colds and as the day of illness on the basis of the history given by patients with natural colds. Data from these studies were then used to construct histograms comparing the range of severity by day of the individual total symptom scores for each subject and to perform an analysis of the time to the development of maximum total symptom score.
Guidelines for human experimentation were followed, and the protocol and consent form were approved by the Human Investigation Committee of the University of Virginia (Charlottesville). Written informed consent was obtained from all subjects before enrollment into the study.
Statistical Methods
Analysis of the mean total severity symptom score. The total symptom severity scores were analyzed as correlated count data by generalized estimating equations [12]. The model parameters for the marginal fixed effects were estimated by maximum likelihood in a generalized linear model with a negative binomial link function [13]. The variance-covariance parameters were estimated with an unstructured variance-covariance matrix form with use of the Huber and White estimator [14]. The independent variables included an index to distinguish between patients whose data were derived from the natural cold study (105 patients) and those whose data were derived from 1 of the 2 experimental challenge studies (141 patients). Indices were also included to distinguish between the 4 points in time when the symptoms were evaluated during the experimental and natural cold studies (for experimental studies, 24 h, 48 h, 72 h, and 96 h after virus inoculation; for natural colds, days 1, 2, 3, and 4 of illness, as determined by patient history). As the final components of the model, indices were included to estimate study group by time interaction. The time point by time point comparison between the mean total symptom severity scores for the 2 groups was conducted via linear contrast. Statistical inference was determined by the magnitude of the Wald χ2 statistic. The rejection of the null hypothesis of no effect was at the P ⩽.05 level of significance. Confidence interval construction for the group mean and the ratio of the group means were based on the Wald normal approximation, and the limits were determined at the 95% level of confidence. All of the statistical computation were performed with the PROC GENMOD procedure on SAS software, version 8.0 (SAS Institute).
Analysis of the distributions of the total symptom severity score. The 24-, 48-, 72-, and 96-h symptom severity score frequency distributions from the experimental challenge studies were compared with the day 1, 2, 3, and 4 symptom severity score frequency distributions from the natural cold study with use of the nonparametric log-rank χ2 test [15]. The log-rank test was used to evaluate whether the empirical cumulative distributions (ECDs) of the scores of the respective study groups were equal at corresponding points in time. The values of the ECD were determined from the empirical distribution function ecdf(y) = #(scores ⩽ score y)/n [16], and, for any particular observed score y, the value of the ecdf represented the proportion of the observed symptom severity scores that had a value less than or equal to that particular score. When the empirical distribution function was evaluated over all of the observed symptom severity scores of a particular group, this provided an estimate for the cumulative distribution [17] of the scores for the study population represented by that particular group. The 95% CI construction for estimating the upper and lower bound of the population cumulative distribution was based on a 100 (1 - α/2k) Bonferroni criterion, in which the value α represented the type 1 error rate, and the value k represented the number of unique cut points at which the cumulative probability was evaluated. Bonferroni confidence limits were used to attain 95% CIs with the specified coverage probability. This required taking into account the inherent correlation between the succession of values of the ECD. A type 1 error rate of 0.05 was used in the 95% CI construction; therefore, the overall simultaneous coverage probability was ∼95%. All of the statistical computations for the analysis of the distributions of the total symptom severity scores were performed with Splus, version 2000 (Insightful).
Results
Day of peak mean symptom expression. The mean total symptom severity score in adults with experimental rhinovirus colds peaked on day 2 in 4 studies (table 1) [3, 5–7]. In a long-term epidemiological study of natural colds caused by rhinovirus and viruses other than rhinovirus in adults who were not compensated, the percentage of patients with symptoms also peaked on day 2 [8]. In contrast, in 2 cold treatment trials involving natural colds of unknown etiology in patients who were paid to participate, the percentage of subjects with symptoms and the mean total symptom severity scores peaked on day 1.
Table 1.
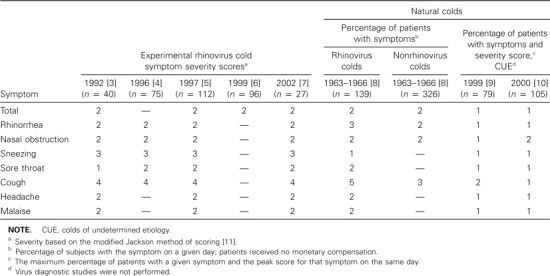
Day of mean peak symptom expression (severity score and/or percentage of patients) in experimental and natural colds.
With regard to individual cold symptoms, the day of peak severity or prevalence was the same in most instances for subjects with experimental rhinovirus colds [3–7] and for patients with natural colds in the epidemiology study [8]. The severity of rhinorrhea peaked on day 2 in all instances except for natural rhinovirus colds, for which the prevalence peaked on day 3. The prevalence of nasal obstruction peaked on day 2 in all groups. The severity of sneezing peaked on day 3 in all experimental cold groups, and the prevalence peaked on day 1 in the rhinovirus natural cold group. The severity of sore throat peaked on day 2 in all of the experimental cold groups except one, in which it peaked on day 1. The severity of cough peaked on day 4 in all experimental cold groups, and the prevalence peaked on days 5 and 3 for natural rhinovirus and nonrhinovirus colds, respectively. The severity of headache and malaise peaked on day 2 in all groups. In contrast, all of the individual symptoms peaked in severity on day 1 in the patients in the 2 clinical trials, with the exception of nasal obstruction and cough, which peaked on day 2 in one instance each.
Comparison of mean total and individual symptom severity scores by day. The mean total symptom severity score for 141 subjects with experimental colds [4, 5] was 2.8 (95% CI, 2.4–3.2) 24 h after virus inoculation (figure 1A). In contrast, the mean total symptom severity score for 105 patients with early natural colds (i.e., early onset of first symptom) [10] at the time that they presented for enrollment for treatment (day 1) was 6.8 (95% CI, 6.1–7.5). This represented a 2.4-fold increase (95% CI, 2.0-2.9-fold increase; P <.001) in the total symptom score above the mean of the experimental cold group. By 48 h after virus challenge, the mean total symptom score for the experimental cold group had increased to 6.6 (95% CI, 5.9–7.3), whereas, on day 2, the score of the natural cold group had decreased to 6.25 (95% CI, 5.5–7.0), resulting in similar scores (P =.55). The change in the mean total symptom score for the 2 groups was in opposite directions over the time period of 24 h/day 1 to 48 h/day 2, and the rate of change was substantially different (P <.001). In the subsequent period from 48 h/day 2 to 72 h/day 3, the rate of the improvement in symptoms was similar for the 2 groups (P =.2), whereas, from 72 h/day 3 to 96 h/day 4, the rate of improvement was greater for the experimental cold group (P =.02).
Figure 1.
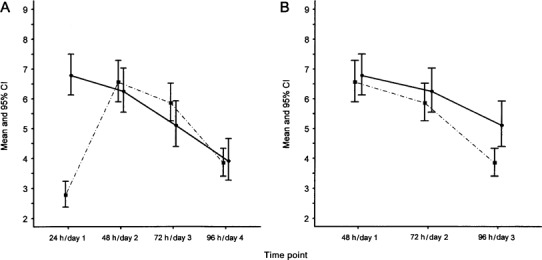
Mean total symptom severity scores, by time point, in 105 patients with natural colds (solid line) and in 141 subjects with experimental colds (dashed line). A, Comparison of natural cold scores starting on day 1 of illness to experimental cold scores starting 24 h after viral inoculation. B, Comparison of natural cold scores on starting on day 1 after illness to experimental cold scores starting 48 h after viral inoculation.
To determine whether patients in treatment trials who have natural colds reported for enrollment later than instructed, the total symptom scores for the 2 groups were compared by shifting the scores for the natural cold group forward by 24 h to compensate for the suspected delay in reporting. The data point representing the score at the time of reporting for enrollment (day 1) in the natural cold study was shifted to day 2 and that of day 2 to day 3, et cetera (figure 1B). The mean symptom score for the natural cold group of 6.8 reported on day 1 aligned with the 48-h experimental mean symptom score of 6.6. With this adjustment, the mean symptom score at 48 h in the experimental cold group was comparable to the mean symptom score on day 1 in the natural cold group (P =.7). The rate of decrease in the mean total symptom score from 48 h to 72 h for the experimental cold group was similar to the rate of decrease in the total mean symptom score for the natural cold group from day 1 to day 2 (P =.6). Similarly, the mean total symptom score for the experimental cold group at 72 h was comparable to the mean total symptom score for the natural cold group on day 2 (P =.4). The rate of decrease of the mean total symptom score from 72 h to 96 h for the experimental cold group was 1.25-fold greater (95% CI, 1.09-1.40-fold greater; P <.001) than the rate of decrease of the mean total symptom score for the natural cold group from 2 to day 3. At 96 h, the mean total symptom score for the experimental cold group was 3.8, which was significantly less (P =.004) than the mean symptom score of 5.1 for the natural cold group on day 3.
The mean scores for 6 individual symptoms were also compared between the experimental and natural cold groups (figure 2). A comparison was first made between values at 24 h after virus inoculation (experimental cold group) and day 1 (natural cold group).
Figure 2.
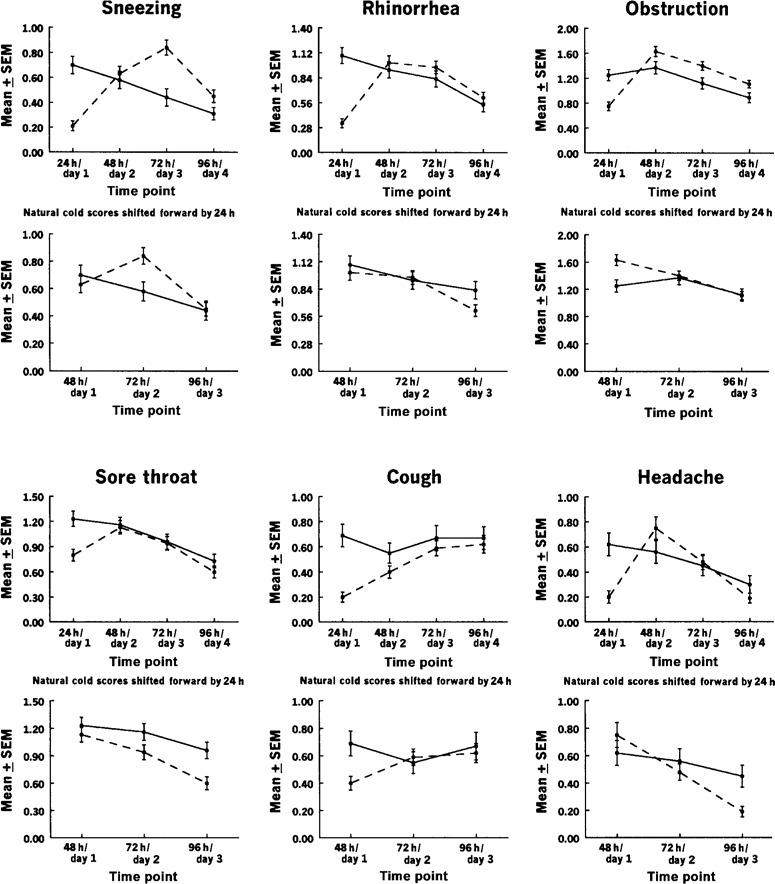
Mean individual symptom severity scores, by time point, in 105 patients with natural colds (solid line) and 141 subjects with experimental colds (dashed line). Shown are comparisons of natural cold scores starting on day 1 of illness to experimental cold scores starting 24 h after viral inoculation (top panels) and with the natural cold scores shifted forward by 24 h (bottom panels).
In all instances, the scores for the experimental cold group increased during the interval between 24 h and 48 h after virus inoculation. In contrast, in the natural cold group, the scores for 5 of the symptoms decreased between day 1 and day 2. The single exception was the score for nasal obstruction, for which there was a slight increase. When the day 1 scores for the natural cold group were shifted forward to correspond with the 48-h postinoculation scores for the experimental cold group, the curves of the 2 groups became similar. The largest discrepancies were for sneezing (for which cold scores for the experimental cold group, but not for the natural cold group, increased between 48 h/day 1 and 72 h/day 2) and coughing (for which cold scores for the natural cold group decreased and scores for the experimental cold group increased during this period). However, cough scores then increased for both groups during the next 2 periods, as expected from previous cold studies.
Comparison of the frequency and the cumulative distribution of total symptom severity scores. The frequency distributions of the total symptom severity scores from the experimental and natural cold groups were analyzed (figure 3) and used to calculate the ECDs of the total symptom scores for the experimental and natural cold groups, with and without shifting the scores of the natural cold group forward by 24 h (figure 4). Before the shift, the ECD of the symptom scores for the experimental cold group at 24 h differed from ECD of the symptom scores for the natural cold group on day 1 in that there was a tendency to observe higher symptom scores for the natural cold group than for the experimental cold group (P <.001). The examination of the symptom scores at 48 h/day 2, 72 h/day 3, and 96 h/day 4 showed no difference between the 2 groups' ECDs (P =.45, P =.2, and P =.7, respectively).
Figure 3.
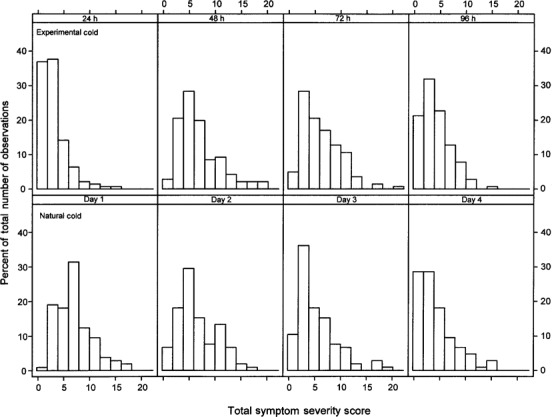
Comparison of the frequency of total symptom severity scores, by time point, in 105 patients with natural colds and 141 subjects with experimental colds.
Figure 4.
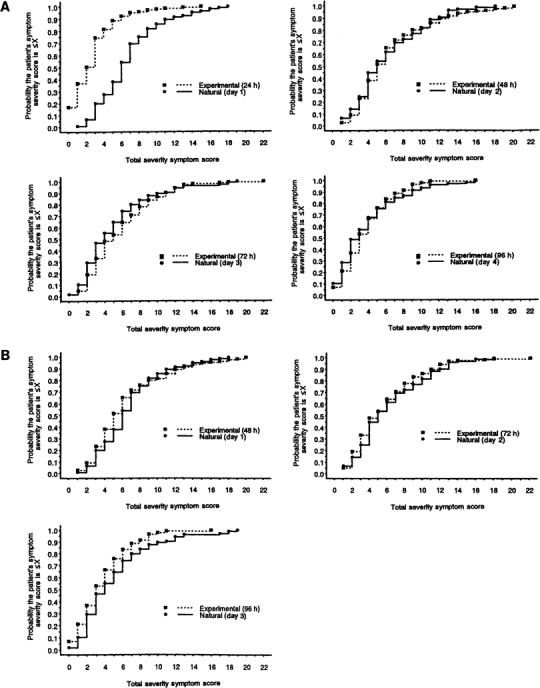
Comparison of the cumulative distribution of total symptom severity scores, by time point, in 105 patients with natural colds and 141 subjects with experimental colds. A, Day 1 of illness for natural colds compared with 24 h after inoculation for experimental colds. B, Day 1 of illness for natural colds compared with 48 h after inoculation for experimental colds.
After the forward shift of the natural cold group's scores by 24 h, there was no difference in the scores between the natural cold group ECD on day 1 and the experimental cold group ECD at 48 h (P =.8). Similarly, the symptom score ECD for the natural cold group on day 2 was comparable to the symptom score ECD for the experimental cold group at 72 h (P =.4). On day 3, the natural cold group showed a higher symptom score than did the experimental cold group (P =.004); this probably reflected underreporting of symptoms by volunteers who were anxious to be released from isolation in the motel.
Estimated total symptom severity score cumulative probability distribution at 24 h/day 1. An estimate was made of the total symptom severity score cumulative probability distribution for the experimental cold group at 24 h and the natural cold group on day 1 (table 2 and figure 5). The vertical bars in the figure represent the 95% CIs for the estimation of the study population cumulative distribution at particular total symptom score cut points. The highest individual total symptom score in the experimental cold group at 24 h was 18; the highest score in the natural cold group at day 1 was 15. Although the maximum scores did not differ greatly, the middle 50% of the distribution for the 2 groups did not overlap. The scores for the natural cold group had a range of 4–8, whereas those for the experimental cold group had a range of 1–4. In the experimental cold group, only 5% of subjects had a total symptom score of ∼7 at 24 h after being inoculated with virus. In contrast, 30.5% of patients in the natural cold group had a total symptom severity score of ∼7 on day 1 of reported illness.
Table 2.
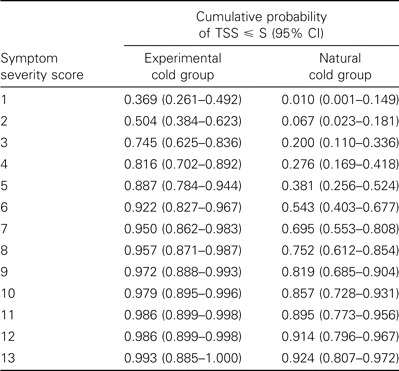
The estimates for the cumulative probability of observing a total symptom severity score (TSS) with magnitude less than or equal to some specified total symptom severity score (S).
Figure 5.
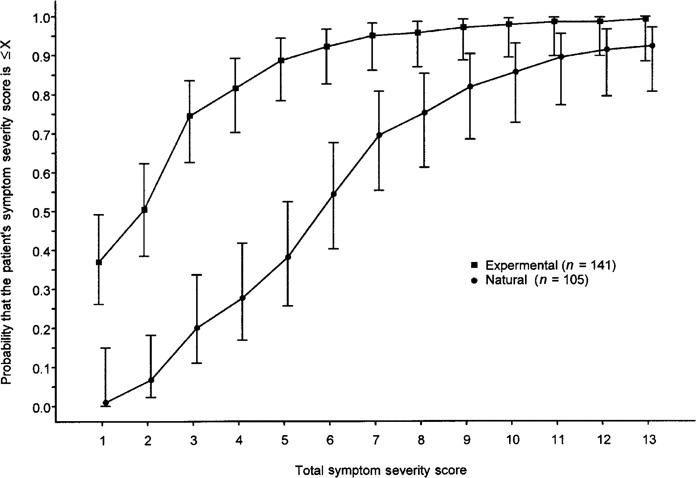
Estimated cumulative probability distribution of total symptom scores on day 1 of illness for natural colds and 24 h after inoculation for experimental colds. Vertical bars, 95% CIs for the estimation of the cumulative distribution for the study population at particular total symptom score cut points.
Rate of decrease in the total symptom score relative to the score on day 1. The 105 patients in the placebo group in the natural cold trial [10] were divided into 6 groups on the basis of the severity of total symptom scores on day 1. The scores for each group were adjusted to a baseline of 0 (figure 6). The rate of decrease in mean total symptom scores during the next 4 days for 8 patients with a day 1 score of >14 was much more pronounced than that for patients in the other groups. This suggests that the individuals with the highest presenting scores differed from the individuals in other groups with regard to the characteristics of their reported illness. That the severity of their symptom scores on day 1 was highly unusual is shown by a cumulative probability of only 0.01 of having a score on day 1 of >14 on the basis of the data from the experimental cold group (table 2).
Figure 6.
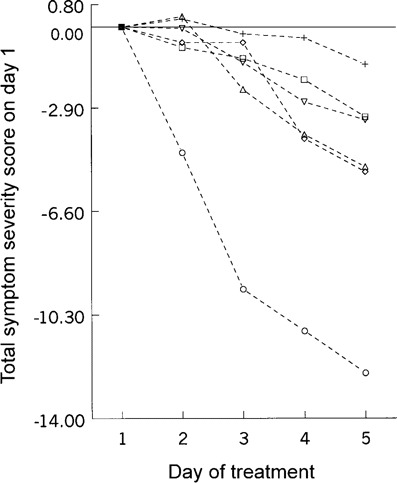
Rate of decrease in total symptom score relative to the severity of the score on day 1. The scores for all groups have been adjusted to a baseline value of 0. Symptom severity score on day 1: ★, ∼14 (n = 8); ◊, 10-13 (n = 11); ▵, 8-9 (n = 13); □, 6-7 (n = 33); ▾, 4-5 (n = 19); +, ⩽3 (n = 21)
Discussion
People with the common cold are traditionally portrayed as having a tender, red nose, having dripping mucus, and being in the act of sneezing. However, many, if not most, patients with active colds may show no objective manifestations of illness unless they are seen during periodic episodes of sneezing, nose blowing, or coughing. This is especially true during the very early stages of a cold, which is the optimum time to begin treatment [7]. Because objective signs of an early cold are usually lacking, clinical trials of cold treatments rely primarily on subjective data obtained by history from the patient. Symptom scores have the advantage of measuring patient morbidity, the relief of which is one of the primary goals of therapy. However, symptom scores have the disadvantage of being dependent on the accuracy of the history.
This study suggests that patients with natural colds report for enrollment for treatment later in the course of their illness than is indicated by the symptom history. There are several possible reasons for this. Experimental colds have an incubation period of ∼10 h [18]; therefore, if treatment is started 24 h after virus inoculation, the illness is ∼14 h in duration at the start of treatment. On the other hand, a natural cold may begin early on one day, and the patient might not report for enrollment for treatment until the afternoon of the next day. In this instance, the cold is accepted as being of 1 day's duration but actually has been progressing for 36 h.
Second, the monetary incentive for participating in cold studies affects the accuracy of the histories given by some patients. In 2 cold treatment studies in which potential enrollees prospectively maintained a daily symptom diary, the duration of illness as reported in the history given at the time of presentation for enrollment for treatment was 1 or more days shorter than that given in the written record in the symptom diary in 6% and 35% of patients [1]. In this situation, some patients have heatedly denied the inaccuracy of the history and demanded to be enrolled into the study to receive payment. Of greater concern is the suspicion that some individuals may completely falsify an illness to gain entrance into a study. Financial incentive is not an issue in virus challenge studies in which volunteers are assured of payment regardless of the outcome of participation. Other reasons for delayed enrollment include patients who have honest doubts about whether a cold is beginning or who are too preoccupied with daily activities to notice early mild symptoms. However, people can recognize early cold symptoms. One study showed that, in 81% of patients with natural colds, the interval between the initial symptom and when the individual “knew he had a cold” was ⩽16 h [19].
In the present study, the clinical characteristics of experimental rhinovirus colds of known duration was used as a benchmark for comparing the characteristics of illnesses that were reported as natural colds in a clinical trial. The experimental colds used for comparison all met the modified Jackson criteria [11]. The use of experimental rhinovirus colds as a benchmark is justified, because earlier work has shown that natural rhinovirus colds reported in a long-term epidemiological study with no financial incentives had similar clinical characteristics to experimental rhinovirus colds [20]. Also, the epidemiological study cited above [8] showed that the clinical characteristics of natural colds that were rhinovirus positive were similar to the clinical characteristics of those that were rhinovirus negative.
With the use of experimental colds as a benchmark, it was shown that the mean total symptom score for day 1 was higher than expected in a considerable proportion of patients with natural colds in the treatment trial. This suggested that these colds were of longer duration than was reported. The treatment studies that were analyzed used prospective surveillance of cold symptoms before enrollment. In studies in which this is not done, the problem of late enrollment may be worse.
There was also a suggestion that there may have been some fabrication of symptoms. This suggestion was supported by the finding that the patients who had the highest scores on day 1 (>14) had an unusually rapid resolution of symptoms compared with patients who had lower scores on day 1. By use of the experimental cold benchmark, there was only a.01 probability that scores of this magnitude would be reported ⩽24 h after onset of infection. An alternative explanation for the high scores is that they represented illness due to other viruses, such as influenza virus or adenovirus. The studies were not conducted during influenza epidemics, and it would be unusual for the symptoms of influenza or acute respiratory disease due to adenovirus to resolve as rapidly as reported.
The total symptom score probability distribution at 24 h for experimental colds and day 1 for natural colds showed that a symptom severity score of ⩽7 at 24 h after virus inoculation captured 95% of the experimental colds while excluding 30.5% of the natural colds reported as occurring on day 1 of illness. In future natural cold treatment trials, it may be useful to use a day 1 total symptom score of >7 as an exclusion criterion to help achieve enrollment of patients with early colds and to eliminate bogus cases of illness. In addition, investigators may want to consider enrolling patients ⩽12 h after the first recognition of a possible cold symptom. Use of a 12-h cutoff for enrollment may require that the treatment and placebo supplies be available to participants in their residence.
Natural cold studies also have the problem of compliance in taking medication. The patients in the natural cold study in this report were primarily college students. More accurate information may have been collected if an older and more responsible population had been used, as in previous studies [21]. Addition of virologic testing to a natural cold study does not solve the problem. The yield with testing is satisfactory for rhinovirus but not good for the other cold viruses, such as coronavirus [22]. Also, viral testing provides no information on duration of illness. Others have recently commented on the underreporting and fabrication of information in the medical history and of the importance of having a better understanding of this phenomenon [23]. The present study used histories from subjects with natural and experimental colds to further investigate this problem. The findings indicate that it may be possible to improve clinical trials involving patients with natural colds by use of entry criteria based on a predetermined value for the presenting total symptom score.
Acknowledgements
We thank Patsy P. Beasley and Katherine F. Adams, for their expert technical assistance, and Jacqueline Grubbs, for her manuscript preparation.
Footnotes
Financial support: Unrestricted gift funds for use in support of respiratory research were used at the discretion of the principal investigator.
References
- 1.Gwaltney JM, Jr, Buier RM, Rogers JL. The influence of signal variation, bias, noise, and effect size on statistical significance in treatment studies of the common cold. Antiviral Res. 1996;29:287–95. doi: 10.1016/0166-3542(95)00935-3. [DOI] [PubMed] [Google Scholar]
- 2.Gwaltney JM., Jr . The use of experimentally infected volunteers in research on the common cold. In: Lenfiant C, Skoner DP, editors. Asthma and respiratory infections. New York: Marcel-Dekker; 2001. pp. 103–27. [Google Scholar]
- 3.Sperber SJ, Hendley JO, Hayden FG, Riker DK, Sorrentino JV, Gwaltney JM., Jr Effects of naproxen in experimental rhinovirus colds. Ann Intern Med. 1992;117:37–41. doi: 10.7326/0003-4819-117-1-37. [DOI] [PubMed] [Google Scholar]
- 4.Gwaltney JM, Jr, Park J, Paul RA, Edelman DA, O'Connor RR, Turner RB. A randomized controlled trial of clemastine fumarate in experimental rhinovirus colds. Clin Infect Dis. 1996;22:656–62. doi: 10.1093/clinids/22.4.656. 1996. [DOI] [PubMed] [Google Scholar]
- 5.Gwaltney JM, Jr, Druce HM. Efficacy of brompheniramine maleate for the treatment of rhinovirus colds. Clin Infect Dis. 1997;25:1188–94. doi: 10.1086/516105. [DOI] [PubMed] [Google Scholar]
- 6.Turner RB, Wecker MT, Pohl G, et al. Efficacy of tremacamra, a soluble adhesion molecule 1, for experimental rhinovirus infection: a randomized clinical trial. JAMA. 1999;281:1797–804. doi: 10.1001/jama.281.19.1797. [DOI] [PubMed] [Google Scholar]
- 7.Gwaltney JM, Jr, Winther B, Patrie JT, Hendley JO. Combined antiviral-antimediator treatment for the common cold. J Infect Dis. 2002;186:147–54. doi: 10.1086/341455. [DOI] [PMC free article] [PubMed] [Google Scholar]
- 8.Gwaltney JM, Jr, Hendley JO, Simon G, Jordan WS., Jr Rhinovirus infections in an industrial population. II. Characteristics of illness and antibody response. JAMA. 1967;202:494–500. [PubMed] [Google Scholar]
- 9.Gwaltney JM, Jr, Hendley JO, Winther B. Report to US Food and Drug Administration (FDA) IND 7631, Protocol V-203-99. Rockville, MD: FDA; 2000. A randomized, double-blind, placebo controlled study to assess the effectiveness of intranasally applied interferon alfa-2b combined with oral ibuprofen and brompheniramine maleate on symptom reduction and safety in natural colds in normal adults. [Google Scholar]
- 10.Gwaltney JM, Jr, Hendley JO, Winther B. Report to US Food and Drug Administraion (FD) IND 7631, Protocol V-205-00. Rockville, MD: FDA; 2001. A randomized, double-blind, placebo controlled study to assess the effectiveness of intranasally applied interferon alfa-2b combined with oral ibuprofen and chlorpheniramine maleate on symptom reduction and safety in natural normal adults with natural colds. [Google Scholar]
- 11.Gwaltney JM, Jr, Hendley JO. Respiratory transmission. In: Thomas JC, Weber DJ, editors. Epidemiologic methods for the study of infectious diseases. New York: The University of Chicago Press; 2001. pp. 213–27. [Google Scholar]
- 12.Liang K Y, Zeger SL. Longitudinal data analysis using generalized linear models. Biometrika. 1986;73:13–22. [Google Scholar]
- 13.McCullagh P, Nelder JA. Generalized linear models. 2nd ed. London: Chapman and Hall; 1989. [Google Scholar]
- 14.White H. Maximum likelihood estimation of misspecified models. Econometrica. 1982;50:1–25. [Google Scholar]
- 15.Collett D. Modeling survival data in medical research. London: Chapman and Hall; 1995. [Google Scholar]
- 16.Rosner B. Fundamentals of biostatistics. 5th ed. Pacific Grove, CA: Duxbury Press; 2000. [Google Scholar]
- 17.Casella G, Berger RL. Statistical inference. Belmont, CA: Wadsworth; 1990. [Google Scholar]
- 18.Harris JM, II, Gwaltney JM., Jr Incubation periods of experimental rhinovirus infection and illness. Clin Infect Dis. 1996;23:1287–90. doi: 10.1093/clinids/23.6.1287. [DOI] [PubMed] [Google Scholar]
- 19.Arruda E, Pitkaranta A, Witek TJ, Doyle CA, Hayden FG. Frequency and natural history of rhinovirus infections in adults during autumn. J Clin Microbiol. 1997;35:2864–8. doi: 10.1128/jcm.35.11.2864-2868.1997. [DOI] [PMC free article] [PubMed] [Google Scholar]
- 20.Rao SS, Hendley JO, Hayden FG, Gwaltney JM., Jr Symptom expression in natural and experimental rhinovirus colds. Am J Rhinol. 1995;9:49–52. [Google Scholar]
- 21.Howard JC, Jr, Kantner TR, Lilienfield LS, et al. Effectiveness of antihistamines in the symptomatic management of the common cold. JAMA. 1979;242:2414–7. [PubMed] [Google Scholar]
- 22.MÅkelÅ MJ, Puhakka T, Ruuskanen O, et al. Viruses and bacteria in the etiology of the common cold. J Clin Microbiol. 1998;36:539–42. doi: 10.1128/jcm.36.2.539-542.1998. [DOI] [PMC free article] [PubMed] [Google Scholar]
- 23.Barsky AJ. Forgetting, fabricating, and telescoping: the instability of the medical history. Arch Intern Med. 2002;162:981–4. doi: 10.1001/archinte.162.9.981. [DOI] [PubMed] [Google Scholar]


