

Abstract
Newly emerged influenza A(H1N1)pdm09 virus infection in Norwegian pigs, although often observed in a subclinical form, can lower the pig's growth performance by reducing feed efficiency in terms of a poorer feed conversion ratio. Infected pigs would consume more feed and require protracted production time to reach market weight. In our observational longitudinal study, growth performance data from 728 control pigs and 193 infected pigs with known viral shedding time points were analyzed using mixed linear regression models to give estimates of the marginal effects of infection. Gaussian curves describing the variability of the estimates at the individual pig level formed the fundamental inputs to our stochastic models. The models were constructed to simulate the summed negative effects of the infection at the batch level of 150 fattening pigs growing from 33 to 100 kg. Other inputs of variability and uncertainty were 1) batch transmission points, 2) pig infection points to reflect the disease transmission dynamics of the virus, and 3) final prevalence of infected pigs in the batch. Monte Carlo random sampling gave 5,000 estimates on the outputs of the marginal effects for each pig. These results were summed up to provide estimates for a batch size of 150 pigs. This figure was adjusted by our final prevalence distribution function, which was also derived from the longitudinal study with 12 cohorts of infected pigs. For a 150-fattening-pig herd randomly selected from the population, the marginal effects of the infection were 1) 835 kg (fifth percentile) to 1,350 kg (95th percentile) increased feed intake and 2) 194 (fifth percentile) to 334 (95th percentile) pig days in excess of expected figures for an uninfected batch. A batch infected during growth phase 3 (81 to 100 kg BW) gave the worst results since the longitudinal study showed that a pig infected during growth phase 3 required more feed and a greater protracted production time compared to younger infected pigs. Sensitivity analysis showed that final prevalence had the greatest impact on the conditional mean and variation of the marginal effects of infections. Batch transmission point was the next most influential factor. Lowering the final prevalence and preventing older fattening pigs from being infected will have the greatest benefit in saving feed cost and reducing delay in getting the pigs to the market.
Keywords: feed conversion ratio, feed efficiency, influenza, mixed linear regression model, stochastic
INTRODUCTION
In April 2009, influenza A(H1N1)pdm09 virus (pH1N1v) emerged in North and South America as human infections (Centers for Disease Control and Prevention, 2009) before it became established in pig populations worldwide, including in Norway (Hofshagen et al., 2009; Torremorell et al., 2012; Van Reeth et al., 2012). It was Norway's first influenza A virus infection in its pig population since the active national serosurveillance started in 1997 (Lium et al., 2014). A case control study (Grontvedt et al., 2013) revealed that the outbreak in pigs was likely caused by cross-species transmission from human to pigs. Although pH1N1v appeared highly contagious in naïve pigs like other swine influenza viruses (SIV; Brookes et al., 2010; Er et al., 2014), the virus appeared to be of low virulence since infection manifested itself mostly in the subclinical form in naïve Norwegian pig herds (Grontvedt et al., 2011; Lium et al., 2014). Despite the subclinical state, a longitudinal study at the Norwegian boar testing station (Er et al., 2014) showed that infected growing pigs had reduced feed efficiency because of a poorer feed conversion ratio. Consequently, infected pigs required additional feed and protracted production time compared to their uninfected counterparts. These findings, when considered at the batch level, are useful for economic analysis of a farm's profitability and for decision making with regard to disease control and biosecurity measures. However, to consider the sum total effects at the batch level, an understanding of factors that will vary the outcome is important for realistic estimations. It is therefore the aim of this paper to present a stochastic model for assessment of the production impact of pH1N1v infection in Norwegian pigs at the batch level. The stochastic model, based on a field observational study, will account for the variabilities and uncertainties that influence the individual impact of each pig for the summation at the batch level.
MATERIALS AND METHODS
The field study at the commercial boar testing station was purely observational. No pig was harmed during the process of taking blood samples from the jugular vein or taking nasal swabs.
Data
We conducted an observational longitudinal study on pigs that were performance tested at the Norwegian boar testing station between 2009 and 2012. The boar testing station (Wetten et al., 2012) had a capacity of testing 1,152 pigs in 16 separate rooms at the same time. Each room housed a cohort of 72 pigs grouped by breed (Landrace or Duroc) into 6 pens (14 m2 in size) of 12 pigs each. Weekly, the station received 72 growing pigs (12 to 14 wk old with a mean BW of 33 kg) from 46 breeding herds in Norway to monitor their growth performances until they reached a BW of 100 kg. Electronic feeding stations in all pig pens used FIRE (Feed Intake Recording Equipment, Osbourne Ltd., Newcastle, UK) to record daily feed intake and daily weight gain for each pig individually. Pigs fed 1 at a time ad libitum from 1 electronic feed dispenser in each pen on conventional concentrate containing 161 and 136 g digestible protein, 9.68 and 9.50 MJ net energy/kg, before and after 50-kg live weight, respectively, with 1 mo of mixing of the 2 feeds to facilitate the feed change. Blood samples for pH1N1v antibodies testing were routinely taken from pigs at the end of their stay at the boar testing station. Most of these pigs were at least 100 kg BW or more.
Study Sample
The study sample consisted of 921 pigs (53% Landrace, 47% Duroc) from 43 breeding herds that were performance tested at the testing station between 2009 and 2012. The control group of seronegative pigs (n = 728) included pigs tested by cELISA to be negative for antibodies against pH1N1v when they were at 100 kg or greater BW before leaving the station.
During an acute onset of clinical influenza pH1N1v infection at the station in April 2011, we investigated the pattern of disease occurrence in 12 cohorts of pigs housed in separate rooms at the station by using serology and PCR testing of nasal swabs taken from 375 pigs over a period of 4 mo. Real-time PCR (RT-PCR) identified 193 virus-positive pigs of varying ages (or BW). This group of viruspositive pigs (n = 193) was stratified into 3 subgroups according to their age (or BW) at moment of infection. Virus-positive group 1 (VIR 1, n = 122) included pigs that tested positive for pH1N1v by RT-PCR when they weighed between 33 and 60 kg (growth phase 1 [GF 1]). Virus-positive group 2 (VIR 2, n = 34) included pigs that tested positive for pH1N1v by RT-PCR when they weighed between 61 and 80 kg (growth phase 2 [GF 2]). Virus-positive group 3 (VIR 3, n = 37) included pigs that tested positive for pH1N1v by RT-PCR when they weighed between 81 and 100 kg (growth phase 3 [GF 3]).
Impact Measures for Reduced Feed Efficiency in Infected Pigs
Our impact measures for reduced feed efficiency due to the infection were the increased feed requirement and increased production time of an infected pig to grow from 33 to 100 kg BW compared to an uninfected pig. We used STATA version 14.0 (StataCorp LP, College Station, TX) to execute the mixed linear regression analysis on the hierarchical data (Nherds = 43, Npigs = 921). The marginal effects attributed to the infection were represented by the coefficients of virus infection status in the mixed-model regression analysis. Besides the infection status being the predictor of interest, variance component analysis identified breed, birthdate (BD), and ADFI for the regression model. Birthdate was an important covariate in the model because a pig born in 2012 performed better than a pig born in 2009 because of production improvement over time. Average feed intake was also an important covariate because it accounted for the effects of appetite on the outcomes.
Likelihood ratio tests and the Akaike information criterion (AIC) were used for model selection. We selected the model with the lowest AIC value and with the greatest likelihood in fitting the data. To determine the significance of additional predictors for the 2 models, a difference of ±2 of the AIC value was regarded as nonsignificant, and the most parsimonious model was chosen (Burnham and Anderson, 2002). Scatterplots, postmodel residual analysis, and graphical methods were used to check the continuous variables for linearity and for influential outliers. One very influential outlier was detected and removed from the final analyses. The continuous variables BD and ADFI were centered to focus on the average pigs in the study sample. Modifying effects by covariates on the predictor of interest (infection status group) were investigated by testing interactions between them in the regression analyses.
Mixed Random-Intercept Regression Models.
Our mixed linear regression was represented by the following equation:
 |
where Yijk is the observation for the ith pig (ni = 921) nested within the jth (nj = 43) herd for the kth outcome (nk = 2, where 1 = age of pig at 100 kg and 2 = overall feed intake of pig (33 to 100 kg BW), β is a vector of coefficients for predictors and their interactions, X[ij] is the vector of explanatory variables for the ith observation of the ith pig and jth herd, uj is a vector of random intercepts unique to each herd, where uj ∼ N (0, σ2herd), and εij is the vector of error terms, where εij ∼ N(µ, σ 2).
Predictors.
Apart from BD and ADFI, which are continuous predictors, the following are categorical predictors: 1) Infection status group includes seronegative, VIR 1, VIR 2, and VIR 3. Seronegative pigs are negative for antibodies against pH1N1v at 100-kg BW, VIR 1 pigs are positive for pH1N1v between 33 and 60 kg BW, VIR 2 pigs are positive for pH1N1v between 61 and 80 kg BW, and VIR 3 pigs are positive for pH1N1v between BW 81 and 100 kg. 2) Breed includes Landrace and Duroc.
Stochastic Modeling
Variability and Uncertainty Inputs.
To construct our stochastic models, we considered the variabilities and uncertainty of 1) uncertainty point of transmission to batch (batch transmission point) with respect to the growth phase, 2) age-dependent variability between pigs at moment of infection (pig infection point) revealed by the regression analysis, 3) transmission dynamics of a contagious pH1N1v with a short infective cycle (5 d) in a batch of immunologically naive pigs, and 4) the final animal prevalence in the batch when pigs have reached 100 kg in BW. Variabilities 3 and 4 were based on observations during the clinical outbreak at the testing station from April 2012 to July 2012.
Batch level stochastic summation.
To give the batch level production effects caused by the infection, 150 infected pigs were sampled and summed up by a Monte Carlo sampling of 5,000 times per pig in relation to the variabilities and uncertainty mentioned. ModelRisk (version 5.3, Vosesoftware, Gent, Belgium) was used to perform the stochastic simulations.
Infection dynamics determine the patterns of infection within the batch.
Given that the regression analyses (Tables 1 and 2) revealed that the marginal effects of the infection varied with the pig infection point (GF 1, GF 2, or GF 3), it is important to include variabilities related to the infectious disease dynamics in the stochastic model. Our observational data based on serology and PCR testing of nasal swabs taken from 375 pigs over a period of 4 mo revealed a steep spike in the epidemic curve near the beginning of the outbreak of pH1N1v infection, indicating a very contagious infection with a very short incubation period. This result was consistent with influenza A virus infections in a batch of immunologically naive pigs (Rose et al., 2013). One hundred and twenty-two pigs, or 63% of our 193 virus-positive pigs belonged to VIR 1. The remaining virus-positive pigs belonged to VIR 2 (n = 34, or 18%) and VIR 3 (n = 37, or 19%). Reflecting these 3 proportions of each of the pig infection points, ModelRisk fitted a discrete probability distribution for the pig's infection point to be ZTPoly(41563.8, 0.000027). This discrete probability distribution was input into our stochastic model to describe the infection dynamics of an infection such that when a virus enters a batch of susceptible pigs, the bulk (63%) of the pigs would infected within a short time (<d).
Table 1.
Mixed linear regression of overall feed intake (kg) in pigs infected with influenza A(H1N1)pdm09 virus1
| Overall feed intake of a pig growing from 33to 100 kg | SE | P-value | 95% Confidence interval | ||
|---|---|---|---|---|---|
| Predictors | Coefficients | ||||
| Infection groups | |||||
| Seronegative | 0 | — | — | — | — |
| Virus positive (33–60 kg) | 8.98 | 1.15 | <0.001 | 6.72 | 11.23 |
| Virus positive (61–80 kg) | 7.63 | 2.02 | <0.001 | 3.66 | 11.59 |
| Virus positive (81–100 kg) | 9.38 | 1.95 | <0.001 | 5.57 | 13.19 |
| Breed | |||||
| Landrace | 0 | — | — | — | — |
| Duroc | 5.42 | 1.35 | <0.001 | 2.77 | 8.06 |
| ADFI (centered) | 6.81 | 2.20 | 0.002 | 2.49 | 11.13 |
| Birthdate (centered) | −0.02 | 0.00 | <0.001 | −00.023 | −00.019 |
| Constant β02 | 134.41 | 0.80 | <0.001 | 132.85 | 135.97 |
1The coefficients and standard errors of the virus positive pigs were the parameters for Gaussian curves describing the variability between pigs on the marginal effects of infection at each of the three pig infection points: Virus positive during growth phase 1 (33 kg to 60 kg), growth phase 2 (61 kg to 80 kg) and growth phase 3 (81 kg to 100 kg).
2Constant represents the overall feed intake of a seronegative Landrace pig born on 3 October 2008 with an ADFI of 2.04 kg/d.
Table 2.
Mixed linear regression for age (days) of a 100-kg pig infected with influenza A(H1N1)pdm09 virus1
| Age of pig at 100 kg | SE | P-value | 95% Confidence interval | ||
|---|---|---|---|---|---|
| Predictors | Coefficients | ||||
| Infection groups | |||||
| Seronegative | 0 | — | — | — | — |
| Virus positive (33–60 kg) | 1.65 | 0.70 | 0.02 | 0.27 | 3.02 |
| Virus positive (61–80 kg) | 1.89 | 1.23 | 0.13 | −0.52 | 4.30 |
| Virus positive (81–100 kg) | 2.49 | 1.19 | 0.04 | 0.17 | 4.82 |
| Breed | |||||
| Landrace | 0 | — | — | — | — |
| Duroc | 6.15 | 0.98 | <0.001 | 4.24 | 8.07 |
| ADFI (centered) | −31.81 | 1.34 | <0.001 | −34.44 | −29.18 |
| Birthdate (centered) | −0.006 | 0.0006 | <0.001 | −0.008 | −0.005 |
| Constant β02 | 144.54 | 0.55 | <0.001 | 143.47 | 145.61 |
1The coefficients and standard errors of virus positive pigs were the parameters for Gaussian curves describing the variability between pigs on the marginal effects of infection at each of the three pig infection points: Virus positive during growth phase 1 (33 kg to 60 kg), growth phase 2 (61 kg to 80 kg) and growth phase 3(81 kg to 100 kg).
2Constant represents the age (days) at 100 kg of a seronegative Landrace pig born on 3 October 2008 with an ADFI of 2.04 kg/d.
Comparisons between Batches with 3 Different Time Points of Virus Transmission
With the simulated batch level results from 5,000 iterations for each of the 150 pigs sampled, we used ModelRisk to plot cumulative probability plots to compare the batch level production impacts for the three possible batch transmission points at GFs1, 2 or 3). An additional plot was constructed for a batch infected during GF 3 with 100% animal prevalence to investigate the extent of overestimation if variability of animal prevalence was excluded.
Sensitivity Analysis to Rank Influence of the Variabilities
Tornado charts generated by ModelRisk were used to rank the variability inputs for the stochastic models in terms of their impact on the conditional means and variance of the outputs.
RESULTS
Batch Transmission Point
The time point at which the virus came into contact with a susceptible batch of pigs was treated as an uncertainty since we had no information on the probabilities of batch transmission points on a national basis. We assumed all three batch transmission points of GFs 1, 2 and 3 had equal probabilities of taking place and therefore used the discrete probability distribution function ZTBinomial (3, 0.42) generated by ModelRisk to match our assumption.
Individual Pig Variability
The linear regression analysis in Tables 1 and 2 showed that besides infection status as the main predictor, covariates breed, BD, and daily feed intake were significant in predicting the outcomes of total feed intake and age of pig at 100 kg BW. The absence of significant interactions between the covariates and the main predictor suggested that the covariates did not modify the effects of the virus infection. For example, the negative effects of the infection were equal between the Landrace and Duroc given that interaction between breed and infection was absent. The coefficients and SE of the 3 infection groups of pigs (VIR 1, VIR 3, VIR 3) were the parameters for Gaussian distributions describing the variability between individual pigs.
Increased Feed Requirement: Batch Level Stochastic Simulations
Cumulative probability plots based on the stochastic model in Fig. 1 show that an infected batch of 150 pigs required additional feed ranging from 770 to 1,470 kg. A batch infected during GF 3 required the greatest amount of additional feed, whereas a batch infected during GF 2 required the least. The plots corresponded with the regression models in Tables 1 and 2. A majority of pigs infected during GF 2 would give the lowest marginal effect for the infection. A batch infected during GF 3 would cause only VIR 3 pigs to be infected, which would give the worst marginal effects of the infection compared with having younger infected pigs. Assuming a 100% prevalence of infection in the batch of pigs could overestimate the increase in feed requirement by as much as half a ton of feed in the case of batches infected during GF 3.
Figure 1.
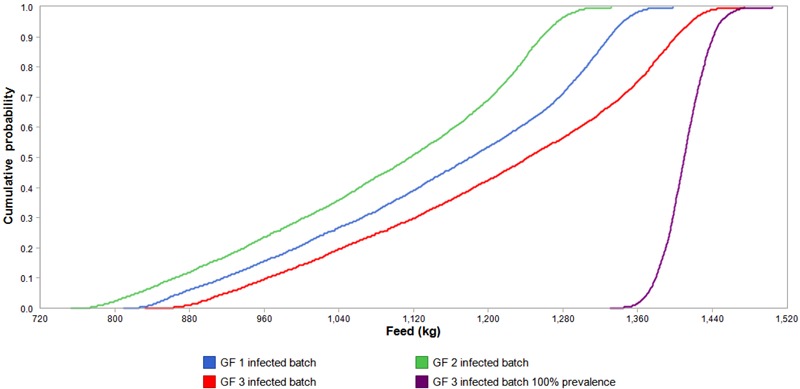
Cumulative probability plots of the additional feed requirement (kg) for a batch (n = 150) of fattening pigs infected with influenza A(H1N1)pdm09 virus growing from 33 to 100 kg. Based on the stochastic model, Monte Carlo of 5,000 sampling for each pig summed up to 150 pigs for batch level effects were executed for each of the 3 batch transmission points (GF 1, 2, and 3). In addition, variabilities in the stochastic model were 1) individual pig variability, 2) infection dynamics of a short cycled contagious pathogen, and 3) final animal prevalence. To show the extent of overestimation of the effects if variability of final animal prevalence was ignored, the right most s-curve (purple s-curve) represents a cumulative probability plot of batches infected during GF 3 with 100% animal prevalence.
Increased Production Time: Batch Level
Infection Dynamics of Virus in a Cohort of Naïve Pigs.
Cumulative probability plots in Fig. 2 show that infection by pH1N1v in a batch of 150 fattening pigs can prolong production time by as much as 430 d in a batch of pigs with transmission point at GF 3. This was no surprise since a VIR 3 pig performed worst in prolonging production time by 2.5 d (Table 2). Assuming a 100% prevalence of infection in the batch of 150 pigs could overestimate the protracted production time by as much as 120 d in the case of batches infected during GF 3.
Figure 2.
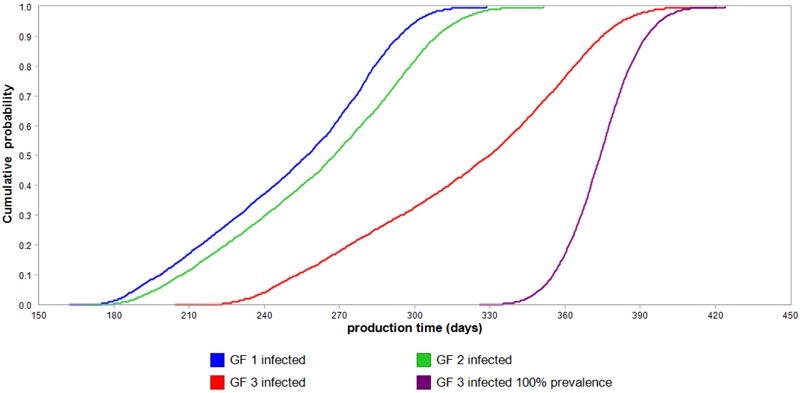
Cumulative probability plots of the increased production time (days) for a batch (n = 150) of fattening pigs infected with influenza A(H1N1)pdm09 virus growing from 33 to 100 kg. Based on the stochastic model, Monte Carlo of 5,000 samplings for each pig summed up to 150 pigs for batch level effects were executed for each of the 3 batch transmission points (GF 1, 2, and 3). In addition, variabilities in the stochastic model were 1) individual pig variability, 2) infection dynamics of a short cycled contagious pathogen, and 3) final animal prevalence. To show the extent of overestimation of the effects if variability of final animal prevalence was ignored, the right most s-curve (purple s-curve) represents a cumulative probability plot of batches infected during GF 3 with 100% animal prevalence.
Final Prevalence.
The longitudinal study at the boar testing station revealed a highly contagious infection with the final animal prevalence of 12 cohorts of pigs housed in close proximity in 12 separate rooms ranged from 62% to 100% (Table 3). ModelRisk fitted the bounded continuous probability distribution to these 12 values with Beta4(0.96, 0.56, 0.62, 1) to described the likelihood of the final animal prevalence in an infected batch of pigs.
Table 3.
Final prevalence based on infectious status of 12 cohorts of pigs housed in 12 separate rooms when the pigs reached a BW of 100 kg1
| Room | Seronegative at 100 kg | Virus positive | Seropositive at 100 kg | Infected | Total | Final prevalence |
|---|---|---|---|---|---|---|
| 1 | 2 | 21 | 24 | 45 | 47 | 96% |
| 2 | 4 | 11 | 12 | 23 | 27 | 85% |
| 3 | 1 | 21 | 8 | 29 | 30 | 97% |
| 4 | 1 | 11 | 15 | 26 | 27 | 96% |
| 5 | 2 | 28 | 50 | 78 | 80 | 98% |
| 6 | 6 | 25 | 45 | 70 | 76 | 92% |
| 7 | 2 | 18 | 48 | 66 | 68 | 97% |
| 8 | 25 | 10 | 31 | 41 | 66 | 62% |
| 9 | 20 | 12 | 27 | 39 | 59 | 66% |
| 10 | 10 | 15 | 33 | 48 | 58 | 83% |
| 11 | 0 | 14 | 7 | 21 | 21 | 100% |
| 12 | 9 | 6 | 14 | 20 | 29 | 69% |
1By using ModelRisk (version 5.3, Vosesoftware, Gent, Belgium), a probability distribution of Beta4 (0.96,0.56,0.62,1) was fitted to the twelve final animal prevalence figures for the 12 cohorts of pigs.
Sensitivity Analysis of Infected Batches Randomly Sampled from the Population
The Tornado charts in Fig. 3 and 4 show that the final prevalence contributed most to the conditional mean and variance. Batch transmission point with a lower magnitude was the other important uncertainty input that had a considerable impact on the conditional mean and variance.
Figure 3.
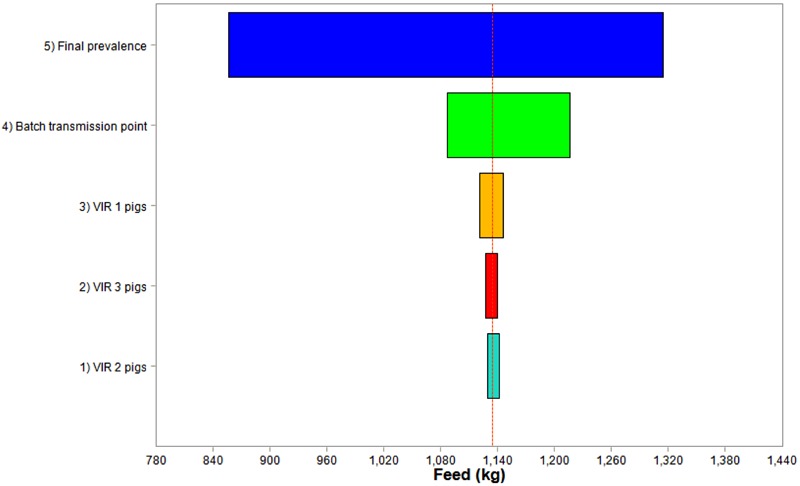
Sensitivity analysis ranking the variability and uncertainty contribution to the conditional means of additional feed intake in infected batches of 150 fattening pigs growing from 33 to 100 kg. For final prevalence in infected batch, the prevalence of infection when a batch of pigs has reached 100 kg BW is a variability input in the stochastic model and is described by a discrete probability distribution of Beta(0.96, 0.56, 0.62, 1) derived from data in Table 1. For batch infection point, 3 batch infection points (GF 1: 33 to 60 kg; GF 2: 61 to 80 kg; and GF 3: 81 to 100 kg) were assumed to have equal probability and were described by the discrete probability function ZTBinomial(3, 0.42). VIR 1 pigs are pigs infected when BW were between 33 and 60 kg, VIR 2 pigs are pigs infected when BW were between 61 and 80 kg, and VIR 3 pigs are pigs infected when BW were between 81 and 100 kg.
Figure 4.
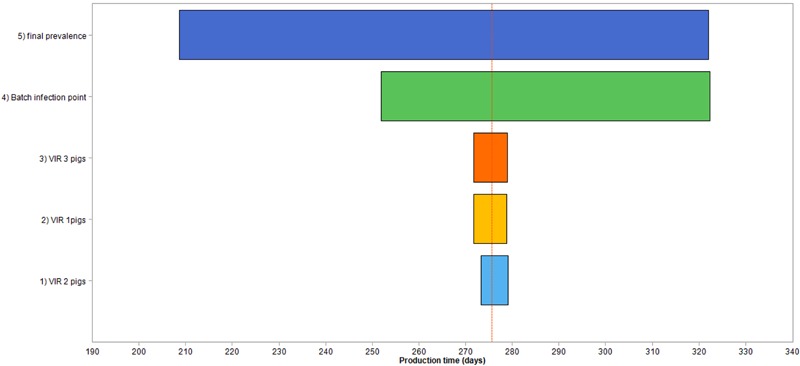
Sensitivity analysis ranking of the variability and uncertainty contribution to the conditional mean of the increase in production time in an infected batch of 150 fattening pigs growing from 33 to 100 kg. For final prevalence in infected batch, the prevalence of infection when batch of pigs has reached 100 kg BW is a variability input in the stochastic model. It is described by a discrete probability distribution of Beta(0.96, 0.56, 0.62, 1) derived from data in Table 1. For batch infection point, 3 batch infection points (GF 1: 33 to 60 kg; GF 2: 61 to 80 kg; and GF 3: 81 to 100 kg) were assumed to have equal probability and were described by the discrete probability function ZTBinomial(3, 0.42). VIR 1 pigs are pigs infected when BW were between 33 and 60 kg, VIR 2 pigs are pigs infected when BW were between 61 and 80 kg, and VIR 3 pigs are pigs infected when BW were between 81 and 100 kg.
DISCUSSION
Growth performance indicators such as feed conversion ratio and feed intake are important parameters when studying the economic effects of endemic disease in finishing pig production (Losinger, 1998; Jensen et al., 2008). Keeping pigs longer than necessary also requires additional costs for fuel, electricity, labor, etc., and can affect the number of fattening rounds in a year. Although many papers have stated that respiratory disease infection in pigs can reduce feed efficiency and lead to lower growth rates and hence delays in the pigs getting to market weight (Kothalawala et al., 2006; Van Alstine, 2012; Van Reeth et al., 2012), the negative impacts on growth performance have not been properly quantified and published. Conversely, by using stochastic models in our study, we have quantitatively estimated the impact of the newly emerged influenza A(H1N1)pdm09 virus infection on growth performance in pigs in terms of increased feed and protracted production time. The models accounted for the heterogeneities between pigs and between batches to predict the likely variation between herds in Norway. The production impact of a subclinical disease like influenza A(H1N1)pdm09 virus for a batch of 150 naïve Norwegian pigs growing from 33 to 100 kg can be as much as 1.5 t of extra feed and 420 pig days of longer production time if most of the pigs are infected as older pigs during GF 3. This would occur if the batch transmission point was at GF 3, which explains why sensitivity analysis in Figs. 3 and 4 identified batch transmission point as an influential uncertainty. Overall, the upshot of protracted production time of infected pigs means that the number of possible cycles of fattening pigs would be reduced if farmers choose to keep their pigs until they reach the desired market weight. However, in all-in–all-out operations like fattening pig herds, farmers do not have the option to keep pigs longer than the designated market day and must sell their pigs at lighter BW than desired to clear the farm for the next batch.
Our stochastic models were built to reflect the influenza A(H1N1)pdm09 virus as a short-cycle pathogen with a short incubation period. This is consistent with other studies that have showed that the influenza A(H1N1)pdm09 virus is transmitted efficiently between pigs, including subclinical pigs, by aerosol or direct contact with secretions of infected individuals or contaminated fomites (Brookes and Brown, 2011). It is highly possible that all pigs within a batch could eventually be infected in the worst-case scenario. This is also true for other SIV (H1N1, H1N2, and H3N2) currently circulating in most pig-producing countries, where all susceptible pigs in a herd are likely able to become infected and transmit the virus (Tellier, 2006, 2009; Torremorell et al., 2012). The sensitivity analysis of our stochastic models showed that reducing the final prevalence and keeping the proportion of pigs infected during GF 3 the smallest (or avoiding batch transmission point at GF 3) would have the greatest impact in reducing the negative effects of the infection.
The final prevalence and infection dynamics probability distributions in our model were dependent on and reflected the indoor environmental conditions such as temperature, humidity, air quality, and stocking density at the boar testing station. Although such environmental conditions may not vary much for fattening herds in Norway given that most, if not all, pigs are kept indoors under the Nordic conditions, they could be different in other pig production countries. Hence, it would be interesting for further studies to correlate the effect of housing and husbandry conditions on the final prevalence of this disease within a batch of pigs. Such studies could elucidate nonvaccine types of interventions such as altering the pig's environment with the aim of reducing the final prevalence of the infection or helping older pigs avoid infection. The ultimate goal is clearly to reduce the negative impact of the virus infection on production without resorting to vaccination.
We have chosen a batch size of 150 pigs to reflect the average batch size of fattening pig herds in Norway, which is small by international standards. However, extrapolation to other batch sizes is possible because the production impact is directly proportional to batch size assuming identical epidemiological patterns and similar production conditions in extrapolated herds.
Although influenza A viruses are ubiquitous in animals and endemic in most pig populations worldwide (Brown, 2000, 2013; Kothalawala et al., 2006; Van Reeth et al., 2012; Valls and Luque, 2015), a production impact such as the one we have presented from less virulent diseases like influenza A(H1N1)pdm09 virus infection in pigs could easily be overlooked, especially in countries where swine influenzas are classed under passive surveillance systems (Bowman et al., 2012). Norway is a rare exception in that it has ongoing active national serological surveillance for influenza A virus infection in its population of unvaccinated pigs. In the last 5 yr from 2010 to 2014, Norway's herd prevalence for influenza A(H1N1)pdm09 virus infection has stabilized in the range of 41% to 50%, thus indicating that the infection has established itself in the pig population. Even though infection would confer long-term active immunity to a pig that recovered from infection, the quick turnover of fattening pigs whose lifespan is less than 7 mo ensures that large populations of immunologically naïve pigs are constantly produced, making the continuous propagation of influenza infection possible (Van Reeth et al., 2012). In addition, any maternal antibodies a fattening pig may have would decrease by the time the pig reaches 12 to 14 wk, or about 33 kg in BW (Loeffen et al., 2003), making them susceptible to infection. Hence, fattening pig herds in Norway constantly present themselves as susceptible for influenza virus infection and reduced growth performance from lower feed efficiency.
The Norwegian model may be too simplistic to estimate the impact of swine influenza on growth performance in pigs for other countries because it reflects Norway's production system and unique pig disease profile (Lium et al., 2014). The situation in other countries is different because they have various strains of SIV, including the influenza A(H1N1)pdm09 virus, that exist as coinfections (Maes et al., 2000; Song et al., 2010; Simon et al., 2014) and respiratory pathogens, such as the porcine reproductive and respiratory syndrome virus, the porcine respiratory coronavirus, and Mycoplasma hyopneumoniae (Crisci et al., 2013), which would undoubtedly complicate the picture.
In any case, given that the influenza A(H1N1)pdm09 virus is established in the Norwegian pig population, a Norwegian farmer or the national food safety authority may find our production impact model useful in estimating the burden of the infection at the farm and at the national level for economic analyses. Eco nomic analyses to estimate producer surplus can help the farmer in making decisions on whether to implement biosecurity measures with regard to keeping a herd from getting infected during the next production cycle or keeping the prevalence in the batch as low as possible if infection occurs, assuming an all-in and all-out production system. It would make sense to implement effective biosecurity measures if the costs of these measures do not exceed the cost of the negative effects of the disease, thus giving a motivating producer surplus.
Footnotes
We thank Norsvin for the use of their pig testing facility to collect samples and for providing the production data. This was purely a field observational study, so there were no experimental interventions involved. We thank the Norwegian Research Council for providing funding (NFR207836).
LITERATURE CITED
- Bowman A. S., Nolting J. M., Nelson S. W., Slemons R. D. 2012. Subclinical influenza virus A infections in pigs exhibited at agricultural fairs, Ohio, USA, 2009–2011. Emerg. Infect. Dis. 18:1945–1950. doi: 10.3201/eid1812.121116 [DOI] [PMC free article] [PubMed] [Google Scholar]
- Brookes S. M., Brown I. H. 2011. A/H1N1/pdm09 virus: Dynamics of infection in pigs and people. Vet. Rec. 169(6):151–152. doi: 10.1136/vr.d4945 [DOI] [PubMed] [Google Scholar]
- Brookes S. M., Núñez A., Choudhury B., Matrosovich M., Essen S. C., Clifford D., Slomka M. J., Kuntz-Simon G., Garcon F., Nash B., Hanna A., Heegaard P. M. H., Quéguiner S., Chiapponi C., Bublot M., Maldonado Garcia J., Gardner R., Foni E., Loeffen W., Larsen L., Van Reeth K., Banks J., Irvine R. M., Brown I. H. 2010. Replication, pathogenesis and transmission of pandemic (H1N1) 2009 virus in non-immune pigs. PLoS ONE 5(2):e9068. doi: 10.1371/journal.pone.0009068 [DOI] [PMC free article] [PubMed] [Google Scholar]
- Brown I. H. 2000. The epidemiology and evolution of influenza viruses in pigs. Vet. Microbiol. 74 (1–2):29–46. [DOI] [PubMed] [Google Scholar]
- Brown I. H. 2013. History and epidemiology of swine influenza in Europe. Swine Influenza 370:133–146. doi: 10.1007/82_2011_194 [DOI] [PubMed] [Google Scholar]
- Burnham K. P., Anderson D. R. 2002. Model selection and multi-model inference: A Practical information-theoretic approach. 2nd ed.Springer, New York. [Google Scholar]
- Centers for Disease Control and Prevention 2009. Outbreak of swine-origin influenza A (H1N1) virus infection—–Mexico, March–April 2009. JAMA 301(22):2321–2322. [Google Scholar]
- Crisci E., Mussá T., Fraile L., Montoya M. 2013. Review: Influenza virus in pigs. Mol. Immunol. 55(3–4):200–211. doi: 10.1016/j.molimm.2013.02.008 [DOI] [PubMed] [Google Scholar]
- Er C., Lium B., Tavornpanich S., Hofmo P., Forberg H., Hauge A., Grontvedt C., Framstad T., Brun E. 2014. Adverse effects of Influenza A(H1N1)pdm09 virus infection on growth performance of Norwegian pigs—A longitudinal study at a boar testing station. BMC Vet. Res. 10:284. doi: 10.1186/s12917-014-0284-6 [DOI] [PMC free article] [PubMed] [Google Scholar]
- Grontvedt C. A., Er C., Gjerset B., Germundsson A., Framstad T., Brun E., Jorgensen A., Lium B. 2011. Clinical impact of infection with pandemic influenza (H1N1) 2009 virus in naive nucleus and multiplier pig herds in Norway. Influenza Res. Treat. 2011:163745. doi: 10.1155/2011/163745 [DOI] [PMC free article] [PubMed] [Google Scholar]
- Grontvedt C. A., Er C., Gjerset B., Hauge A. G., Brun E., Jorgensen A., Lium B., Framstad T. 2013. Influenza A(H1N1)pdm09 virus infection in Norwegian swine herds 2009/10: The risk of human to swine transmission. Prev. Vet. Med. 110(3–4):429–434. doi: 10.1016/j.prevetmed.2013.02.016 [DOI] [PMC free article] [PubMed] [Google Scholar]
- Hofshagen M., Gjerset B., Er C., Tarpai A., Brun E., Dannevig B., Bruheim T., Fostad I. G., Iversen B., Hungnes O., Lium B. 2009. Pandemic influenza A(H1N1)v: Human to pig transmission in Norway? Euro Surveill. 14(45). [DOI] [PubMed] [Google Scholar]
- Jensen T. B., Baadsgaard N. P., Houe H., Toft N., Ostergaard S. 2008. The association between disease and profitability in individual finishing boars at a test station. Livest. Sci. 117:101–108. doi: 10.1016/j.livsci.2007.12.003 [DOI] [Google Scholar]
- Kothalawala H., Toussaint M. J. M., Gruys E. 2006. An overview of swine influenza. Vet. Q. 28:45–53. [PubMed] [Google Scholar]
- Lium B., Er C., Zerihun A. 2014. The surveillance and control programme for specific virus infections in swine herd in Norway 2013. In: Sviland S., Hellberg H. editors, Surveillance and control programmes for terrestrial and aquatic animals in Norway. Annual Report 2013. Norwegian Vet. Inst., Oslo. [Google Scholar]
- Loeffen W. L. A., Heinen P. P., Bianchi A. T. J., Hunneman W. A., Verheijden J. H. M. 2003. Effect of maternally derived antibodies on the clinical signs and immune response in pigs after primary and secondary infection with an influenza H1N1 virus. Vet. Immunol. Immunopathol. 92:23–35. doi: 10.1016/S0165-2427(03)00019-9 [DOI] [PubMed] [Google Scholar]
- Losinger W. C. 1998. Feed-conversion ratio of finisher pigs in the USA. Prev. Vet. Med. 36:287–305. doi: 10.1016/S0167-5877(98)00094-4 [DOI] [PubMed] [Google Scholar]
- Maes D., Deluyker H., Verdonck M., Castryck F., Miry C., Vrijens B., de Kruif A. 2000. Herd factors associated with the seroprevalences of four major respiratory pathogens in slaughter pigs from farrow-to-finish pig herds. Vet. Res. 31:313–327. [DOI] [PubMed] [Google Scholar]
- Rose N., Herve S., Eveno E., Barbier N., Eono F., Dorenlor V., Andraud M., Camsusou C., Madec F., Simon G. 2013. Dynamics of influenza A virus infections in permanently infected pig farms: Evidence of recurrent infections, circulation of several swine influenza viruses and reassortment events. Vet. Res. 44:72. doi: 10.1186/1297-9716-44-72 [DOI] [PMC free article] [PubMed] [Google Scholar]
- Simon G., Larsen L. E., Durrwald R., Foni E., Harder T., Van Reeth K., Markowska-Daniel I., Reid S. M., Dan A., Maldonado J., Huovilainen A., Billinis C., Davidson I., Aguero M., Vila T., Herve S., Breum S. O., Chiapponi C., Urbaniak K., Kyriakis C. S., Consortium Esnip, Brown I. H., Loeffen W. 2014. European surveillance network for influenza in pigs: Surveillance programs, diagnostic tools and swine influenza virus subtypes identified in 14 European countries from 2010 to 2013. PLoS One 9(12):e115815. doi: 10.1371/journal.pone.0115815 [DOI] [PMC free article] [PubMed] [Google Scholar]
- Song X. H., Xiao H., Huang Y., Fu G., Jiang B., Kitamura Y., Liu W., Liu D., Gao G. F. 2010. Serological surveillance of influenza A virus infection in swine populations in Fujian Province, China: No evidence of naturally occurring H5N1 infection in pigs. Zoonoses Public Health 57:291–298. doi: 10.1111/j.1863-2378.2009.01270.x [DOI] [PubMed] [Google Scholar]
- Tellier R. 2006. Review of aerosol transmission of influenza A virus. Emerg. Infect. Dis. 12:1657–1662. [DOI] [PMC free article] [PubMed] [Google Scholar]
- Tellier R. 2009. Aerosol transmission of influenza A virus: A review of new studies. J. R. Soc. Interface 6:S783–S790. doi: 10.1098/rsif.2009.0302.focus [DOI] [PMC free article] [PubMed] [Google Scholar]
- Torremorell M., Allerson M., Corzo C., Diaz A., Gramer M. 2012. Transmission of influenza A virus in pigs. Transbound. Emerg. Dis. 59:68–84. doi: 10.1111/j.1865-1682.2011.01300.x [DOI] [PubMed] [Google Scholar]
- Valls G., Luque I. 2015. Prevalence and diversity of swine influenza virus in Europe. [Google Scholar]
- Van Alstine W. G. 2012. Respiratory system. In: Zimmerman J., Karriker L., Ramirez A., Schwartz K. J. editors, Diseases of swine. Wiley-Blackwell. [Google Scholar]
- Van Reeth K., Brown I. H., Olsen C.W. 2012. Influenza virus. In: Zimmerman J., Karriker L., Ramirez A., Schwartz K. J. editors, Diseases of swine. Wiley-Blackwell. [Google Scholar]
- Wetten M., Odegard J., Vangen O., Meuwissen T. H. E. 2012. Simultaneous estimation of daily weight and feed intake curves for growing pigs by random regression. Animal 6:433–439. doi: 10.1017/S1751731111001832 [DOI] [PubMed] [Google Scholar]