

Abstract
Plasmacytoid dendritic cells (pDCs) are an important source of IFN-α/β in response to a variety of viruses in vivo, including murine cytomegalovirus (MCMV). However, the respective contributions of various infected organs, and within these of pDCs, conventional dendritic cells and other cells, to the systemic production of IFN-α/β or other innate cytokines during viral infections in vivo is largely unknown. Whether a specialization of pDC subsets in the production of different patterns of innate cytokines exists in vivo in response to a viral infection has not been investigated. Here, by analyzing for the first time directly ex vivo, at the single-cell level, the simultaneous production of up to three cytokines in pDCs isolated from MCMV-infected mice, we show that (i) pDCs are the quasi-exclusive source of IFN-α/β, IL-12 and tumor necrosis factor (TNF)-α, early during MCMV infection, in two immunocompetent mouse lines and with two viral strains, (ii) pDC activation for IFN-α/β production is organ specific and (iii) a significant proportion of pDCs simultaneously produce IFN-α/β, TNF-α and IL-12, although TNF-α and IFN-α/β appear more often co-expressed with one another than each of them with IL-12. Altogether, these results show a broad and non-redundant role of pDCs in early innate detection of, and defense against, viral infection. The data also show differences in the responsiveness of pDCs from different tissues and suggest distinct molecular requirements for pDC production of various cytokines. These observations must be taken into account when designing new antiviral vaccination strategies aimed at harnessing pDC responses.
Keywords: dendritic cells, IFN-α/β, IL-12, murine cytomegalovirus, tumor necrosis factor-α
Introduction
Viral infection is a major cause of severe illness and death worldwide. To design new therapeutic strategies to fight viruses, it is critical to identify the mechanisms which limit viral replication directly or shape immune responses in vivo.
In vertebrates, successful host defense against viral infections relies heavily on the early production of IFN-α/β that promote an antiviral state in adjacent non-infected cells as well as the activation of antiviral cytotoxic lymphocytes (1). Recently, plasmacytoid dendritic cells (pDCs) have been demonstrated to be specialized in the production of high levels of IFN-α/β in response to a wide variety of viruses both in humans and mice (2–6). However, virtually any virus-infected cell can produce IFN-α/β as recently exemplified for conventional dendritic cells (cDCs) (7, 8). Indeed, the relative contribution of pDCs, cDCs or other cell types for IFN-α/β production in vivo during viral infection is controversial (8–11). In order to activate pDCs at the right place when developing vaccination strategies aimed at harnessing the antiviral functions of these cells, it will also be important to assess the respective contribution of pDCs from various organs to overall IFN-α/β production in infected animals.
In addition to IFN-α/β, murine, but not human, pDCs are able to produce high levels of IL-12 in response to virus-type stimuli (2, 10, 12). A developmental, phenotypic and functional heterogeneity of mouse pDCs has been described (13). One could therefore wonder whether the ability of murine pDCs to produce IL-12 could reflect the existence of a pDC subset specialized in the production of this cytokine that is absent in the human. Alternatively, each individual mouse pDC could be endowed with the ability to produce IL-12 and this may reflect an intrinsic difference in the signaling pathways triggered in human and murine pDCs by orthologous receptors.
The first aim of this study was to thoroughly investigate the contribution of splenic pDCs for the production of IFN-α/β and other innate cytokines during a herpesvirus infection. The second was to address whether pDC activation in response to a viral infection in vivo differs between different anatomical sites of viral replication. The third aim was to investigate whether production of multiple innate cytokines could occur simultaneously in vivo in pDCs at the single-cell level or whether these functions reflect the existence of distinct pDC subsets specialized in the production of different cytokines. Murine cytomegalovirus (MCMV) infection was chosen as a model because it is one of the best characterized systems to study innate and adaptive immune responses to infection in vivo (14). We have already reported a major contribution of pDCs for early IFN-α/β and IL-12 production in response to MCMV infection in vivo (10, 15) which has since been confirmed independently by others (16). However, other studies have documented the ability of cDCs to produce IFN-α/β upon infection with MCMV in vitro (8, 17). This observation, together with the lack of reagent which allow for the depletion of pDCs with sufficient specificity and efficiency in infected animals (18), led to the questioning of the relevance of pDCs in viral infection and to the proposal that cDCs or other infected cells significantly contribute to the production of IFN-α/β during MCMV infection in vivo (11).
To better evaluate the respective contributions of different cell populations for IFN-α/β production in vivo during MCMV infection, we have developed sensitive flow cytometry and immunohistofluorescence techniques for the detection of cytokine-producing cells ex vivo in cell suspensions or in vivo on tissue sections. These studies are the first to demonstrate by direct ex vivo staining of IFN-α/β that pDCs are the quasi-exclusive source of these cytokines during MCMV infection of immunocompetent animals in three different mouse strains and with two different virus strains. Moreover, we show that pDC activation for IFN-α/β production is organ specific, with a major contribution of the spleen to the systemic production of the cytokines which contrasts with the lack of response observed in other major sites of viral replication. We also demonstrate for the first time that pDCs are the major source of tumor necrosis factor (TNF)-α early after viral infection, in contrast to the hypotheses proposing a predominant role of NK cells (14) or macrophages (19) for this function. A significant proportion of pDCs simultaneously produce IFN-α/β, TNF-α and IL-12 in response to MCMV infection, although TNF-α and IFN-α/β appear more often co-expressed with one another than each of them with IL-12. This suggests that the capacity of murine pDCs to produce both IFN-α/β and IL-12 in response to MCMV exists within each cell and does not reflect the existence of different pDC subsets. Altogether, these results bring novel important insights on the local functions of pDCs in the host during viral infection.
Methods
Mice
Pathogen-free C57BL/6, BALB/c and 129S2 mice were purchased from Charles River Breeding laboratories. All animals were housed under specific pathogen-free conditions at the Centre d'Immunologie de Marseille-Luminy (Marseille, France). Animals were used for experiments between 6 and 12 weeks of age. Experiments were conducted in accordance with institutional guidelines for animal care and use. Protocols have been approved by the French Provence ethical committee (number 04/2005) and the U.S. Office of Laboratory Animal Welfare (assurance A5665-01).
Virus and injections
Infections were initiated by intraperitoneal injection of salivary gland extract of Smith or Perth (K181) strains of wild-type MCMV with 105 plaque-forming units (PFUs) for C57BL/6 mice and 104 PFUs for BALB/c and 129S2 mice.
Sample collection and organs preparation
After various times of infection, mice were anesthetized to collect blood and organs. Organs were harvested and prepared as described (10, 20–22). Blood leukocytes were separated with Lympholyte-M solution (CEDARLANE). All leukocytes were kept in PBS, EDTA (5 mM), FCS (5%) before staining.
cDC and pDC enrichment using magnetic beads
Total splenic leukocytes from a pool of seven untreated or MCMV-infected BALB/c or C57BL/6 mice were incubated with anti-CD11c and anti-mPDCA1 MicroBeads and passed through a positive selection LS column with quadroMACS magnet, accordingly to the instructions of the manufacturer (Miltenyi Biotec). Enriched cells were then blocked with 2.4G2 antibody and stained with the following antibodies: 120G8, anti-mPDCA-1, anti-CD11c and anti-CD8α and finally sorted with FACSVantage (BD Bioscience). Purity of sorted pDCs (120G8highPDCA-1highCD11c+), CD8α cDCs (120G8−/lowPDCA-1−/lowCD11chighCD8α+) and CD8α− cDCs (120G8−/lowPDCA-1−/lowCD11chighCD8α−) was checked with FACSCalibur (BD Bioscience).
Flow cytometry analysis
Cells were first fixed and permeabilized with Cytofix/Cytoperm kit (BD Pharmingen). Intracellular staining was done next. A four-step protocol was performed for IFN-α/β intracellular staining, with a first incubation with a mix of anti-IFN-α/β antibodies (F18, RMMA-1 and RMMB-1, all from TEBU-BIO), followed by biotinylated goat anti-rat antibody (Jackson Immunoresearch), streptavidin–allophycocyanin (APC) APC or peridinin-chlorophyll-protein complex (PerCP) (BD Pharmingen) and Rat IgG whole molecule for blocking (Jackson Immunoresearch). Extracellular staining was then performed with various combinations of antibodies directly conjugated to suitable fluorochromes and diluted in PBS, EDTA (5 mM), FCS (5%) with 2.4G2 mAb. Similar stainings were performed with isotype controls to set the threshold for positivity. Stained cells were kept in PFA 1% and then acquired on FACSCalibur, FACSCanto I or II (BD Bioscience). Data were analyzed on FlowJo (Tree Star) or DIVA software (BD Bioscience).
Quantification of cytokines in sera
Sera were analyzed with Mu-IFN-α ELISA Kit (PBL Biomedical Laboratories), mIL-12p70 ELISA Kit and Mouse TNF-α ELISA Kit (R&D Systems) accordingly to the instructions of the manufacturer. Colorimetric changes of enzyme substrates were detected at 450 nm wavelength using Wallac Victor2 1420 (Perkin Elmer). Limits of detection for each ELISA assay were 16 pg ml−1 for IFN-α, 8 pg ml−1 for IL-12p70 and 17 pg ml−1 for TNF-α.
RNA extraction and reverse transcription–PCR
Total RNA was extracted from the same numbers of cells of the different sorted fractions with RNeasy micro and mini kits (QIAGEN) with DNase digestion. Total RNA was reverse transcribed into cDNA by using SuperScript™ III Reverse Transcriptase (Invitrogen) or mock reverse transcribed by omitting the addition of the reverse transcriptase. PCRs were performed with Taq DNA polymerase (Invitrogen) and the following primers IFN-α-FWD ATGGCTAGRCTCTGTGCTTTCCT, IFN-α-RSE AGGGCTCTCCAGAYTTCTGCTCTG; IFN-β-FWD CATCAACTATAAGCAGCTCCA, IFN-β-RSE TTCAAGTGGAGAGCAGTTGAG and Actin-FWD CATCCATCATGAAGTGTGACG; Actin-RSE CATACTCCTGCTTGCTGATCC. Amplifications were performed in MasterCycler (Eppendorf) with the following cycling parameters—IFN-α and IFN-β: 40 cycles and annealing temperature 58.4°C; Actin: 40 cycles and annealing temperature 56°C. No amplified products were detected in mock reverse-transcribed samples.
GeneChips
RNA was extracted from between 7.5 × 10⁵ and 1.5 × 10⁶ cells for each leukocyte subset with the Qiagen micro RNeasy kit, yielding between 200 and 700 ng of total RNA for each sample. Quality and absence of genomic DNA contamination were assessed with a Bioanalyser (Agilent). 100 ng of RNA from each sample was used to synthesize probes, using two successive rounds of cRNA amplification with appropriate quality control to ensure full-length synthesis according to standard Affymetrix protocols, and hybridized to mouse 430 2.0 chips (Affymetrix). Raw data were transformed with the Mas5 algorithm, which yields a normalized expression value, and ‘absent’ and ‘present’ calls. Target intensity was set to 100 for all chips. All data sets were normalized with the invariant rank method and only one representative datum was kept for redundant ProbeSets targeting the same gene.
Immunohistofluorescence
Fresh extracted spleens were included in optimal cutting temperature (OCT) compound (VWR) and cut at a thickness of 8 μm with a Leica CM3050 S cryostat. One slide of each organ was stained with hematoxylin–eosin. For immunohistofluorescence, tissue sections were fixed with cold acetone, 10 min, before saturation with PBS 2% BSA during 30 min. Staining were then performed in PBS with the following antibodies (30 min for each step): IFN-α/β (F18, RMMA-1, RMMB-1, 1:400) or isotype control, followed by anti-Rat-Alexa546 (1:200), then rat IgG for blocking and finally various combinations of antibodies for membrane markers directly conjugated to suitable fluorochromes (CD8α-FITC, CD19-PE, CD11c-APC and 120G8-Alexa488, all diluted 1:100 in PBS 1×). Sections were mounted with Prolong Gold antifade reagent (Invitrogen). An LSM-510 Carl Zeiss confocal microscope was used to analyze stained sections and to take photographs.
Results
pDCs express much higher levels of mRNA for IFN-α/β than cDCs during MCMV infection
To determine the respective contributions of DC subsets to IFN-α/β production in vivo early after MCMV challenge, we first analyzed the expression of mRNAs for these cytokines by reverse transcription (RT)–PCR in DC subsets purified ex vivo from pooled spleens of untreated or 36 h-infected animals. The three major splenic DC subsets, CD8α+ and CD8α− cDCs and pDCs, were sorted to >87% purity, with no or only very low-level cross-contamination between the subsets studied (data not shown). No signal for IFN-α/β was detected in samples from uninfected animals or in the absence of reverse transcription (data not shown), attesting to the lack of any DNA contamination in the RNA samples. At the highest concentration of cDNA used, Ifna/b mRNA could be detected in all DC subsets isolated from infected mice, with a stronger signal in pDCs (Fig. 1A). Serial dilutions of the cDNA clearly demonstrated that the amount of Ifna/b mRNA in pDCs was much higher than in the other subsets, with a signal still detectable at a 1:25 dilution in pDCs only. These results thus suggest that the three DC subsets examined express Ifna/b mRNA early after MCMV infection, but that this expression is much stronger in pDCs than in cDCs.
Fig. 1.
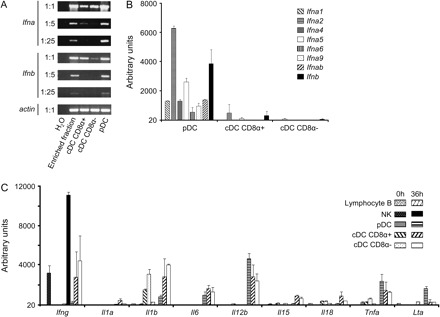
Analysis of the expression of innate cytokine mRNA by DC subsets ex vivo. pDC, CD8α+ cDC and CD8α− cDC were purified from (A) BALB/c or (B and C) C57BL/6 mice, uninfected (0 h) or infected with MCMV for 36 h. (A) RT–PCR analysis of mRNA encoding IFN-α and β in each DC subset purified. (B) GeneChip analysis of various mRNA encoding the Ifna and Ifnb genes in each purified DC subset. (C) GeneChip analysis of various mRNA encoding various innate cytokines and chemokines in each purified leukocyte subset.
We next performed gene chips analysis on an independent series of mRNA samples from over 98% pure FACS-sorted DC subsets, B lymphocytes and NK cells, in order to confirm in a more quantitative manner the differential expression of Ifna/b mRNA between various leukocyte subsets, to determine the pattern of expression of the Ifna subtypes in pDCs (Fig. 1B) and to extend our observations to other innate antiviral cytokines (Fig. 1C). No signal was detected in cells isolated from uninfected mice with any of the Ifna/b ProbSets (data not shown) and with many of the ProbSets directed against other innate cytokine genes, with the exception of Il1b, Il18, Ifng and Tnfa (Fig. 1C). In agreement with our RT–PCR analysis, a strong signal was observed specifically in pDCs from infected animals for all the ProbeSets corresponding to Ifnb or Ifna genes. Expression of many of the genes encoding IFN-α/β was also readily detectable in CD8α+ cDCs from infected animals, although with a 12- to 50-fold lower expression than in activated pDCs. No significant expression of Ifna/b could be detected in CD8α− cDCs (Fig. 1B), in B lymphocytes or in NK cells (data not shown). The expression of mRNA encoding LT-α, TNF-α and IL-12p40 also appeared higher in pDCs from infected animals than in any of the other leukocyte populations examined, although expression of Tnfa and Il12b were also strong in cDCs. In contrast, the expression of Il1b, Il15 and Il18 mRNA was higher in cDCs than in pDCs. Finally, no significant expression of the mRNA encoding IFN-γ could be detected in pDCs while a strong and reproducible induction of this gene was observed in NK cells from infected animals. Altogether, these data show that, in response to MCMV infection, pDCs express much higher levels of all the Ifna/b genes examined and of Lta than cDCs, B lymphocytes and NK cells, while cDCs express higher levels of mRNA for IL-1β, IL-15 and IL-18 and NK cells higher levels of mRNA for IFN-γ.
IFN-α/β cytokines are detected exclusively in pDCs within total splenic leukocytes, while IL-12 and TNF-α can also be expressed in other cell populations
Since discrepancies have been repeatedly reported between the expression of mRNA and proteins, we next examined expression of certain cytokines by intracellular staining on freshly isolated splenic leukocytes of untreated versus MCMV-infected mice. Cytokine expression was assessed at 0, 24, 30, 36 and 44 h after MCMV infection of different strains of mice, based on previously reported kinetics measurement of serum cytokine levels (23). Serum peak production of IFN-α/β, IL-12p70 and TNF-α was confirmed to occur between 30 and 36 h post-infection as measured by ELISA in C57BL/6 and 129S2 mice (Fig. 2A). Of note, the IFN-α/β response was faster, higher and sustained for longer in 129S2 as compared to C57BL/6 animals. The higher responses of the former animals are likely due to an enhanced intrinsic toll-like receptor reactivity of their pDCs (20) and to their stronger stimulation as a consequence of increased viral replication (NZ and MD unpublished data). To determine which cell types contribute to the production of the cytokines, intracellular flow cytometry was performed for detection of IFN-α/β, IL-12p40 and TNF-α in total splenocytes isolated from untreated or MCMV-infected 129S2 mice (Fig. 2B). For all the three cytokines, the kinetics of detection of positive cells was consistent with that of serum levels (Fig. 2). A population positive for IFN-α/β was clearly detectable at 30 and 36 h. Nearly all these cells stained the strongest with the 120G8 antibody, a pattern specific to pDCs (18). Neither cDCs (CD11chigh; Fig. 2C and Table 1) nor granulocytes (GR1highCD11bhigh; Table 1), macrophages (GR1lowCD11b+; Table 1), B lymphocytes (CD19+), T cells (CD3+CD5+), NK cells (NKp46high) or IKDCs (NKp46+B220+) (data not shown) expressed detectable levels of IFN-α/β at the times of detection of maximal serum titers of the cytokines. Of note, most of the few cells expressing low to intermediate levels of 120G8 and marked with the anti-IFN-α/β antibodies were actually stained non-specifically since they also bound the isotype control antibody (Fig. 2D) and were present in similar number in uninfected mice. The induction of 120G8 on cells other than pDCs after MCMV infection is the reflect of a strong cellular activation, in part mediated by IFN-α/β (18). Thus, some of the cells that express low to intermediate levels of 120G8 may have altered membrane properties as a consequence of their strong activation, which make them stickier to a number of molecules, including antibodies, independently of their expression of the targeted antigen or of Fc receptors. In any case, the 120G8high cells marked with the anti-IFN-α/β antibodies were stained specifically for the cytokines since they did not bind the isotype control antibody and were not present in uninfected animals. The 120G8high cells all expressed Siglec-H, a pDC-specific marker recently discovered (24, 25), in both uninfected and MCMV-infected mice, and the overwhelming majority of IFN-α/β+ splenic leukocytes stained for Siglec-H, attesting to the fact that they are pDCs (Fig. 2E). At the peak of IFN-α/β production, about 18% of splenic pDCs produced detectable level of these cytokines (Table 2). Thus, these data clearly establish that pDCs are the only splenic leukocytes producing detectable levels of IFN-α/β during infection of 129S2 animals by the Smith strain of MCMV.
Fig. 2.
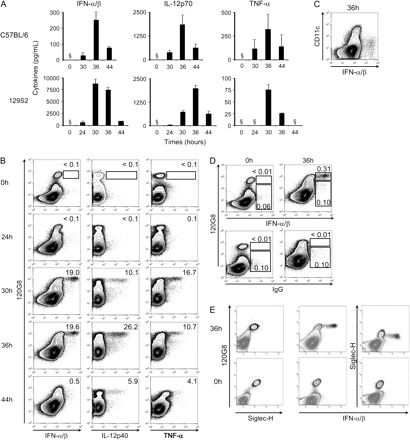
Evaluation of pDC contribution to innate cytokine production within total splenic leukocytes. C57BL/6 and 129S2 mice were left untreated (0 h) or were infected with the Smith strain of MCMV for different lengths of time (24, 30, 36 or 44 h). (A) The serum levels of IFN-α/β, IL-12p70 and TNF-α were measured by ELISA. (B–E) Expression of the cytokines in combination with the cell-surface markers 120G8 (B, D and E), CD11c (C) or Siglec-H (E) was analyzed by flow cytometry in total splenic leukocytes of 129S2 mice. (B) The percent of cytokine+ cells within the pDC gate (120G8high cells) is indicated on each dot plot. (D) The percent of pDCs (120G8high cells) or of cells of other subtypes (120G8low/int cells) that stained with the anti-IFN-α/β (upper dot plots) or with the isotype control antibodies (lower dot plots) within total splenocytes are indicated on the panel. Results shown are representative of at least two independent experiments with three mice per group. ‘§’ denotes below level of detection.
Table 1.
Contribution of different cell subtypes to innate cytokine production in 129S2 mouse, 36 h after MCMV infection
| Cytokines | Cell subsets | ||||||
| 120G8high | CD11chigh CD11b- | CD11chigh CD11b+ | GR1high CD11bhigh | GR1+ CD11b+ | GR1+ CD11b- | Other | |
| IFN-α/β | 97.1 ± 2.4a | 0.8 ± 0.5 | 0.4 ± 0.6 | 0.5 ± 0.4 | 0.2 ± 0.3 | 1.1 ± 1.9 | < 0.1 |
| IL-12 | 68.4 ± 1.6 | 3.2 ± 1.1 | 6.5 ± 2.3 | 1.2 ± 0.8 | 9.6 ± 3.7 | 3.5 ± 0.8 | 7.5 ± 0.4 |
| TNF-α | 80.2 ± 5.6 | 0.8 ± 0.7 | 1.5 ± 0.8 | 0.5 ± 0.5 | 10.0 ± 4.0 | 1.8 ± 0.9 | 5.1 ± 3.0 |
Mean percent of cells corresponding to subtypes within cytokine-producing cells ± SD.
Table 2.
Evaluation of pDC responses to MCMV infection by innate cytokine production in three different mouse strains
| Time post-infection (h) | 129S2 | BALB/c | C57BL/6 | ||||||
| IFN-α/β | IL-12 | TNF-α | IFN-α/β | IL-12 | TNF-α | IFN-α/β | IL-12 | TNF-α | |
| 0 | <0.1a | <0.1 | <0.1 | <0.1 | <0.1 | <0.1 | 0.2 ± 0.2 | 0.3 ± 0.2 | 0.4 ± 0.4 |
| 24 | 0.2 ± 0.2 | <0.1 | 0.2 ± 0.1 | ND | ND | ND | ND | ND | ND |
| 30 | 17.5 ± 2.7 | 10.1 ± 2.6 | 16.3 ± 2.9 | 2.8 ± 1.9 | 2.6 ± 0.4 | 4.6 ± 0.8 | 0.3 ± 0.2 | 0.3 ± 0.1 | 0.7 ± <0.1 |
| 36 | 18.2 ± 2.2 | 24.6 ± 1.8 | 10.1 ± 2.2 | 15.1 ± 5.0 | 20.6 ± 3.2 | 12.2 ± 2.2 | 2.8 ± 0.4 | 4.7 ± 0.9 | 4.4 ± 1.1 |
| 44 | 0.3 ± 0.4 | 5.7 ± 2.1 | 5.9 ± 2.6 | 1.2 ± 0.9 | 11.0 ± 3.2 | 3.7 ± 0.9 | <0.1 | 3.8 ± 1.1 | 1.5 ± 0.4 |
ND, not determined.
Mean frequency of cells producing the corresponding cytokine within total pDCs ± SD.
Most of the IL-12p40+ or TNF-α+ cells also stained strongly for 120G8 and therefore are pDCs (Fig. 2B and Table 1). However, monocytes/macrophages [GR1lowCD11b+, (26)] and cDCs (CD11chigh) also contribute to the production of these cytokines, although to a much lower extent (Table 1). No IFN-γ could be detected in any of the DC subsets examined, while NK cells stained strongly for this cytokine (data not shown). Thus, these data clearly establish that pDCs also bear a major contribution to the production of IL-12p40 and TNF-α during infection of 129S2 animals by the Smith strain of MCMV.
Similar results were observed with BALB/c and C57BL/6 mice (Table 2). Moreover, challenge with the MCMV Perth K181 strain yielded identical results in the three mouse strains examined (Fig. 3). Notice that, in infected C57BL/6 animals, pDCs do not constitute the main source of IL-12p40 and TNF-α but still make a significant contribution to their production (Fig. 4A). Indeed, in C57BL/6 mice, the cell type bearing the most important contribution to the production of IL-12p40 and TNF-α was characterized as CD11clowGR1lowCD11b+ (Fig. 4B) and therefore likely corresponds to monocytes/macrophages (26). We also found a minor participation of CD11chigh cells in IL-12p40 production (Fig. 4A). Neither NK cells (DX5+/NK1.1+) nor T (CD3ε+/CD5+) or B (CD19+, data not shown) lymphocytes expressed detectable level of IL-12p40 or TNF-α.
Fig. 3.
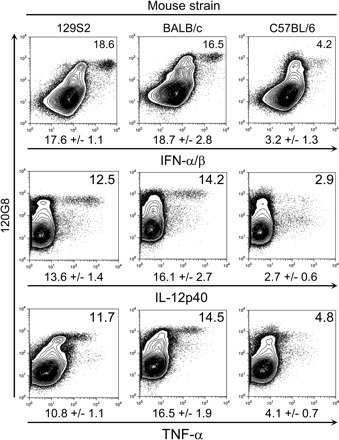
Evaluation of pDC contribution to innate cytokine production in response to the infection with the Perth strain of MCMV in 129S2, BALB/c and C57BL/6 mice. 129S2, BALB/c and C57BL6 mice were infected with MCMV Perth for 36 h. Production of IFN-α/β, IL-12 and TNF-α was analyzed by flow cytometry within total splenic leukocytes. The percent of cytokine+ cells within the pDC gate (120G8high cells) is indicated on each dot plot. Results shown are representative of three mice per group.
Fig. 4.
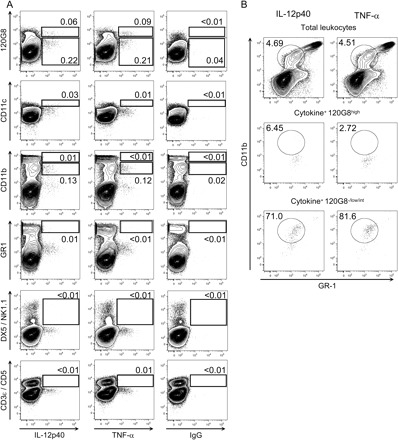
Analysis of different splenic leukocyte populations for IL-12p40 or TNF-α production in C57BL/6 mice. C57BL6 mice were infected with MCMV for 36 h. The expression of IL-12p40 or TNF-α in combination with various cell-surface markers was analyzed by flow cytometry within total splenic leukocytes. (A) Analysis of the co-expression of IL-12p40 or TNF-α with individual cell-surface markers. The number adjacent to each gate corresponds to the percent of the cells from this gate within total splenic leukocytes. (B) Multiparameter analysis of the phenotype of the cytokine+ cells that do not belong to the pDC population. A gate was set on cytokine+120G8−/low/int cells (panel A, upper dot plots) and the co-expression of CD11b and GR-1 was analyzed in this population in comparison to the profile obtained for cytokine+ pDCs (120G8high cells) or for total splenic leukocytes. The number adjacent to the gate corresponds to the percent of GR1lowCD11b+ cells (monocytes/macrophages) within the parent gate.
As a whole, within splenic leukocytes, pDCs appear as the exclusive producers of IFN-α/β in response to infection with two different strains of MCMV, in the three mouse strains studied, at all time points examined, with the limit of the sensitivity of our experimental procedure. pDCs also bear a major contribution to the production of IL-12p40 and TNF-α in 129S2 and BALB/c mice. The higher susceptibility of these strains to MCMV infection as compared to C57BL/6 mice is representative of the behavior of most mouse strains examined so far whether inbred (27) or caught in the wild (28).
pDC activation for IFN-α/β production is organ specific
In addition to the spleen, other organs are major targets of MCMV replication (14) and have been recently documented to contain pDCs (20, 21, 29). Therefore, the production of IFN-α/β by pDCs was measured by flow cytometry in the blood, the bone marrow (BM), the liver, the mesenteric lymph nodes (MLNs) and the lung of 36 h-MCMV-infected BALB/c (Fig. 5A) and C57BL/6 (Fig. 5B) mice. In BALB/c mice, a population of pDCs (120Ghigh cells) was clearly detectable in all the organs analyzed, although with major differences in the frequency of these cells among total leukocytes. While about 11% of pDCs stained strongly for IFN-α/β in the spleen, no IFN-α/β+ pDCs could be detected in the blood, the liver, the MLN or the lung. In contrast, a small but reproducible fraction (∼1%) of BM pDCs stained strongly for IFN-α/β. Similar results were obtained in 129S2 mice (data not shown). In C57BL/6 mice, only splenic pDCs were found to produce detectable levels of IFN-α/β (Fig. 5B). Taken together, these data show a strong compartmentalization of pDC responses to MCMV infection in vivo and a major contribution of splenic pDCs to the systemic release of IFN-α/β.
Fig. 5.
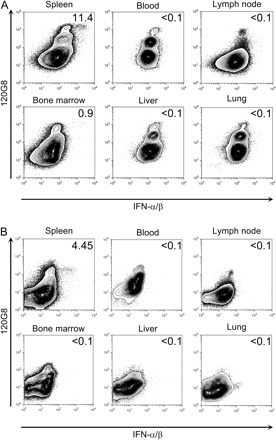
Analysis of pDC contribution to IFN-α/β production in different organs. Total leukocytes from different organs of 36 h-infected (A) BALB/c or (B) C57BL/6 mice were analyzed by flow cytometry for the expression of IFN-α/β. Numbers in dot plots represent the percent of cells that produce the cytokine within total pDCs (120G8high). Results shown are representative of two independent experiments with pools of three mice per experiment.
Immunohistofluorescence studies confirm the major role of pDCs for IFN-α/β production in the spleen early after MCMV infection
The possibility remained that other cells than pDCs may contribute significantly to IFN-α/β production in the spleen, but were overlooked in the intracellular flow cytometry approach due to their exclusion during the isolation of leukocytes. Therefore, immunohistofluorescence analyses for IFN-α/β expression were performed on spleen sections from 36 h-MCMV-infected 129S2 (Fig. 6) and BALB/c (data not shown) mice. As previously reported (30, 31), infected spleens displayed dramatic changes in their structure due to local redistribution of cells and to infiltration of leukocytes from other tissues (Fig. 6A and B). Before infection, pDCs (120G8high) were observed in all the compartments of the spleen with a higher frequency in the red pulp while cDCs (CD11chigh) were found in the marginal zone of the spleen (Fig. 6C, top panels). No specific staining for IFN-α/β was observed in uninfected spleen sections (Fig. 6C, top row), as compared to isotype control signal (Fig. 6C, second row). After MCMV infection, pDCs became even more readily detectable as they migrated to the marginal zone (31) where they constituted clusters of cells strongly stained with 120G8 (Fig. 6C, two bottom rows). A strong, specific, IFN-α/β signal was detected in aggregated pDCs within some of the clusters of 120G8high cells (Fig. 6C, third row, see magnified inset). Additional, weaker, IFN-α/β staining was observed in individual, 120G8−/low cells, which was more difficult to discriminate from background but could suggest some minor contribution of other cell types to the production of the cytokines in the spleen. Thus, these data confirm that pDCs are the major producers of IFN-α/β in the spleen early after MCMV infection.
Fig. 6.
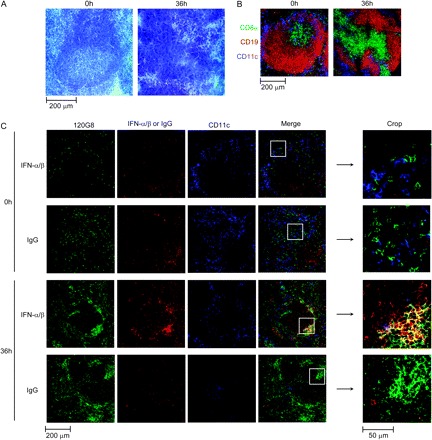
Analysis of DC involvement in IFN-α/β production by immunohistofluorescence on spleen. Spleen sections from 129S2 mice infected or not with MCMV were stained with hematoxylin–eosin (A) or with fluorescent-conjugated antibodies (B) and (C). (A and B) Analysis of the structure of the spleen. (C) Localization of pDCs, cDCs and IFN-α/β. Results shown are representative of three experiments each performed on two different infected spleens. Similar results have been obtained with BALB/c mice.
Altogether, our data have demonstrated the quasi-exclusive role of murine pDCs for IFN-α/β production in vivo early after MCMV infection and the large contribution of these cells to the production of other innate antiviral cytokines including IL-12 and TNF-α. Mouse pDCs have been suggested to encompass different subsets of cells endowed with differential abilities for the secretion of pro-inflammatory versus IFN-α/β cytokines (13). Human pDCs are unable to produce significant amounts of IL-12 (2, 12), in contrast to mouse pDCs (10). In light of these observations, we next sought to determine whether the ability of the global pDC population to simultaneously produce multiple cytokines during MCMV infection resulted from the functional specialization of distinct pDC subsets or whether it reflected the ability of each pDC to mount multiple cytokine responses. To address this question, intracellular stainings were performed for simultaneous detection of IFN-α/β, IL-12p40 and TNF-α in individual pDCs from 129S2 (Fig. 7), BALB/c and C57BL/6 (data not shown)-infected mice. All possible patterns of co-expression of the three cytokines analyzed were observed. A significant proportion of pDCs produced all the three cytokines simultaneously, about 25% of cytokine+ pDCs at 30 h (Fig. 7B) and 8% at 36 h (Fig. 7C). Remarkably, very few pDCs produced TNF-α without producing IFN-α/β. A large proportion of pDCs produced only IL-12p40 at 36 h after infection, consistent with the delayed kinetics of appearance of this cytokine in the serum. The stronger co-expression of IFN-α/β and TNF-α, and the delayed kinetics of IL-12p40 expression, in pDCs during MCMV infection suggests that each pDC is endowed with the ability to produce all the three cytokines analyzed but that differential molecular switches may regulate the expression of each of these cytokines as already suggested in previous studies (32, 33). This interpretation is also supported by the observations reported by others (34, 35) that nude CpG DNA activates cDCs specifically for IL-12p40 production but pDCs also for IFN-α/β and TNF-α, while liposome-encapsulated CpG DNA can induce IFN-α/β in cDCs, due to re-routing of the oligonucleotides to different endosomes with a high retention time.
Fig. 7.
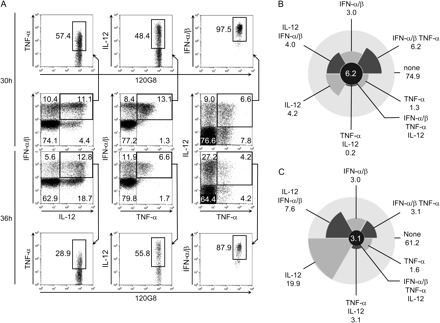
Analysis of innate cytokine co-expression within individual pDCs. 129S2 mice were infected with MCMV Smith for 30 or 36 h. Simultaneous analysis of IFN-α/β, IL-12 and TNF-α production gated on pDCs (120G8high). (A) Dot plot analysis. (B and C) Diagrammatic representation of the different populations of pDCs according to their production of innate cytokines after 30 (B) or 36 h (C) of infection with MCMV Smith. Numbers indicate the percentage of cells that produce the corresponding combination of cytokines within pDCs. These results are representative of at least two independent experiments each with three mice per condition. Similar results have been obtained with BALB/c and C57BL/6 mice.
Discussion
The data presented here demonstrate that pDCs are the quasi-exclusive source of IFN-α/β production during a viral infection in vivo. This conclusion is supported by a set of different, complementary approaches, which allow the examination of cytokine production in a qualitative and quantitative manner ex vivo and in vivo in various cell subsets or in whole tissues. While previous studies have shown that cDCs can produce IFN-α/β in vitro upon infection with MCMV at high molecular infection ratio (8, 17), no other IFN-α/β producing cells than pDCs could be detected in infected animals by flow cytometry or immunohistofluorescence. We cannot completely exclude some participation of cDCs or other infected cells to the production of IFN-α/β in infected animals, which may not be detectable with our techniques. However, it should be noted that IFN-α/β production by infected cells has been shown independent of MyD88 (8), while MyD88-deficient animals show a dramatic decrease in systemic IFN-α/β production (16, 32, 36). Even in 129S2 mice, which produce much higher levels of IFN-α/β than C57BL/6 mice in response to MCMV infection, no significant contribution of cDCs to the production of these cytokines is observed at any of the time points tested (0, 24, 30, 36 and 48 h). Indeed, the percent of IFN-α/β+ cDCs is always <0.1 in 129S2 mice, even at 30 and 36 h when over 10% of the pDCs are expressing IFN-α/β. Moreover, since at 36 h post-infection in C57BL/6 mice, the percent of IFN-α/β+ pDCs is 3.2 ± 1.3%, the percentage of cDCs producing IFN-α/β in 129S2 mice is much lower than the percentage of pDCs producing the cytokines in C57BL/6 animals. Thus, the potential contribution of cells other than pDCs to systemic IFN-α/β production during MCMV infection in vivo is very limited in all the three strains of mice examined. Our data also demonstrate for the first time that pDCs significantly contribute to TNF-α production and confirm their involvement in IL-12 production, early after MCMV infection.
Several reports have documented differences in the ability of pDCs from various organs to produce IFN-α/β in response to TLR triggering (21, 29). However, whether compartmental differences exist in the ability of pDCs to produce IFN-α/β in vivo during viral infection has not been documented. Therefore, we compared pDC activation for cytokine production in various organs known to be major targets of MCMV replication, the lung, the liver and the BM, as well as in the blood and the MLN. Strikingly, our data show that an important fraction of pDCs producing high levels of IFN-α/β is detected only in the spleen, while a much weaker production can be seen in the BM of BALB/c or 129/S2 mice, and no cells positive for the cytokines were observed in the lung, liver, blood or MLN. Therefore, our data document a compartmentalization of pDC responses to MCMV infection and demonstrate that high local viral replication is not sufficient to trigger IFN-α/β production in these cells, with the major contribution of spleen pDCs to the systemic production of the cytokines contrasting strongly with the lack of detectable production in the lung or in the liver. The failure of lung pDCs to respond to MCMV infection could in part be explained by their reported lack of expression of TLR9 (21). In contrast, pDCs isolated from blood (37) or liver (29) have been shown able to respond to TLR9 triggering in vitro, such that the mechanisms for their lack of responses to MCMV infection in vivo are unknown and will require further investigations.
To analyze the ability of individual pDCs to produce multiple cytokines, we developed a protocol for simultaneous intracellular detection of IFN-α/β, IL-12p40 and TNF-α by flow cytometry. A significant proportion of pDCs was shown to produce the three cytokines at the same time, although all patterns of co-expression of the cytokines were observed. Thus, no simple, discrete, subpopulations of pDCs specialized in the production of particular arrays of cytokines could be observed. Thus, the variations in individual pDC responses more likely occur as a result of quantitative changes in their differentiation status or activation kinetics as opposed to qualitative differences in their lineage origin. It should be noted that IFN-α/β and TNF-α appeared more strongly co-expressed together than with IL-12, suggesting the existence of differential molecular mechanisms of control of the expression of these cytokines as compared to IL-12 as suggested in previous reports (32, 33). Indeed, it has been shown that the IRF-7/MyD88-dependent pathway necessary for pDC IFN-α/β production is activated in early endosomes (34, 35), while pDC IL-12 production may occur downstream of the IRF5/TRAF-6/MyD88 pathway which is triggered in late endosomes (38). In this regard, it is interesting to notice that human pDCs, which produce both IFN-α/β and TNF-α but not IL-12 (12) in response to TLR7/9 triggering, express much lower levels of IRF-5 that their murine counterparts or than cDCs (SHR and MD, unpublished data). Thus, MCMV DNA might activate TLR9 in mouse pDCs simultaneously in early endosomes for IRF7-dependent IFN-α/β and TNF-α production and in late endosome for IRF5-dependent IL-12 production.
Taken together, these results show a broad and central role of pDCs in early innate detection of, and defense against, MCMV infection. The data also suggest differences in the molecular requirements for pDC production of various cytokines and in the responsiveness of pDCs from different tissues. These observations need to be taken into account when designing innovative vaccination strategies aimed at harnessing the antiviral functions of pDCs.
Funding
Centre National de la Recherche Scientifique (CNRS; Action Thématique Incitative sur Programme (ATIP) grant); the Association pour la Recherche sur le Cancer; the Réseau National des Génopoles to M.D; the Ministère de l'Enseignement Supérieur, de la Recherche et des Techniques (to N.Z.); the CNRS, the Fondation pour la Recherche Médicale and the Philippe Foundation (to S.H.R.); the Institut National de la Santé et de la Recherche Médicale, the CNRS and the Université de la Méditerranée (to Centre d'Immunologie de Marseille-Luminy).
Acknowledgments
We thank the staff of the animal care facilities and the flow cytometry core facility of the Centre d'Immunologie de Marseille-Luminy for excellent assistance. The authors acknowledge the technical support of the histological plateform RIO/Marseille-Nice Genopole®.
Glossary
Abbreviations
- BM
bone marrow
- cDC
conventional dendritic cell
- MLN
mesenteric lymph node
- MCMV
murine cytomegalovirus
- PFU
plaque-forming unit
- pDC
plasmacytoid dendritic cell
- RT
reverse transcription
- TNF
tumor necrosis factor
References
- 1.Biron CA. Interferons α and β as immune regulators—a new look. Immunity. 2001;14:661. doi: 10.1016/s1074-7613(01)00154-6. [DOI] [PubMed] [Google Scholar]
- 2.Liu YJ. IPC: professional type 1 interferon-producing cells and plasmacytoid dendritic cell precursors. Annu. Rev. Immunol. 2005;23:275. doi: 10.1146/annurev.immunol.23.021704.115633. [DOI] [PubMed] [Google Scholar]
- 3.Wang H, Peters N, Schwarze J. Plasmacytoid dendritic cells limit viral replication, pulmonary inflammation, and airway hyperresponsiveness in respiratory syncytial virus infection. J. Immunol. 2006;177:6263. doi: 10.4049/jimmunol.177.9.6263. [DOI] [PubMed] [Google Scholar]
- 4.Cervantes-Barragan L, Zust R, Weber F, et al. Control of coronavirus infection through plasmacytoid dendritic-cell-derived type I interferon. Blood. 2007;109:1131. doi: 10.1182/blood-2006-05-023770. [DOI] [PMC free article] [PubMed] [Google Scholar]
- 5.Smit JJ, Rudd BD, Lukacs NW. Plasmacytoid dendritic cells inhibit pulmonary immunopathology and promote clearance of respiratory syncytial virus. J. Exp. Med. 2006;203:1153. doi: 10.1084/jem.20052359. [DOI] [PMC free article] [PubMed] [Google Scholar]
- 6.Lim WH, Kireta S, Russ GR, Coates PT. Human plasmacytoid dendritic cells regulate immune responses to Epstein-Barr virus (EBV) infection and delay EBV-related mortality in humanized NOD-SCID mice. Blood. 2007;109:1043. doi: 10.1182/blood-2005-12-024802. [DOI] [PubMed] [Google Scholar]
- 7.Diebold SS, Montoya M, Unger H, et al. Viral infection switches non-plasmacytoid dendritic cells into high interferon producers. Nature. 2003;424:324. doi: 10.1038/nature01783. [DOI] [PubMed] [Google Scholar]
- 8.Andoniou CE, van Dommelen SL, Voigt V, et al. Interaction between conventional dendritic cells and natural killer cells is integral to the activation of effective antiviral immunity. Nat. Immunol. 2005;6:1011. doi: 10.1038/ni1244. [DOI] [PubMed] [Google Scholar]
- 9.Dalod M, Hamilton T, Salomon R, et al. Dendritic cell responses to early murine cytomegalovirus infection: subset functional specialization and differential regulation by interferon alpha/beta. J. Exp. Med. 2003;197:885. doi: 10.1084/jem.20021522. [DOI] [PMC free article] [PubMed] [Google Scholar]
- 10.Dalod M, Salazar-Mather TP, Malmgaard L, et al. Interferon alpha/beta and interleukin 12 responses to viral infections: pathways regulating dendritic cell cytokine expression in vivo. J. Exp. Med. 2002;195:517. doi: 10.1084/jem.20011672. [DOI] [PMC free article] [PubMed] [Google Scholar]
- 11.Degli-Esposti MA, Smyth MJ. Close encounters of different kinds: dendritic cells and NK cells take centre stage. Nat. Rev. Immunol. 2005;5:112. doi: 10.1038/nri1549. [DOI] [PubMed] [Google Scholar]
- 12.Ito T, Kanzler H, Duramad O, Cao W, Liu YJ. Specialization, kinetics, and repertoire of type 1 interferon responses by human plasmacytoid predendritic cells. Blood. 2006;107:2423. doi: 10.1182/blood-2005-07-2709. [DOI] [PubMed] [Google Scholar]
- 13.Pelayo R, Hirose J, Huang J, et al. Derivation of 2 categories of plasmacytoid dendritic cells in murine bone marrow. Blood. 2005;105:4407. doi: 10.1182/blood-2004-07-2529. [DOI] [PMC free article] [PubMed] [Google Scholar]
- 14.Krmpotic A, Bubic I, Polic B, Lucin P, Jonjic S. Pathogenesis of murine cytomegalovirus infection. Microbes Infect. 2003;5:1263. doi: 10.1016/j.micinf.2003.09.007. [DOI] [PubMed] [Google Scholar]
- 15.Asselin-Paturel C, Boonstra A, Dalod M, et al. Mouse type I IFN-producing cells are immature APCs with plasmacytoid morphology. Nat. Immunol. 2001;2:1144. doi: 10.1038/ni736. [DOI] [PubMed] [Google Scholar]
- 16.Krug A, French AR, Barchet W, et al. TLR9-dependent recognition of MCMV by IPC and DC generates coordinated cytokine responses that activate antiviral NK cell function. Immunity. 2004;21:107. doi: 10.1016/j.immuni.2004.06.007. [DOI] [PubMed] [Google Scholar]
- 17.Bozza S, Bistoni F, Gaziano R, et al. Pentraxin 3 protects from MCMV infection and reactivation through TLR sensing pathways leading to IRF3 activation. Blood. 2006;108:3387. doi: 10.1182/blood-2006-03-009266. [DOI] [PubMed] [Google Scholar]
- 18.Blasius AL, Giurisato E, Cella M, Schreiber RD, Shaw AS, Colonna M. Bone marrow stromal cell antigen 2 is a specific marker of type I IFN-producing cells in the naive mouse, but a promiscuous cell surface antigen following IFN stimulation. J. Immunol. 2006;177:3260. doi: 10.4049/jimmunol.177.5.3260. [DOI] [PubMed] [Google Scholar]
- 19.van Dommelen SL, Sumaria N, Schreiber RD, Scalzo AA, Smyth MJ, Degli-Esposti MA. Perforin and granzymes have distinct roles in defensive immunity and immunopathology. Immunity. 2006;25:835. doi: 10.1016/j.immuni.2006.09.010. [DOI] [PubMed] [Google Scholar]
- 20.Asselin-Paturel C, Brizard G, Pin JJ, Briere F, Trinchieri G. Mouse strain differences in plasmacytoid dendritic cell frequency and function revealed by a novel monoclonal antibody. J. Immunol. 2003;171:6466. doi: 10.4049/jimmunol.171.12.6466. [DOI] [PubMed] [Google Scholar]
- 21.Chen L, Arora M, Yarlagadda M, et al. Distinct responses of lung and spleen dendritic cells to the TLR9 agonist CpG oligodeoxynucleotide. J. Immunol. 2006;177:2373. doi: 10.4049/jimmunol.177.4.2373. [DOI] [PubMed] [Google Scholar]
- 22.Wesley JD, Robbins SH, Sidobre S, Kronenberg M, Terrizzi S, Brossay L. Cutting edge: IFN-gamma signaling to macrophages is required for optimal Valpha14i NK T/NK cell cross-talk. J. Immunol. 2005;174:3864. doi: 10.4049/jimmunol.174.7.3864. [DOI] [PubMed] [Google Scholar]
- 23.Ruzek MC, Miller AH, Opal SM, Pearce BD, Biron CA. Characterization of early cytokine responses and an interleukin (IL)-6-dependent pathway of endogenous glucocorticoid induction during murine cytomegalovirus infection. J. Exp. Med. 1997;185:1185. doi: 10.1084/jem.185.7.1185. [DOI] [PMC free article] [PubMed] [Google Scholar]
- 24.Blasius AL, Cella M, Maldonado J, Takai T, Colonna M. Siglec-H is an IPC-specific receptor that modulates type I IFN secretion through DAP12. Blood. 2006;107:2474. doi: 10.1182/blood-2005-09-3746. [DOI] [PMC free article] [PubMed] [Google Scholar]
- 25.Zhang J, Raper A, Sugita N, et al. Characterization of Siglec-H as a novel endocytic receptor expressed on murine plasmacytoid dendritic cell precursors. Blood. 2006;107:3600. doi: 10.1182/blood-2005-09-3842. [DOI] [PubMed] [Google Scholar]
- 26.Lagasse E, Weissman IL. Flow cytometric identification of murine neutrophils and monocytes. J. Immunol. Methods. 1996;197:139. doi: 10.1016/0022-1759(96)00138-x. [DOI] [PubMed] [Google Scholar]
- 27.Lee SH, Gitas J, Zafer A, et al. Haplotype mapping indicates two independent origins for the Cmv1s susceptibility allele to cytomegalovirus infection and refines its localization within the Ly49 cluster. Immunogenetics. 2001;53:501. doi: 10.1007/s002510100359. [DOI] [PubMed] [Google Scholar]
- 28.Scalzo AA, Manzur M, Forbes CA, Brown MG, Shellam GR. NK gene complex haplotype variability and host resistance alleles to murine cytomegalovirus in wild mouse populations. Immunol. Cell Biol. 2005;83:144. doi: 10.1111/j.1440-1711.2005.01311.x. [DOI] [PubMed] [Google Scholar]
- 29.Jomantaite I, Dikopoulos N, Kroger A, et al. Hepatic dendritic cell subsets in the mouse. Eur. J. Immunol. 2004;34:355. doi: 10.1002/eji.200324336. [DOI] [PubMed] [Google Scholar]
- 30.Ishikawa R, Biron CA. IFN induction and associated changes in splenic leukocyte distribution. J. Immunol. 1993;150:3713. [PubMed] [Google Scholar]
- 31.Asselin-Paturel C, Brizard G, Chemin K, et al. Type I interferon dependence of plasmacytoid dendritic cell activation and migration. J. Exp. Med. 2005;201:1157. doi: 10.1084/jem.20041930. [DOI] [PMC free article] [PubMed] [Google Scholar]
- 32.Delale T, Paquin A, Asselin-Paturel C, et al. MyD88-dependent and -independent murine cytomegalovirus sensing for IFN-alpha release and initiation of immune responses in vivo. J. Immunol. 2005;175:6723. doi: 10.4049/jimmunol.175.10.6723. [DOI] [PubMed] [Google Scholar]
- 33.Sjolin H, Robbins SH, Bessou G, et al. DAP12 signaling regulates plasmacytoid dendritic cell homeostasis and down modulates their function during viral infection. J. Immunol. 2006;177:2908. doi: 10.4049/jimmunol.177.5.2908. [DOI] [PubMed] [Google Scholar]
- 34.Honda K, Ohba Y, Yanai H, et al. Spatiotemporal regulation of MyD88-IRF-7 signalling for robust type-I interferon induction. Nature. 2005;434:1035. doi: 10.1038/nature03547. [DOI] [PubMed] [Google Scholar]
- 35.Guiducci C, Ott G, Chan JH, et al. Properties regulating the nature of the plasmacytoid dendritic cell response to Toll-like receptor 9 activation. J. Exp. Med. 2006;203:1999. doi: 10.1084/jem.20060401. [DOI] [PMC free article] [PubMed] [Google Scholar]
- 36.Tabeta K, Georgel P, Janssen E, et al. Toll-like receptors 9 and 3 as essential components of innate immune defense against mouse cytomegalovirus infection. Proc. Natl Acad. Sci. USA. 2004;101:3516. doi: 10.1073/pnas.0400525101. [DOI] [PMC free article] [PubMed] [Google Scholar]
- 37.O'Keeffe M, Hochrein H, Vremec D, et al. Dendritic cell precursor populations of mouse blood: identification of the murine homologues of human blood plasmacytoid pre-DC2 and CD11c+ DC1 precursors. Blood. 2003;101:1453. doi: 10.1182/blood-2002-03-0974. [DOI] [PubMed] [Google Scholar]
- 38.Takaoka A, Yanai H, Kondo S, et al. Integral role of IRF-5 in the gene induction programme activated by Toll-like receptors. Nature. 2005;434:243. doi: 10.1038/nature03308. [DOI] [PubMed] [Google Scholar]