Abstract
Background. In evaluating a photochemical treatment process for inactivating parvovirus B19, there lacked simple culture methods to measure infectivity. The recently developed enzyme‐linked immunospot (ELISpot) infectivity assay uses late‐stage erythropoietic progenitor cells and is labor intensive and time consuming. We evaluated a novel, efficient polymerase chain reaction (PCR) inhibition assay and examined correlations with reductions in infectivity.
Methods. Contaminated plasma was treated with 150 μmol/L amotosalen and 3 J/cm2 ultraviolet A light and then tested for DNA modification using conventional PCR inhibition and a novel preamplification approach. The novel assay subjected the samples to preamplification cycles using long‐template PCR, followed by quantitative PCR (QPCR) inhibition detection. Both approaches were tested for correlations with reductions in viral infectivity by comparing ELISpot assay results of identical samples.
Results. The B19 preamplification inhibition assay showed detection ranges of 2–2.5 log and demonstrated quantitative correlation with up to a 5.8‐log reduction in viral infectivity in ELISpot results. Conventional PCR detected a >5 log reduction in amplification, correlated with a 4.4‐log reduction in viral infectivity. A range of 4‐log inhibition of hepatitis B virus DNA amplification was also achieved.
Conclusions. The results demonstrated that a novel preamplification QPCR assay is a useful tool for predicting reductions in infectivity after photochemical treatment. This assay was extended to show utility in circumstances where practical in vitro assays are unavailable for the determination of the efficacy of pathogen inactivation.
Human parvovirus B19 (B19), a nonenveloped, single‐stranded DNA virus, can be transmitted primarily through the respiratory route but also by blood‐component transfusion [1, 2]. Transfusion‐transmitted B19 infections in immunocompetent individuals are clinically mild, asymptomatic, and persistent [3]. However, B19 infection causes more serious diseases, such as acute and chronic anemia, in immunocompromised patients and fetal hydrops and spontaneous abortion in pregnant women; it can also provoke persistent complications in patients with hematological problems that required them to initially receive blood transfusions [4, 5]. The risk of B19 transmission by transfusion is increased by seasonally high viral titers in infected donors, donation pooling, and viral resistance to current inactivation methods.
In current blood‐safety practice, B19 screening of donations is not routine, and no US Food and Drug Administration requirements are in place. An estimated >70% of the adult population is seropositive for B19 [6], making the screening and discarding of B19‐positive blood products impractical. At present, the pathogen‐inactivation methods that have been implemented are ineffective against this highly resilient virus [7, 8]. B19 withstands virucidal processes of heat denaturation [9] and solvent‐detergent treatments [10], which are effective only against lipid‐enveloped viruses. To prevent transfusion‐transmitted B19 infection, a new pathogen‐inactivation method capable of penetrating its tight capsid and inhibiting its replicative function is required.
The INTERCEPT Blood System, a photochemical treatment (PCT) process that uses amotosalen‐HCl and UV A light (UVA), has been developed for the inactivation of viruses, bacteria, protozoa, and leukocytes in platelets and plasma for transfusion [11–13 ]. The inactivation mechanism combines the nucleic acid–intercalating property of amotosalen with its cross‐linking capabilities after UVA activation to eliminate the replicative function of treated pathogens. PCT has been shown to inactivate a broad spectrum of viruses, bacteria, parasites, and white blood cells and create safer blood‐transfusion products [11, 12, 14–20 ].
In studying the efficacy of the inactivation of B19 by PCT, an efficient, straightforward, in vitro assay correlating with infectivity was lacking. Present assays for determining the inactivation of B19 are limited and vary in sensitivity and detection ability. For instance, genome equivalence (gEq) methods measure only a small portion of the viral genome via polymerase chain reaction (PCR) to determine the gEq titer. An incomplete or altered viral particle, although rendered noninfectious, could potentially result as a positive gEq and artificially increase the viral titer. If available, the use of full‐length genome PCR primers would remedy the problem; however, PCR is not quantitative. Biological assays, although able to measure infectious titers, are time consuming, labor intensive, and limited by assay volume. Taking into consideration the shortcomings of each assay, we have developed a new quantitative PCR (QPCR) test of viral replicative function to demonstrate the effectiveness of PCT against B19. Rather than measuring the relative presence of parent DNA, the assay measures the replicative ability of the inactivated parent DNA by comparing similarly preamplified untreated and treated viral preparations using QPCR. An inhibition of preamplification to the level of baseline control would demonstrate complete inactivation of the virus. This assay is easy and simple to perform and demonstrates a strong correlation with infectivity. In combination, the results from an infectivity assay, full‐length PCR amplification, and our novel assay of preamplification and QPCR demonstrated 5–6 log of B19 inactivation by PCT. Furthermore, the QPCR assay using preamplification PCR inhibition can be applied to future investigations of pathogen inactivation.
Materials and Methods
Materials. B19‐infected plasma [21] was obtained from Grifols and Baxter, and hepatitis B virus (HBV)–infected plasma samples were collected from Komfo Anokye Teaching Hospital (Kumasi, Ghana), as reported elsewhere [22]. PCR reagents were obtained from Applied Biosystems unless otherwise noted.
Preparation of samples. Untreated, infected samples were used as controls. Infected platelet concentrates were created by resuspending platelets in B19‐infected plasma before PCT. PCT for both platelets and plasma was performed using the conditions used by the INTERCEPT Blood System (Baxter Healthcare). Briefly, platelets or plasma were treated with 150 μmol/L amotosalen 3 J/cm2 UVA [11, 12].
Viral DNA extraction. For the preamplification inhibition assay, viral DNA was extracted from 200 μL of plasma using the High Pure viral nucleic acid kit (Roche Diagnostics) in accordance with the manufacturer’s instructions. For samples with high viral loads, dilution using virus‐negative plasma was performed before extraction, so that the final concentration of nucleic acid was within the dynamic range of QPCR studies.
Semiquantitative PCR. B19 DNA was extracted from infected plasma and excised with restriction enzymes XhoI and KpnI, which resulted in a 4760‐bp fragment devoid of the viral inverted‐repeat regions, and inserted into a pBluescriptII SK(+) plasmid (2900 bp). The resulting plasmid was 7.7 kb in size. A solution with 10 log copies/μL was used as the stock solution.
Analysis was performed for both control and PCT‐treated samples. Primer sequences amplifying a 4.3‐kb B19 template were as follows: B19 (nt 892–5213) forward, 5′‐CCAGAAACCTCACAGTGTG‐3′ and B19 (nt 892–5213) reverse, 5′‐TTAAAGCGCAACAACATAATTTT‐3′. The 25‐μL reaction contained 1× PCR buffer, 200 μmol/L dNTPs, 3 mmol/L MgCl2, 1 μmol/L each primer, 5% dimethyl sulfoxide, 2 μL of DNA template, and 0.1 U/μL Taq DNA polymerase. PCR parameters were 5 min at 95°C; 35 cycles of 30 s at 95°C, 30 s at 55°C, and 5 min at 72°C; and 10 min at 72°C.
Preamplification of B19 and HBV. Preamplification was performed for both control and PCT‐treated samples. Viral DNA was amplified using primers spanning regions sufficiently conserved across the 3 genotypes of B19: B19 forward (5300 bp), 5′‐CCGGAATTCGACGTCACAGGAAATGACG‐3′ and B19 reverse (5300 bp), 5′‐CCGGAATTCGACGTCACAGGAAATGAC‐3′; B19 (nt 1765–4776) forward, 5′‐ACACGGCTTTTGGCAGTC‐3′ and B19 (nt 1765–4776) reverse, 5′‐CACTATGAAAACTGGGCAATAAAC‐3′; B19 (nt 1765–2691) forward, 5′‐CCAGGCTTGTGTAAGTCTTC‐3′ and B19 (nt 1765–2691) reverse, 5′‐CACTATGAAAACTGGGCAATAAAC‐3′; B19 (nt 1765–2009) forward, 5′‐GAGGAAACTGTGCTTCCGACA‐3′ and B19 (nt 1765–2009) reverse, 5′‐CACTATGAAAACTGGGCAATAAAC‐3′; HBV forward (3200 bp), 5′‐CGTCAGCAAACACTTGGC‐3′ and HBV reverse (3200 bp), 5′‐ AAAAAGTTGCATGGTGCTGG‐3′; HBV (nt 2750–3200) forward, 5′‐ACATACTCTTTGGAAGGCKG‐3′ and HBV (nt 2750–3200) reverse, 5′‐ CGTCAGCAAACACTTGGC‐3′; and HBV (nt 495,215–710) forward, 5′‐TTGTTGACAAGAATCCTCACAATACC‐3′ and HBV (nt 215–710,495) reverse, 5′‐GCCCTACGAACCACTGAACAAATGG‐3′.
The 50‐μL PCR mixture contained PCR buffer II: 2.5 mmol/L MgCl2, 0.3 mmol/L dNTPs, 0.8 μmol/L each primer, and 2 U of AmpliTaq DNA polymerase. Then, 10 μL of template DNA that contained 102–106 copies/mL was used for each reaction.
B19 PCR parameters. For the 5300‐bp PCR, after an initial incubation for 5 min at 94°C, 20 cycles of 30 s at 94°C, 45 s at 52°C, and 5.5 min at 72°C, followed by 10 cycles of 30 s at 94°C, 45 s at 52°C, and 6 min at 72°C were performed. For PCRs generating 3011 bp, 16 cycles of 30 s at 94°C, 45 s at 52°C, and 3 min at 72°C were used; for those generating 926 bp, 10 cycles of 30 s at 94°C, 45 s at 55°C, and 1 min at 72°C were used; for those generating 244 bp, 8 cycles of 30 s at 94°C, 45 s at 55°C, and 1 min at 72°C were performed. All PCRs were followed by incubation for 7 min at 72°C.
HBV PCR parameters. For the 3200‐bp PCR, after the initial 5‐min incubation at 94°C, 22 cycles of preamplification were applied for 40 s at 40°C, 1.5 min at 60°C, and 3 min at 72°C, with a 2‐min increment every 10 cycles (final step, 7 min). For the reaction generating the 1642‐bp amplicon, the same conditions were applied for 16 cycles without a time increment, and, for the 495‐bp amplicon, 14 cycles of preamplification were applied.
QPCR conditions for B19 and HBV. After preamplification, the samples were quantified in terms of international units per milliliter using real‐time PCR. Viral DNA was quantified using MX4000/MX3000 multiplex QPCR systems (Stratagene) and a Taqman‐based technology. The method has been described elsewhere [23]. Primers for B19 QPCR (100 bp) were designed on the basis of sequences within the NS1 gene. Primers for HBV QPCR (80 bp) were B19 (nt 1909–2009) forward, 5′‐CTCATCACTCCAGGCGC‐3′, B19 (nt 1909–2009) reverse, 5′‐GAGGAAACTGTGCTTCCGACA‐3′, and B19 Taqman probe, 5′‐TCCCCGGGACCAGTTCAGGAGAAT‐3′; and HBV (nt 321–401) forward, 5′‐CATAAGAGGACTCTTGGACT‐3′, HBV (nt 321–401) reverse, 5′‐AATGTCAACGACCGACCTT‐3′, and HBV Taqman probe, 5′‐TCCTCCAATTTGTCCTGGTTATCGCT‐3′. The fluorogenic probe was 5′‐labeled with VIC (Applied Biosystems) and 3′‐labeled with 6‐carboxy‐tetramethyl‐rhodamine. Amplification was performed in duplicate using a Brilliant QPCR core reagent kit (Stratagene) in accordance with the manufacturer’s instructions. After an initial incubation for 10 min at 95°C, 40 cycles of 1 min at 60°C and 30 s at 95°C were performed for B19. Duplicates of 10‐fold serial dilutions of the First International Standard for Parvovirus B19 DNA NAT assays 99/800 (National Institute of Biological Standards and Controls [NIBSC]), 2–20,000 IU of B19 genome/reaction, were used as a reference curve for quantification. HBV QPCR was performed for 45 cycles. Standards for quantification, in international units per milliliter, were from NIBSC. Four serial 10‐fold dilutions made up the reference curve.
Enzyme‐linked immunospot (ELISpot) assay for the determination of B19 infectivity. B19‐infected plasma or platelets were evaluated for infectivity as described elsewhere [21]. Briefly, viable virus titers were determined by infection of CD34+ cells (All Cells). CD34+ cells were induced to differentiate into CD36+ cells and infected with serially diluted control or PCT samples and transferred to ELISpot plates coated with polyclonal antibodies to B19 proteins (Dako). ELISpot plates were incubated for 72–96 h, and cells were washed. Bound B19 antigens were detected and developed with silver staining for visual or plate reader counting.
Data analysis. For ELISpot assays, the observed viral infectivity titer was used to calculate the log number of inactivated virus after PCT. Spot‐forming units were calculated as follows: the total number of spots observed in all wells divided by the dilution and then divided by the volume of material plated at that dilution. Log reductions were analyzed as log (control/treated).
Results
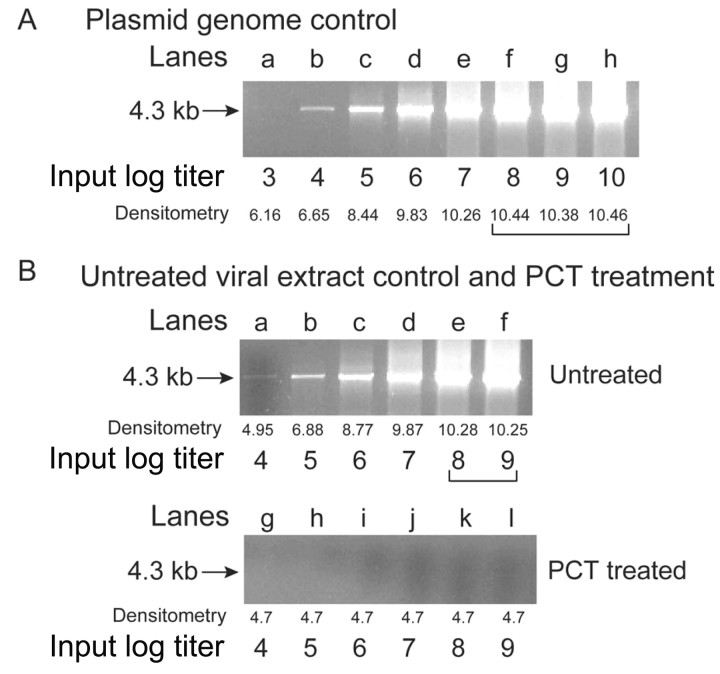
In vitro efficacy of pathogen inactivation demonstrated by semiquantitative PCR of B19. To determine the extent of PCR inhibition of B19 as a result of photochemical treatment with amotosalen (150 μmol/L) and UVA (3.0 J/cm2 dose) (PCT), semiquantitative PCR was used to establish detection sensitivity and to measure the effectiveness of PCT (figure 1). This PCR approach applied conditions for the amplification of a nucleic‐acid fragment long enough (a 4.3‐kb amplicon) to detect modification of the viral genome caused by PCT up to a range of sensitivity of 5 log. For accuracy, 2 different standards were used to demonstrate the assay range, with both standards subjected to amplification of the same long amplicon used to detect the post‐PCT PCR product. Densitometry of the bands showed the correlation between band intensity and the concentration of amplifiable B19 template.
Figure 1. .
Parvovirus B19 (B19) polymerase chain reaction (PCR) inhibition after photochemical treatment (PCT) with amotosalen and UV A light. Electrophoresis in an agarose gel (1%) containing ethidium bromide at 0.5 g/mL was used to visualize the 4.3‐kb PCR product of the amplified B19 genome (arrow). Log titers are shown below the gel with the corresponding integrated density of the band. A, PCRs using serial 10‐fold dilutions of a plasmid containing the B19 genome. A 5‐log range of detection by densitometry is seen. The log titer was calculated on the basis of DNA concentrations as determined by spectrophotometry. B, PCRs using serial 10‐fold dilution of untreated viral extracts for lanes a–f. Stock titer (1010 genome equivalents/mL) of untreated controls were determined by quantitative PCR assay (244 bp). The PCR sensitivity for the 4.3‐kb amplicon was lower, and only a 4‐log range of detection by densitometry was seen. However, inactivation was demonstrated with the highest titrated sample after PCT to the limit of detection.
In figure 1A, the standard was based on PCR of 10‐fold increasing input titers of a B19 genome plasmid. The B19 plasmid encodes the entire genome minus the inverted‐repeat regions. On the basis of this standard, the lower limit sensitivity of the assay was 4 log copies, as demonstrated by detection of an amplified B19 band at an input titer of 4 log copies (figure 1A, lane b). As the densitometry of the DNA gel shows, the amplified signal became stronger with increasing amounts of input until it reached a plateau after an input titer of 8 log (figure 1A, lane f). The higher input titers of 9 or 10 log did not result in an increase in the densitometry of the DNA band, compared with the 8‐log input band (figure 1A, lanes g and h), which demonstrated a 5‐log linear dynamic range (figure 1A, lanes a–f).
To corroborate the log range shown by the B19 plasmid, the relative range of detection was also demonstrated using untreated viral extracts shown in 10‐fold increasing input titers (figure 1B). The lowest concentration detected corresponded to an input titer of 4 log. The same viral extracts were subjected to PCT, to assess its effect on B19 amplification. In figure 1B, lanes a–f show, untreated viral extract that, when compared with lanes g‐l (with lane l depicting undiluted PCT viral extract), demonstrate that PCT causes complete PCR inhibition. There were no detectable bands in the PCT lanes after amplification, which demonstrated a >5‐log reduction in the 4.3‐kb genome.
Modified real‐time PCR assay for a quantitative method of measuring PCR inhibition by PCT. The conventional PCR approach demonstrated a comparative method of detecting changes in the signal amplification of viral samples treated with PCT versus untreated control samples, but it lacked quantitative analysis. For the measurement of PCR inhibition by PCT, conventional real‐time QPCR has been unsuccessful because of the inability of the assay to support long amplicons. A modified approach involving preamplification with a large PCR product followed by QPCR with a short amplicon was developed for detecting the inactivation of B19 by PCT. The purpose was to combine the use of a long‐template PCR amplicon to accurately detect whether DNA adducts had formed in the viral genome with a quantitative method, to compare the difference between untreated and PCT samples.
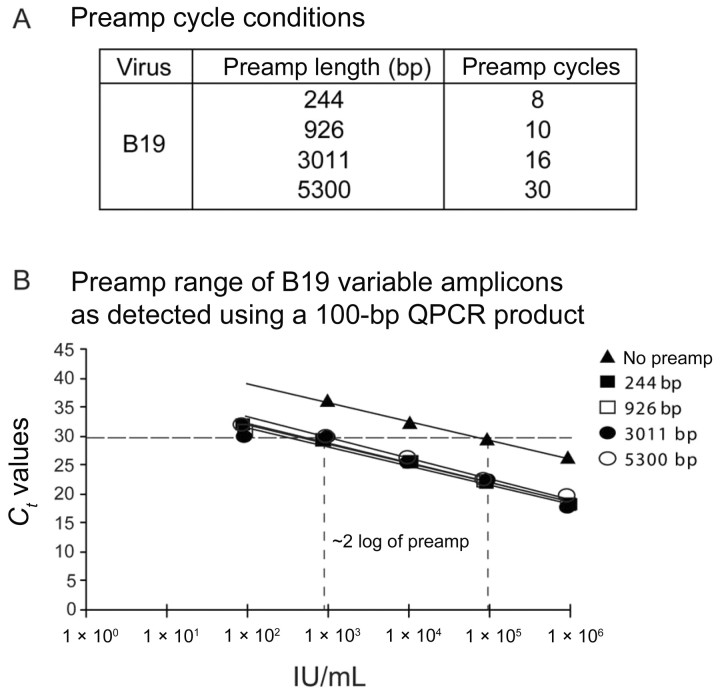
Figure 2A lists the preamplification conditions according to amplicon size and cycle number. The preamplification PCR conditions of several amplicon lengths varying from 244 bp to 5.3 kb were adjusted to generate equal amounts of final PCR product as measured using the short QPCR amplicon (100 bp). The QPCR standard curves of each preamplification product demonstrated the accurate normalization of the preamplification conditions and compared the preamplification controls with the QPCR baseline control that had no preamplification (figure 2B). This shows that, in the case of B19, the preamplification conditions created a 2‐log range of preamplification, compared with the baseline control.
Figure 2. .
Preamplification conditions before quantitative polymerase chain reaction (QPCR) and range of detection for the inhibition of parvovirus B19 (B19) amplification in plasma. A, No. of cycles used for preamplification (preamp) for each respective amplicon length. The longer the amplicon, the more cycles were needed to generate the same no. of copies. B, Validation of assay and determination of log‐range sensitivity. QPCR was performed after the preamp of controls, to determine the log range of the assay and to confirm the equal amount of DNA product produced with each preamplification condition. Those with no preamp were not subjected to preamp and constituted the baseline control, consisting of only QPCR with a 100‐bp amplicon. The preamp products of each amplicon length showed a 2‐log range of amplification, which is the range within which one detects inhibition by photochemical treatment. The preamplification control products have been equalized to the same no. of copies after PCR. Ct, cycle threshold.
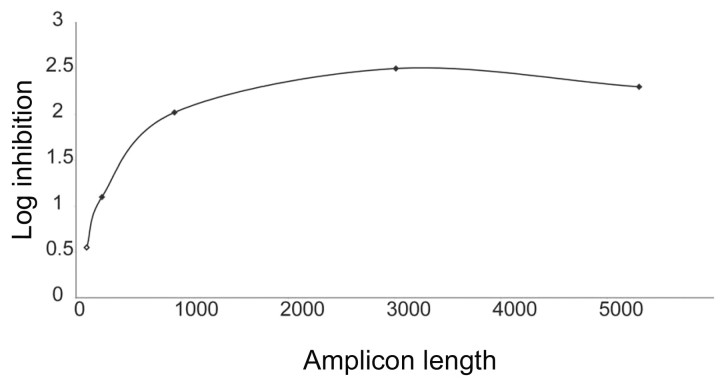
PCR amplification of B19 in plasma inhibited by PCT. The B19 preamplification QPCR assay detected inhibition of viral amplification by PCT to the limit of detection (figure 3). The log inhibition of amplification increased with longer amplicons, demonstrating the need for a preamplification step with amplicons of ⩾3 kb to detect the maximum effect of PCT. The 3‐ and 5‐kb amplicons were comparable in the evaluation of PCT inactivation of B19. The DNA modifications of the B19 genome caused by PCT correlated with viral replicative function and demonstrated a quantitative approach to measuring pathogen inactivation.
Figure 3. .
Photochemical treatment (PCT) inhibition of parvovirus B19 (B19) amplification in plasma using a preamplification quantitative polymerase chain reaction assay. Log inhibition is graphed according to amplicon length of preamplification. With increasing preamplification amplicon length, the greater the amount of log inhibition is detected. An amplicon length of >3 kb was required to detect the full log inhibition in this assay.
Increased efficacy of amotosalen in B19‐contaminated plas ma after preincubation. B19 is a nonenveloped virus, and preincubation of the virus with amotosalen could increase drug exposure and availability of the viral genome. A time course of increasing incubation periods with amotosalen before UVA illumination showed that the log inhibition of amplification and reductions in infectivity could be improved with longer preincubation (figure 4A).
Figure 4. .
Preincubation of parvovirus B19 (B19)–contaminated plasma with amotosalen before UV A light (UVA) illumination. This increased viral inactivation, as shown using the preamplification polymerase chain reaction (PCR) and enzyme‐linked immunospot (ELISpot) assays. A, Log inhibition of B19 with increasing exposure time to amotosalen before UVA treatment. The preamplification PCR log inhibition results were averaged from results using 3‐ and 5‐kb preamplification amplicons. The same samples were subjected to ELISpot to measure the log reduction in infectivity. B, The strong correlation between preamplification PCR assay and ELISpot as represented by direct plotting of results from both assays and calculation of R2 values.
Correlation of PCR inhibition with infectivity as a measure of pathogen inactivation. To further illustrate the correlation, the results of the 2 assays were plotted against each other in figure 4B. The R2 of 0.9398 for the graph illustrates a strong correlation of the results and shows the potential of using the preamplification QPCR assay to extrapolate the reduction in viral infectivity. For example, using these assays, a log inhibition of ∼2.3 as measured by QPCR inhibition corresponded to a log reduction in infectivity of ∼3.8 as measured by ELISpot.
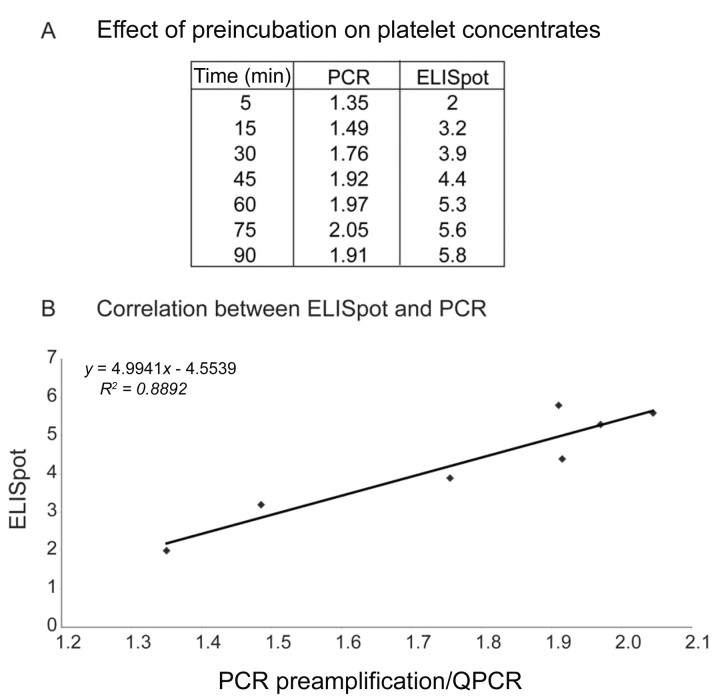
Inactivation of B19 in platelet concentrates by PCT. In an effort to determine whether the preamplification PCR assay could detect the inhibition of B19 in the presence of cellular components, the inactivation of B19 was studied (figure 5A) in platelet concentrates. As with plasma, PCT inhibited B19 amplification in platelets by ∼2 log. This effect was increased after the preincubation of contaminated plasma with amotosalen before UVA, similar to our results with plasma.
Figure 5. .
Preincubation of parvovirus B19 (B19)–contaminated platelets with amotosalen as measured by preamplification polymerase chain reaction (PCR) and enzyme‐linked immunospot (ELISpot) assays. A, The log inhibition of B19‐infected platelet concentrates with increasing exposure time to amotosalen before UV A light (UVA) treatment. The preamplification PCR log inhibition results were averaged from results using 3‐ and 5‐kb preamplification amplicons. The same samples were subjected to ELISpot to measure log reductions in infectivity. B, The strong correlation between the preamplification PCR and ELISpot assay as represented by direct plotting of results from both assays.
To further demonstrate correlation between the preamplification PCR assay and infectivity, the results of the same samples measured by the 2 assays were directly compared. The R2 value of 0.8892 corroborates the results of PCT of plasma. There is a strong correlation between ELISpot and the preamplification PCR inhibition assay, and in this case, a preamplification PCR log inhibition of 2.0 would equal a reduction in infectivity of 5.6 log.
Preamplification PCR inhibition assay to measure the inactivation of HBV by PCT. The assay that we have developed can be extended to other pathogens for which no in vitro test exists. HBV was used as a model to determine whether the assay could also detect the efficacy of PCT against HBV‐contaminated plasma and whether improvements could be made to the dynamic range of the assay.
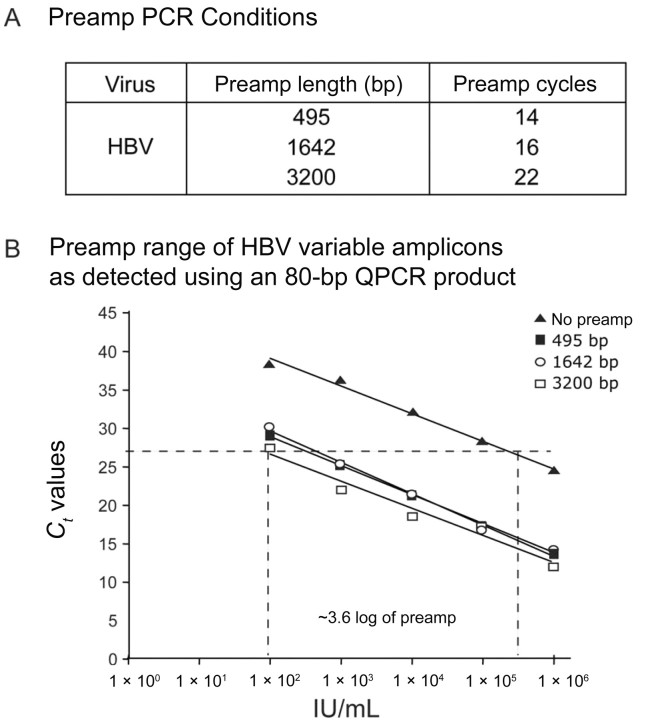
Figure 6A shows the preamplification conditions of amplicon size and number of cycles. To illustrate how the number of preamplification cycles directly determined the range of log inhibition possible, the same controls were performed to measure the dynamic range for testing HBV amplification. As with B19, the HBV primers generated amplicons of increasing length, and the preamplification PCR conditions were normalized to produce the same number of copies (figure 6B). In the case of HBV, the preamplification cycles were normalized to 14 cycles of a 495‐bp amplicon. Mathematically, 14 preamplification cycles, under the assumption of 100% efficiency, would yield 1.6 × 10⁴ copies, equal to ∼4 log. In practice, because the efficiency of PCR does not reach 100%, the controls showed that the range of log inhibition was ∼3.6 log. Therefore, at a maximum log inhibition of 3.6 for HBV, a broader range of detection is possible under the conditions set for HBV than under those set for B19 because of the increased number of preamplification cycles.
Figure 6. .
Preamplification conditions before quantitative polymerase chain reaction (QPCR) and range of detection for inhibition of hepatitis B virus (HBV) amplification in plasma. A, No. of cycles used for preamplification (preamp) for each respective amplicon length. The longer the amplicon, the more cycles were needed to generate the same no. of copies. B, Validation of assay and determination of log range sensitivity for HBV controls. QPCR confirmed the equal amount of DNA product produced with each preamp condition. Those with no preamp were not subjected to preamp and constituted the baseline control, consisting of only QPCR with a 80‐bp amplicon. The preamp products of each amplicon length showed an ∼4‐log range of amplification. The broader log range is attributed to the increased preamp cycle numbers used in the HBV assay. Ct, cycle threshold.
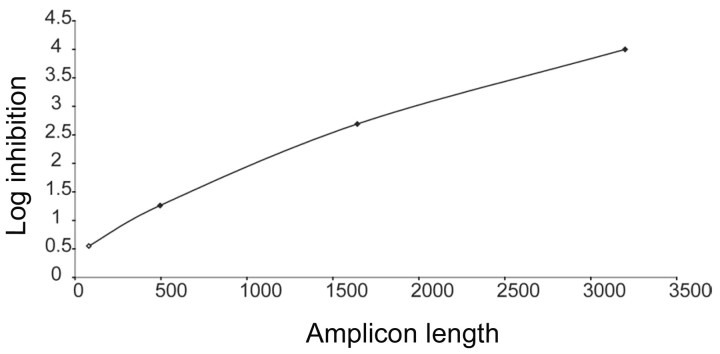
Inhibition of HBV amplification to the limit of detection by PCT. When the preamplification PCR assay developed for HBV was used (figure 7), treatment of samples with PCT caused the inhibition of amplification to the limit of detection of 4 log. As the graph shows, an amplicon length of 3 kb was necessary to detect the effects of PCT.
Figure 7. .
Photochemical treatment inhibition of hepatitis B virus amplification in plasma using the preamplification quantitative polymerase chain reaction assay. The graph shows that, with increasing preamplification amplicon length, the greater the amount of log inhibition detected. An amplicon length of >3 kb was required to detect the full log inhibition in this assay.
Discussion
The development of a pathogen‐inactivation method for blood products would allow for safer blood transfusions. At present, blood banks only test for the presence of specific pathogens. Testing is limited by detection availability and sensitivity and the time required before product release. The use of pathogen inactivation would provide an ideal scenario in which a broad spectrum of bacteria, viruses, and parasites could be inactivated and fewer blood products would be wasted.
To establish the effectiveness of a pathogen‐inactivation technology, biological assays have been the standard to determine reductions in infectious titers of a pathogen. The test systems currently available are frequently limited to complicated biological assays that are time consuming and labor intensive. For some pathogens, in vitro assays do not exist. In the present study, we developed a novel preamplification QPCR inhibition assay that was used to estimate reductions in viral infectivity for B19. The parallel association between PCR amplification and infectivity can be applied to other inactivation studies of different viruses to equate a result from a particular assay with results from another assay.
PCR assays allow quicker results to determine the presence of pathogens in a sample. Also, measuring the amplification capability before and after pathogen inactivation can determine whether the treatment disrupts the replicative function of a virus. By using a faster and more‐efficient test method, one can also study more closely the biological capabilities of the virus, such as capsid penetration, dose effect, preincubation, and other parameters. To optimize the assay, the analysis of varying lengths of PCR products determined which amplicon size was necessary to detect PCT inactivation. As the amplicon lengths increased, more preamplification cycles were necessary to produce equal number of copies because of decreased replication efficiency for longer PCR products. The normalization of the preamplification reactions allowed a direct comparison of each amplicon length to determine which condition was best suited for studying pathogen inactivation by PCT.
In introducing the preamplification QPCR inhibition assay as a potential inactivation test, our studies also revealed ways to improve the assay and increase its sensitivity and range. For example, increasing the number of preamplification cycles would broaden the log sensitivity of the assay, as was demonstrated using the conditions applied for detecting HBV inhibition, compared with B19. The amount of parent DNA is the baseline, and increasing the amplification range would provide greater potential to detect finer differences between control and PCT samples. Mathematically, this is true because the preamplification conditions were normalized to equal the smallest amplicon, which was subjected to 8 preamplification cycles for B19 and to 14 preamplification cycles for HBV. Under the assumption of 100% PCR efficiency, 8 preamplification cycles increased the copy number of the 244‐bp amplicon by 28 or 2.6×10², just over 2 log; and 14 preamplification cycles, under the assumption of 100% efficiency, would yield 1.6 × 10⁴ copies, or ∼4 log. In the case of HBV, the PCR was not 100% efficient; therefore, the log range was ∼3.6 log. The perfect imposition of all preamplification products for each virus showed that PCR efficiency decreased with increasing amplicon sizes; thus, to maintain the 2‐log B19 preamplification range, 10 cycles were needed for the 926‐bp amplicon, 16 for the 3‐kb amplicon, and 30 for the 5‐kb amplicon. These controls established the range of log inhibition of this assay. Therefore, a log inhibition of amplification of 2 log in PCT‐treated, B19‐contaminated plasma samples would demonstrate complete inactivation to the limit of detection.
Another method to increase the detection range of the assay is to shift the baseline curve. Because the QPCR amplicon, which detects the preamplification difference between control and PCT samples, is typically small (80–100 bp), the QPCR step amplifies the parent DNA, regardless of whether there is a cross‐link in another region of the genome. Statistically, PCT causes cross‐links in ∼1 of every 83 bp; thus, the likelihood that the QPCR primers will amplify a region that lacks an adduct is very high. Therefore, although the parent DNA was cross‐linked by PCT, the QPCR assay failed to detect it. The use of a longer QPCR target would decrease the statistical occurrence of the primers amplifying by chance a region that does not have an adduct and would improve the assay by increasing the log range of inactivation possible without having to increase the number of preamplification cycles.
The results of the preamplification QPCR assay correlate with those of the ELISpot assay in both plasma and platelets, which signifies that it can predict infectivity. A linear relationship was identified by using both assays to measure the effect of 45–60 min of preincubation with amotosalen before illumination with UVA. For instance, a 2‐log preamplification QPCR inhibition was equivalent to a 5.6‐log reduction in infectivity. By establishing the reference curve between QPCR and infectivity, one can extrapolate the level of the inactivation of infectivity by performing only the QPCR assay. In conclusion, this novel PCR inhibition assay effectively demonstrates that PCT inactivates B19 and HBV in blood products.
Acknowledgments
We thank Lynette Sawyer, for her guidance on the enzyme‐linked immunospot work; Grace Castro, for her technical assistance on the semiquantitative polymerase chain reaction (PCR); and Tom Dubensky, for feedback on approaches for the PCR.
Footnotes
Potential conflicts of interest: J.H., D.H., A.S., L.C., and L.L. have declared a financial interest in Cerus Corp., which developed the pathogen inactivation system studied in the present work. However, these financial involvements had no influence on the outcome of the scientific finding reported in the article. All other authors: none reported.
Financial support: Cerus Corp.; Baxter Healthcare Corp.; US Army Medical Research Acquisition Activity (grants DAMD17‐01‐20002, DAMD17‐02‐20042, and DAMD17‐03‐20039).
The content of this article does not necessarily reflect the position or policy of the government, and no official endorsement is implied by this award.
Present affiliation: Chiron Corporation, Emeryville, California.
References
- 1.Heegaard ED, Brown KE. Human parvovirus B19. Clin Microbiol Rev. 2002;15:485–505. doi: 10.1128/CMR.15.3.485-505.2002. [DOI] [PMC free article] [PubMed] [Google Scholar]
- 2.Plentz A, Hahn J, Knoll A, Holler E, Jilg W, Modrow S. Exposure of hematologic patients to parvovirus B19 as a contaminant of blood cell preparations and blood products. Transfusion. 2005;45:1811–5. doi: 10.1111/j.1537-2995.2005.00610.x. [DOI] [PubMed] [Google Scholar]
- 3.Lefrere JJ, Servant‐Delmas A, Candotti D, et al. Persistent B19 infection in immunocompetent individuals: implications for transfusion safety. Blood. 2005;106:2890–5. doi: 10.1182/blood-2005-03-1053. [DOI] [PubMed] [Google Scholar]
- 4.Marchand S, Tchernia G, Hiesse C, et al. Human parvovirus B19 infection in organ transplant recipients. Clin Transplant. 1999;13:17–24. doi: 10.1034/j.1399-0012.1999.t01-1-130103.x. [DOI] [PubMed] [Google Scholar]
- 5.Sheikh AU, Ernest JM. Clinical picture and consequences of fetal parvovirus B19 infection. Ann Med. 1995;27:7–8. doi: 10.3109/07853899509031929. [DOI] [PubMed] [Google Scholar]
- 6.Kerr S, O’Keeffe G, Kilty C, Doyle S. Undenatured parvovirus B19 antigens are essential for the accurate detection of parvovirus B19 IgG. J Med Virol. 1999;57:179–85. doi: 10.1002/(sici)1096-9071(199902)57:2<179::aid-jmv16>3.0.co;2-t. [DOI] [PubMed] [Google Scholar]
- 7.Horowitz B, Ben‐Hur E. Efforts in minimizing risk of viral transmission through viral inactivation. Ann Med. 2000;32:475–84. doi: 10.3109/07853890009002023. [DOI] [PubMed] [Google Scholar]
- 8.Azzi A, Ciappi S, Zakvrzewska K, Morfini M, Mariani G, Mannucci PM. Human parvovirus B19 infection in hemophiliacs first infused with two high‐purity, virally attenuated factor VIII concentrates. Am J Hematol. 1992;39:228–30. doi: 10.1002/ajh.2830390315. [DOI] [PubMed] [Google Scholar]
- 9.Santagostino E, Mannucci PM, Gringeri A, et al. Transmission of parvovirus B19 by coagulation factor concentrates exposed to 100 degrees C heat after lyophilization. Transfusion. 1997;37:517–22. doi: 10.1046/j.1537-2995.1997.37597293884.x. [DOI] [PubMed] [Google Scholar]
- 10.Koenigbauer UF, Eastlund T, Day JW. Clinical illness due to parvovirus B19 infection after infusion of solvent/detergent‐treated pooled plasma. Transfusion. 2000;40:1203–6. doi: 10.1046/j.1537-2995.2000.40101203.x. [DOI] [PubMed] [Google Scholar]
- 11.Lin L, Dikeman R, Molini B, et al. Photochemical treatment of platelet concentrates with amotosalen and long‐wavelength ultraviolet light inactivates a broad spectrum of pathogenic bacteria. Transfusion. 2004;44:1496–504. doi: 10.1111/j.1537-2995.2004.04125.x. [DOI] [PubMed] [Google Scholar]
- 12.Lin L, Hanson CV, Alter HJ, et al. Inactivation of viruses in platelet concentrates by photochemical treatment with amotosalen and long‐wavelength ultraviolet light. Transfusion. 2005;45:580–90. doi: 10.1111/j.0041-1132.2005.04316.x. [DOI] [PMC free article] [PubMed] [Google Scholar]
- 13.Singh Y, Sawyer LS, Pinkoski LS, et al. Photochemical treatment of plasma with amotosalen and long‐wavelength ultraviolet light inactivates pathogens while retaining coagulation function. Transfusion. 2006;46:1168–77. doi: 10.1111/j.1537-2995.2006.00867.x. [DOI] [PMC free article] [PubMed] [Google Scholar]
- 14.Eastman RT, Barrett LK, Dupuis K, Buckner FS, Van Voorhis WC. Leishmania inactivation in human pheresis platelets by a psoralen (amotosalen HCl) and long‐wavelength ultraviolet irradiation. Transfusion. 2005;45:1459–63. doi: 10.1111/j.1537-2995.2005.00552.x. [DOI] [PubMed] [Google Scholar]
- 15.Jauvin V, Alfonso RD, Guillemain B, Dupuis K, Fleury HJ. In vitro photochemical inactivation of cell‐associated human T‐cell leukemia virus type I and II in human platelet concentrates and plasma by use of amotosalen. Transfusion. 2005;45:1151–9. doi: 10.1111/j.1537-2995.2005.04400.x. [DOI] [PubMed] [Google Scholar]
- 16.Lin L. Inactivation of cytomegalovirus in platelet concentrates using Helinx™ technology. Semin Hematol. 2001;38:27–33. doi: 10.1016/s0037-1963(01)90121-0. [DOI] [PubMed] [Google Scholar]
- 17.Pinna D, Sampson‐Johannes A, Clementi M, et al. Amotosalen photochemical inactivation of severe acute respiratory syndrome coronavirus in human platelet concentrates. Transfus Med. 2005;15:269–76. doi: 10.1111/j.0958-7578.2005.00588.x. [DOI] [PMC free article] [PubMed] [Google Scholar]
- 18.Schlenke P. Protection against transfusion‐associated graft‐versus‐host disease in blood transfusion: is gamma‐irradiation the only answer? Transfus Med Hemother. 2004;31:24–31. [Google Scholar]
- 19.Van Voorhis WC, Barrett LK, Eastman RT, Alfonso R, Dupuis K. Trypanosoma cruzi inactivation in human platelet concentrates and plasma by a psoralen (amotosalen HCl) and long‐wavelength UV. Antimicrob Agents Chemother. 2003;47:475–9. doi: 10.1128/AAC.47.2.475-479.2003. [DOI] [PMC free article] [PubMed] [Google Scholar]
- 20.Roback JD, Conlan M, Drew WL, Ljungman P, Nichols WG, Preiksaitis JK. The role of photochemical treatment with amotosalen and UV‐A light in the prevention of transfusion‐transmitted cytomegalovirus infections. Transfus Med Rev. 2006;20:45–56. doi: 10.1016/j.tmrv.2005.08.004. [DOI] [PubMed] [Google Scholar]
- 21.Sawyer L, Hanson D, Dupuis K. Inactivation of parvovirus B19 in platelets by helinx technology. Transfusion. 2004;44(9S):102A. [Google Scholar]
- 22.Allain JP, Candotti D, Soldan K, et al. The risk of hepatitis B virus infection by transfusion in Kumasi, Ghana. Blood. 2003;101:2419–25. doi: 10.1182/blood-2002-04-1084. [DOI] [PubMed] [Google Scholar]
- 23.Candotti D, Etiz N, Parsyan A, Allain JP. Identification and characterization of persistent human erythrovirus infection in blood donor samples. J Virol. 2004;78:12169–78. doi: 10.1128/JVI.78.22.12169-12178.2004. [DOI] [PMC free article] [PubMed] [Google Scholar]


