

Abstract
Sodium-dependent dicarboxylate cotransporter (NaDC), which is responsible for the transportation of intermediates of the Krebs cycle, has been implicated in extending the life span of drosophila. In the present study, we cloned an intracellular domain segment of human kidney NaDC-3, which is 75% identical to that of the rat, constructed a polyclonal antibody against fusion protein of glutathione S-transferase (GST)-NaDC-3, and detected its renal expression changes with aging in both Wistar rats and normal humans. Western blot and immunohistochemistry confirmed the specificity of the antibody, and its location was found to be on the basolateral membrane of the renal proximal tubule. In addition, Western and Northern blots showed that NaDC-3 in kidneys significantly increased with age in Wistar rats. In healthy humans, renal NaDC-3 abundance also increased with age. Our results demonstrated that NaDC-3 expression was increased in aged Wistar rats and aged people, indicating that NaDC-3 may have a role in the process of kidney aging.
SODIUM-DEPENDENT dicarboxylate cotransporter (NaDC) is in a family of transmembrane proteins that are responsible for transportation of intermediates of Krebs cycle, such as succinate, α-ketoglutarate, and citrate (1). NaDC family members were mainly distributed in vital organs of the body, such as the kidney, liver, brain, and placenta. It has been demonstrated that there are at least two types of NaDC in the kidney according to their affinities for the substrates. NaDC-1 has a lower affinity and is located in the brush border of the renal proximal tubule of the kidney, while NaDC-3 has a higher affinity and is in the basolateral membrane of the proximal tubule (2). NaDC members can be involved in energy metabolism, secretion of organic anions, regulation of the acid–base balance, metabolism of amino acid, synthesis of glucocorticoid, and can also play a part in the pathogenesis of nephrolithiasis (3–6).
In 2000, Rogina and colleagues (7) reported that mutation of the Indy gene in drosophila, which shared 50% homology with NaDC, extended its average life span to twice that of the wild type, suggesting a role of NaDC in regulating life expectancy. At present, knowledge of the NaDC family is very limited, especially of NaDC-3. Apart from its involvement in transportation, NaDC-3 is rarely known for its other functions, such as in the aging process of rats and humans. In the present study, we hypothesize that NaDC-3 expression may have changes during the aging process. So for the first time, we established a polyclonal antibody against human NaDC-3-GST (glutathione-S-transferase) fusion protein, whose sequence has very high homology with that of the rat, and detected NaDC-3 expression in the kidney tissues of both aging rats and aging humans in order to explore its relationship with aging.
Methods
Bacterial Stains and Plasmids
Escherichia coli JM109 was kept in our laboratory. GST fusion protein-expressing prokaryotic vector pGEX-5X-1 was obtained from Pharmacia Co. (North Peapack, NJ).
Tool Enzymes and Operation Kits
Restriction endonuclease EcoR, Sal, Taq DNA polymerase, T4 ligase, reverse transcription kit, geneclean kit for purification of DNA, and wizard plasmid minipurification kit were all obtained from Promega Co. (Madison, WI). The immunohistochemistry kit was obtained from Zhongshan Biotechnology Co. Ltd (Beijing, China).
Major Reagents
RNAzol was obtained from Invitrogen Co. (San Diego, CA). The low molecular weight protein standard was obtained from Lizhu Dongfeng Biotechnology Inc. Ltd. (Shanghai, China). Isopropyl-beta-D-thiogalactopyranoside (IPTG), yeast extract, and pancreatic protein peptone were from Sigma Chemical Co. (St. Louis, MO). Reduced GSH and Sepharose 4B GSH chromatography columns were from Pharmacia Co. Freund's complete and incomplete adjuvants were from GibcoBRL, Inc. (Grand Island, NY). Immobilized GST affinity chromatography columns were from Pierce Biotech, Inc. (Rockford, IL). Purified GST-hNaDC-1 fusion protein and anti-GST-hNaDC-1 fusion protein antisera, from which the anti-GST antibody had been deleted, were also prepared in our laboratory (8).
Experimental Tissue
Two New Zealand white male rabbits weighing 2.0–3.0 kg were purchased from the Experimental Animal Center of the General Hospital of PLA (Beijing, China). Eighteen male Wistar rats, ages of 3, 12, and 24 months, respectively, were obtained from the colony kept in the Experimental Animal Center of the General Hospital of PLA (Beijing, China), which originated from the strain of the National Institute for the Control of Pharmaceutical and Biological Products (Beijing, China). The rats were housed 2 per cage (cage size 60 cm × 45 cm × 35 cm) in climate-controlled quarters, the relative humidity and ambient temperature of which were 45% and 23°C, respectively, under a 12-hour light/dark cycle. The rats were fed ad libitum water and standard laboratory chow with a composition of 25% protein, 5% fat, 56% carbohydrate, 8% ash, and 6% cellulose. Specific pathogen-free monitoring included routine testing of the following. The agents specifically excluded from the Wistar rat colony included virus (Sendai virus, rat corona virus, and rat parvovirus), bacterias (mycoplasma pulmonis, corynebacterium, and clostridium), and parasites (endoparasites, tapeworms, protozoa, and ectoparasites). The animal facilities fulfilled the requirements of the Chinese laws on the protection of animals. The renal biopsy samples were obtained from 15 normal human kidneys unmatched for transplantation, with a male to female ratio of 12 to 3, ranging in age from 6 to 65 years. To observe the renal tissue structure, a routine periodic acid-Schiff (PAS) staining method was used.
Analysis of Antigen Epitopes in hNaDC-3
The full-length sequence of human NaDC-3 is 86% identical to that of the rat, while the human sequence of peptide segment used as immunogen was 75% identical. The antigen epitopes were determined by means of analysis on physical and chemical properties of hNaDC-3 (using DNAStar software (DNAStar, Inc., Madison, WI) and software from http://www.expasy.pku.edu.cn/cgi-bin/prot-param).
Isolation of Total RNA for Cloning From a Normal Human Kidney
From the human donor kidney unmatched for transplantation, total RNA was extracted with RNAzol reagent according to the manufacturer's instruction. The RNA pellets were dissolved in DEPC (diethyl pyrocarbonate)-treated water and quantified with an ultraviolet spectrophotometer.z
Amplification of Target Fragment With RT-PCR
The first cDNA strand was synthesized using a reverse transcriptase-polymerase chain reaction (RT-PCR) kit. The PCR primers were designed according to hNaDC-3 cDNA sequence and synthesized. The sequences of primers were as follows. The upstream primer was: 5′-g GCCAATGCCATCCTGAAAAGT-3′ (underlined portion shows the cutting site of the EcoR I enzyme). The downstream primer was: 5′-acgc
 TTAATATTCATCCTCCTT-3′ (this primer contains a TAA stop codon; the underlined portion shows a Sal digestion site). The PCR reaction system with a total volume of 25 μl included: 10× Taq DNA polymerase buffer 2.5 μl, 1.5 mmol/L MgCl2, dNTPs 200 μmol/L, upstream and downstream primers each 0.25 μmol/ L, Taq DNA polymerase 2.5 U, and template cDNA 1 μl. The PCR reaction was performed for 30 cycles at 94°C for 30 seconds, 56°C for 30 seconds, and 72°C for 30 seconds. The PCR product of 3.0 μl was used for 1.5% agarose gel electrophoresis. The PCR product size was 236 bp, containing the cutting sites of the endonucleases.
Cloning and Sequencing of the PCR Product
After purification with Geneclean kit, the PCR product was cloned into pGEM-T vector directly, and transformed into E. coli JM109. Identification was made using the lacZ blue-white method. The purified PCR product was sequenced with T7 promoter sequence as the primer in pGEM-T vector. The sequencing result was analyzed with the DNAStar software.
Construction of the hNaDC-3-GST Fusion Protein Expression Vector
Briefly, the target sequence that had been inserted in pGEM-T vector was subcloned into GST fusion protein-expressing prokaryotic expression vector pGEX-5X-1, and then transformed into competent E. coli JM109. Characterization of the recombinant plasmid pGEX-hNaDC-3, which contained the antigen epitope-coding gene, was performed with endonucleases EcoR, Sal, and DNA sequencing.
Induction of GST-hNaDC-3 Fusion Protein Expression
The JM109/pGEX-hNaDC-3 was cultured at 37°C until log phase (∼2–3 hours). After addition of lactose analog IPTG (final concentration 0.1–1.0 mmol/L), the JM109/pGEX-hNaDC-3 was cultured, respectively, at 37°C, 32°C, and 30°C, for 1–5 hours. JM109/pGEX-5X-1 without hNADC-3 was used as a negative control. After centrifugation, both the supernatant and pellet underwent 15% SDS-PAGE (sodium dodecyl sulfate-polyacrylamide) gel electrophoresis.
Purification of hNaDC-3-GST Protein With Affinity Chromatography
After induction with 0.5 mmol/L IPTG under the optimized condition of 32°C for 3 hours, the cultured JM109/pGEX-5X-1 was collected for centrifugation. The pellet was resuspended in 1/10 volume of phosphate-buffered saline (PBS) (140 mmol/L NaCl, 2.7 mmol/L KCl, 10 mmol/L Na2HPO4, 1.8 mmol/L KH2PO4, pH 7.3), treated with ultrasound waves in an ice bath to burst the bacteria, and centrifuged at 12,000 g at 4°C for 15 minutes. The supernatant was then loaded onto a sepharose 4B glutathione chromatography column, which was followed by washing with PBS to delete nonspecific proteins. The target protein was eluted with 50 mmol/L Tris-HCl (pH 8.0, containing 10 mmol/L glutathione), and its concentration was assayed with Coomassie bright blue method.
Preparation and Purification of Anti-GST-hNaDC-3 Antibody
One hundred μg purified fusion protein antigen was mixed with equal volume of Freund's complete adjuvant for emulsification, then injected hypodermically into the back of a rabbit, and repeated after 3, 6, and 9 weeks. Nine weeks after immunization, when immunodiffusion assay showed that the titer was up to 1:32, blood was collected from the rabbit carotid artery in sterile glass bottles, incubated at 37°C for 30 minutes, and stored at room temperature overnight. The serum obtained was centrifuged at 3000 g for 20 minutes, and the supernatant was just the antiserum wanted for use, which was then diluted with equal volume of PBS (0.1 mol/L Na3PO4, 0.15 mol/L NaCl, pH 7.2), loaded onto an immobilized GST affinity chromatography column, and washed with PBS. Finally the purified anti-hNaDC-3 antibody was collected, while the anti-GST antibody was obtained through elution with 6 mol/L guanidine hydrochloride.
Identification of Anti-hNaDC-3 Antibody
The purified fusion protein GST-hNaDC-3 was boiled for denature, loaded onto 15% SDS-PAGE gel for electrophoresis, and transferred to nitrocellulose membrane at 30V for 12 hours in a cold room. Then the nitrocellulose membrane was incubated with 3% BSA for 3 hours to block nonspecific sites, and incubated with 1:500 anti-hNaDC-3 antiserum or normal serum of the same rabbit for 2 hours at room temperature. After being washed with TBS containing 0.1% (v/v) Tween 20, the membrane was incubated for 2 hours with goat antirabbit IgG coupled with horseradish peroxidase. Color reaction was developed and observed under a microscope.
Detection of NaDC-3 Expression With Immunohistochemistry
Kidney tissue was obtained from rat and human biopsy samples. The paraffin-embedded sections were routinely dewaxed, digested with 0.075% trypsin at 37°C for 15 minutes for antigen recovery, blocked with normal goat serum at 37°C for 1 hour, incubated with 1:2500 anti-hNaDC-3 antibody at 37°C for 1 hour, incubated with goat antirabbit IgG-biotin at room temperature for 15 minutes, and finally incubated with streptavidin-horseradish peroxidase at room temperature for 15 minutes. DAB-H2O2 was used for color development. As for immunohistochemistry double-staining, both anti-hNaDC-1 antibody and anti-hNaDC-3 antibody were applied. First, paraffin-embedded sections were dewaxed, antigen-recovered with a microwave, blocked with normal goat serum, incubated with 1:2500 anti-hNaDC-1 antibody, incubated with goat antirabbit IgG-biotin, and finally incubated with streptavidin-AKP at room temperature for 15 minutes. Substrate BCIP (5-bromo, 4-chloro, 3-indolylphosphate)/NBT (nitroblue tetrazolium) was used for color development. The second round of immunohistochemistry assay with anti-hNaDC-3 antibody was performed in the same way as shown above.
Northern Blot Analysis of NaDC-3 mRNA Expression in Rat Kidneys
From 2 × 2 × 3 mm kidney tissue sections from Wistar rats, total RNA was extracted with RNAzol reagent according to the manufacturer's instruction. The RNA pellets were dissolved in DEPC-treated water and quantified with a spectrophotometer. Twenty μg total RNA was electrophoresed on 1% agarose gel containing 2.2% formaldehyde, and transferred onto a nylon membrane by capillary blotting. The NaDC-3 cDNA probe were randomly labeled with 32P-dCTP for 24 hours and then hybridized. The Northern blots were exposed to X-ray films at −70°C for appropriate periods of time.
Western Blot Analysis for NaDC-3 Expression in Kidneys of Wistar Rats
Half of the left kidney of each rat was homogenized on ice with a Teflon glass homogenizer containing 5 ml lysis buffer (2% SDS, 10% glyceride, 20 mmol/L Tris, at pH 7.2, 10 mmol/L dithiothreitol, 0.1 mmol/L phenylmethylsulfonyl fluoride, 20 μmol/L leupeptin, 0.5 mmol/L EDTA, 0.5 mmol/L EGTA). Homogenates were centrifuged at 12,000 rpm, 4°C for 15 minutes. The supernatants contained the protein desired, the concentration of which was determined with Coomassie bright blue assay. Twenty-five μg sample protein was mixed with an equal volume of sample buffer, boiled for 5 minutes, electrophoresed on a 12% SDS-polyacrylamide gel at room temperature for 60 minutes, and transferred to nitrocellulose filters (Amersham Pharmacia Biotech, Bjorkgatan, Uppsala, Sweden). The membrane was blocked with tris-buffered saline (TBS) solution containing 3% BSA, incubated with rabbit antisera against NaDC-3 at room temperature for 60 minutes, and the binding was detected with the horseradish peroxidase-conjugated secondary antibody system. After rinsing with TBS solution, the membranes were incubated with 0.8 mmol/L diaminobenzidine (DAB) containing 0.01 % H2O2 for color reaction. Western blotting was controlled by using antiactin antibody.
Semiquantitative Analysis on Positive Area of Immunohistochemistry
Using TIPA/88 Medical Images Analysis System software (General Hospital of PLA, Beijing, China), the ratio of 20 immunohistochemistry-positive areas to 20 corresponding areas of the whole field of the monitor screen was obtained. The ratios were used as the relative values of hNaDC-3 expression.
Statistical Analysis
Data were expressed as mean ± SEM (standard error of measurement) unless otherwise stated. Statistical significance was determined using analysis of variance (ANOVA). A p value less than.05 was regarded as statistically significant.
Results
Properties of hNaDC-3 and Its Antigen Epitopes
As shown in Figure 1, hNaDC-3 was constituted by an abundance of hydrophobic amino acids. The amino-terminal intracellular domain 155–226, consisting of 72 amino acids (encoded by 482-697 DNA fragment, 216 bp), had a pliable structure, easily accessible surface, good hydrophilic activity, and a higher antigen index number. Therefore, this sequence was selected as the immunogen peptide.
Figure 1.
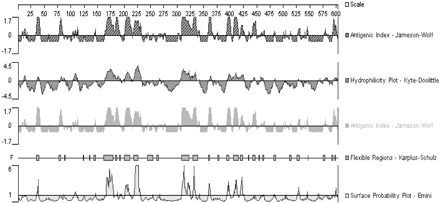
The amino-terminal intracellular domain 155–226 consisting of 72 amino acids (encoded by 482-697 DNA fragment, 216 bp) had pliable structure, an easily accessible surface, good hydrophilic activity, and a higher antigen index number
Amplification and Sequencing of the DNA Fragment Encoding the Peptide as Immunogen
The target 216 bp cDNA segment encoding the immunogen peptide in hNaDC-3 was amplified by RT-PCR from total RNA extracted from normal human kidney tissue, and directly cloned into pGEM-T vector after purification. As shown in Figure 2, two sites for restriction endonucleases EcoR I and Sal I, respectively, had been designed for both ends. There was also a stop codon TAA introduced at its 3′ end. The sequencing result showed that no mutations occurred.
Figure 2.
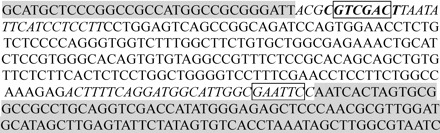
Sequence of pGEM-hNaDC3 recombined plasmid. The shaded portions were sequences of the pGEM-T vector, the parts in boxes were sequences of the cutting sites, and the parts in italics were sequences of the primers
Construction of the Expression Vector of GST-hNaDC-3 Fusion Protein
The flow chart for construction of recombinant expression vector pGEX-hNaDC-3 is shown in Figure 3. Briefly, recombinant pGEX-hNaDC-3 was constructed by cutting out the target cDNA fragment of hNaDC-3 from pGEM-T vector with EcoR I and Sal, then inserted into pGEX-5X-1, which had also been digested with EcoR I and Sal. It was demonstrated that a 236 bp fragment (containing two primer sequences of 10 bp each) was cut out from the recombinant pGEX-hNaDC-3 with EcoR I and Sal (Figure 4). DNA sequencing confirmed that this recombinant vector contained the 482–697 nucleotide sequence encoding the 155–226 amino acids in the intracellular domain of hNaDC-3, indicating that the opening reading frame was correct.
Figure 3.
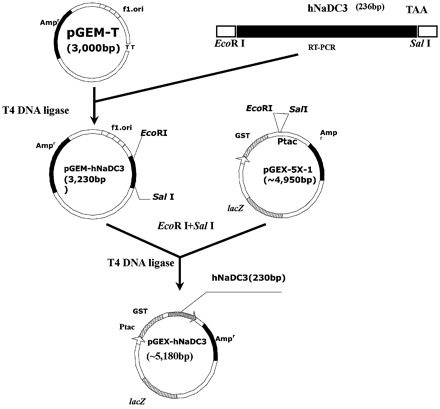
Construction map of pGEX-hNaDC-3 recombined vector
Figure 4.
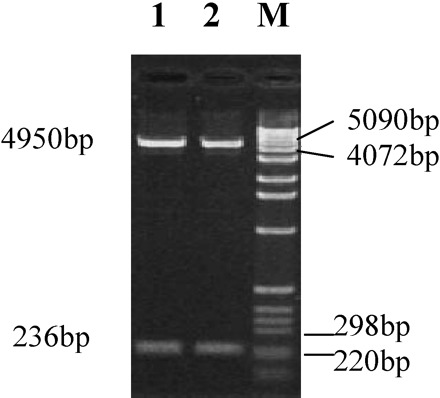
Restriction characterization of combined plasmid pGEX-hNaDC-3. M: 1 kb DNA molecular weight marker; 1 and 2: double endonucleases restriction cutting products of recombined plasmid pGEX-hNaDC-3
Induction and Purification of GST-hNaDC-3 Fusion Protein
Competent E. coli JM109, transformed with pGEX-5X-1 or pGEX-hNaDC-3, was induced with IPTG (0.1–1.0 mmol/L) at 37°C, 32°C, and 30°C, for 0, 1, 2, 3, 4, and 5 hours, respectively, to optimize the best induction conditions. Protein samples, obtained under each induction condition, underwent SDS-PAGE electrophoresis for analysis. As shown in Figure 5, protein samples isolated from E. coli transformed with empty pGEX-5X-1 showed a band of 26 kD, indicative of GST protein, while protein samples extracted from E. coli transformed with recombinant pGEX-hNaDC-3 displayed a band of 34 kD, indicative of fusion protein, consisted of 26 kD GST and 8 kD hNaDC-3. It was found that protein abundance peaked at 32°C–37°C, 3 hours after induction with IPTG (data not shown). Different concentrations of IPTG (0.1–1.0 mmol/L) did not alter the expression level of the fusion protein (data not shown). Scanning analysis of the wet SDS-PAGE gel, stained with Coomassie bright blue, showed that the amount of GST-hNaDC-3 fusion protein was approximately 25% of the total protein of E. coli. The total amount of ∼3 mg of GST-hNaDC-3 fusion protein was purified with affinity chromatography with a purity of 90%.
Figure 5.
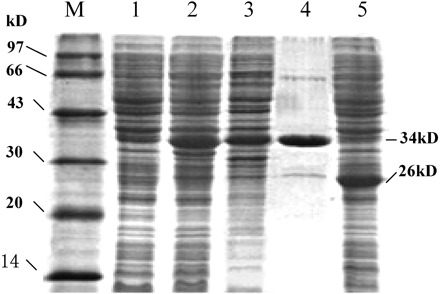
Map of GST-hNaDC-3 fusion protein sodium dodecyl sulfate-polyacrylamide gel electrophoresis. Lane M: low-molecular-weight protein marker; Lane 1: total protein of Escherichia coli before induction; Lane 2: total protein of E. coli after induction; Lane 3: supernatant of burst E. coli; Lane 4: purified GST-hNaDC-3 protein; Lane 5: empty plasmid pGEX-5x-1 expressed 26 kD GST protein after induction
Identification of Anti-hNaDC-3 Antibody With Western Blot Assay
The result of Western blot assay demonstrated that purified anti-GST-hNaDC-3 antibody specifically recognized the 34 kD GST-hNaDC-3 fusion protein antigen, but did not react with the 26 kD GST protein. The normal sera did not react with the GST-hNaDC-3 fusion protein antigen. For the sake of further characterizing specificity of the anti-GST-hNaDC-3 antibody, immunological reactions were performed between anti-GST-hNaDC-3 and anti-GST-hNaDC-1 antibodies, and recombinant GST-hNaDC-3 and GST-hNaDC-1 fusion proteins, respectively. The results showed that the anti-GST-hNaDC-3 specifically recognized GST-hNaDC-3 fusion protein, but not GST-hNaDC-1 fusion protein. Conversely, the anti-GST-hNaDC-1 antibody recognized GST-hNaDC-1 protein, but not GST- hNaDC-3 fusion protein (Figure 6).
Figure 6.
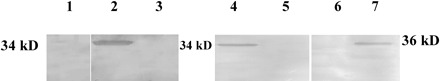
Immunological characterization of anti-GST-hNaDC-3 antibody. Lane 1: Nonimmunization sera did not recognize GST/hNaDC-3 protein on the membrane; Lane 2: Purified anti-GST-hNaDC-3 antibody without anti-GST antibody recognized hNaDC-3 protein on the membrane; Lane 3: Purified anti-GST-hNaDC-3 antibody without anti-GST antibody did not recognize GST protein on the membrane; Lane 4: Purified anti-hNaDC-3 antibody recognized hNaDC-3 protein on the membrane; Lane 5: Purified anti-hNaDC-3 antibody did not recognize hNaDC-1 protein on the membrane; Lane 6: Purified anti-hNaDC-1 antibody did not recognize hNaDC-3 protein; Lane 7: Purified anti-hNaDC-1 antibody recognized hNaDC-1 protein
PAS Staining of Rat Kidney Sections
The kidney sections of the 3-month-old group showed normal renal structure, while kidney sections of the 24-month-old group displayed focal segmental or global glomerulosclerosis, mild denaturation of renal tubules, tubulointerstitial fibrosis, and some inflammatory infiltration (Figure 7A–C).
Figure 7.
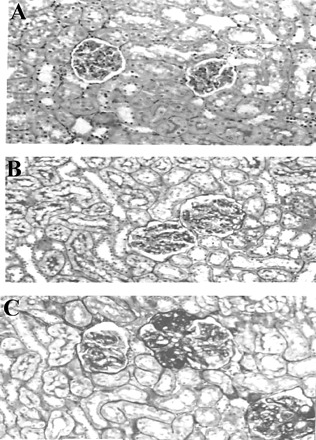
Periodic acid-Schiff staining of rat kidney sections. A, 3-month-old rat group kidney showing normal renal structure; B, 12-month-old rat group kidney showing nearly normal renal structure; C, 24-month-old rat group kidney displaying focal segmental/global glomerulosclerosis
Detection of NaDC-3 Expression in Kidney Tissue With Immunohistochemistry
As shown in Figure 8A, NaDC-3 protein was positive in the basolateral membrane of the human renal proximal tubule, but negative in the distal tubule, collecting duct, renal interstitium, and glomerulus. Immunohistochemistry double-staining (Figure 8B) showed high-affinity NaDC-3 located mainly in the basolateral membrane of the human renal proximal tubule (arrows), while low-affinity NaDC-1 dominated in the brush border (arrowheads). While most of the renal proximal tubules simultaneously express both NaDC-3 and NaDC-1, a few proximal tubules only displayed one of them. To further explore the relationship between NaDC-3 and aging, we observed NaDC-3 expressions in the kidneys of both aging rats and aging humans. The results showed that the abundance of NaDC-3 protein in the kidneys of rats of the 24-month-old group was higher than in the 3-month-old and 12-month-old groups (Figure 9A–C). The abundance of NaDC-3 protein in human kidneys of the old-age group was also higher than in both the child group and adult group (Figure 10A–C).
Figure 8.
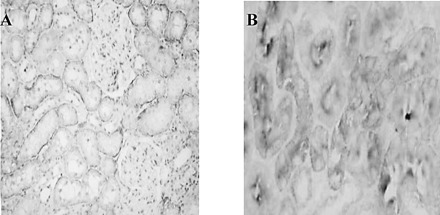
Location of hNaDC-3 and hNaDC-1 in the kidney. A, NaDC-3 was located in the basolateral membrane of proximal tubular epithelial cells (×200); B, double-staining showed hNaDC-3 in the basolateral membrane, while NaDC-1 was located in the brush border of proximal tubular epithelial cells (×200)
Figure 9.
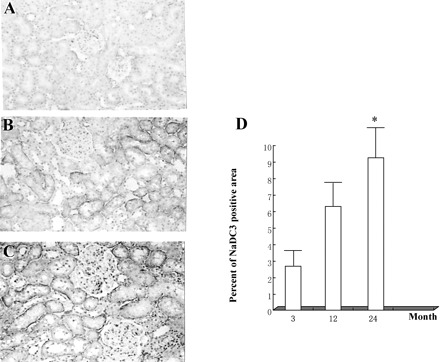
NaDC-3 expression in kidney tissues of Wistar rats. An abundance of NaDC-3 protein in the kidneys of rats in the 24-month-old group was higher than that of the 3-month-old group or 12-month-old group. A, 3-month-old rat group kidney tissue; B, 12-month-old rat group kidney tissue; C, 24-month-old rat group kidney tissue; D, Percentage of NaDC-3 positive staining area. N = 6 in each group; * p <.05 versus other groups
Figure 10.
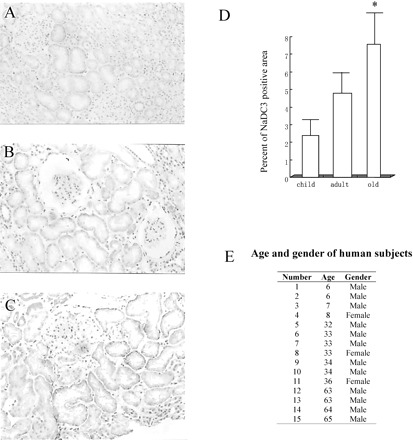
NaDC-3 expression in kidney tissue of normal humans of different age groups. The abundance of NaDC-3 protein was higher in human kidneys of the old group than those of the child group or adult group. A, child group (6–8 years old); B, adult group (32–36 years old); C, old group (63–65 years old); D, Percentage of NaDC-3-positive staining area. E, Age and gender of the human subjects. N = 4 in both child group and old group, N = 7 in adult group; * p <.05 versus other groups
Western Blots With Wistar Rat Kidney Tissue
Western blots of Wistar rat kidney tissue probed with NaDC-3 antifusion protein antibody showed higher levels of NaDC-3 protein expression in 24-month-old rats than in both 3-month-old and 12-month-old rats.
Expression of NaDC-3 mRNA in Rat Kidney Tissue
Northern blot showed that the expression level of NaDC-3 mRNA was higher in the kidneys of rats of the 24-month-old group than in both the 3-month-old and 12-month-old groups.
Discussion
Aging, also called senescence, commonly refers to postmaturational processes that lead to diminished homeostasis and increased organismic vulnerability, the characteristics of which includes increased mortality, changed tissue composition, decreased physiological capacity, reduced ability to respond, and increased vulnerability (9). Since aging is an extremely complex, multifactorial process, numerous aging theories have been proposed; the most important of these are probably the genomic and free radical theories. Although it is abundantly clear that our genes influence aging and longevity, exactly how this takes place still remains to be elucidated. There is considerable evidence supporting the free radical theory of aging (10). At present, caloric restriction is the only known method that increases the life span (11). Caloric restriction not only down-regulates free radical and lipid peroxide production (12), but also lowers body temperature in rhesus monkeys (13). The mitochondrial respiratory chain is a powerful source of reactive oxygen species, considered the pathogenic agent of aging (14). The tricarboxylic acid cycle, also called the citric acid cycle or Krebs cycle, is a major biochemical pathway that is localized to the mitochondrial matrix (15), which is considered the most efficient way for aerobic organisms to produce energy. As NaDC is responsible for transportation of intermediates of the Krebs cycle including succinate, α-ketoglutarate, and citrate (1), it can be deduced that NaDC may be involved in the process of aging, for which Rogina and colleagues have provided evidence (7).
At present, two types of NaDC have been discovered in the kidney, including NaDC-1 and NaDC-3. However, reports on functions of NaDC in the kidney are limited. NaDC-1 has been found to be increased in kidneys of rats with metabolic acidosis (16,17). In 1999, Chen and colleagues (4) and Kekuda and colleagues (18) cloned the high-affinity sodium-dependent dicarboxylate cotransporter from the rat kidney (SDCT-2) and rat placenta (NaDC-3), respectively. In 2000, Wang and colleagues (19) cloned the high-affinity NaDC from the human placenta, and named it hNaDC-3.
We further cloned human kidney NaDC-3 (hNaDC-3/hSDCT2, GenBank Accession Number AY072810), and constructed a polyclonal antibody against hNaDC-3-GST fusion protein. As human NaDC-3 protein has a large molecular weight and a complex secondary structure, it is difficult to express and purify this protein in its entirety using biological methods. Thus, by means of analysis with biotechnological software, we established a peptide in the N-terminal intracellular domain as the immunogen. To prevent degradation of the peptide in E. coli, its encoding DNA sequence was fused with a GST prokaryotic sequence. All the above advantages allowed the NaDC-3 to be stably translated. By continually exploring the effects of IPTG concentrations, reaction temperature, and induction time of protein expression, we finally obtained the optimal conditions for IPTG to induce highly efficient soluble fusion protein expression. We finally obtained the antibody by using the purified fusion protein GST-hNaDC-3 as the immunogen. Substantial evidence showed that the anti-hNaDC-3 antibody specifically recognized the natural antigen. Our results have demonstrated for the first time, at the level of renal tissue expression, that hNaDC-3 was mainly located in the basolateral membrane of the renal proximal tubule, while hNaDC-1 was mainly expressed in the brush border membrane of the proximal tubule. An interesting observation is that NaDC-3 protein expression increased with age in rats as well as in humans. As NaDC-3 uptakes citrate and succinate, and so forth, into the basolateral membrane of renal proximal tubule epithelial cells to enter the mitochondria for providing energy (4), this increase of NaDC-3 may have a role in promoting aging, even although the exact mechanism of it has not yet been discovered. Rogina and colleagues (7) reported that the insertion mutation of the Indy gene, which has approximately 50% homology with NaDC-3, doubled the life span of drosophila, with no changes in the procreation ability and other physical activities, providing indirect support to our findings.
Conclusion
In this study, we have established an antibody against fusion protein GST-NaDC-3, which specifically identifies the NaDC-3 protein located in the basolateral membranes of renal proximal tubular epithelial cells. We have also provided evidence that an increase in NaDC-3 expression is associated with aging in both rats and humans.
Figure 11.
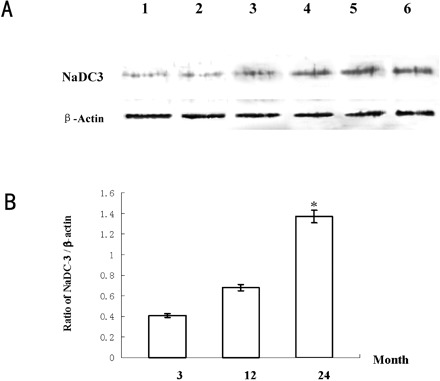
Western blots of Wistar rat kidney tissue. Higher levels of NaDC-3 protein were shown in 24-month-old rats than in both 3-month-old and 12-month-old rat groups. A, Western blotting result as a representative of three independent experiments. Lanes 1 and 2: 3-month-old group; Lanes 3 and 4: 12-month-old group; Lanes 5 and 6: 24-month-old group. B, Ratio graph of NaDC-3/β-actin of the Western blotting results. N = 6 rats in each group; * p <.05 versus other groups
Figure 12.
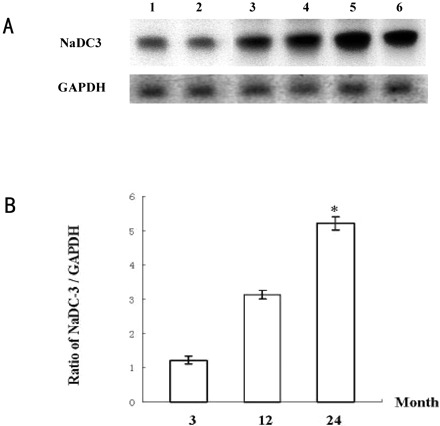
Expression of NaDC-3 mRNA in rat kidney tissue. Expression level of NaDC-3 mRNA was higher in kidney tissue of the 24-month-old group than in kidney tissue of both the 3-month-old group and the 12-month-old group. A, Northern blot result as a representative of three independent experiments. Lanes 1 and 2: 3-month-old group; Lanes 3 and 4: 12-month-old group; Lanes 5 and 6: 24-month-old group. B, Ratio graph of NaDC-3/GAPDH of Northern blotting results. N = 6 rats in each group; * p <.05 versus other groups
Acknowledgments
This work was supported by grants from the Main State Basic Research Development Program of the People's Republic of China (G2000057003), the General Program of Natural Science Foundation of China (30070288), and the Creative Research Group Science Fund of Natural Science Foundation of China (30121005). We are grateful to Dr. Xueyuan Bai for his help with the manuscript.
Address correspondence to Xiangmei Chen, MD, PhD, Department of Nephrology, Kidney Center and Key Lab of PLA, General Hospital of PLA, Fuxing Road 28, Beijing 100853, P.R. China. E-mail: xmchen@public.bta.net.cn
Footnotes
Decision Editor: James R. Smith, PhD
References
- 1.Pajor AM. Sodium-coupled transporters for Krebs cycle intermediates. Ann Rev Physiol.. 1999;61:663-682. [DOI] [PubMed] [Google Scholar]
- 2.Pajor AM. Molecular properties of sodium/dicarboxylate cotransporters. Membrane Biol.. 2000;175:1-8. [DOI] [PubMed] [Google Scholar]
- 3.Simpson DP. Citrate excretion: a window on renal metabolism. Am J Physiol.. 1983;244:F223-F234. [DOI] [PubMed] [Google Scholar]
- 4.Chen X, Tsukaguchi H, Chen XZ, et al. Molecular and functional analysis of SDCT2, a novel rat sodium-dependent dicarboxylate transporter. J Clin Invest.. 1999;103:1159-1168. [DOI] [PMC free article] [PubMed] [Google Scholar]
- 5.Steffgen J, Tolan D, Beery E, et al. Demonstration of a Na+-dicarboxylate cotransporter in bovine adrenocortical cells. Pflugers Arch.. 1999;438:860-864. [DOI] [PubMed] [Google Scholar]
- 6.He Y, Chen X, Yu Z, et al. Expression of human NaDC-1 in kidney: its relationship with pathogenesis of nephrolithiasis. J Chin Med.. 2001;81:1066-1069. [PubMed] [Google Scholar]
- 7.Rogina B, Reenan RA, Nilsen SP, Helfand SL. Extended life-span conferred by cotransporter gene mutations in Drosophila. Science.. 2000;290:2137-2140. [DOI] [PubMed] [Google Scholar]
- 8.He Y, Chen X, Yu Z, et al. Expression of human sodium dependent dicarboxylated cotransporter fusion protein and preparation of its antibody. Chin J Biochem Mol Biol.. 2002;18:66-70. [Google Scholar]
- 9.Troen BR. The biology of aging. Mt Sinai J Med.. 2003;70:3-22. [PubMed] [Google Scholar]
- 10.Knight JA. The biochemistry of aging. Adv Clin Chem.. 2000;35:1-62. [DOI] [PubMed] [Google Scholar]
- 11.Walford RL, Mock D, Verdery R, MacCallum T. Calorie restriction in biosphere 2: alterations in physiologic, hematologic, hormonal, and biochemical parameters in humans restricted for a 2-year period. J Gerontol Biol Sci.. 2002;57A:B211-B224. [DOI] [PubMed] [Google Scholar]
- 12.Yu BP, Lim BO, Sugano M. Dietary restriction downregulates free radical and lipid peroxide production: plausible mechanism for elongation of life span. J Nutr Sci Vitaminol.. 2002;48:257-264. [DOI] [PubMed] [Google Scholar]
- 13.Lane MA, Baer DJ, Rumpler WV, et al. Calorie restriction lowers body temperature in rhesus monkeys, consistent with a postulated anti-aging mechanism in rodents. Proc Natl Acad Sci U S A.. 1996;93:4159-4164. [DOI] [PMC free article] [PubMed] [Google Scholar]
- 14.Lenaz G, Bovina C, D'Aurelio M, et al. Role of mitochondria in oxidative stress and aging. Ann N Y Acad Sci.. 2002;959:199-213. [DOI] [PubMed] [Google Scholar]
- 15.Haggie PM, Verkman AS. Diffusion of tricarboxylic acid cycle enzymes in the mitochondrial matrix in vivo. J Biol Chem.. 2002;277:40782-40788. [DOI] [PubMed] [Google Scholar]
- 16.Aruga S, Wehrli S, Kaissling B, et al. Chronic metabolic acidosis increases NaDC-1 mRNA and protein abundance in rat kidney. Kidney Int.. 2000;58:206-215. [DOI] [PubMed] [Google Scholar]
- 17.Wu D, Chen X, Ye Y, et al. Expression of citrate transporter mRNA in renal tissues of rats with metabolic acidosis. Chin J Physiol Acta.. 2000;52:55-58. [PubMed] [Google Scholar]
- 18.Kekuda R, Wang H, Huang W, et al. Primary structure and functional characteristics of a mammalian sodium-coupled high affinity dicarboxylate transporter. J Biol Chem.. 1999;274:3422-3429. [DOI] [PubMed] [Google Scholar]
- 19.Wang HP, Fei YJ, Kekuda R, et al. Structure, function, and genomic organization of human Na+-dependent high-affinity dicarboxylate transporter. Am J Physiol Cell Physiol.. 2000;278:C1019-C1030. [DOI] [PubMed] [Google Scholar]