

Abstract
Quasispecies composition and tissue distribution of feline coronaviruses (FCoVs) were studied in naturally infected cats. The genomic complexity of FCoVs was investigated using single‐strand conformational polymorphism (SSCP) analysis of N and ORF7b amplicons, and the evolutionary process was investigated by sequence‐based phylogenetic analysis. SSCP analysis showed high heterogeneity of the FCoV genome which was correlated with the seriousness of the clinical form. The two genomic regions analysed showed different levels of variation; the N region demonstrated significant heterogeneity as compared to ORF7b. Phylogenetic analysis of the nucleotide sequences showed the clear separation of sequences analysed on the basis of virulence and geographical origin. A maximum likelihood analysis of N and ORF7b data sets showed a situation of strong heterogeneity for the N region.
Keywords: Feline coronavirus, Quasispecies, Phylogenetic analysis
1Introduction
The feline coronaviruses (FCoVs), belonging to the family Coronaviridae, order Nidovirales [1], cause an inapparent or mild enteric infection, mainly in kittens [2] but also cause a rare, fatal immune‐mediated disease, feline infectious peritonitis (FIP), as a result of infection of the macrophages by mutant FCoV strains [3]. The virulent FCoV called feline infectious peritonitis virus (FIPV) is a macrophage‐tropic mutant of the ubiquitous feline enteric coronavirus which carries the mutations responsible for the increase in virulence [4].
Coronaviruses, common pathogens of mammals and birds, show significant genetic heterogeneity as a result of the accumulation of mutations during viral replication. Virus variants are produced as a consequence of the infidelity of the RNA‐dependent RNA polymerase which lacks proofreading activity; since the coronaviral genome is the largest of all RNA genomes, myriads of copying errors can happen and FCoVs in an infected individual can consist of a population of closely related heterogeneous sequences: quasispecies [5]. Quasispecies are complex, dynamic distributions of non‐identical but related replicons [6], and the viral population is composed of a predominant sequence, the master sequence and a number of sequences differing from it to various extents.
FIP can manifest itself as a wet/effusive form or a non‐effusive dry form with granulomatous lesions affecting multiple organs or as a combination of these forms [7]. The pathogenesis of the disease is still not fully understood; it was thought that the development of extensive viral quasispecies might overwhelm the immune system in an already immunocompromised individual, allowing FIP to develop [8]. The reference method used to detect viral heterogeneity is cloning and sequencing a sufficient number of clones [9]. Since cloning and sequencing is a laborious and expensive method, it is possible to use an alternative and quicker method of detecting quasispecies composition: single‐strand conformational polymorphism (SSCP) analysis of polymerase chain reaction (PCR) products [[10], [11]].
We investigated the genomic complexity of FCoVs using SSCP analysis of structural and non‐structural genes of strains from healthy carriers and from dead cats with clinical manifestations of FIP. In order to provide a better understanding of the evolutionary process of FCoVs in relation to the host and disease evolution, we conducted sequence‐based phylogenetic analysis.
2Materials and methods
2.1Specimens
We used rectal swab samples from five FCoV‐positive cats referred to our laboratory for a survey conducted in order to determine the prevalence of FCoVs inside a shelter (strains 352C, 352S, 352N, 368 and 376); the cats did not show any clinical signs referable to FIP. All samples, except one, were tested twice at a 1‐month interval, by reverse transcriptase (RT) PCR as described by Gut et al. [12].
In order to compare avirulent strains from healthy carrier cats with virulent strains, we also analysed tissue samples from dead cats having clinical signs of FIP: cat 419 having a dry form and cat 420 having a wet form both having lived for a brief period in the same shelter as the carrier cats, and cat 155, affected by a wet form with prevalent pericardial effusion, coming from a different shelter. The following tissue samples were collected post mortem in order to analyse the quasispecies composition and the viral tissue distribution: myocardium, pericardium, liver, spleen, kidneys, small and large intestines, pancreas, mesenteric lymph nodes, lungs and brain cortex.
2.2Detection of FCoV quasispecies by SSCP analysis
The partial N gene and ORF7b were amplified by nested RT‐PCR using a set of four primers for each gene as previously described [13].
The final PCR products of 444 bp for the N gene and 490 bp for ORF7b were analysed using electrophoresis on a 2% agarose gel, stained with ethidium bromide and observed under UV light. PCR products were purified using a commercial kit (PCR products purification kit, Roche, Germany) as described by the manufacturer and 8 μl of the PCR products were denatured at 95°C for 10 min and mixed with an SSCP loading solution 5X (95% formamide, 0.05% xylene cyanol and 0.05% bromophenol blue), put on ice for 5 min and loaded onto 20% non‐denaturing polyacrylamide gel. Electrophoresis was performed at 200 V constant power for 4 h at room temperature. The DNA bands were subsequently visualised by the silver staining procedure (Silverxpress Silverstain Kit, Invitrogen, USA). One denatured and one non‐denatured control were included in each SSCP gel. Under these conditions, we were able to evaluate the approximate number of the major populations presenting more than 0.5% nucleotide differences from each other. N and ORF7b amplicons for each specimen were directly sequenced using cycle sequence analysis, thus yielding the consensus sequences of the FCoV quasispecies for each sample.
The PCR fragments showing the higher variability in the SSCP analysis were cloned using the TA system (TOPO TA Cloning® Kit for Sequencing, Invitrogen, USA) and we randomly chose 10 clones for each sample. The clones were analysed in an SSCP assay and subsequently sequenced.
2.3Phylogenetic analysis
Nucleotide sequence alignments of the N and ORF7b fragments were carried out in Clustal W [14] and subsequently submitted to DAMBE [15] to correct the nucleotide alignments for the codon positions. Final alignments were manually edited by the alignment editor Gene Doc [16].
Phylogenetic trees were constructed using a β test version of PAUP*4.0 [17]. Several evolution models were tested, including F84 [18], HKY85 [19] and TN93 [20]. The results obtained were verified using an α release of the PHYLIP software package, version 3.6 [21] and Tree‐Puzzle version 5.0 [22]. To analyse the sequence data sets by the distance method, an initial neighbour‐joining tree was built using the F84 molecular evolution model with the initial transition/transversion ratio (Ts/Tv) set at 2 and the α shape of the γ distribution set at 0.5. Then, a likelihood model was fitted to this initial tree and the parameters were re‐estimated in order to obtain the optimal tree; the procedure was repeated until the likelihood values remained constant. The estimated parameters from the data sets included the Ts/Tv, the pyrimidine/purine transition ratio, the proportion of invariant sites and the α shape parameter of the γ distribution (with eight categories). A final neighbor‐joining tree was constructed using the estimated model parameters and the HKY85 evolution model. The trees generated with several evolution models were compared and the reliability of the phylogenetic trees obtained was evaluated by running 1000 replicates in the bootstrap test [23]. TreeView was used to visualise the phylogenetic trees [24].
Analysis of the phylogenetic signal was carried out by plotting the number of transitions and transversions versus divergence using DAMBE [15] and performing likelihood mapping analysis with the TREE PUZZLE program for each data set. Likelihood mapping analysis [25] was carried out with 10,000 random quartets, and using the TN93 model and γ distribution rates across the sites.
2.4Nucleotide sequence accession numbers
The following FCoV reference strains were included in the phylogenetic analysis: X56496, X13921, AB086902, AB086903, AB086881, X90570, X90572, X90573, X90574, X90575, X90577, X90578. The nucleotide sequences reported in this study have been submitted to the GenBank and assigned accession numbers AY204523–AY204531.
2.5Statistical analysis
Results are presented as mean±1 S.D. Comparisons of quantitative parameters were made using the non‐parametric Kruskal–Wallis or Mann–Whitney U‐test or Student's t‐test. Analysis was carried out with SPSS 11.0 software (SPSS, Chicago, IL, USA).
Genetic diversity was evaluated using percentage identity values between sequence pairs calculated by the Clustal W algorithm included in the DNA STAR software package (Lasergene, Madison, WI, USA).
3Results and discussion
The theoretical concept of quasispecies was first described by Eigen [6] and Eigen et al. [26], and has been demonstrated to be suitable for describing the behaviour of the RNA virus at the molecular level. The quasispecies structure of some RNA viruses has remarkable biological implications because, during viral replication, dynamic mutants with considerable adaptability are continuously generated. Human immunodeficiency virus type 1 is one of the most dramatic examples of viral quasispecies, but similar observations have been made for many virus populations [27]. In coronaviruses, the genomic complexity and the quasispecies nature have been well documented mainly for the murine hepatitis virus, the study model of the genus [28]. Some studies have demonstrated that FCoVs can also consist of a complex of heterogeneous variants in vivo and in vitro [[13], [29]]. The main purpose of this study was to understand the heterogeneity of FCoVs in vivo analysing the genomic complexity of strains from both healthy and sick cats. The quasispecies composition of FCoVs was evaluated in SSCP analysis by testing PCR fragments from the N and ORF7b regions. The SSCP assay has been shown to be a reliable tool for evaluating the heterogeneity of RNA viruses; for each lane, the number of bands visible after electrophoresis of the amplicons is proportional to the number of viral subpopulations included in a given sample. We also analysed the viral tissue distribution in the sick cats. In cat 419, the virus was seen in the following organs: kidneys, spleen, brain cortex and large intestine, while in cat 420, we detected the viruses in all the organs analysed except the brain cortex and the lungs; in cat 453, the viruses were distributed in the pericardium, lungs and liver (Table 1). Cats with FIP demonstrated more variability in their SSCP patterns than healthy ones. Our anamnestic data supported the hypothesis that cat 419 and cat 420 became infected by contact with carrier cats and the same viral strain evolved differently within the diseased animals acquiring more genetic complexity. Our results showed that quasispecies composition differs between organs in the same cat and the heterogeneity of the FCoV genome was correlated with the seriousness of the clinical forms and the lesions of the organs. In fact, the highest variability in SSCP patterns was observed in cat 420 affected by systemic FIP and this was more obvious in its seriously degenerated liver and lymph nodes. The viral tissue distributions as well the genomic complexity were consistent with the seriousness of the disease, as proven by a higher distribution of the viruses in cat 420. These results confirm the biological relevance of the quasispecies; the high mutation rate of coronaviruses contributes to their rapid evolution with the selection of new variants [30]. In some cases the new variants can escape from the immune system and are more advantageous giving rise to more serious lesions such as those observed in the liver of cat 420. Higher variability was observed in the sick cats with acute disease, but, in contrast, more homogeneity was observed in the healthy cats with persistent infection. The two genomic regions analysed in this study showed different levels of variation. The N region demonstrated a stronger heterogeneity as compared to ORF7b, as has previously been described by other authors [13]. The limited presence of quasispecies was seen in the ORF7b region and the SSCP patterns were similar for most samples examined. In contrast, higher variability was seen in the N region both in the same cat and between different cats (t=−3.0866; P=0.006; Table 2).
Table 1.
Viral tissue distribution in diseased cats
| Diseased cat | Infected organs |
| 419 | kidneys, spleen, brain cortex, large intestine |
| 420 | myocardium, pericardium, liver, spleen, kidneys, small and large intestines, pancreas, mesenteric lymph nodes |
| 453 | pericardium, lungs, liver |
Table 2.
Comparison of the genetic diversity of N and ORF7b genes
| Gene | Mean |
| N | 89.33±4.85 |
| ORF7b | 94.80±3.07 |
N amplicons from the liver and mesenteric lymph nodes of cat 420, which showed the highest variability (Fig. 1), were cloned to identify the different viral subpopulations and 10 clones randomly chosen for each specimen were analysed in an SSCP assay. The patterns of the clones from the liver showed a significant variability with respect to the clones from the lymph nodes (U=6.000; P=0.000; Table 3) while in the same organ, the quasispecies composition was homogeneous (Table 4).
Figure 1.
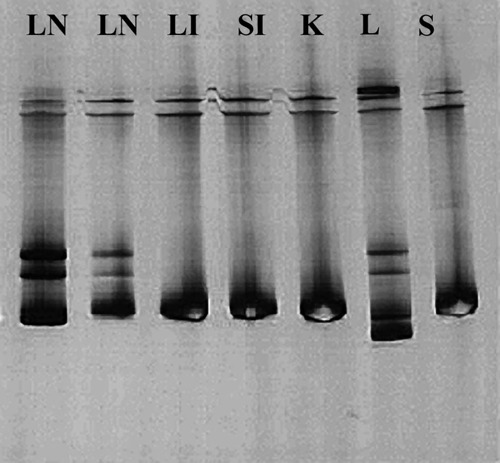
SSCP patterns of N amplicons of the strains from cat 420. Lymph nodes (LN) and liver (L) exhibited the highest variability in their SSCP band patterns as compared to other organs (LI=large intestine; SI=small intestine; K=kidney, S=spleen).
Table 3.
Comparison of the genetic diversity between viral clones from the liver and the lymph nodes of cat 420
| Organ | Mean |
| Liver | 87.97±7.67 |
| Lymph nodes | 99.70±0.15 |
| Total | 88.87±8.01 |
Table 4.
Comparison of the genetic diversity of the viral clones inside each organ of cat 420
| Organ | Clone | Mean | Kruskal–Wallis χ2 | |
| Liver | 1 | 88.60±9.47 | ||
| Liver | 2 | 88.70±9.27 | ||
| Liver | 3 | 88.89±9.22 | ||
| Liver | 4 | 86.04±8.33 | ||
| Liver | 6 | 89.49±3.92 | ||
| Liver | 7 | 89.42±3.73 | ||
| Liver | 8 | 85.70±7.90 | ||
| Liver | 9 | 88.47±9.30 | ||
| Liver | 10 | 86.41±8.29 | 0.901 | P=0.901 |
| Lymph nodes | 1, 4, 6, 7 | 99.80±0.00 | ||
| Lymph nodes | 2, 5, 8 | 99.65±0.21 | ||
| Lymph nodes | 3, 9, 10 | 99.65±0.21 | 1.250 | P=0.535 |
To determine the relationship between the FCoVs detected in healthy and in sick cats, phylogenetic analysis was performed on nucleotide sequences of the N and the ORF7b regions.
Nested PCR amplification and sequencing of the N and the ORF7b regions yielded cDNA fragments of 445 (N), 442 (N region of avirulent strains) and 490 (ORF7b) bp in size.
The cloned liver sequences showed two main viral subpopulations: one population with an intact N PCR product of 445 bp while the other population had a deletion of 53 nucleotides leading to an alteration of the reading frame which introduced stop codons. We thought that this deletion arose during transcription because the viral RNA polymerase ‘skipped’ certain regions and the predicted secondary structure of the RNA genome showed a ‘looping out’ in correspondence with nucleotide 129, where the deletion began (data not shown). We speculated that these mutants containing deletions are not viable. Among the intact viral subpopulations, the divergence ranged from 0.9 to 13.8%. Lymph node clones showed more homogeneity with divergence varying from 0.2 to 0.4%.
Multiple alignments with the nucleotide sequences of the N and the ORF7b regions were generated and sequence comparison with reference strains was performed.
The N region alignment showed 100% nucleotide similarity between avirulent strains 352C, 352S, 352N and 368; strain 376 differed from other avirulent strains by 0.5%.
The other strains showed a sequence similarity which varied from 84.9 to 99.8%. Most of the nucleotide changes were point mutations, except one triplet deletion event detected in all avirulent strains at position 356–358 nt as well in consensus strain 453 at position 314–316 nt. As a consequence, the deleted amino acid sequences lack one residue in positions 119 and 104, respectively.
The ORF7b region alignment showed complete identity among avirulent strains 352C, 352S, 352N, 368 and 376; sequence similarity among the other strains ranged from 92.2 to 99.6%. No insertions and deletions were observed; this is not in accordance with preceding studies which demonstrated a good correlation between deletions in the 7b gene and the attenuation of virulence [31].
To investigate the phylogenetic signal, the numbers of transitions and transversions were plotted against the Kimura two‐parameter distance with DAMBE, but no saturation was observed (data not shown). The graphs showed a linear correlation for transitions and transversions over the entire range of divergence. On the other hand, to visualise noise in each data set sequence, we performed a likelihood mapping analysis using the TREE PUZZLE program. 20.2 and 14.4% of the random quartets for the N and the ORF7b region, respectively, fell in the centre of the triangle which represents a star‐like phylogeny (Fig. 2); this implies that the alignments gave a completely resolved phylogeny only in certain parts of the tree. Most of the dots in both alignments (76.6% for N and 80% for ORF7b) were equally distributed in the three corners of the triangle representing well‐resolved phylogeny.
Figure 2.
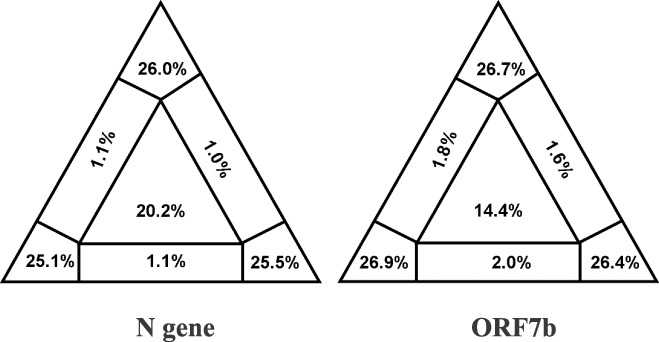
Likelihood mapping for the N and ORF7b fragments. Numbers of quartets in the corners represent fully resolved phylogeny.
Table 5 summarises the maximum likelihood (ML) parameters for each alignment data set. For both sequence alignments, N and ORF7b, the parameter α of the γ distribution is <1, which results in an L‐shaped distribution of the rates along the sites. α<1 describes a situation of strong heterogeneity where few sites have high substitution rates and most of the sites are constant; in fact, the percentage of the invariable sites is 67.2% for the N and 72.9% for the ORF7b data set.
Table 5.
ML parameters estimated from data set
| Gene | Number of strains | Ts/Tv ratio (S.E.M.) | α (S.E.M.) | Pyrimidine/purine transition ratio (S.E.M.) | Proportion of constant sites (%) |
| N | 21 | 2.74 (0.34) | 0.55 (0.09) | 2.11 (0.29) | 67.2 |
| ORF7b | 17 | 4.79 (1.12) | 0.38 (0.08) | 1.66 (0.36) | 72.9 |
Phylogenetic trees obtained with different evolution models showed a similar topology. The trees in Fig. 3 were constructed using neighbour‐joining and the HKY85 evolution model; the ML parameters were estimated from data sets and used for tree reconstruction. The tree obtained analysing the N region (Fig. 3A) showed three main clusters supported by a bootstrap value of 100%. One cluster included the five avirulent strains from healthy cats. The second cluster included the strains from cat 419 and most of the liver clones and lymph node clones from cat 420. The third cluster included two liver clones from cat 420 and the reference strain FIPV‐791146.
Figure 3.
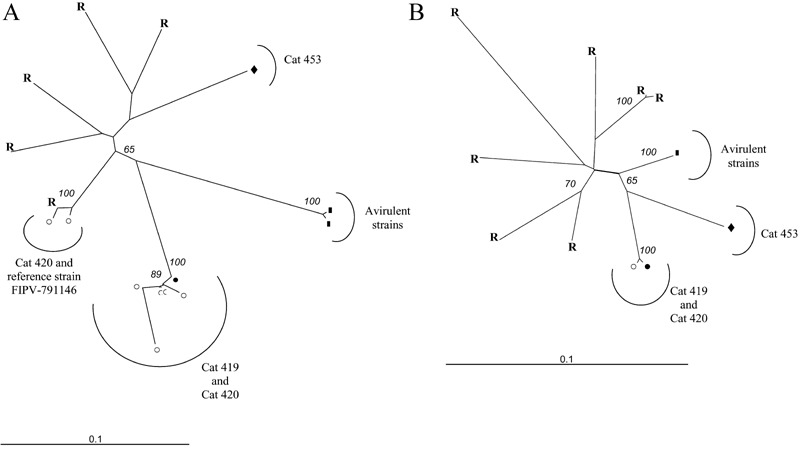
Phylogenetic trees based on alignments of the sequences of the N (A) and the ORF7b (B) regions. Bootstrap values equal to or greater than 65% are indicated. R: reference strains, ▄: avirulent strains, •: cat 419, ◯: cat 420, ♦: cat 453.
The phylogenetic tree built with the sequences of the ORF7b region (Fig. 3B) showed a separation between the reference strains and the strains which were the object of this study; avirulent strains formed a distinct cluster supported by a bootstrap value of 100% and inside the cluster of virulent strains, a separation is evident between viruses from strains 419, 420 and 453.
Phylogenetic analysis of the N sequences showed that virulent strains from the same environment are highly correlated, but we also observed that some clones of cat 420 formed a distinct group with reference strain FIPV‐791146; on the basis of this result, we could speculate that this correlation depends on the virulence. This is in contrast with other reports which revealed a strict correlation between different biotypes from the same geographic background [4]. In fact, in our study, the virulent strains 420 and FIPV‐791146 were shown to be closely related despite their different geographical origin. This theory is confirmed by phylogenetic analysis of the ORF7b sequences. In fact, in spite of different geographic origins, virulent strains 419, 420 and 453 belong to the same cluster supported by a high statistical value. Furthermore, the percentage of similarity between different biotypes from the same area was shown to be lower than those of the same biotype from different areas.
In conclusion, this study provided further information about the genetic patterns of FCoVs; it has been shown that quasispecies composition is correlated with the seriousness of the clinical form and lesions in the organs. Phylogenetic analysis showed an evident separation among avirulent strains producing intestinal infection and virulent strains responsible for FIP; this could be due to the increase of the virulence produced by the genomic mutations. Further investigation will clarify the biological significance of the mutations detected in the genome of FCoVs from naturally infected cats.
References
- [1]. De Vries, A.A.F. , Horzinek, M.C. , Rottier, P.J.M. , De Groot, R.J. (1997) The genome organization of the Nidovirales: similarities and differences between Arteri‐, Toro‐, and Coronaviruses. Semin. Virol. 8, 33–47. [DOI] [PMC free article] [PubMed] [Google Scholar]
- [2]. Pedersen, N.C. , Boyle, J.F. , Floyd, K. (1981) Infection studies in kittens using feline infectious peritonitis virus propagated in cell culture. Am. J. Vet. Res. 42, 363–367. [PubMed] [Google Scholar]
- [3]. Horzinek, M.C. and Lutz H. (2001) An update of feline infectious peritonitis. Vet. Sci. Tomorrow, 1, http://www.vetscite.org/cgi-bin/pw.exe/vst/reviews/index_1_0800.htm.
- [4]. Vennema, H. , Poland, A. , Foley, J. , Pedersen, N.C. (1998) Feline infectious peritonitis viruses arise by mutation from endemic feline enteric coronaviruses. Virology 243, 150–157. [DOI] [PMC free article] [PubMed] [Google Scholar]
- [5]. Herrewegh, A.A.P.M. , Mähler, M. , Hedrich, H.J. , Haagmans, B.L. , Egberink, H.F. , Horzinek, M.C. , Rottier, P.J.M. , De Groot, R.J. (1997) Persistence and evolution of feline coronavirus in a closed cat breeding colony. Virology 234, 349–363. [DOI] [PMC free article] [PubMed] [Google Scholar]
- [6]. Eigen, M. (1971) Self‐organization of matter and the evolution of biological macromolecules. Naturwissenschaften 58, 465–523. [DOI] [PubMed] [Google Scholar]
- [7]. Pedersen, N.C. (1987) Virologic and immunologic aspects of feline infectious peritonitis virus infection. Adv. Exp. Med. Biol. 218, 529–550. [DOI] [PubMed] [Google Scholar]
- [8]. Horzinek, M.C. , Herrewegh, A.A.P.M. , De Groot, R.J. (1995) Perspectives on feline coronavirus evolution. Feline Pract. 23 (3), 34–39. [Google Scholar]
- [9]. Domingo, E. , Escarmis, C. , Sevilla, N. , Moya, A. , Elena, S.F. , Quer, J. , Novella, I.S. , Holland, J.J. (1996) Basic concepts in RNA virus evolution. FASEB J. 10, 859–864. [DOI] [PubMed] [Google Scholar]
- [10]. Orita, M. , Iwahana, H. , Kanazawa, H. , Hayashi, K. , Sekiya, T. (1989) Detection of polymorphisms of human DNA by gel electrophoresis as single‐strand conformation polymorphisms. Proc. Natl. Acad. Sci. USA 86, 2766–2770. [DOI] [PMC free article] [PubMed] [Google Scholar]
- [11]. Orita, M. , Suzuki, Y. , Sekiya, T. , Hayashi, K. (1989) Rapid and sensitive detection of point mutations and DNA polymorphims using the polymerase chain reaction. Genomics 5, 874–879. [DOI] [PubMed] [Google Scholar]
- [12]. Gut, M. , Leutenegger, C.M. , Huder, J.B. , Pedersen, N.C. , Lutz, H. (1999) One‐tube fluorogenic reverse transcription‐polymerase chain reaction for the quantitation of feline coronaviruses. J. Virol. Methods 77, 37–46. [DOI] [PMC free article] [PubMed] [Google Scholar]
- [13]. Kiss, I. , Kecskeméti, S. , Tanyi, J. , Klingeborn, B. , Belák, S. (2000) Preliminary studies of feline coronavirus distribution in naturally and experimentally infected cats. Res. Vet. Sci. 68, 237–242. [DOI] [PMC free article] [PubMed] [Google Scholar]
- [14]. Thompson, J.D. , Higgins, D.G. , Gibson, T.J. (1994) CLUSTAL W: improving the sensitivity of progressive multiple sequence alignment through sequence weighting, position‐specific gap penalties and weight matrix choice. Nucleic Acids Res. 22, 4673–4680. [DOI] [PMC free article] [PubMed] [Google Scholar]
- [15]. Xia, X. , Xie, Z. (2001) DAMBE: software package for data analysis in molecular biology and evolution. J. Hered. 92, 371–373. [DOI] [PubMed] [Google Scholar]
- [16]. Nicholas, K.B., Nicholas Jr., H.B., Deerfield, D.W. GeneDoc: analysis and visualization of genetic variation Embnew. News 4 1997 14
- [17]. Swofford, D.L. (2001) PAUP* Phylogenetic Analysis Using Parsimony (*and other methods) 4.0b10. Sinauer Associates, Sunderland, MA.
- [18]. Felsenstein, J. (1984) Distance methods for inferring phylogenies: A justification. Evolution 38, 16–24. [DOI] [PubMed] [Google Scholar]
- [19]. Hasegawa, M. , Kishino, H. , Yano, T.‐A. (1985) Dating of the human‐ape splitting by a molecular clock of michondrial DNA. J. Mol. Evol. 22, 160–174. [DOI] [PubMed] [Google Scholar]
- [20]. Tamura, K. , Nei, M. (1993) Estimation of the number of nucleotide substitutions in the control region of mitochondrial DNA in humans and chimpanzees. Mol. Biol. Evol. 10, 512–526. [DOI] [PubMed] [Google Scholar]
- [21]. Felsenstein, J. (2001) PHYLIP: Phylogenetic Inference Package 3.6 (alpha3). Distributed by the author, Department of Genetics, University of Washington, Seattle, WA.
- [22]. Strimmer, K. , von Haeseler, A. (1996) Quartet puzzling: A quartet maximum‐likelihood method for reconstructing tree topologies. Mol. Biol. Evol. 13, 964–969. [Google Scholar]
- [23]. Felsenstein, J. (1985) Confidence limits on phylogenies: an approach using the bootstrap. Evolution 39, 783–791. [DOI] [PubMed] [Google Scholar]
- [24]. Page, R.D. (1996) TreeView: an application to display phylogenetic trees on personal computers. Mol. Biol. Evol. 4, 406–425. [DOI] [PubMed] [Google Scholar]
- [25]. Strimmer, K. , von Haeseler, A. (1997) Likelihood‐mapping: A simple method to visualize phylogenetic content of a sequence alignment. Proc. Natl. Acad. Sci. USA 94, 6815–6819. [DOI] [PMC free article] [PubMed] [Google Scholar]
- [26]. Eigen, E. and Biebricher, C. (1988) Sequence space and quasispecies distribution. In: RNA Genetics, Vol. 3 (Domingo, E., Holland, J.J. and Ahlquist, P., Eds.), pp. 211–245. CRC Press, Boca Raton, FL.
- [27]. Domingo, E. , Holland, J.J. (1997) RNA virus mutations and fitness for survival. Annu. Rev. Microbiol. 51, 151–178. [DOI] [PubMed] [Google Scholar]
- [28]. Makino, S. , Keck, J.G. , Stohlman, S.A. , Lai, M.M.C. (1986) High‐frequency RNA recombination of murine coronaviruses. J. Virol. 57, 729–739. [DOI] [PMC free article] [PubMed] [Google Scholar]
- [29]. Gunn‐Moore, D.A. , Gunn‐Moore, F.J. , Gruffydd‐Jones, T.J. , Harbour, D.A. (1999) Detection of FCoV quasispecies using denaturing gel electrophoresis. Vet. Microbiol. 69, 127–130. [DOI] [PMC free article] [PubMed] [Google Scholar]
- [30]. Domingo, E. (1998) Quasispecies and the implication for virus persistence and escape. Clin. Diagn. Virol. 10, 97–101. [DOI] [PMC free article] [PubMed] [Google Scholar]
- [31]. Herrewegh, A.A.P.M. , Vennema, H. , Horzinek, M.C. , Rottier, P.J.M. , De Groot, R.J. (1995) The molecular genetics of feline coronaviruses: comparative sequence analysis of the ORF 7a/7b transcription unit of different biotypes. Virology 212, 622–631. [DOI] [PMC free article] [PubMed] [Google Scholar]