

Abstract
We used cDNA microarrays to identify differentially expressed genes in mice in response to infections with influenza virus A/PR/8/34 (H1N1) and Streptococcus pneumoniae. Expression microarray analysis showed up-regulation and down-regulation of many genes involved in the defense, inflammatory response and intracellular signaling pathways including chemokine, apoptosis, MAPK, Notch, Jak-STAT, T-cell receptor and complement and coagulation cascades. We have revealed signature patterns of gene expression in mice infected with two different classes of pathogens: influenza virus A and S. pneumoniae. Quantitative real-time RT-PCR results confirmed microarray results for most of the genes tested. These studies document clear differences in gene expression profiles between mice infected with influenza virus A and S. pneumoniae. Identification of genes that are differentially expressed after respiratory infections can provide insights into the mechanisms by which the host interacts with different pathogens, useful information about stage of diseases and selection of suitable targets for early diagnosis and treatments. The advantage of this novel approach is that the detection of pathogens is based on the differences in host gene expression profiles in response to different pathogens instead of detecting pathogens directly.
Keywords: Microarray profiles, Influenza virus A, Streptococcus pneumoniae; Host response, Intracellular signaling pathways, Signature patterns, Mouse model
1. Introduction
One of the major difficulties in early diagnosis of respiratory infectious diseases lies in the presentation of patients with similar symptoms that can be caused by a wide variety of pathogens, some of which cause minor self-limiting illnesses while others can cause life-threatening complications. The 2003 epidemic of severe acute respiratory syndrome (SARS) coronavirus and the recent outbreaks of a highly pathogenic avian influenza virus A (H5N1) among poultry in eight Asian countries are reminders of the ever-present risks from respiratory pathogens [1]. Based on the WHO report of May 29, 2006, there have been 224 of laboratory-confirmed human cases and 127 deaths mostly in Asia caused by avian influenza A (H5N1) since December 2003 (http://www.who.int/en/). Deaths occurred in otherwise healthy young individuals, which is reminiscent of the 1918 Spanish influenza pandemic. Infection with influenza viruses can result in illness ranging from mild to severe and life-threatening complications [2], [3]. Influenza virus A belongs to the Orthomyxoviridae family of segmented, negative-stranded RNA viruses and has the potential to cause pandemics [4], [5]. The bacterium Streptococcus pneumoniae is a major cause of bacterial pneumonia, meningitis, otitis media, and sinusitis. Influenza virus A and S. pneumoniae represent two different classes of respiratory disease pathogens. Because influenza, pneumonia and other respiratory infections can cause similar flu-like symptoms, it is difficult to tell the difference between them based on symptoms alone. There are many subtypes of influenza viruses and many serotypes of pneumococci, hence diagnosis of so many different agents directly for early detection and differentiation of etiologic agents does not seem practical. During a respiratory illness outbreak such as influenza pandemics, early detection of respiratory pathogens can be very important in determining the cause of the outbreak.
Microarray technology has been widely used in the fields of oncology, infectious disease, and toxicology [6], [7]. Differences in gene expression are responsible for morphological and phenotypic differences as well as indicative of cellular responses to environmental stimuli and perturbations. The complex host-pathogen interaction is the underlying basis of infectious diseases. Microarray profiles for microbial infection could lead to the better understanding of host-pathogen interactions and the identification of biomarkers for specific microbial infection and ultimately yield important diagnostic tools [8]. Recently, it has been demonstrated that cDNA microarrays can be used to characterize exposure of animals to specific chemical classes [9], which provides the basis for development of similar expression profiles of animals exposed to different pathogens.
A mouse model for infection with influenza virus A/PR/8/34 and S. pneumoniae was introduced recently [10], [11]. Microarray analysis performed on lung tissues isolated from mice infected with a recombinant influenza A/WSN/33 virus expressing HA and NA genes of the 1918 pandemic virus [12] and mice infected with pneumonia virus of mice [13] showed activation of many genes involved in the inflammatory response including cytokine genes. The combination of microarray and the use of model animals is a suitable strategy to explore the gene expression profiles and should provide a useful system to identify new targets for detection of respiratory pathogens and clinical investigation. Detection of differentially expressed host genes in response to respiratory infections could be a valuable tool for the differential diagnosis of diseases particularly in the early stages of infection. Identification of mouse model biomarkers for respiratory tract diseases is an important step towards identification of human biomarkers that could eventually lead to tests for early diagnosis of respiratory tract infections.
In this communication, we report the identification of differentially expressed genes in mice in response to infections with influenza virus A/PR/8/34 (H1N1) and S. pneumoniae and reveal signature patterns of gene expression in mice infected with these two pathogens. Expression microarray analysis showed up-regulation and down-regulation of many genes involved in the defense, inflammatory response and intracellular signaling pathways including chemokine, apoptosis, MAPK, Notch, Jak-STAT, T-cell receptor and complement and coagulation cascades.
2. Materials and methods
2.1. Infectious agents
The influenza virus A/Puerto Rico/8/34 (H1N1) was purchased from American Type Culture Collection (ATCC; Manassas, VA) and grown in MDCK cells. Streptococcus pneumoniae was purchased from ATCC and grown in Todd–Hewitt broth (Difco Laboratories).
2.2. Infection of mice with influenza virus A and S. pneumoniae
All experiments with infected mice were carried out in biosafety level 2 facilities in Animal Resource Center at University of Southern California. Mice were cared for in accordance with the guidelines of the Committee on Care and Use of Laboratory Animals (Institute of Laboratory Animal Resources, National Research Council). Healthy female BALB/c ByJ mice (8–10 weeks old; Jackson Laboratories, Bar Harbor, Maine) were randomly assigned to five groups (4 mice per group for each pathogen at each time point and one control group). All experimental procedures were done while mice were under general anesthesia with inhaled isoflurane 2.5% (Baxter Healthcare). Infectious agents were diluted in sterile PBS to 750 TCID50 (median tissue culture infective dose) for influenza virus A/PR/8/34 and 1.25 × 10⁵ cfu for S. pneumoniae and administered intranasally in a volume of 100 μl (50 μl per nostril) to anesthetized mice held in an upright position. Mice were monitored at least twice a day for illness and mortality.
2.3. Isolation of total RNA from mouse splenic cells
At day 1 and day 7 after infection, mice from each group were humanely killed after euthanasia through CO2 inhalation. Spleen was removed from mice of each group, pooled and transferred to a small dish containing RPMI1640. Medium was injected into the spleen to release splenic cells and the cell suspension was centrifuged at 1200 rpm for 5 min. The medium was aspirated and cell pellet was resuspended in 30 ml of new medium. Ten milliliters of Histopaque 1077 were carefully injected beneath cell suspension and the cell suspension was centrifuged at 1700 rpm for 20 min. Everything except the pellet was poured into a clean 50-ml conical tube. Sterile PBS was added to the supernatant to make 50 ml and the mixture was counted and centrifuged for 5 min at 1200 rpm to pellet cells. Total RNA was isolated from splenic cells by using the Trizol Reagent (Invitrogen) in accordance with the manufacturer's instructions. Total RNAs were further purified using RNeasy Mini Kit (Qiagen) following the manufacturer's protocol.
2.4. cDNA microarray
The cDNA microarrays used in this study were generated in-house as described previously [14]. Briefly, the vector sequence-specific primers flanking the inserted genes were used to amplify 15,000 mouse cDNA inserts. Purified PCR products were dissolved in 3 × SSC at 200–500 ng/μl for printing the microarrays on microscopy glass slides (75 × 25 mm) coated with poly-l-lysine. There were 192 controls on each cDNA microarray, including 96 housekeeping genes to control expression ratios, 24 Cot-1 DNAs to control for cross-hybridization with repetitive sequences, 24 genomic DNAs to control for genomic hybridization, 24 vector DNAs to control plasmid contamination, and 24 non-DNA spots to control for background.
2.5. Probe preparation and microarray hybridization
Total RNAs isolated from uninfected or infected mice were labeled separately with Cyanine 3-dUTP (Cy3) or Cyanine 5-dUTP (Cy5) using a Micromax Direct Labeling Kit (PerkinElmer Life Sciences Inc., Boston, MA). Unincorporated Cy3- and Cy5-linked dUTPs were removed by using a Microcon YM-100 Centrifugal Filter Unit (Millipore, Boston, MA). The Cy5-labeled (infected) and Cy3-labeled (uninfected) probes were mixed, and probe volume was reduced to near dryness by using a speed vacuum. The labeled probe mixtures were resuspended in 45 μl of hybridization buffer per microarray slide, heated at 90 °C for 2 min, cooled at 4 °C for 10 s and centrifuged for 5 min at high speed to pellet any particulate matter. Forty microliters of probe mixture were added onto the edge of the cover slip. Microarray slides were incubated in a dark, humid chamber for 16 h at 65 °C. The microarray slides were washed once for 15 minutes in 0.06× SSC plus 0.01% SDS, and once for 15 minutes in 0.06× SSC with gentle agitation on an orbital shaker at room temperature. The slides were span for 2 min at 3000 × g using a swinging bucket rotor to dry the slides.
2.6. Data analysis
Fluorescent images of microarrays were acquired for both fluorescent dyes by ScanArray Express Laser Scanner (PerkinElmer). High-quality microarray image data were digitized for construction of gene expression database including individual database for each microarray raw data and a user-friendly master database. All databases included gene identification number, gene name, gene description, expression signal intensities, mean values, standard deviations, signal to noise ratios, array qualities, hybridization qualities and many others. Image segmentation, target detection, and ratio calibration methods were used to report the expression ratios of each gene on the slides [15]. The ratio calibration was performed based on pre-selected internal control genes, of which ratios were normalized close to the value of 1.0. A 99% confidence interval was used to determine significantly up and down expressed genes [15]. The complex images were converted into numerical data for statistic analysis of the expression levels. Data from the hybridization experiment were viewed as a normalized ratio (Cy5/Cy3) in which significant deviations from 1 (no change) are indicative of increased (>1.5) or decreased (<0.66) levels of gene expression in infected mice relative to uninfected mice. To explore the similarity and dissimilarity between samples and genes, supervised clustering algorithms were applied [16], [17]. Briefly, genes in each microarray experiment were first filtered according to their measurement quality. After data filtration, high quality and differentially expressed genes were subjected to clustering software developed by Xueyan Bai and Yan A. Su based on the local maximal microarray cluster method [18] to visualize relationships between the genes and between the experiments.
2.7. Real-time quantitative RT-PCR
Eight of the genes that were differentially expressed in response to infections were validated by real-time quantitative RT-PCR analysis. Fluorogenic probes and gene specific primers for Gnai2, Gle1l, Chi3l3, Scamp1, Ier5, Bop1, Cpsf2, Fen1 and the endogenous control α-globin were purchased from Applied Biosystems (Applied Biosystems, Foster City, CA). The gene names, sequences for primers and probes, and predicted product sizes are shown in Table 1. The gene-specific probes containing a 5′ reporter, 6-carboxyfluorescein (FAM), and a 3′ nonfluorescent Blackhole Quencher were used to detect the amplified products. The control gene probe was labeled with VIC at the 5′ end as a reporter and another dye TAMRA (N,N,N′,N′-tetramethyl-6-carboxyrhodamine) at 3′ end as a quencher.
Table 1.
Specific primers, TaqMan probes and RT-PCR products of mouse genes for real-time quantitative RT-PCR
| Gene | Primers | Sequences (5′ to 3′) | Product size (bp) |
|---|---|---|---|
| Gnai2 | Sense | GGTGCTGGCTGAGGATGA | 120 |
| Anti-sense | TCCTTCTTGTTGAGGAAGAG | ||
| Probea | FAM-CATGCATGAGAGCATGAAGCTGT-Blackhole | ||
| Gle1l | Sense | TTCATCAATACCACTCAGGCA | 116 |
| Anti-sense | GGAGTGTACATGACTTTGTAC | ||
| Probea | FAM-CTGTCACCATTGAAGGACCATCC-Blackhole | ||
| Chi313 | Sense | TGAGTGACCCTTCTAAGACTG | 103 |
| Anti-sense | GGCTCCTTCATTCAGAAATGTA | ||
| Probea | FAM-AGTACTGGCCCACCAGGAAAGTA-Blackhole | ||
| Scamp1 | Sense | GGTGCTGGCTGAGGATGA | 120 |
| Anti-sense | TCCTTCTTGTTGAGGAAGAG | ||
| Probea | FAM-CATGCATGAGAGCATGAAGCTGT-Blackhole | ||
| Ier5 | Sense | GGTGCTGGCTGAGGATGA | 120 |
| Anti-sense | TCCTTCTTGTTGAGGAAGAG | ||
| Probea | FAM-CATGCATGAGAGCATGAAGCTGT-Blackhole | ||
| Bop1 | Sense | GGTGCTGGCTGAGGATGA | 120 |
| Anti-sense | TCCTTCTTGTTGAGGAAGAG | ||
| Probea | FAM-CATGCATGAGAGCATGAAGCTGT-Blackhole | ||
| Cpsf2 | Sense | GGTGCTGGCTGAGGATGA | 120 |
| Anti-sense | TCCTTCTTGTTGAGGAAGAG | ||
| Probea | FAM-CATGCATGAGAGCATGAAGCTGT-Blackhole | ||
| Fen1 | Sense | CCAGAGAACTGGCTCCACAA | 93 |
| Anti-sense | TGGCTCGCTCCACTTCAGC | ||
| Probea | FAM-CTTCCTGGAGCCAGAAGTACTGG-Blackhole | ||
| α-globin | Sense | CCACCACCAAGACCTACTTTC | 154 |
| Anti-sense | GCATGCAGGTCGCTCAGAG | ||
| Probeb | VIC-AGCCACGGCTCTGCCCAGGTC-TAMRA |
Gene-specific probes containing a 5′ reporter, 6-carboxyfluorescein (FAM), and a 3′ non fluorescent quencher (Blackhole) were used to detect the amplified products.
The control gene probe was labeled with VIC at the 5′ end as a reporter and another dye TAMRA [N,N,N′,N′-tetramethyl-6-carboxyrhodamine]) at 3′ end acts as a quencher.
RNA samples were amplified and analyzed in the 7500 Real Time PCR System (Applied Biosystems) with TaqMan One-Step RT-PCR master mixture (Applied Biosystems). Total RNA (0.5 μg) isolated from uninfected and infected mouse splenic cells at day 1 was used for real-time quantitative RT-PCR amplification. The reaction mixture contained a total volume of 50 μl including both tested gene and control gene primer pairs at a concentration of 1 μM and tested gene and control gene probes at a concentration of 0.2 μM. The thermal cycling consisted of 48 °C for 30 min for reverse transcription, 95 °C for 10 min for denaturation, and 50 cycles of 95 °C for 15 s and 60 °C for 1 min for amplification. Tested gene amplification results in a signal from the FAM emission wavelength (518 nm) and control gene amplification produces a signal from the VIC emission wavelength (552 nm). A positive RT-PCR is measured by the cycle number required to reach the cycle threshold (C T). The C T is defined as 10 times the standard deviation of the mean baseline emission calculated for PCR cycles 3 to 15 [19]. The formula used to determine the amount of target gene, normalized to a reference gene and relative to a calibrator is: amount of target = 2(−ΔΔC T); where C T is the threshold cycle number and ΔΔC T = [C T, target (unknown sample) − C T, reference (unknown sample)] − [C T, target (calibrator sample) − C T, reference (calibrator sample)] [19].
3. Results
3.1. Global monitoring of gene expression in mice infected with influenza virus A and S. pneumoniae
We used microarray analysis to examine the global gene expression profiles in splenic cells of mice infected with influenza virus A and S. pneumoniae. Spleen is the largest lymphatic system organ that contains germinal centers in which B lymphocytes proliferate, macrophages that ingest and process antigens, and regions that house several kinds of T lymphocytes. Signs of illness such as weight loss and lethargy were measured daily after infection. Symptoms of infection peaked between 2 and 3 days and mice recovered by day 7. Total RNAs isolated from uninfected or infected mice were labeled separately with Cy3-dUTP or Cy5-dUTP and hybridized to cDNA microarray containing 15,000 mouse genes, as described in Section 2. Hybridization intensity for each gene on the microarray was compared with the uninfected control samples. The relative abundance of transcripts from each gene was reflected by the ratio of ‘green’ to ‘red’ fluorescence measured at the array element representing that gene. The greater relative abundance of mRNA in mouse infected with pathogens resulted in a higher ratio of green-labeled to red-labeled copies of the corresponding cDNA. Genes whose relative transcription levels increased by >1.5-fold were considered as up-regulated, and whose relative transcription levels less than 0.66 were considered as down-regulated. Genes whose relative transcription levels were between 0.66 and 1.5 were considered as no change.
Of the 15,000 mouse genes screened, 490 known and unknown genes had a level of expression significantly different as compared with the control group (Ctr) in at least one of the four experimental groups: day 1 and day 7 after infection with influenza virus A (FluD1 and FluD7) and S. pneumoniae (PneD1 and PneD7). Among the 490 identified genes, 285 were known genes, 76 were ESTs with GeneID and 129 were ESTs without GeneID. There were more genes differentially expressed in mice infected with S. pneumoniae than in mice infected with influenza virus A, which suggests more genes may be involved in the host defense against S. pneumoniae infection. We focused our analysis on those genes with available known functions for all microarray studies described in this report. Differentially expressed known genes in response to influenza virus A or S. pneumoniae were sorted into seven groups according to their functions: 127 encoded proteins involved in metabolism, 107 encoded proteins involved in signal transduction, 86 encoded proteins related to protein translation or processing, 85 encoded proteins for transcription or RNA binding/splicing, 37 encoded proteins involved in cell division, 36 encoded structure proteins, and 22 encoded proteins related to defense and immunity ( Fig. 1). As shown in Fig. 1, most of the differentially expressed genes in response to both influenza virus A and S. pneumoniae were involved in metabolism, signal transduction and protein translation.
Fig. 1.
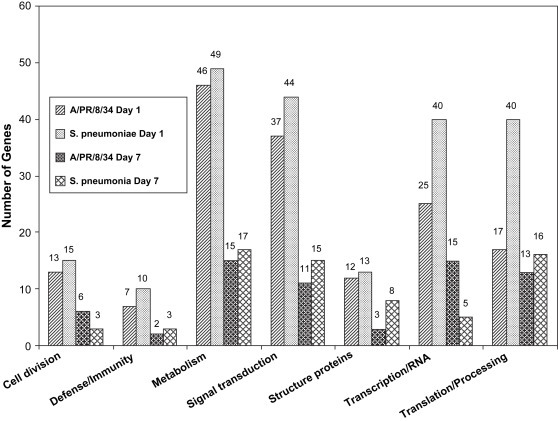
Distribution of functions of genes that were differentially expressed in response to infection of mice with influenza virus A/PR/8/34 and Streptococcus pneumoniae.
Analysis of the microarray results demonstrated that many genes up-regulated following infection with influenza virus A or S. pneumoniae were involved in the defense and intracellular signaling pathways including chemokine, apoptosis, MAPK, Notch, Jak-STAT, T-cell receptor and complement and coagulation cascades. These up-regulated genes included chemokine ligand 6 (Ccl6), sorting nexin 14 (Snx14), Bcl2-associated athanogene 3 (Bag3), NF-kappaB repressing factor (Nkrf), lysyl oxidase (Lox), GATA binding protein 1 (Gata1), fibrinogen alpha polypeptide (Fga), Seh1-like protein (Seh1l), katanin p80 subunit B1 (Katnb1), cell division 42 homolog (Cdc42), deltex 3 homolog (Dtx3), Ras p21 protein activator 2 (Rasa2), thrombomodulin (Thbd), FGF receptor activating protein 1 (Frag1), cytoplasmic FMR1 interacting protein 2 (Cyfip2), matrix metalloproteinase 12 (Mmp12), protein kinase C nu (Prkcn), discs large homolog 1 (Dlgh1), heat shock factor binding protein 1 (Hsbp1) and heat shock protein 1 beta (Hspcb). GATA binding protein 1 modulates cytokine signals through protein-protein interactions, and inhibiting STAT3, thereby regulating the growth and survival of hematopoietic cells and may represent a novel MAPK substrate that plays an essential role in a cytokine-mediated antiapoptotic response. Cell division 42 homolog can mediate insulin signaling to GLUT4 translocation and was activated by IL-3. The Frag1 signal pathway, by linking replication stress surveillance with apoptosis induction, plays a central role in determining whether DNA damage is compatible with cell survival or whether it requires cell elimination. Protein kinase C nu is an important component of signaling pathways downstream from protein kinase C enzymes after B-cell receptor engagement. Discs large homolog 1 may have a role coordinating T-cell receptor/CD28-induced actin-driven T-cell synapse assembly, signal transduction, and effector function. Heat shock protein 1 beta plays a critical role in types I and II interferon pathways and the hsp90 chaperone-dependent MEK1/2-ERK pathway is required for B cell antigen receptor-induced cyclin D2 expression in mature B lymphocytes [20].
Several genes involved in the inflammatory responses and necrosis were identified to be up-regulated following infection with influenza virus A or S. pneumoniae, including that for chitinase 3-like 3 (Chi3l3); matrix metalloproteinase 12 (Mmp12), which plays a role in IL-13-induced inflammation, remodeling in the lung and in T effector polarization [21]; Rho-associated coiled-coil forming kinase 2 (Rock2), which is substantially involved in the pathogenesis of left ventricular remodeling after myocardial infarction and associated with up-regulation of proinflammatory cytokines [22]; thioredoxin interacting protein (Txnip), which is a potentially novel regulator of tumor necrosis factor signaling and inflammation in endothelial cells [23] and is a critical factor for the development and function of natural killer cells in vivo [24]; tumor necrosis factor receptor superfamily member 19 (Tnfrsf19); and chemokine ligand 6 (Ccl6). Both Tnfrsf19 and Ccl6 are involved in the cytokine–cytokine receptor interaction pathway.
Other genes of interest included those up-regulated genes related to transcription/RNA binding and translation/processing following infection with influenza virus A or S. pneumoniae. These genes included general transcription factor II H polypeptide 2 (Gtf2h2), activating transcription factor 7 interacting protein (Atf7ip), cytoplasmic polyadenylation element binding protein 3 (Cpeb3), cytoplasmic polyadenylation element binding protein 4 (Cpeb4), GLE1 RNA export mediator-like (Gle1l), cleavage and polyadenylation specific factor 2 (Cpsf2), cleavage and polyadenylation specific factor 3-like (Cpsf3l), zinc finger protein 239 (Zfp239), RNA polymerase 1-1 (Rpo1-1), transcription factor 19 (Tcf19), metal response element binding transcription factor 2 (Mtf2), ubiquitin specific proteinase 15 (Usp15), ADP-ribosylation factor-like 6 interacting protein 2 (Arl6ip2), SYF2 homolog RNA splicing factor (Syf2), eukaryotic translation elongation factor 1 alpha 1 (Eef1a1), elongation factor Tu GTP binding domain containing 2 (Eftud2), and eukaryotic translation initiation factor 4 gamma 3 (Eif4g3).
Analysis of the microarray results demonstrated that several genes down-regulated following infection with influenza virus A or S. pneumoniae were also involved in the intracellular signaling pathways including stress-related genes glutathione peroxidase 1 (Gpx1), glutathione peroxidase 4 (Gpx4), integrin linked kinase (Ilk), heat shock protein 90 kDa beta member 1 (Hsp90b1), prothymosin alpha (Ptma), mitogen activated protein kinase 3 (Mapk3), Janus kinase 1 (Jak1), protein kinase X-linked (Prkx), attractin (Atrn), and catenin (cadherin associated protein) delta 1 (Ctnnd1). Integrin linked kinase (Ilk) has a role in immune-cell trafficking and survival via modulation of Akt- and Rac-dependent substrates, and have implications for cell recruitment in both homeostatic and pathological processes [25]. Glutathione peroxidase 1 (Gpx1) functions as the primary protection against acute oxidative stress and has a role in modulating molecular pathways involved in both cell death and inflammatory cascades in brain following injury. Glutathione peroxidase 4 (Gpx4) plays a role in vivo in the mechanism of apoptosis induced by oxidative stress that most likely occurs through oxidative damage to mitochondrial phospholipids such as cardiolipin [26]. Heat shock protein 90 kDa beta member 1 (Hsp90b1) is an inflammatory mediator that selectively primes CD8+ T-cell effector function. Prothymosin alpha (Ptma) induces functional maturation and interleukin-12 (IL-12) production by fungus-pulsed dendritic cells through the p38 mitogen-activated protein kinase/nuclear factor (NF)-kappaB-dependent pathway, which occurs by signaling through the myeloid differentiation factor 88-dependent pathway, involving distinct Toll-like receptors [27]. Mapk3 plays a role in regulation of epidermal chemokine expression and skin inflammation [28] as well as many other functions. Janus kinase 1 and 2 (Jak1/2) are client proteins of Hsp90 alpha and beta (Hspcb); Hsp90 and CDC37 play a critical role in types I and II interferon pathways [29]. Jak1 and Jak2 must work cooperatively and their actions are dependent on having normal kinase activity to trigger downstream signals leading to interleukin-3 independent proliferation [30]. Protein kinase X-linked (Prkx) is involved in several signaling pathways including Calcium, WNT, MAPK and Insulin pathways. Catenin is involved in WNT receptor signaling pathway and leukocyte transendothelial migration. Taken together, these results revealed that the most dramatic differences in microarray profiles between infections with influenza virus A and S. pneumoniae were observed at day 1 post-infection, and they suggested that many important events related to intracellular signaling pathways and pathogenesis occur early in infection.
3.2. Identification of genes exclusively up- or down-regulated in response to influenza virus A/PR/8/34 at day 1
To identify genes exclusively up-regulated or down-regulated in mice infected with influenza virus A but unchanged in mice infected with S. pneumoniae at day 1, we analyzed 118 genes that were up-regulated in influenza virus A infected mice and removed genes that were also up-regulated in mice infected with S. pneumoniae. The 49 genes exclusively up-regulated in mice infected with influenza virus A at day 1 were sorted according to their functional groups and listed in Table 2. We identified 13 genes whose expression increased more than 5-fold at day 1 after infection with influenza virus A. These 13 genes included GLE1 RNA export mediator-like (Gle1l), male-specific lethal-2 homolog (Msl2), arginyl-tRNA synthetase-like (Rarsl), Rho GTPase activating protein 21 (Arhgap21), dihydrofolate reductase (Dhfr), feminization 1 homolog a (Fem1a), mitochondrial ribosomal protein L48 (Mrpl48), chitinase 3-like 3 (Chi3l3), Rab1 gene (member of Ras oncogene family), filamin beta (Flnb), ribosomal protein S4 X-linked (Rps4x), thioredoxin domain containing 4 (Txndc4), and flap structure specific endonuclease 1 (Fen1). Chi3l3 gene encodes a macrophage protein that is transiently expressed during inflammation and involved in inflammatory response [31]. Fen1 is a structure-specific endonuclease implicated for nucleotide excision repair [32].
Table 2.
Genes exclusively up-regulated in response to influenza virus A/PR/8/34 at day 1
| LocusLinka | FluD1b/Ctrc | Gene name | Gene description |
|---|---|---|---|
| Cell division | |||
| 17134 | 2.21 | Mafg | v-maf musculoaponeurotic fibrosarcoma oncogene family, protein G |
| 74187 | 1.91 | Katnb1 | Katanin p80 (WD40-containing) subunit B 1 |
| Defense/immunity | |||
| 12655 | 6.31 | Chi3l3 | Chitinase 3-like 3 |
| 224742 | 2.08 | Abcf1 | ATP-binding cassette, sub-family F (GCN20), member 1 |
| 20305 | 1.60 | Ccl6 | Chemokine (C-C motif) ligand 6 |
| Metabolism | |||
| 13361 | 9.47 | Dhfr | Dihydrofolate reductase |
| 76299 | 5.34 | Txndc4 | Thioredoxin domain containing 4 (endoplasmic reticulum) |
| 14156 | 5.10 | Fen1 | Flap structure specific endonuclease 1 |
| 68197 | 3.41 | Ndufc2 | NADH dehydrogenase (ubiquinone) 1, subcomplex unknown, 2 |
| 14866 | 2.62 | Gstm5 | Glutathione S-transferase, mu 5 |
| 18805 | 2.57 | Pld1 | Phospholipase D1 |
| 66859 | 2.52 | Slc16a9 | Solute carrier family 16 (monocarboxylic acid transporters), member 9 |
| 13074 | 2.13 | Cyp17a1 | Cytochrome P450, family 17, subfamily a, polypeptide 1 |
| 12409 | 2.06 | Cbr2 | Carbonyl reductase 2 |
| 17168 | 2.04 | Mare | Alpha globin regulatory element containing gene |
| 226646 | 1.92 | Ndufs2 | NADH dehydrogenase (ubiquinone) Fe-S protein 2 |
| 65969 | 1.91 | Cubn | Cubilin (intrinsic factor-cobalamin receptor) |
| Signal transduction | |||
| 77853 | 17.44 | Msl2 | Male-specific lethal-2 homolog (Drosophila) |
| 71435 | 10.89 | Arhgap21 | Rho GTPase activating protein 21 |
| 19324 | 6.01 | Rab1 | RAB1, member RAS oncogene family |
| 24000 | 2.65 | Ptpn21 | Protein tyrosine phosphatase, non-receptor type 21 |
| 16948 | 2.44 | Lox | Lysyl oxidase |
| 244962 | 2.41 | Snx14 | Sorting nexin 14 |
| 16822 | 2.13 | Lcp2 | Lymphocyte cytosolic protein 2 |
| 77286 | 2.12 | Nkrf | NF-kappaB repressing factor |
| 67071 | 1.95 | Rps6ka6 | Ribosomal protein S6 kinase polypeptide 6 |
| 66092 | 1.93 | Ghitm | Growth hormone inducible transmembrane protein |
| 80877 | 1.93 | Lrba | LPS-responsive beige-like anchor |
| 14460 | 1.92 | Gata1 | GATA binding protein 1 |
| 14161 | 1.91 | Fga | Fibrinogen, alpha polypeptide |
| 72124 | 1.91 | Seh1l | Seh1-like protein |
| Structure proteins | |||
| 286940 | 5.60 | Flnb | Filamin, beta |
| 11461 | 2.67 | Actb | Actin, beta, cytoplasmic |
| 16668 | 2.40 | Krt1-18 | Keratin complex 1, acidic, gene 18 |
| 67943 | 2.05 | Mesdc2 | Mesoderm development candidate 2 |
| Transcription/RNA binding/splicing | |||
| 74412 | 26.65 | Gle1l | GLE1 RNA export mediator-like (yeast) |
| 14154 | 8.82 | Fem1a | Feminization 1 homolog a (Caenorhabditis elegans) |
| 64340 | 3.76 | Dhx38 | DEAH (Asp-Glu-Ala-His) box polypeptide 38 |
| 108655 | 2.07 | Foxp1 | Forkhead box P1 |
| 26451 | 2.06 | Rpl27a | Ribosomal protein L27a |
| 101095 | 2.01 | Zfp282 | Zinc finger protein 282 |
| 208076 | 1.95 | Pknox2 | Pbx/knotted 1 homeobox 2 |
| 54343 | 1.90 | Atf7ip | Activating transcription factor 7 interacting protein |
| 67579 | 1.68 | Cpeb4 | Cytoplasmic polyadenylation element binding protein 4 |
| Translation/processing | |||
| 52443 | 7.69 | Mrpl48 | Mitochondrial ribosomal protein L48 |
| 20102 | 5.42 | Rps4x | Ribosomal protein S4, X-linked |
| 230861 | 2.74 | Eif4g3 | Eukaryotic translation initiation factor 4 gamma, 3 |
| 13627 | 2.61 | Eef1a1 | Eukaryotic translation elongation factor 1 alpha 1 |
| 26451 | 2.06 | Rpl27a | Ribosomal protein L27a |
LocusLink is superceded by Entrez Gene. LocusLink number is the same as GeneID and can be used to search gene database at the NIH web site: http://www.ncbi.nlm.nih.gov/query.fcgi?db = gene.
FluD1 represents day 1 after infection of mice with influenza virus A/PR/8/34.
Ctr represents uninfected control mice.
Analysis of the microarray results demonstrated that several genes exclusively up-regulated following infection with influenza virus A were involved in the intracellular signaling pathways, which included Rho GTPase activating protein 21 (Arhgap21), Rab1 (member of RAS oncogene family), protein tyrosine phosphatase non receptor type 21 (Ptpn21), lysyl oxidase (Lox), Sorting nexin 14 (Snx14), lymphocyte cytosolic protein 2 (Lcp2), NF-kappaB repressing factor (Nkrf), ribosomal protein S6 kinase polypeptide 6 (Rps6ka6), growth hormone inducible transmembrane protein (Ghitm), LPS-responsive beige-like anchor (Lrba), GATA binding protein 1 (Gata1), fibrinogen alpha polypeptide (Fga) and Seh1-like protein (Seh1l) (Table 2). We identified 3 defense/immunity related genes that were exclusively up-regulated in response to influenza virus A at day 1: chitinase 3-like 3 (Chi3l3), ATP-binding cassette sub-family F member 1 (Abcf1), and chemokine ligand 6 (Ccl6).
There were only seven known genes exclusively down-regulated in mice infected with influenza virus A but unchanged in mice infected with S. pneumoniae: guanine nucleotide binding protein alpha inhibiting 2 (Gnai2), which is involved in leukocyte transendothelial migration; cyclin L2 (Ccl2); programmed cell death 4 (Pdcd4), which suppresses tumor phenotype by inhibiting AP-1-dependent transcription; proteasome 26S subunit 8 non-ATPase 8 (Psmd8), which is a component of proteasome; signal sequence receptor beta (Ssr2), which is related to signal sequence binding and cotranslational protein targeting to membrane; RAD23b homolog (Rad23b), which functions in nucleotide excision repair; and mannoside acetylglucosaminyltransferase 1 (Mgat1), which is involved in N-glycan biosynthesis.
3.3. Identification of genes exclusively up- or down-regulated in response to S. pneumoniae at day 1
We identified 52 known genes exclusively up-regulated in mice infected with S. pneumoniae at day 1 but unchanged in mice infected with influenza virus A. These 52 genes were sorted according to their functional groups and listed in Table 3. We identified 10 known genes whose expression levels increased more than 5-fold after infection with S. pneumoniae. These 10 genes included folate receptor 4 gene (Folr4), cleavage and polyadenylation specific factor 3-like (Cpsf3l), heparin sulfate 3-O-sulfotransferase 3B1 (Hs3st3b1), mitochondrial ribosomal protein L20 gene (Mrpl20), lysosomal H+ transporting ATPase gene (Atp6v1h), zinc finger DHHC domain containing 6 (Zdhhc6), selenoprotein K gene (Selk), aryl hydrocarbon receptor nuclear translocator-like gene (Arntl), secretory carrier membrane protein 1 gene (Scamp1) and heat shock protein 90 kDa alpha class B member 1 (Hsp90ab1).
Table 3.
Genes exclusively up-regulated in response to S. pneumoniae at day 1
| LocusLinka | PneD1b/Ctrc | Gene name | Gene description |
|---|---|---|---|
| Cell division | |||
| 26965 | 2.07 | Cul1 | Cullin 1 |
| 11426 | 2.00 | Macf1 | Microtubule-actin crosslinking factor 1 |
| 12540 | 1.92 | Cdc42 | Cell division cycle 42 homolog |
| 17535 | 1.92 | Mre11a | Meiotic recombination 11 homolog A (S. cerevisiae) |
| Defense/immunity | |||
| 80795 | 6.10 | Selk | Selenoprotein K |
| 17381 | 1.87 | Mmp12 | Matrix metalloproteinase 12 |
| Metabolism | |||
| 64931 | 10.64 | Folr4 | Folate receptor 4 (delta) |
| 54710 | 7.42 | Hs3st3b1 | Heparan sulfate (glucosamine) 3-O-sulfotransferase 3B1 |
| 108664 | 6.98 | Atp6v1h | ATPase, H+ transporting, lysosomal 50/57 kDa, V1 Subunit H |
| 66980 | 6.25 | Zdhhc6 | Zinc finger, DHHC domain containing 6 |
| 212627 | 4.95 | Prpsap2 | Phosphoribosyl pyrophosphate synthetase-associated Protein 2 |
| 99712 | 4.70 | Cept1 | Choline/ethanolaminephosphotransferase 1 |
| 105727 | 3.89 | Slc38a1 | Solute carrier family 38, member 1 |
| 59125 | 3.57 | Nek7 | NIMA (never in mitosis gene a)-related expressed kinase 7 |
| 14751 | 3.28 | Gpi1 | Glucose phosphate isomerase 1 |
| Signal transduction | |||
| 15516 | 5.34 | Hsp90ab1 | Heat shock protein 90 kDa alpha class B member 1 |
| 68196 | 1.98 | Hsbp1 | Heat shock binding protein 1 |
| 21824 | 1.98 | Thbd | Thrombomodulin |
| 114713 | 1.93 | Rasa2 | Ras p21 protein activator 2 |
| 76884 | 1.92 | Cyfip2 | Cytoplasmic FMR1 interacting protein 2 |
| 59020 | 1.90 | Pdzk1 | PDZ domain containing 1 |
| Structure proteins | |||
| 19894 | 4.66 | Rph3a | Rabphilin 3A |
| 13726 | 3.34 | Emd | Emerin |
| 218210 | 3.10 | Nup153 | Nucleoporin 153 |
| 19231 | 2.29 | Ptma | Prothymosin alpha |
| 228421 | 1.90 | Kif18a | Kinesin family member 18A |
| Transcription/RNA binding/splicing | |||
| 17765 | 4.02 | Mtf2 | Metal response element binding transcription factor 2 |
| 68592 | 3.33 | Syf2 | SYF2 homolog, RNA splicing factor |
| 96979 | 3.22 | Ptges2 | Prostaglandin E synthase 2 |
| 13982 | 2.61 | Esr1 | Estrogen receptor 1 (alpha) |
| 208922 | 2.21 | Cpeb3 | Cytoplasmic polyadenylation element binding protein 3 |
| 17308 | 2.11 | Mgat1 | Mannoside acetylglucosaminyltransferase 1 |
| 17293 | 2.00 | Mesp2 | Mesoderm posterior 2 |
| 68196 | 1.98 | Hsbp1 | Heat shock factor binding protein 1 |
| 19820 | 1.94 | Rnf12 | Ring finger protein 12 |
| 114642 | 1.90 | Brdt | Bromodomain, testis-specific |
| 22685 | 1.84 | Zfp239 | Zinc finger protein 239 |
| Translation/processing | |||
| 66448 | 7.14 | Mrpl20 | Mitochondrial ribosomal protein L20 |
| 11865 | 5.74 | Arntl | Aryl hydrocarbon receptor nuclear translocator-like |
| 107767 | 5.57 | Scamp1 | Secretory carrier membrane protein 1 |
| 59125 | 3.57 | Nek7 | NIMA (never in mitosis gene a)-related expressed kinase 7 |
| 19943 | 2.64 | Rpl28 | Ribosomal protein L28 |
| 75617 | 2.60 | Rps25 | Ribosomal protein S25 |
| 16792 | 2.36 | Laptm5 | Lysosomal-associated protein transmembrane 5 |
| 17999 | 2.25 | Nedd4 | Neural precursor cell expressed, developmentally down-regulated gene 4 |
| 14376 | 2.20 | G2an | Alpha glucosidase 2, alpha neutral subunit |
| 50797 | 2.14 | Copb2 | Coatomer protein complex, subunit beta 2 (beta prime) |
| 27367 | 2.14 | Rpl3 | Ribosomal protein L3 |
| 69702 | 2.07 | Ndufaf1 | NADH dehydrogenase 1 alpha subcomplex, assembly factor 1 |
| 57295 | 2.04 | Icmt | Isoprenylcysteine carboxyl methyltransferase |
LocusLink is superceded by Entrez Gene. LocusLink number is the same as GeneID and can be used to search gene database at the NIH web site: http://www.ncbi.nlm.nih.gov/query.fcgi?db = gene.
PneD1 represents day 1 after infection of mice with Streptococcus pneumoniae.
Ctr represents uninfected control mice.
Analysis of the microarray results demonstrated that several genes exclusively up-regulated following infection with S. pneumoniae were involved in the intracellular signaling pathways (Table 3). These included selenoprotein K gene (Selk), heat shock protein 1 beta (Hspcb), ras homolog gene family member B (Rhob), phosphoglycerate kinase 1 (Pgk1), thrombomodulin (Thbd), Ras p21 protein activator 2 (Rasa2), cytoplasmic FMR1 interacting protein 2 (Cyfip2), prothymosin alpha (Ptma), mesoderm posterior 2 (Mesp2), and cell division cycle 42 homolog (Csc42). Selenoprotein K and heat shock protein 1 beta are related to stress responses. Phosphoglycerate kinase 1 is involved in the carbon fixation and glycolysis/gluconeogenesis pathways. Thrombomodulin participates in complement and coagulation cascades. p21 protein activator 2 is related to the MAPK signaling pathway. Prothymosin alpha induces functional maturation and interleukin-12 production by fungus-pulsed dendritic cells through the p38 mitogen-activated protein kinase/nuclear factor (NF)-kappaB-dependent pathway [27]. Mesoderm posterior 2 is involved in Notch signaling pathway. Cell division cycle 42 homolog is activated by interleukin 3 (IL-3) and is involved in different pathways such as Leukocyte transendothelial migration, MAPK signaling, T-cell receptor signaling and adherens junction.
There were 33 genes exclusively down-regulated in mice infected with S. pneumoniae but unchanged in mice infected with influenza virus A at day 1. These genes included immediate early response 5 (Ier5), which may play an important role in mediating the cellular response to mitogenic signals; heat shock protein 90 kDa beta member 1 (Hsp90b1), which is an inflammatory mediator that selectively primes CD8+ T-cell effector function; SAM domain and HD domain 1 (Samhd1), which is related to immune response and signal transduction; lymphocyte antigen 6 complex locus E (Ly6e), which is a signal transducer situated at the nexus of surface molecules regulating death receptor-mediated apoptosis in hepatoma; annexin A6 (Anxa6), which may function as an acidic pH binding site or receptor; mitogen activated protein kinase 3 (Mapk3), which is involved in many pathways such as adherens junction, gap junction, insulin signaling, MAPK signaling, TGF-beta signaling and natural killer cell mediated cytotoxicity; tyrosine kinase non-receptor 2 (Tnk2); ATP-binding cassette sub-family B member 8 (Abcb8), which is related to defense and immunity; cathepsin B (CtsB), which has a role in the lysosomal pathway of apoptosis in tissue injury, inflammation and fibrogenesis; and cadherin associated protein delta 1 (Catns), which is involved in adherens junction pathway. We also found that several down-regulated genes were involved in the transcription and translation regulations. These included the general transcription factor II i gene (Gtf2i), RNA polymerase II transcriptional coactivator gene (Rpo2tc1), golgi reassembly stacking protein 2 (Gorasp2), myocyte enhancer factor 2A (Mef2a), eukaryotic translation initiation factor 5 (Eif5), cytoplasmic polyadenylation element binding protein 4 (Cpeb4), proteasome subunit alpha type 7 (Psma7), and ubiquitin specific peptidase 9, X chromosome (Usp9x).
The genes exclusively up-regulated or down-regulated in mice infected with influenza virus A or S. pneumoniae are good candidate genes that could be used as biomarkers to distinguish individuals exposed to specific classes of pathogens such as influenza virus A and S. pneumoniae. Application of cDNA microarray technology to study the differences between host responses in mice infected with influenza virus A and S. pneumoniae provides an opportunity to identify host proteins essential for these two different pathogens, that could lead to the better understanding of host-pathogen interactions, the identification of virulence-associated genes at the gene transcription level and the identification of new biomarkers for early diagnosis of infectious diseases such as influenza and design of novel therapeutic agents against influenza viruses.
3.4. Identification of genes up- or down-regulated in response to both influenza virus A and S. pneumoniae
To identify commonly up-regulated or down-regulated genes, we examined the genes whose expression was regulated more than 1.5-fold in response to influenza virus A and S. pneumoniae infection at day 1. There were many known genes commonly up-regulated and down-regulated at day 1 in response to both influenza virus A and S. pneumoniae. We focused on the genes that were up-regulated or down-regulated more than 2.0-fold in response to influenza virus A and S. pneumoniae infection at day 1. The commonly up-regulated genes included microtubule-actin crosslinking factor 1 (Macf1), tyrosine 3-monooxygenase/tryptophan 5-monooxygenase activation protein theta polypeptide (Ywhag), testis expressed gene 292 (Tex292), UDP-glucose dehydrogenase (Ugdh), chorionic somatomammotropin hormone 1 (Csh1), cytoplasmic actin beta gene (Actb), FGF receptor activating protein 1 gene (Frag1), elongation factor Tu GTP binding domain containing 2 (Eftud2), transmembrane channel-like gene family 6 (Tmc6), nuclear receptor subfamily 2, group E, member 1 (Nr2e1), cask-interacting protein 2 gene (Caskin2), nudix-type motif 21 (Nudt21), and NADH dehydrogenase 1 beta subcomplex 3 (Ndufb3). Other up-regulated genes of interest included cleavage and polyadenylation specific factor 2 (Cpsf2), Bcl2-associated athanogene 3 (Bag3), thioredoxin interacting protein (Txnip), tumor necrosis factor receptor superfamily member 19 (Tnfrsf19), transcription factor 19 (Tcf19), phosphoglycerate kinase 1 (Pgk1), proteasome 28 subunit 3 (Psme3), solute carrier family 43 member 3 (Slc43a3), and ras homolog gene family, member B (Rhob). The commonly down-regulated genes included thioredoxin interacting protein gene (Txnip), which is a critical factor for the development and function of natural killer cells in vivo [24]; block of proliferation 1 gene (Bop1); transmembrane protein 57 (Tmem57); pleiomorphic adenoma gene-like 1 (Plagl1), which plays an important role in the control of cell fate during neurogenesis, chondrogenesis, and myogenesis [33]; RNA binding motif protein 13 (Rbm13); SCO cytochrome oxidase deficient homolog 1 (Sco1); cyclin D binding myb-like transcription factor 1 (Dmtf1), which is directly linked to oncogenic Ras-Raf-Arf signaling pathway [34]; attractin gene (Atrn); and bromodomain and PHD finger containing 1 (Brpf1). Other commonly down-regulated genes of interest included Janus kinase 1 (Jak1), Jak1 and Jak2 are client proteins of Hsp90 alpha and beta which plays a critical role in types I and II interferon pathways [29] and Jak1 and Jak2 must work cooperatively to have normal kinase activity to trigger downstream signals leading to interleukin-3 independent proliferation [30]; integrin linked kinase (Ilk), which has a role in immune-cell trafficking and survival via modulation of Akt- and Rac-dependent substrates, and have implications for cell recruitment in both homeostatic and pathological processes [25]; ras homolog gene family member A (Rhoa), RhoA activation is sufficient to stimulate beta(1) and beta(2) integrin-mediated adhesion in thymocytes [35]; RNA polymerase II transcriptional coactivator (Rpo2tc1); cyclin I (Ccni), and pyruvate kinase (Pkm2), which is involved in the insulin signaling pathway [36].
Only 11 known genes were commonly up-regulated and seven known genes were commonly down-regulated at day 7 in response to both influenza virus A and S. pneumoniae. The commonly up-regulated genes were defensin related sequence cryptdin peptide gene (Defcr-rs1), eukaryotic translation elongation factor 1 alpha 1 gene (Eef1a1), cold shock domain containing E1 RNA binding (Csde1) proteasome subunit beta type 4 gene (Psmb4), antigen identified by monoclonal antibody Ki 67 (Mki67), tubulin, alpha 4 (Tuba4), GTPase activating RANGAP domain-like 3 (Garnl3), laminin receptor 1 (Lamr1), ribosomal protein L28 (Rpl28), ubiquitin specific protease 15 (Usp15), and ADP-ribosylation factor-like 6 interacting protein 2 (Arl6ip2). The commonly down-regulated genes included member of RAS oncogene family (Rab7), ATP-binding cassette sub-family B member 8 (Abcb8), ATP synthase subunit b isoform 1 (Atp5f1), ATP synthase subunit d (Atp5h), phospholipase C delta (Plcd), cyclin D binding myb-like transcription factor 1 (Dmtf1), and cytochrome c oxidase subunit VI a polypeptide 1 (Cox6a1).
3.5. Verification of differentially expressed genes by real-time quantitative RT-PCR
We sought to verify the microarray results by assessing the expression of a sample of eight genes with real-time quantitative RT-PCR using purified total RNAs from infected mice as templates. Table 4 compares the results obtained by microarray analysis and real-time RT-PCR. Results from real-time quantitative RT-PCR confirmed the results obtained by cDNA microarray analysis in 5 out of 8 genes tested. The results showed that the expression changes for 5 of 8 selected genes were consistent with the direction of changes predicted by microarray analysis. The magnitude of change determined by microarray and real-time RT-PCR were somewhat different, a result which was not surprising considering the technical differences in the methods of analysis and normalization.
Table 4.
Validation of microarray results by real-time quantitative RT-PCR analysis
| Gene name | Relative expression levels |
|||
|---|---|---|---|---|
| FluD1a/Controlb |
PneD1c/Controlb |
|||
| Microarray | Real-time RT-PCR | Microarray | Real-time RT-PCR | |
| Chi3l3 | 6.31 | 7.93 | 0.92 | 2.38 |
| Gle1l | 26.65 | 9.49 | 0.73 | 0.91 |
| Fen1 | 5.10 | 6.64 | 1.00 | 5.02 |
| Scamp1 | 0.92 | 0.94 | 5.57 | 6.16 |
| Gnai2 | 0.40 | 0.55 | 0.75 | 1.45 |
| Ier5 | 0.74 | 0.67 | 0.28 | 3.07 |
| Bop1 | 0.39 | 4.03 | 0.47 | 3.64 |
| Cpsf2 | 2.18 | 0.76 | 1.68 | 1.06 |
FluD1 represents day 1 after infection of mice with influenza virus A/PR/8/34.
Control represents uninfected control mice.
PneD1 represents day 1 after infection of mice with Streptococcus pneumoniae.
3.6. Signature gene expression patterns in response to influenza virus A and S. pneumoniae
Based the microarray profiles of mice in response to influenza virus A and S. pneumoniae at day 1 after infection, we have revealed signature gene expression patterns by comparing relative fold changes of 28 differentially expressed genes, 14 of them were specific for influenza virus A and 14 of them were specific for S. pneumoniae ( Fig. 2). The following 10 selected genes were up-regulated in mice infected with influenza virus A but unaffected or up-regulated much less by S. pneumoniae: arginyl-tRNA synthetase-like gene (Rarsl), feminization 1 homolog a gene (Fem1a), mitochondrial ribosomal protein L48 gene (Mrpl48), chitinase 3-like 3 gene (Chi3l3), Rab1 gene, filamin beta gene (Flnb), ribosomal protein S4 X-linked gene (Rps4x), thioredoxin domain containing 4 gene (Txndc4), flap structure specific endonuclease 1 gene (Fen1) and general transcription factor II H polypeptide 2 gene (Gtf2h2). We selected four genes that were down-regulated in mice infected with influenza virus A but unaffected or affected much less by S. pneumoniae: glutathione peroxidase 1 gene (Gpx1), integrin linked kinase gene (Ilk), guanine nucleotide binding protein, alpha inhibiting 2 gene (Gnai2) and cyclin L2 gene (Ccnl2). Ten selected genes were up-regulated in mice infected with S. pneumoniae but unaffected or affected much less by influenza virus A, which included folate receptor 4 gene (Folr4), mitochondrial ribosomal protein L20 gene (Mrpl20), ATPase H+ transporting V1 subunit H gene (Atp6v1h), zinc finger DHHC domain containing 6 gene (Zdhhc6), selenoprotein K gene (Selk), aryl hydrocarbon receptor nuclear translocator-like gene (Arntl), secretory carrier membrane protein 1 gene (Scamp1), nuclear receptor subfamily 5 group A member 2 gene (Nr5a2), and phosphoribosyl pyrophosphate synthetase-associated protein 2 gene (Prpsap2). We also selected four genes that were down-regulated in mice infected with S. pneumoniae but unaffected or affected much less by influenza virus A: villin 2 gene (Vil2), DAZ associated protein 2 gene (Dazap2), general transcription factor II I gene (Gtf2i) and immediate early response 5 gene (Ier5).
Fig. 2.
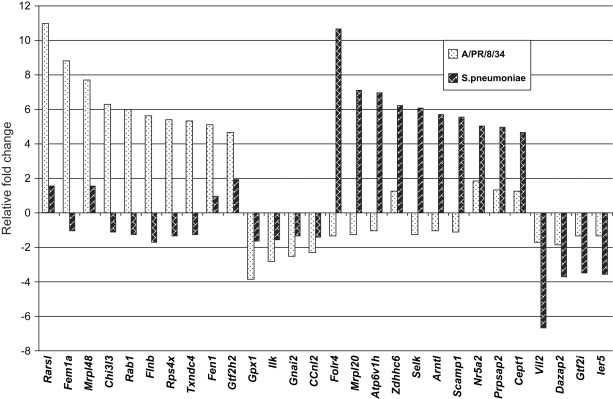
Signature patterns of gene expression in mice in response to influenza virus A/PR/8/34 and Streptococcus pneumonia. Twenty-eight differentially expressed genes were selected to show the difference of gene expression patterns between mice infected with influenza virus A/PR/8/34 and Streptococcus pneumoniae at day 1. The relative fold changes for each gene were used for comparison.
The results show the clear difference between mice infected with influenza virus A and S. pneumoniae (Fig. 2). Since these 28 selected genes have not previously been linked to respiratory infectious diseases, they are good candidate biomarkers for distinguishing pathogens such as influenza virus A and S. pneumoniae. They can also be used as suitable targets for early diagnosis, prevention and treatments of respiratory infectious diseases such as influenza and pneumonia.
4. Discussion
Respiratory tract infections are the most common cause of human illness. One of the major hurdles in the early diagnosis of respiratory infectious diseases is that a wide variety of pathogens can cause similar symptoms in patients, some of which cause minor diseases while others can cause significant lethality such as life-threatening avian influenza virus H5N1 [37]. Global gene expression profiling using cDNA microarrays has been increasingly used to study complex interactions between host and pathogens including influenza viruses and HIV-1 [38], [39], [40]. Genes are usually expressed only when and where their functions are required. Application of cDNA microarray technology to study the differences between host responses in mice infected with different pathogens provides an opportunity to identify host proteins essential for different pathogens, that could lead to the better understanding of host-pathogen interactions, the identification of virulence-associated genes at the gene transcription level, and the identification of new biomarkers for early diagnosis and design of novel therapeutic agents.
The purpose of this study is to define microarray profiles of mice exposed to influenza virus A/PR/8/34 (H1N1) and S. pneumoniae, thus evaluating the host response to these two respiratory pathogens. By determining the pattern of gene expression with different pathogens, it is possible to elucidate which set of host genes are impacted at what stage of the infection with which pathogen. In this study, the host gene expression profiles in spleens of mice infected with two different respiratory pathogens (influenza virus A and S. pneumoniae) were explored using cDNA microarray technology. We have identified 490 known and unknown genes that were differentially transcribed in mouse spleen in response to infections with influenza virus A and S. pneumoniae at day 1 and day 7 after infection, 285 were known genes, 76 were ESTs with GeneID and 129 were ESTs without GeneID. We found that many genes associated with cell metabolisms, intracellular signaling pathways, and gene/protein expression regulations were up-regulated or down-regulated in mice after infection. Among the 490 identified genes, some were exclusively up-regulated or down-regulated in response to only one of the two pathogens and some were shared by two pathogens. Our results demonstrated that host response to these two pathogens is very quick and gene expression profiles could be detected as early as 1 day after exposure to pathogens. We also found that 129 unknown genes were differentially expressed in mouse spleen after infection with influenza virus A and S. pneumoniae. It will be important to study these 129 unknown genes to characterize their functions in host response to respiratory pathogens such as influenza virus A and S. pneumoniae.
We observed that many genes up-regulated and down-regulated in response to influenza virus A and S. pneumoniae were involved in the intracellular signaling pathways including chemokine, apoptosis, MAPK, Notch, Jak-STAT, T-cell receptor and complement and coagulation cascades. The up-regulated genes included GATA binding protein 1 (Gata1), which modulates cytokine signals through protein–protein interactions, and inhibiting STAT3, thereby regulating the growth and survival of hematopoietic cells and may represent a novel MAPK substrate that plays an essential role in a cytokine-mediated antiapoptotic response; discs large homolog 1 (Dlgh1), which may have a role coordinating T-cell receptor/CD28-induced actin-driven T-cell synapse assembly, signal transduction, and effector function; protein kinase C nu (Prkcn), which is an important component of signaling pathways downstream from protein kinase C enzymes after B-cell receptor engagement; cell division 42 homolog (Cdc42), which can mediate insulin signaling to GLUT4 translocation and was activated by IL-3; heat shock protein 1 beta (Hspcb), Hspcb plays a critical role in types I and II interferon pathways and is required chaperone-dependent MEK1/2-ERK pathway for B-cell antigen receptor-induced cyclin D2 expression in mature B lymphocytes [20]; and matrix metalloproteinase 12 (Mmp12), which plays a role in IL-13-induced inflammation, remodeling in the lung and in T effector polarization [21]. The down-regulated genes included Gpx1, Gpx4, Mapk3, and Hsp90b1. Even though these genes were reported to be involved in the intracellular signaling pathways, most of them have not been linked to host responses to influenza virus A and S. pneumoniae infections. Studies are planned to correlate the genes identified in this report with those to be identified in human influenza patients to determine the contributions of these genes to influenza virus virulence and pathology.
We have identified 49 genes exclusively up-regulated in mice infected with influenza virus A at day 1 but not affected in mice infected with S. pneumoniae. There are 52 genes exclusively up-regulated in mice infected with S. pneumoniae at day 1 but not affected in mice infected with influenza virus A. There are 10 genes exclusively down-regulated in mice infected with influenza virus A at day 1 but not affected in mice infected with S. pneumoniae. There are 48 genes exclusively down-regulated in mice infected with S. pneumoniae at day 1 but not affected in mice infected with influenza virus A. At day 7 after infection, there are fewer genes exclusively expressed in mice exposed to either influenza virus A or S. pneumoniae.
Although many genes seem to be specific for the particular pathogen used, a number of genes have been found to be commonly up-regulated or down-regulated by both influenza virus A and S. pneumoniae at day 1 after infection. Most of these commonly up-regulated genes are involved in metabolisms and have not been linked to host responses to respiratory pathogens such as influenza virus A and S. pneumoniae. The group of commonly down-regulated genes include thioredoxin interacting protein gene (Txnip), ribosomal protein L32 gene (Rpl32), block of proliferation 1 gene (Bop1), cyclin D binding myb-like transcription factor 1 gene (Dmtf1), attractin gene (Atrn), ribosomal protein S19 gene (Rps19), cyclin I gene (Ccni), pyruvate kinase gene (Pkm2) and putative serine/threonine kinase gene (Prkx). It is interesting to note that some of these commonly down-regulated genes are related to cell cycle regulation, suggesting that infections by both pathogens can inhibit cell growth and proliferation.
The combination of microarray and the use of model animals is a suitable strategy to explore the gene expression profiles and should provide a useful system to identify new targets for detection of respiratory pathogens and clinical investigation. Recently, Kash et al. performed microarray analysis on lung tissues isolated from mice infected with a recombinant influenza A/WSN/33 virus expressing HA and NA genes of the 1918 pandemic virus (1918HA/NA:WSN), WSN and nonlethal New Caledonia HA/NA:WSN recombinant virus to compare microarray profiles [12]. Their results showed activation of many genes involved in the inflammatory response including cytokine genes. We decided to compare their results with the genes identified in this study to determine if there is any overlap between the two studies. In that paper, Kash et al. listed 102 genes (65 genes with names and 37 ESTs) without giving GeneID from mice infected with three different viruses at 24 h post infection: 1918HA/NA:WSN (lethal), WSN (lethal) and New Caledonia HA/NA:WSN (nonlethal). We have focused on the 65 genes with names and known functions and compared them with genes identified in mice infected with influenza virus A/PR/8/34 at day 1 from our study. Among the 18 genes preferentially regulated in mice infected with all three influenza virus infections (1918HA/NA:WSN, WSN and New Caledonia HA/NA:WSN), we have found 10 genes with the same name or similar functions (55.6%) that were also preferentially regulated in mice infected with influenza virus A/PR/8/34 at day 1 in our study. The 10 overlap genes are: activating transcription factor 7 interacting protein (Atf3), apoptosis inhibitor survivin (Birc5), cell division cycle 2 homolog A (Cdc2a), glutathione synthetase (Gss), glutathione S-transferase pi2 (Gstp2), hemoglobin alpha adult chain 1 (Hba-a1), cell adhesion molecules integrin beta 1 (Itgb1), cell adhesion molecules integrin beta 4 (Itgb4), phospholipase c neighboring (Png) and solute carrier family 28 member 2 (Slc28a2). These 10 genes are probably common to both pathogenic and nonpathogenic H1N1 influenza A viruses such as A/South Carolina/1/18 (H1N1), A/Brevig Mission/1/18 (H1N1), A/WSN/33 (H1N1), A/New Caledonia/20/99 (H1N1) and A/PR/8/34 (H1N1).
Among the 16 genes preferentially regulated in mice infected with 1918HA/NA:WSN (lethal), and WSN (lethal), we have found two genes with the same name or similar functions (12.5%) that were also preferentially regulated in mice infected with influenza virus A/PR/8/34 at day 1 in our study. These two genes are cleavage and polyadenylation specific factor 2 (Cpsf2) and tumor necrosis factor (Tnf). We suggest that these two genes are important for pathogenesis of lethal strains of influenza A viruses. Only 1 out of 6 genes (16.7%) preferentially regulated in mice infected with 1918HA/NA:WSN (lethal) was found preferentially regulated in mice infected with influenza virus A/PR/8/34 at day 1 in our study. None of the four genes preferentially regulated in mice infected with New Caledonia HA/NA:WSN was affected in mice infected with influenza virus A/PR/8/34 at day 1 in our study. The comparison results suggest that there are some overlaps between the gene expression seen with A/PR/8/34 and the study with the virulent 1918HA/NA:WSN and WSN viruses but no overlap with that of the nonlethal strain of influenza virus New Caledonia HA/NA:WSN.
Because microarray experiments result in large amounts of data, it is important to validate differentially expressed genes by independent methods. When validated by different methods including quantitative RT-PCR [41], [42], Northern blotting [15], [43], [44], and protein expression [28], [29], most differentially expressed genes have been confirmed. For example, 49 (40%) of the mRNAs predicted to be increased and 23 (17%) of the mRNAs predicted to be decreased in response to cytomegalovirus (CMV) infection were confirmed by either Northern blot analysis or prior reports [45]. Many genes identified in this study have not been linked to respiratory infections before and it will be very important to validate the expression levels for these genes using real-time quantitative RT-PCR. Our real-time quantitative RT-PCR results are consistent with the direction of changes predicted by microarray analysis in 5 out of 8 genes (63%). The results of this study show that most differentially expressed genes identified by cDNA microarray can been confirmed by the real-time quantitative RT-PCR. The magnitude of change determined by microarray and real-time RT-PCR were somewhat different because of differences of the two methods.
We also demonstrated that signature pattern of gene expression in mice infected with influenza virus A is significantly different from that in mice infected with S. pneumoniae at day 1. The 28 selected genes are good candidate biomarkers for distinguishing mice exposed to influenza virus A and S. pneumoniae by comparing signature patterns of gene expression. Detection of differentially expressed host genes in response to respiratory infections could be a valuable tool for the differential diagnosis of diseases particularly in the early stages of infection. Identification of mouse biomarkers for respiratory pathogens such as influenza virus A and S. pneumoniae is an important step towards identification of human biomarkers that could eventually be developed into diagnostic kits for early stage respiratory infections or targets for drug screening. It remains one of the most difficult challenges to correlate mouse model biomarkers to those found in humans and their eventual clinical applications. However, results from this study have provided a list of many candidate biomarkers that can be used for further testing to determine the potential use for human diagnosis, prevention and treatments of respiratory infections including influenza viruses. More experiments will be required to validate these 28 candidate genes before they can be tested in humans.
In conclusion, results from this study demonstrate that microarray data from infected mice could be used to distinguish individuals exposed to specific classes of pathogenic agents such as influenza virus A/PR/8/34 and S. pneumoniae by comparing gene expression profiles. Many genes identified in this study encode gene products that might play key roles in pathogenesis induced by influenza virus A and S. pneumoniae. Results from this study have also provided a list of 28 candidate biomarkers that can be used for further testing to determine the potential use for human diagnosis or treatment. In addition, the identification of genes that specifically regulated in mice in response to these two pathogens may provide insights into the mechanisms by which the host interacts with these pathogens and useful information about stage of diseases and selection of suitable treatments. The distinguishing features of this universally applicable novel approach are that the detection of pathogens is based on differences in host gene expression profiles in response to different pathogens instead of detecting pathogens directly, and infections can be detected at a very early stage.
Acknowledgements
We would like to thank Dr. Gillian Air for critical reading of the manuscript and suggestions. This project has been funded in whole with Federal funds from the National Institute of Environmental Health Sciences, National Institutes of Health, Department of Health and Human Services, under Contract No. N43-ES-35509.
References
- 1.Trampuz A., Prabhu R.M., Smith T.F., Baddour L.M. Avian influenza: a new pandemic threat? Mayo Clin. Proc. 2004;79:523–530. doi: 10.4065/79.4.523. [DOI] [PMC free article] [PubMed] [Google Scholar]
- 2.Stephenson I., Nicholson K.G. Influenza: vaccination and treatment. Eur. Respir. J. 2001;17:1282–1293. doi: 10.1183/09031936.01.00084301. [DOI] [PubMed] [Google Scholar]
- 3.Zambon M.C. The pathogenesis of influenza in humans. Rev. Med. Virol. 2001;11:227–241. doi: 10.1002/rmv.319. [DOI] [PubMed] [Google Scholar]
- 4.Nicholson K.G., Wood J.M., Zambon M. Influenza. Lancet. 2003;362:1733–1745. doi: 10.1016/S0140-6736(03)14854-4. [DOI] [PMC free article] [PubMed] [Google Scholar]
- 5.Laver G., Garman E. Pandemic influenza: its origin and control. Microbes Infect. 2002;4:1309–1316. doi: 10.1016/s1286-4579(02)00013-8. [DOI] [PubMed] [Google Scholar]
- 6.Lobenhofer E.K., Bushel P.R., Afshari C.A., Hamadeh H.K. Progress in the application of DNA microarrays. Environ. Health Perspect. 2001;109:881–891. doi: 10.1289/ehp.01109881. [DOI] [PMC free article] [PubMed] [Google Scholar]
- 7.Bryant P.A., Venter D., Robins-Browne R., Curtis N. Chips with everything: DNA microarrays in infectious diseases. Lancet Infect. Dis. 2004;4:100–111. doi: 10.1016/S1473-3099(04)00930-2. [DOI] [PubMed] [Google Scholar]
- 8.Cummings C.A., Relman D.A. Using DNA microarrays to study host-microbe interactions. Emerg. Infect. Dis. 2000;6:513–525. doi: 10.3201/eid0605.000511. [DOI] [PMC free article] [PubMed] [Google Scholar]
- 9.Hamadeh H.K., Bushel P.R., Jayadev S., Martin K., DiSorbo O., Sieber S., Bennett L., Tennant R., Stoll R., Barrett J.C., Blanchard K., Paules R.S., Afshari C.A. Gene expression analysis reveals chemical-specific profiles. Toxicol. Sci. 2002;67:219–231. doi: 10.1093/toxsci/67.2.219. [DOI] [PubMed] [Google Scholar]
- 10.McCullers J.A., Rehg J.E. Lethal synergism between influenza virus and streptococcus pneumoniae: characterization of a model and the role of platelet-activating factor receptor. J. Infect. Dis. 2002;186:341–350. doi: 10.1086/341462. [DOI] [PubMed] [Google Scholar]
- 11.McCullers J.A., Webster R.G. A mouse model of dual infection with influenza virus and streptococcus pneumoniae. In: Osterhaus A.D.M.E., Cox N.J., Hampson A.W., editors. Elsevier Science; Amsterdam: 2001. pp. 601–607. (Options for the Control of Influenza IV). [Google Scholar]
- 12.Kash J.C., Basler C.F., Garcia-Sastre A., Carter V., Billharz R., Swayne D.E., Przygodzki R.M., Taubenberger J.K., Katze M.G., Tumpey T.M. Global host immune response: pathogenesis and transcriptional profiling of type A influenza viruses expressing the hemagglutinin and neuraminidase genes from the 1918 pandemic virus. J. Virol. 2004;78:9499–9511. doi: 10.1128/JVI.78.17.9499-9511.2004. [DOI] [PMC free article] [PubMed] [Google Scholar]
- 13.Domachowske J.B., Bonville C.A., Easton A.J., Rosenberg H.F. Differential expression of proinflammatory cytokine genes in vivo in response to pathogenic and nonpathogenic pneumovirus infections. J. Infect. Dis. 2002;186:8–14. doi: 10.1086/341082. [DOI] [PubMed] [Google Scholar]
- 14.Su Y.A., Trent J.M. Isolation of tumor suppressor genes in melanoma by cDNA Microarray. In: Nickoloff B.J., editor. Melanoma Techniques and Protocols: Molecular Diagnosis, Treatment, and Monitoring. Methods in Molecular Medicine. Humana Press; Totowa, NJ: 2001. pp. 15–29. [DOI] [PubMed] [Google Scholar]
- 15.Su Y.A., Bittner M.L., Chen Y., Tao L., Jiang Y., Zhang Y., Stephan D.A., Trent J.M. Identification of tumor-suppressor genes using human melanoma cell lines UACC903, UACC903(+6), and SRS3 by comparison of expression profiles. Mol. Carcinog. 2000;28:119–127. doi: 10.1002/1098-2744(200006)28:2<119::aid-mc8>3.0.co;2-n. [DOI] [PubMed] [Google Scholar]
- 16.Bittner M., Meltzer P., Chen Y., Jiang Y., Seftor E., Hendrix M., Radmacher M., Simon R., Yakhini Z., Ben-Dor A., Sampas N., Dougherty E., Wang E., Marincola F., Gooden C., Lueders J., Glatfelter A., Pollock P., Carpten J., Gillanders E., Leja D., Dietrich K., Beaudry C., Berens M., Alberts D., Sondak V. Molecular classification of cutaneous malignant melanoma by gene expression profiling. Nature. 2000;406:536–540. doi: 10.1038/35020115. [DOI] [PubMed] [Google Scholar]
- 17.Eisen M.B., Spellman P.T., Brown P.O., Botstein D. Cluster analysis and display of genome-wide expression patterns. Proc. Natl. Acad. Sci. USA. 1998;95:14863–14868. doi: 10.1073/pnas.95.25.14863. [DOI] [PMC free article] [PubMed] [Google Scholar]
- 18.Wu X., Chen Y., Brooks B.R., Su Y.A. The local maximum clustering method and its application in microarray gene expression data analysis. J. Appl. Signal Process. 2004;1:53–63. [Google Scholar]
- 19.Livak J.K., Schmittgen T.D. Analysis of relative gene expression data using real-time quantitative PCR and the 2(-Delta Delta C(T)) Method. Methods. 2001;25:402–408. doi: 10.1006/meth.2001.1262. [DOI] [PubMed] [Google Scholar]
- 20.Piatelli M.J., Doughty C., Chiles T.C. Requirement for a hsp90 chaperone-dependent MEK1/2-ERK pathway for B cell antigen receptor-induced cyclin D2 expression in mature B lymphocytes. J. Biol. Chem. 2002;277:12144–12150. doi: 10.1074/jbc.M200102200. [DOI] [PubMed] [Google Scholar]
- 21.Lanone S., Zheng T., Zhu Z., Liu W., Lee C.G., Ma B., Chen Q., Homer R.J., Wang J., Rabach L.A., Rabach M.E., Shipley J.M., Shapiro S.D., Senior R.M., Elias J.A. Overlapping and enzyme-specific contributions of matrix metalloproteinases-9 and -12 in IL-13-induced inflammation and remodeling. J. Clin. Invest. 2002;110:463–474. doi: 10.1172/JCI14136. [DOI] [PMC free article] [PubMed] [Google Scholar]
- 22.Hattori T., Shimokawa H., Higashi M., Hiroki J., Mukai Y., Tsutsui H., Kaibuchi K., Takeshita A. Long-term inhibition of Rho-kinase suppresses left ventricular remodeling after myocardial infarction in mice. Circulation. 2004;109:2234–2239. doi: 10.1161/01.CIR.0000127939.16111.58. [DOI] [PubMed] [Google Scholar]
- 23.Yamawaki H., Pan S., Lee R.T., Berk B.C. Fluid shear stress inhibits vascular inflammation by decreasing thioredoxin-interacting protein in endothelial cells. J. Clin. Invest. 2005;115:733–738. doi: 10.1172/JCI200523001. [DOI] [PMC free article] [PubMed] [Google Scholar]
- 24.Lee K.N., Kang H.S., Jeon J.H., Kim E.M., Yoon S.R., Song H., Lyu C.Y., Piao Z.H., Kim S.U., Han Y.H., Song S.S., Lee Y.H., Song K.S., Kim Y.M., Yu D.Y., Choi I. VDUP1 is required for the development of natural killer cells. Immunity. 2005;22:195–208. doi: 10.1016/j.immuni.2004.12.012. [DOI] [PubMed] [Google Scholar]
- 25.Liu E., Sinha S., Williams C., Cyrille M., Heller E., Snapper S.B., Georgopoulos K., St-Arnaud R., Force T., Dedhar S., Gerszten R.E. Targeted deletion of integrin-linked kinase reveals a role in T-cell chemotaxis and survival. Mol. Cell. Biol. 2005;25:11145–11155. doi: 10.1128/MCB.25.24.11145-11155.2005. [DOI] [PMC free article] [PubMed] [Google Scholar]
- 26.Scimeca M.S., Lisk D.J., Prolla T., Lei X.G. Effects of gpx4 haploid insufficiency on GPx4 activity, selenium concentration, and paraquat-induced protein oxidation in murine tissues. Exp. Biol. Med. (Maywood) 2005;230:709–714. doi: 10.1177/153537020523001003. [DOI] [PubMed] [Google Scholar]
- 27.Romani L., Bistoni F., Gaziano R., Bozza S., Montagnoli C., Perruccio K., Pitzurra L., Bellocchio S., Velardi A., Rasi G., Di Francesco P., Garaci E. Thymosin alpha 1 activates dendritic cells for antifungal Th1 resistance through toll-like receptor signaling. Blood. 2004;103:4232–4239. doi: 10.1182/blood-2003-11-4036. [DOI] [PubMed] [Google Scholar]
- 28.Pastore S., Mascia F., Mariotti F., Dattilo C., Mariani V., Girolomoni G. ERK1/2 regulates epidermal chemokine expression and skin inflammation. J. Immunol. 2005;174:5047–5056. doi: 10.4049/jimmunol.174.8.5047. [DOI] [PubMed] [Google Scholar]
- 29.Shang L., Tomasi T.B. The heat shock protein 90-CDC37 chaperone complex is required for signaling by types I and II interferons. J. Biol. Chem. 2006;281:1876–1884. doi: 10.1074/jbc.M509901200. [DOI] [PubMed] [Google Scholar]
- 30.Huang H.M., Lin Y.L., Chen C.H., Chang T.W. Simultaneous activation of JAK1 and JAK2 confers IL-3 independent growth on Ba/F3 pro-B cells. J. Cell Biochem. 2005;96:361–375. doi: 10.1002/jcb.20513. [DOI] [PubMed] [Google Scholar]
- 31.Chang N.C., Hung S.I., Hwa K.Y., Kato I., Chen J.E., Liu C.H., Chang A.C. A macrophage protein, Ym1, transiently expressed during inflammation is a novel mammalian lectin. J. Biol. Chem. 2001;276:17497–17506. doi: 10.1074/jbc.M010417200. [DOI] [PubMed] [Google Scholar]
- 32.Harrington J.J., Lieber M.R. Functional domains within FEN-1 and RAD2 define a family of structure-specific endonucleases: implications for nucleotide excision repair. Genes Dev. 1994;8:1344–1355. doi: 10.1101/gad.8.11.1344. [DOI] [PubMed] [Google Scholar]
- 33.Valente T., Junyent F., Auladell C. Zac1 is expressed in progenitor/stem cells of the neuroectoderm and mesoderm during embryogenesis: differential phenotype of the Zac1-expressing cells during development. Dev. Dyn. 2005;233:667–679. doi: 10.1002/dvdy.20373. [DOI] [PubMed] [Google Scholar]
- 34.Sreeramneni R., Chaudhry A., McMahon M., Sherr C.J., Inoue K. Ras-Raf-Arf signaling critically depends on the DMP1 transcription factor. Mol. Cell. Biol. 2005;25:220–232. doi: 10.1128/MCB.25.1.220-232.2005. [DOI] [PMC free article] [PubMed] [Google Scholar]
- 35.Vielkind S., Gallagher-Gambarelli M., Gomez M., Hinton H.J., Cantrell D.A. Integrin regulation by RhoA in thymocytes. J. Immunol. 2005;175:350–357. doi: 10.4049/jimmunol.175.1.350. [DOI] [PubMed] [Google Scholar]
- 36.Asai Y., Yamada K., Watanabe T., Keng V.W., Noguchi T. Insulin stimulates expression of the pyruvate kinase M gene in 3T3-L1 adipocytes. Biosci. Biotechnol. Biochem. 2003;67:1272–1277. doi: 10.1271/bbb.67.1272. [DOI] [PubMed] [Google Scholar]
- 37.Ligon B.L. Avian influenza virus H5N1: A review of its history and information regarding its potential to cause the next pandemic. Semin. Pediatr. Infect. Dis. 2005;16:326–335. doi: 10.1053/j.spid.2005.07.002. [DOI] [PubMed] [Google Scholar]
- 38.Baskin C.R., Garcia-Sastre A., Tumpey T.M., Bielefeldt-Ohmann H., Carter V.S., Nistal-Villan E., Katze M.G. Integration of clinical data, pathology, and cDNA microarrays in influenza virus-infected pigtailed macaques (Macaca nemestrina) J. Virol. 2004;78:10420–10432. doi: 10.1128/JVI.78.19.10420-10432.2004. [DOI] [PMC free article] [PubMed] [Google Scholar]
- 39.Tong H.H., Long J.P., Li D., DeMaria T.F. Alteration of gene expression in human middle ear epithelial cells induced by influenza A virus and its implication for the pathogenesis of otitis media. Microb. Pathog. 2004;37:193–204. doi: 10.1016/j.micpath.2004.06.012. [DOI] [PubMed] [Google Scholar]
- 40.van't Wout A.B., Lehrman G.K., Mikheeva S.A., O'Keeffe G.C., Katze M.G., Bumgarner R.E., Geiss G.K., Mullins J.I. Cellular gene expression upon human immunodeficiency virus type 1 infection of CD4(+)-T-cell lines. J. Virol. 2003;77:1392–1402. doi: 10.1128/JVI.77.2.1392-1402.2003. [DOI] [PMC free article] [PubMed] [Google Scholar]
- 41.Iyer V.R., Eisen M.B., Ross D.T., Schuler G., Moore T., Lee J.C., Trent J.M., Staudt L.M., Hudson J., Jr., Boguski M.S., Lashkari D., Shalon D., Botstein D., Brown P.O. The transcriptional program in the response of human fibroblasts to serum. Science. 1999;283:83–87. doi: 10.1126/science.283.5398.83. [DOI] [PubMed] [Google Scholar]
- 42.Spellman P.T., Sherlock G., Zhang M.Q., Iyer V.R., Anders K., Eisen M.B., Brown P.O., Botstein D., Futcher B. Comprehensive identification of cell cycle-regulated genes of the yeast Saccharomyces cerevisiae by microarray hybridization. Mol. Biol. Cell. 1998;9:3273–3297. doi: 10.1091/mbc.9.12.3273. [DOI] [PMC free article] [PubMed] [Google Scholar]
- 43.Eckmann L., Smith J.R., Housley M.P., Dwinell M.B., Kagnoff M.F. Analysis by high density cDNA arrays of altered gene expression in human intestinal epithelial cells in response to infection with the invasive enteric bacteria salmonella. J. Biol. Chem. 2000;275:14084–14094. doi: 10.1074/jbc.275.19.14084. [DOI] [PubMed] [Google Scholar]
- 44.Rosenberger C.M., Scott M.G., Gold M.R., Hancock R.E., Finlay B.B. Salmonella typhimurium infection and lipopolysaccharide stimulation induce similar changes in macrophage gene expression. J. Immunol. 2000;164:5894–5904. doi: 10.4049/jimmunol.164.11.5894. [DOI] [PubMed] [Google Scholar]
- 45.Zhu H., Cong J.P., Mamtora G., Gingeras T., Shenk T. Cellular gene expression altered by human cytomegalovirus: global monitoring with oligonucleotide arrays. Proc. Natl. Acad. Sci. U.S.A. 1998;95:14470–14475. doi: 10.1073/pnas.95.24.14470. [DOI] [PMC free article] [PubMed] [Google Scholar]