Abstract
Background
Hepatocellular carcinoma (HCC) is one of the most prevalent cancers in the world. Bioinformatics studies have been widely used for screening genes involved in the initiation and progression of HCC.
Material/Methods
We obtained liver cancer microarray raw data from the GEO database (GSE54238). Next, weighted gene co-expression network analysis (WGCNA) was used to assess the critical modules. Then, we assessed the gene significance by calculating survival, expression level, and receiver operating characteristic (ROC) in the TCGA database. We also validated the expression of selected genes in the Oncomine database and calculated the relationship between 4 hub genes and immune infiltration. Finally, GSEA enrichment analysis was used to explore the potential mechanism.
Results
We identified the red and blue modules as the critical modules, and found 176 candidate genes by assessing gene significance. GO and KEEG results suggested that the candidate genes are involved in the cell cycle. Four hub genes – SOX4, STK39, TARBP1, and TDRKH – were eventually screened after validating their expression and power in diagnosing HCC in the TCGA database. Immune infiltration analysis and GSEA enrichment analysis showed that these 4 hub genes were correlated with the immune cell populations infiltration and that multiple mechanisms were involved, such as angiogenesis and epithelial-mesenchymal transition.
Conclusions
Our findings revealed that these 4 genes can be regarded as potential prognosticators and therapeutic targets for HCC.
MeSH Keywords: Biological Markers; Carcinoma, Hepatocellular; Gene Expression Profiling
Background
Hepatocellular carcinoma (HCC) is ranked fourth in terms of global cancer mortality according to the latest global cancer statistics, causing approximately 781 000 deaths in 2018 (accounting for 8.2% of all cancers) [1]. HCC is the main cause of liver cancer; it has very poor prognosis and average survival rates, as patients with HCC are often already at intermediate or advanced stages before clinical diagnosis. Many factors are responsible for HCC progression, including alcohol addiction, nonalcoholic fatty liver disease, and hepatitis C virus (HCV) [2,3]. It is noteworthy that cirrhosis is the primary cause of HCC progression. HCV can induce acute and chronic infections, which can eventually develop into liver cirrhosis and HCC. This suggests that the clearance of hepatitis viral infections in HCC development is an effective strategy to prevent HCC progression.
Surgical resection, radiofrequency ablation, and liver transplantation are still the primary treatment options for HCC. However, HCC is frequently prone to recurrence, and end-stage patients have shorter survival times than those at early stage. Therefore, it is necessary to understand the potential mechanism of HCC. During the process of HCC, abnormal transcriptional regulation is initiated, thus promoting the expression of cancer-promoting genes. Transcriptomics has recently become important in HCC research and, due to the advantages of multi-omics approaches, it is an effective strategy to understand the mechanism behind HCC onset. In clinical HCC practice, traditional diagnostic methods, such as serum alpha-fetoprotein (AFP) combined with imaging techniques like computed tomography (CT), have limited sensitivity, and there are few effective biomarkers for use in HCC clinical diagnosis. Therefore, it is important to screen desirable biomarkers of HCC. Previous studies used bioinformatics analysis to identify PTK7 as a potential biomarker in HCC, and showed that PKM2 and ALDH1A2 are involved in sex and metabolism [4–6]. Use of data mining and analysis show promise in identifying the potential biomarkers in HCC and improving clinical outcomes.
Weighted gene co-expression network analysis (WGCNA) is an advanced method used to construct a co-expression module to screen the hub genes, microRNAs (miRNAs), and lncRNAs (long non-coding RNAs) using microarray or RNA sequencing data [7–10]. WGCNA classifies the genes that display similar expression patterns into a module which correlates with various clinical traits, first by computing the correlation coefficients for paired genes, then by constructing an adjacency matrix to calculate the strength within genes. Finally, the hub genes are identified based on the weighted index.
In the present study, we constructed a co-expression network within genes by employing the WGCNA method to analyze microarray data, aiming to identify key modules and hub genes related to clinical traits. The blue module is highly correlated with advanced HCC and is enriched in cell cycle, as shown by GO and KEGG analysis. Next, we validated the gene significance and expression in the blue module by using The Cancer Genome Atlas (TCGA) and Oncomine platform, and only 4 genes remained. Then, we performed single-sample gene set enrichment analysis (ssGSEA) to determine the correlations between hub genes and immune infiltration. Finally, the GSEA method was used to determine the potentially involved pathways.
Material and Methods
Data sources and preprocessing
The data used in the present study were derived from 2 sources. First, he data selection criteria were as follows: (1) all datasets were genome-wide; (2) the numbers of samples in each group must be ≥10; (3) the samples of each data set must include cancer patients with various stages and clinical traits. Based on the above criteria, we finally selected GSE54238 for subsequent analysis [11]. Second, the raw counts and clinical traits were obtained from the TCGA database (https://cancergenome.nih.gov/). Data preprocessing was performed as follows: a) Raw counts for each gene from RNA-seq. GENCODE27 was used to match Ensemble ID for genes to generate Gene Symbol names. b) Counts data normalization. Briefly, the R package “DESeq2” was used to normalize across samples and transform the count data by the variance Stabilizing Transformation function.
WGCNA
First, samples were checked to eliminate the outlier samples and genes. Next, the WGCNA (version 1.67, https://cran.r-project.org/web/packages/WGCNA/index.html) was applied to screen the target module related to HCC. The soft threshold power was calculated to obtain a relative satisfying scale independence (>0.85) [12]. The co-expression networks were then developed, and the modules highly correlated with HCC progression were focused on. Modules should be constructed with at least 30 genes. Finally, the genes corresponding to the modules were extracted using the following criterion: absolute value of MM (module membership) ≥0.8 and absolute value of GS (gene significance), with advanced HCC ≥0.2.
Selection of prognosis-related genes
These genes were then used to perform GO and KEGG pathway analysis using the R package “clusterProfiler” [13,14]. The results were summarized and visualized by setting out the condition of P<0.05 after correction.
Cox regression analysis, also called proportional hazards regression analysis, is a survival analysis model used to analyze the relationship between certain features (e.g., gene expression and clinical traits) and survival time. We assessed prognosis-related genes using univariate Cox proportional hazards regression analysis. Statistically significant genes (P<0.05) were then retained as hub genes for further analysis.
Hub genes validation and Kaplan-Meier survival analysis
The mRNA expression of 5 hub genes was investigated in liver cancer using the Oncomine platform (https://www.oncomine.org) and TCGA database [15,16]. The hub genes were eliminated if there was inconsistency between the mRNA expression of hub genes in the Oncomine platform and the TCGA database. Differences in p values between the cancer tissue group and the normal group were assessed by t test. For survival analysis, R package “survival” was used to implement log-rank tests, and Kaplan-Meier survival curves were visualized using the R package “survminer”.
Analysis of the relationship between hub genes and immune cells
Briefly, ssGSEA method in R package “gsva” was employed to analyze the infiltration levels of immune cell types [17]. First, we calculated the infiltration levels of TCGA LIHC samples. Then, the relationships between immune cells and gene expression were analyzed by “Spearman” method. R package “pheatmap” and “ggplot2” were used to visualize the results.
Pathway enrichment analysis
In brief, we sorted and divided the samples into a high-expression group (expression value >median value) and a low-expression group (expression value ≤median value) according to the indicated gene expression. Then, h.all.v6.2.symbols.gmt datasets were obtained from the GSEA website (http://software.broadinstitute.org/gsea/index.jsp). Analysis was performed using the R package “GSEABase” and “clusterProfiler” and plotted using the R package “enrichplot”. The pathways with the top 4 enrichment scores were presented.
Results
Construction of co-expression modules
We first assessed the soft threshold power and found that when the soft threshold power was 8 (as shown in Supplementary Figure 1A), scale-free networks were successfully constructed with independence degree up to 0.877 and an average connectivity of 28.10. The cluster trees and modules indicated by the different colors are presented in Supplementary Figure 1B. We also provide detailed information on gene numbers corresponding to each module in Table 1.
Table 1.
The number of genes in 8 constructed modules.
| Modules | Freq. |
|---|---|
| Grey | 734 |
| Turquoise | 822 |
| Blue | 820 |
| Brown | 465 |
| Yellow | 297 |
| Green | 71 |
| Red | 60 |
| Black | 42 |
Determination of relevant modules related to clinical traits
We next sought to assess the relationship between modules and clinical features. As shown in Figure 1, we discovered that several modules were tightly correlated with HCC progression. For example, blue and red modules had obvious positive correlation with advanced HCC (R2=0.59, 0.63 and P=3e-04, 9e-05, respectively) and negative correlation with the normal group (R2=−0.89, −0.42 and P=7e-12, 0.02, respectively). In contrast, the turquoise module was negatively associated with advanced HCC. Hence, we selected the blue and red modules for subsequent analysis.
Figure 1.
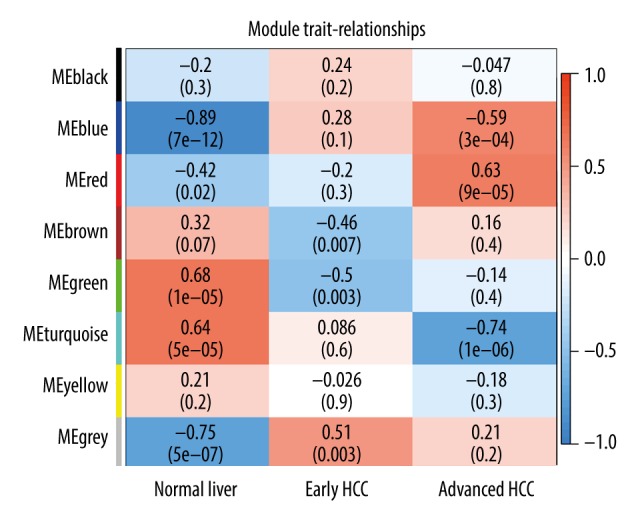
Heatmap of correlation between modules and HCC stage. Each cell contains the specific correlation index and P value.
Functional annotation and selection of hub genes
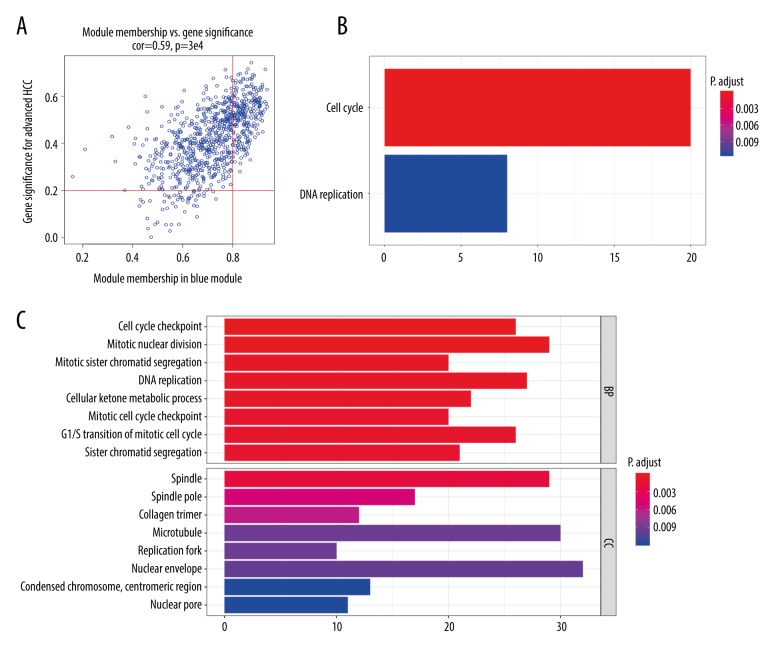
The hub genes were selected as follows: absolute value of MM ≥0.8 and absolute value of GS. advanced HCC ≥0.2. Hence, we preliminarily selected 176 candidate genes in the blue module (in the red module, only 1 gene satisfied the above conditions, so we ignored it) (details shown in Figure 2A). At the same time, we performed GO and KEEG pathway analyses (Figure 2B, 2C). The results indicated that it is dramatically involved in cell cycle and DNA replication. In line with the KEEG pathway analysis, GO analysis also revealed that the biological process (BP) of the blue module is related to cell cycle checkpoint, mitotic nuclear division, and mitotic sister chromatid segregation. These results suggest that cell cycle dysfunction is the cause of tumorigenesis in HCC.
Figure 2.
Recognition of modules related to HCC and functional enrichment analysis. (A) Scatter plot of module eigengenes in blue module. The red vertical line means the threshold of module membership=0.8, the red horizontal line indicates the threshold of gene significances in pathologic stage=0.2. Genes on upper right were selected out. (B) KEGG pathway enrichment analysis of genes in blue module. (C) Gene ontology analysis of genes in blue module.
Validation of hub genes
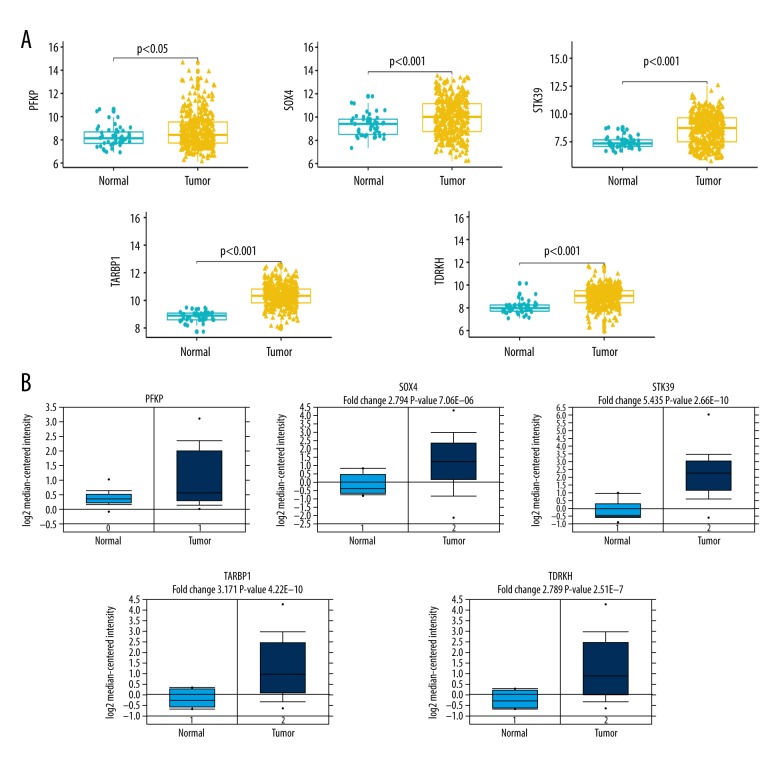
To further screen hub genes, we first performed univariate Cox PHR analyses by using the expression and clinical traits originated from the TCGA database. The results revealed that only 5 candidate genes (PFKP, SOX4, STK39, TARBP1, and TDRKH) were predictive factors for survival (Table 2). Subsequently, we assessed whether the expression levels of the 5 candidate genes were different between the tumor group and the normal group. As indicated in Figure 3A, we found that all 5 candidate genes were overexpressed in the tumor group in the TCGA database. The mRNA expression of the 5 hub genes in HCC was simultaneously investigated using the Oncomine online database (Figure 3B). Consistent with expression patterns found in the TCGA database, SOX4/STK39/TARBP1/TDRKH were all overexpressed in the tumor group. Unexpectedly, the data revealed that PFKP showed no significant alternation between the normal group and the HCC group. Therefore, we excluded PFKP as a hub gene due to the inconsistencies between databases. We also assessed the relationship between methylation degree and mRNA level by using the cBioPortal online website (https://www.cbioportal.org/), showing that there was no significant relationship (data not presented).
Table 2.
Univariate Cox PHR analyses of candidate hub genes in blue module in TCGA HCC cohort.
| Gene symbol | HR | 95% CI | P value |
|---|---|---|---|
| PFKP | 1.30 | (1.1–1.5) | 0.0040 |
| SOX4 | 1.30 | (1.1–1.6) | 0.0009 |
| STK39 | 1.30 | (1.1–1.6) | 0.0008 |
| TARBP1 | 0.73 | (0.54–1) | 0.0304 |
| TDRKH | 0.70 | (0.5–0.98) | 0.0132 |
Figure 3.
Validation of expression of hub genes. (A) Expression profiles of indicated genes between tumor samples and adjacent tissue samples in TCGA database. (B) Expression profiles of indicated genes between tumor samples and normal samples in Oncomine database.
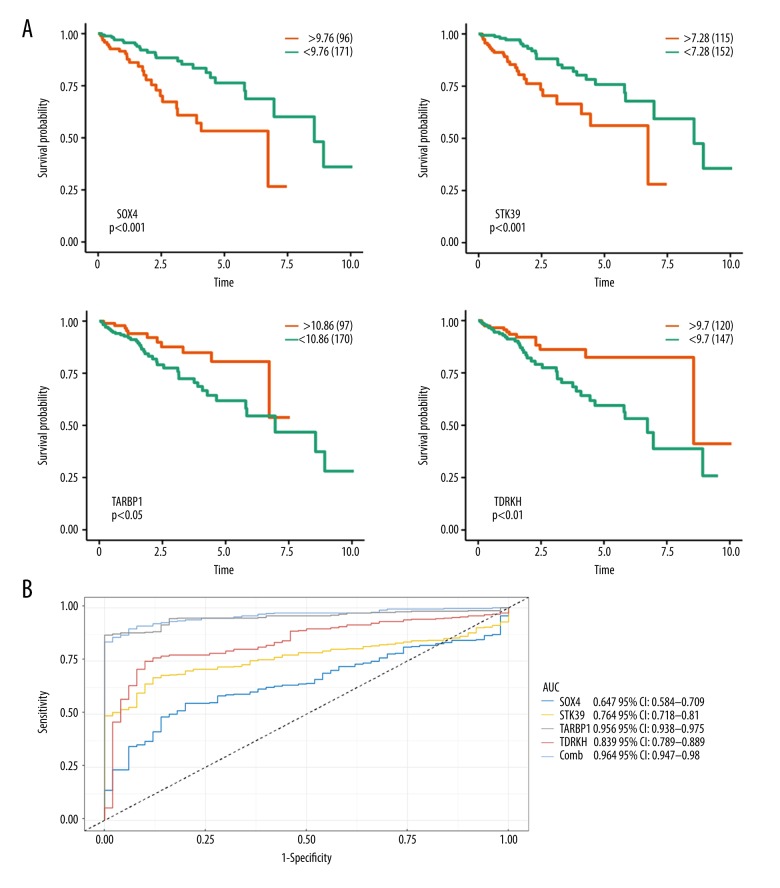
Survival analysis indicated that overexpression of SOX4 and STK39 was associated with shorter overall survival time (Figure 4A). In contrast, overexpression of TARBP1 and TDRKH is significantly associated with longer overall survival time. The ROC curve analysis suggested that SOX4, STK39, TARBP1, and TDRKH have good power in diagnosing HCC, and TARBP1 performed the best (AUC=0.956), which was nearly equal to the combined power of the other 4 genes (Figure 4B).
Figure 4.
Survival analysis and ROC curve AUC statistics of hub genes in TCGA database. (A) Survival analyses of hub genes in the TCGA data set. (B) ROC curve AUC statistics to assess the diagnostic efficiency of hub genes to identify HCC.
Relationship between expression of hub genes and immune infiltration level
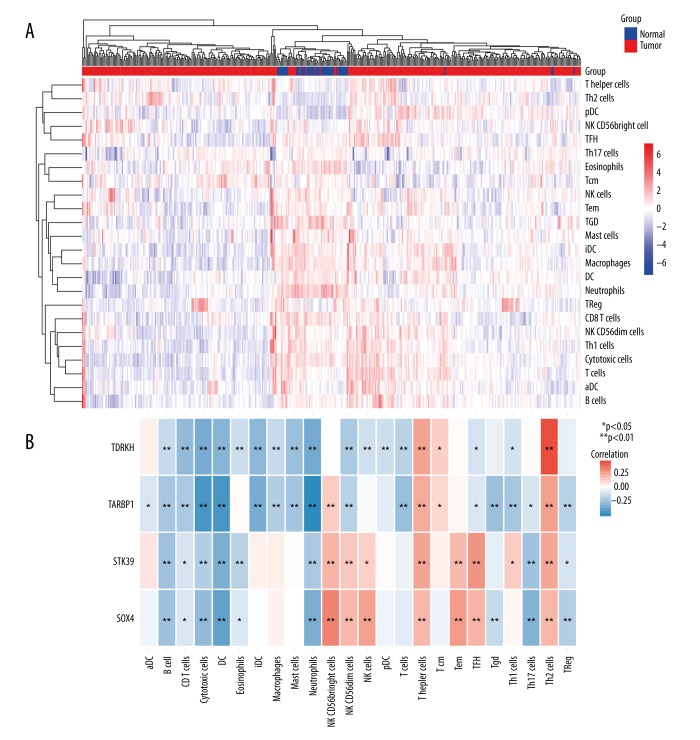
Immune cell populations infiltration has an impact on cancer progression; therefore, we investigated whether the expression of hub genes was correlated with immune infiltration in liver cancer. Our results indicated that the 4 hub genes had all showed significant correlations with infiltrating levels of immune cells (Figure 5A, 5B). For example, TDRKH expression was positively correlated with infiltrating levels of Th2 cells, T helper cells, and Tcm. TDRKH expression had negative correlations with infiltrating levels of neutrophils and NK CD56dim cells. We found similar results for other 3 hub genes. These results suggest that SOX4, STK39, TARBP1, and TDRKH play a vital role in immune infiltration in liver cancer.
Figure 5.
Analysis of the correlation between expression of hub genes and immune infiltration level. (A) Unsupervised clustering from TCGA database using ssGSEA analysis. (B) The correlation index between expression of hub genes and immune infiltration level. Red/blue color represents positive/negative correlation, and the correlation index is reflected by the depth of the color.
Molecular characterization for hub genes
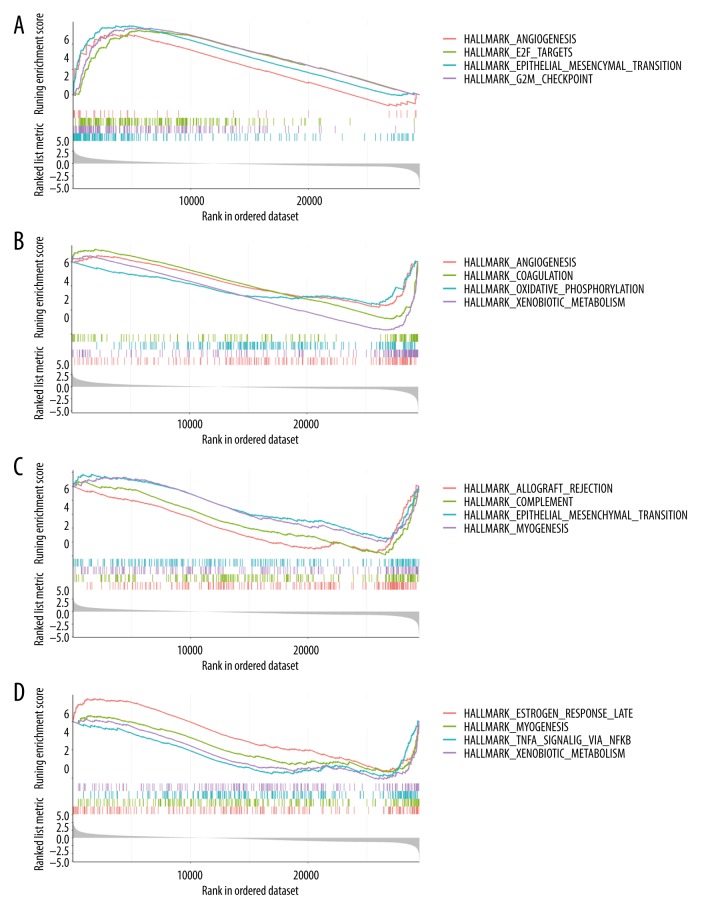
For further potential molecular characterization of hub genes in hepatocellular carcinoma, we performed GSEA analysis using the median value of SOX4/STK39/TARBP1/TDRKH expression to divide patients into SOX4/STK39/TARBP1/TDRKHhigh groups and SOX4/STK39/TARBP1/TDRKHlow groups. In relatively highly expressed SOX4 samples, we found that multiple pathways were enriched, such as angiogenesis, E2F targets, epithelial-mesenchymal transition, and G2M checkpoint, and were significantly correlated with tumorigenesis of HCC (Figure 6A). Similarly, we found that STK39 is associated with adipogenesis and coagulation (Figure 6B), but we also observed that in relatively highly expressed TARBP1 samples, pathways such as epithelial-mesenchymal transition were negatively correlated (Figure 6C). Similarly, we found that in relatively highly-expressed TRDKH samples, the inflammation pathway was enriched (Figure 6D). GSEA analysis showed that SOX4/STK39/TARBP1/TDRKH participate in different pathways related to HCC tumorigenesis.
Figure 6.
Gene set enrichment analysis (GSEA). (A) The top 4 representative functional gene sets enriched in liver cancer with SOX4 highly expressed. (B) The top 4 representative functional gene sets enriched in liver cancer with STK39 highly expressed. (C) The top 4 representative functional gene sets enriched in liver cancer with TARBP1 highly expressed. (D) The top 4 representative functional gene sets enriched in liver cancer with TDRKH highly expressed.
Discussion
Tumorigenesis is a complex process involving numerous levels of transcriptional regulation. The main purposes of this study were to investigate the molecular characterization of HCC onset and to identify a series of meaningful biomarkers of HCC relevant to tumorigenesis by constructing a co-expression network within genes. The key modules correlated with different stages of HCC. Then, the hub genes were validated using 4 different methods (survival analysis, Cox PHR, expression level, ROC) in the TCGA database.
WGCNA links gene expression information with clinical traits in the sample. In the present study, WGCNA was used to identify modules related to the initiation of HCC. Our research revealed that the modules displayed significant alternations included in the blue, red, and turquoise modules. It is widely accepted that the cell cycle, which is the process of cell progression and division, plays a critical role in tumorigenesis. A series of kinases are used by cells to dominate the steps in the cell cycle. Once the cell cycle is out of control, uncontrolled cell proliferation occurs. Hence, it is apparent that manipulation of the cell cycle might be an effective method to treat cancer, especially the cell cycle checkpoint [18–20]. Consistent with previous research, our study also discovered that the cell-cycle-related blue module changed dramatically, and the alternations strengthened, especially in advanced HCC stages. All this indicates that the abnormal cell cycle-associated pathways participate in HCC tumorigenesis.
In this study, using WGCNA analysis, we found that blue and red modules had the strongest correlation with tumor status. Next, we found 176 candidate genes according to module membership and gene significance. Then, we performed univariate Cox PHR analyses to obtain only 5 genes. Finally, we validated the expression of these 5 hub genes using the Oncomine platform, and 1 hub gene was excluded. We finally identified 4 genes correlated with the initiation and development of HCC – SOX4, STK39, TARBP1, and TDRKH. Among these 4 genes, SOX4, which is a member of the SOX transcriptional factor family, has been proved to play a crucial role in tumor progression and poor clinical outcome in several cancers [21–24]. In the present study, our research indicated that SOX4 is also overexpressed in HCC, and GSEA analysis suggested that SOX4 participates in angiogenesis, E2F targets, and epithelial-mesenchymal transition. In line with our analysis, previous studies have proved that SOX4 can promote epithelial-mesenchymal transition via activating the TGF-β pathway and can encode EGFR expression as a direct transcriptional factor [24,25]. Meanwhile, our research suggested that SOX4 expression is correlated with diverse immune infiltration levels. The results demonstrated that SOX4 expression had a weak-to-moderate relationship with neutrophils and DC. STK39 has been reported to be overexpressed in multiple cancers, including osteosarcoma and non-small cell type lung cancer (NSCLC) [26,27], but it is unclear whether STK39 expression is associated with HCC progression. Several studies have shown that TARBP1 is overexpressed in non-small-cell lung cancer (NSCLC) and HCC [28,29], but these studies did not reveal specific mechanisms related to TARBP1. In our present study, using GSEA analysis, we also analyzed the potential pathway involved and found that multiple pathways such as epithelial-mesenchymal transition involve the 4 hub genes leading to progression of HCC. In summary, our study provides clues regarding the biological roles and molecular characterization of these genes.
Our study has several limitations. First, the expression of hub genes and the accuracy of the risk prediction capability have not been validated in a large sample of clinical specimens. We hope to obtain more patients and tissues for future validation. Secondly, the specific functions of the 4 genes in HCC were still missing, even though the molecular characterization for hub genes were predicted, and we still need to perform experiments to explore this in the future. In addition, single-gene expression is insufficient to discover HCC initiation and progression [30,31]. Construction of the molecular network as a whole appears to be a better strategy. In the future, we aim to construct the 4 hub genes signature in order to obtain better outcomes.
Conclusions
In summary, using WGCNA and based on publicly available data in TCGA and NCBI GEO, we identified 4 genes (SOX4, STK39, TARBP1, and TDRKH) associated with HCC progression. Furthermore, the AUC curve suggested that the 4 genes have good power in diagnosing HCC. Mechanistically, immune infiltration and GSEA analysis indicated that the 4 genes may affect the immune cell populations infiltration to alter HCC progression through a variety of biological functions and pathways. We hope this predictive ability will contribute to future studies of liver cancer.
Supplementary Data
Constructing the weighted gene co-expression network. (A) Analysis of the scale-free fit index and mean connectivity for various soft-thresholding powers. (B) Clustering dendrogram of DEGs.
Footnotes
Conflicts of interest
None.
Source of support: This work was supported by grants from the High-level Talents of Luzhou City People’s Government jointly with Southwest Medical University (Chenchen’s team) Introduced Special Funding and the Funding of Science and Technology Bureau of Luzhou
References
- 1.Bray F, Ferlay J, Soerjomataram I, et al. Global cancer statistics 2018: GLOBOCAN estimates of incidence and mortality worldwide for 36 cancers in 185 countries. Cancer J Clin. 2018;68(6):394–424. doi: 10.3322/caac.21492. [DOI] [PubMed] [Google Scholar]
- 2.Ruzic M, Pellicano R, Fabri M, et al. Hepatitis C virus-induced hepatocellular carcinoma: A narrative review. Panminerva Med. 2018;60(4):185–91. doi: 10.23736/S0031-0808.18.03472-9. [DOI] [PubMed] [Google Scholar]
- 3.Tholey DM, Ahn J. Impact of hepatitis C virus infection on hepatocellular carcinoma. Gastroenterol Clin North Am. 2015;44(4):761–73. doi: 10.1016/j.gtc.2015.07.005. [DOI] [PubMed] [Google Scholar]
- 4.Lv WW, Liu D, Liu XC, et al. Effects of PKM2 on global metabolic changes and prognosis in hepatocellular carcinoma: From gene expression to drug discovery. BMC Cancer. 2018;18(1):1150. doi: 10.1186/s12885-018-5023-0. [DOI] [PMC free article] [PubMed] [Google Scholar]
- 5.Zou RC, Xiao SF, Shi ZT, et al. L Identification of metabolism-associated pathways and genes involved in male and female liver cancer patients. J Theor Biol. 2019;480:218–28. doi: 10.1016/j.jtbi.2019.08.011. [DOI] [PubMed] [Google Scholar]
- 6.Zou RC, Liang Y, Li LL, et al. Bioinformatics analysis identifies protein tyrosine kinase 7 (PTK7) as a potential prognostic and therapeutic biomarker in stages I to IV hepatocellular carcinoma. Med Sci Monit. 2019;25:8618–27. doi: 10.12659/MSM.917142. [DOI] [PMC free article] [PubMed] [Google Scholar]
- 7.Guo X, Xiao H, Guo S, et al. Identification of breast cancer mechanism based on weighted gene coexpression network analysis. Cancer Gene Ther. 2017;24(8):333–41. doi: 10.1038/cgt.2017.23. [DOI] [PubMed] [Google Scholar]
- 8.Huang H, Zhang Q, Ye C, et al. Identification of prognostic markers of high grade prostate cancer through an integrated bioinformatics approach. J Cancer Res Clin Oncol. 2017;143(12):2571–79. doi: 10.1007/s00432-017-2497-0. [DOI] [PMC free article] [PubMed] [Google Scholar]
- 9.Liu X, Hu AX, Zhao JL, Chen FL. Identification of key gene modules in human osteosarcoma by co-expression analysis weighted gene co-expression network analysis (WGCNA) J Cell Biochem. 2017;118(11):3953–59. doi: 10.1002/jcb.26050. [DOI] [PubMed] [Google Scholar]
- 10.Giulietti M, Occhipinti G, Principato G, Piva F. Weighted gene co-expression network analysis reveals key genes involved in pancreatic ductal adenocarcinoma development. Cell Oncol (Dordr) 2016;39(4):379–88. doi: 10.1007/s13402-016-0283-7. [DOI] [PubMed] [Google Scholar]
- 11.Yuan SX, Wang J, Yang F, et al. Long noncoding RNA DANCR increases stemness features of hepatocellular carcinoma by derepression of CTNNB1. Hepatology (Baltimore, Md) 2016;63(2):499–511. doi: 10.1002/hep.27893. [DOI] [PubMed] [Google Scholar]
- 12.Chen L, Yuan L, Wang Y, et al. Co-expression network analysis identified FCER1G in association with progression and prognosis in human clear cell renal cell carcinoma. Int J Biol Sci. 2017;13(11):1361–72. doi: 10.7150/ijbs.21657. [DOI] [PMC free article] [PubMed] [Google Scholar]
- 13.Yu G, Wang LG, Han Y, He QY. clusterProfiler: An R package for comparing biological themes among gene clusters. OMICS. 2012;16(5):284–87. doi: 10.1089/omi.2011.0118. [DOI] [PMC free article] [PubMed] [Google Scholar]
- 14.Yu G, Wang LG, Yan GR, He QY. DOSE: An R/Bioconductor package for disease ontology semantic and enrichment analysis. Bioinformatics (Oxford, England) 2015;31(4):608–9. doi: 10.1093/bioinformatics/btu684. [DOI] [PubMed] [Google Scholar]
- 15.Rhodes DR, Yu J, Shanker K, et al. ONCOMINE: A cancer microarray database and integrated data-mining platform. Neoplasia (New York, NY) 2004;6(1):1–6. doi: 10.1016/s1476-5586(04)80047-2. [DOI] [PMC free article] [PubMed] [Google Scholar]
- 16.Rhodes DR, Kalyana-Sundaram S, Mahavisno V, et al. Oncomine 3.0: Genes, pathways, and networks in a collection of 18,000 cancer gene expression profiles. Neoplasia (New York, NY) 2007;9(2):166–80. doi: 10.1593/neo.07112. [DOI] [PMC free article] [PubMed] [Google Scholar]
- 17.Zhang L, Zhao Y, Dai Y, et al. Immune landscape of colorectal cancer tumor microenvironment from different primary tumor location. Front Immunol. 2018;9:1578. doi: 10.3389/fimmu.2018.01578. [DOI] [PMC free article] [PubMed] [Google Scholar]
- 18.Broustas CG, Lieberman HB. DNA damage response genes and the development of cancer metastasis. Radiat Res. 2014;181(2):111–30. doi: 10.1667/RR13515.1. [DOI] [PMC free article] [PubMed] [Google Scholar]
- 19.Marques S, Fonseca J, Silva PM, Bousbaa H. Targeting the spindle assembly checkpoint for breast cancer treatment. Curr Cancer Drug Targets. 2015;15(4):272–81. doi: 10.2174/1568009615666150302130010. [DOI] [PubMed] [Google Scholar]
- 20.Wang H, Zhang X, Teng L, Legerski RJ. DNA damage checkpoint recovery and cancer development. Exp Cell Res. 2015;334(2):350–58. doi: 10.1016/j.yexcr.2015.03.011. [DOI] [PubMed] [Google Scholar]
- 21.Grimm D, Bauer J, Wise P, et al. The role of SOX family members in solid tumours and metastasis. Semin Cancer Biol. :2019. doi: 10.1016/j.semcancer.2019.03.004. [Epub ahead of print] [DOI] [PubMed] [Google Scholar]
- 22.Gunes S, Yegin Z, Sullu Y, et al. SOX4 expression levels in urothelial bladder carcinoma. Pathol Res Pract. 2011;207(7):423–27. doi: 10.1016/j.prp.2011.05.005. [DOI] [PubMed] [Google Scholar]
- 23.Bilir B, Osunkoya AO, Wiles WGt, et al. SOX4 is essential for prostate tumorigenesis initiated by PTEN ablation. Cancer Res. 2016;76(5):1112–21. doi: 10.1158/0008-5472.CAN-15-1868. [DOI] [PMC free article] [PubMed] [Google Scholar]
- 24.Zhang J, Liang Q, Lei Y, et al. SOX4 induces epithelial-mesenchymal transition and contributes to breast cancer progression. Cancer Res. 2012;72(17):4597–608. doi: 10.1158/0008-5472.CAN-12-1045. [DOI] [PubMed] [Google Scholar]
- 25.Scharer CD, McCabe CD, Ali-Seyed M, et al. Genome-wide promoter analysis of the SOX4 transcriptional network in prostate cancer cells. Cancer Res. 2009;69(2):709–17. doi: 10.1158/0008-5472.CAN-08-3415. [DOI] [PMC free article] [PubMed] [Google Scholar]
- 26.Li Z, Zhu W, Xiong L, et al. Role of high expression levels of STK39 in the growth, migration and invasion of non-small cell type lung cancer cells. Oncotarget. 2016;7(38):61366–77. doi: 10.18632/oncotarget.11351. [DOI] [PMC free article] [PubMed] [Google Scholar]
- 27.Huang T, Zhou Y, Cao Y, et al. STK39, overexpressed in osteosarcoma, regulates osteosarcoma cell invasion and proliferation. Oncol Lett. 2017;14(4):4599–604. doi: 10.3892/ol.2017.6728. [DOI] [PMC free article] [PubMed] [Google Scholar] [Retracted]
- 28.Ye J, Wang J, Tan L, et al. Expression of protein TARBP1 in human hepatocellular carcinoma and its prognostic significance. Int J Clin Exp Pathol. 2015;8(8):9089–96. [PMC free article] [PubMed] [Google Scholar]
- 29.Ye J, Wang J, Zhang N, et al. Expression of TARBP1 protein in human non-small-cell lung cancer and its prognostic significance. Oncol Lett. 2018;15(5):7182–90. doi: 10.3892/ol.2018.8202. [DOI] [PMC free article] [PubMed] [Google Scholar]
- 30.Yan Y, Lu Y, Mao K, et al. Identification and validation of a prognostic four-genes signature for hepatocellular carcinoma: Integrated ceRNA network analysis. Hepatol Int. 2019;13(5):618–30. doi: 10.1007/s12072-019-09962-3. [DOI] [PMC free article] [PubMed] [Google Scholar]
- 31.Kanda T, Yokosuka O, Moriyama M. Prognostic four-gene signature for overall survival in patients with hepatocellular carcinoma. Hepatol Int. 2019;13(5):519–20. doi: 10.1007/s12072-019-09976-x. [DOI] [PubMed] [Google Scholar]
Associated Data
This section collects any data citations, data availability statements, or supplementary materials included in this article.
Supplementary Materials
Constructing the weighted gene co-expression network. (A) Analysis of the scale-free fit index and mean connectivity for various soft-thresholding powers. (B) Clustering dendrogram of DEGs.


