



Abstract
A significant portion of the population suffers from idipoathic calcium oxalate (CaOx) kidney stones, and current clinical treatments of stones have limited lasting success with a high rate of patients suffering from reoccurring stones. Understanding the role of physiologically relevant urinary species on the formation, aggregation, and growth of CaOx crystals can allow for better understanding of this complex biomineralization process and lead to more effective clinical treatments. Our prior work has focused on developing a two-stage model system, where the first stage emulates the formation of Randall’s plaque, and the second stage examines the influence of the plaque on overgrowth of CaOx into a stone. Herein, we report on the development of an easy-to-use flow-cell platform that utilizes basement membrane extract (BME) as a biologically relevant crystallization substrate to study the influence of urinary ‘inhibitors’ on the in situ formation and growth of CaOx on BME under flow conditions. Magnesium, citrate, and osteopontin were studied because of their known ability to inhibit CaOx formation, but their influence also led to interesting modifications to the terminal crystal habit. Magnesium had little to no effect on the CaOx crystallization, but both citrate and osteopontin resulted in significant changes to the crystallization kinetics and the terminal crystal habits. Triply inhibited artificial urine solutions resulted in CaOx monohydrate formations that resembled physiological stones, and the in situ platform allowed for morphogenesis to be dynamically monitored. The BME was also used in a two-stage model system to first grow CaP that mimicked Randall’s plaques, whereby the impact of the CaP crystallizing surface on CaOx formation could be studied. It was found that the CaP surface did not result in any significant changes in CaOx crystal formation or growth indicating that the urinary inhibitors and the basement membrane substrate were the dominant factors in modulating CaOx crystallization. It was also found that the basement membrane surface promoted the attachment and/or nucleation and growth of both CaOx and CaP crystals compared to bare glass surfaces, thereby enabling easy study of the urinary inhibitors. The work presented here has elucidated the terminal growth habit of different COM structures and has provided an easy to use platform that can be widely adopted by the kidney stone and other crystallization communities.
1. Introduction
Kidney stones affect up to 5-12% of the population,1,2 and they represent a complicated biomineralization phenomena governed by multiple physiological factors.2 These biominerals can cause severe pain to patients, and clinical management typically involves surgery and dietary changes including reducing intake of acidic foods, increasing water intake, and consuming citrate, a known inhibitor of kidney stone formation.3 However, these approaches have limited effectiveness, and idiopathic stone formation is a continuing and reoccurring problem. Understanding the underlying mechanisms of kidney stone onset, crystal growth, and biological effects of urinary inhibitors are needed to provide clinicians with more effective treatment strategies for suffering patients.
Calcium oxalate (CaOx) is the most abundant mineral phase (70-80%) of kidney stones, and approximately 60% of stones start growing attached to the kidney’s papillae that have become permeated with calcium phosphate (CaP) deposits known as Randall’s plaques.2,4–8 Randall’s plaques purportedly start as spheroidal CaP nodules in the basement membrane of the thin loops of Henle; then mineralization nucleates or spreads into the kidney interstitial tissue, and eventually breaks through the papillary epithelium where it becomes exposed to the lower pH and oxalate rich urinary space that allows for CaOx overgrowth, resulting in biphasic kidney stones containing a small CaP core within the bulk CaOx stone.5,7–9
CaOx monohydrate (COM) is the most thermodynamically stable CaOx polymorph, and it can attach to the lining cells and/or grow on the CaP plaque to form the majority phase of calcium kidney stones.6,10,11 CaOx dihydrate (COD) is less prevalent in kidney stones because it has a reduced capacity to form stable aggregates and/or attach to the epithelia, and it is thus typically voided through the urine.10 Synthetically crystallized COM via traditional crystallization processes (i.e., in vitro using a beaker) typically forms penetration twinned “coffin” structures and COD structures that resemble tetragonal bipyramids/prisms. However, physiological crystals can have a variety of different morphologies, often not resembling such classically formed crystal habits. Physiological kidney stones contain a complex organic matrix of lipids, cellular debris, polysaccharides, and proteins including osteopontin (OPN), Tamm-Horsfall protein (THP), nephrocalcin, hyaluronan, and albumin.5,12–15 A significant body of research has shown that these molecules and proteins can dramatically alter the crystal habit, surface attachment, aggregation, and growth of CaOx crystals, and they must be taken into consideration when studying CaOx stone formation due to their ability to either promote or inhibit physiological stone formation.5,12–14,16
Atomic force microscopy (AFM) analysis and fluorescent tagging has revealed that anionic glycoproteins (e.g. OPN, THP), synthetic macromolecules (e.g. polyacrylic acid, polyaspartic acid), and small molecules (e.g. citrate) greatly inhibit the formation and/or aggregation of CaOx crystals due to adsorption to positively charged CaOx crystal facets.9,17–23 However, these studies analyzing inhibitors have primarily utilized traditional in vitro crystallization platforms to synthesize CaOx precipitated from supersaturated ionic and artificial urine (AU) solutions in the beaker, and there are significant differences between each study with respect to the crystallization conditions (e.g. saturation, temperature, agitation, etc.) and terminal crystal habits formed. Furthermore, the relative supersaturation of these solutions drops as crystals nucleate and grow in the beaker, making kinetics studies of crystal growth more difficult. To this end, Nancollas’ group developed a complex constant concentration crystallization platform using calcium electrodes to better study the crystallization kinetics and effects of different urinary inhibitors (e.g. OPN, citrate, polyaspartic acid, etc.).24–27 While these studies have proven instrumental in understanding the basics of disparate segments of this complex biomineralization process, they do not adequately capture the natural kidney environment or crystal growth substrates, and the resulting CaOx crystals do not typically resemble physiological stones.
It is well known that the crystallization conditions (e.g., pH, ionic ratios, impurities),16 nucleation surfaces,28 and solution agitation29 can have a dramatic effect on the crystal habits formed, therefore it is not completely unexpected that traditional in vitro experiments have not been able to fully replicate physiologically formed kidney stones. Researchers have attempted to overcome some of these challenges by using more elaborate reaction processing systems. For example, growing CaOx in “double-diffusion” gel systems (e.g. gelatin/collagen, silica, and agar/agarose) has been investigated to more closely mimic the physiological environment; however, there has been limited success at forming relevant crystal morphologies.30–33 Microfluidic experiments have also recently been used to provide more control of the crystallization conditions for CaCO3,34 and while these systems have not been used for CaOx, microfluidic systems have the added benefit of mimicking the urinary flow conditions during physiological stone formation. Herein, we report on the development of a simple in vitro flow-cell crystallization system which brings us a step closer to providing a more biologically relevant environment by providing a constant urinary concentration, along with a pertinent nucleation/crystallization substrate and solution additives, which we hope will progress the field towards its goal of achieving more physiologically relevant model systems of stone formation.
The flow-cell was coated with a thin layer of basement membrane extract (BME) gel to mimic the first site of mineral formation observed in Randall’s plaque. Commercially available BME (purified from Engelbreth-Holm-Swarm tumor) was used, and it is composed of laminin, collagen IV, entactin, and heparan sulfate proteoglycan. Although the constituents in this reconstituted BME hydrogel are not organized in the same fashion as native basement membrane, we hypothesized that the simple presence of molecular constituents might be influential as crystal nucleation inhibitors or promoters.
Although the relevant mineral phase in Randall’s plaque is CaP, we were also interested in determining the influence of basement membrane on CaOx crystallization because as the Randall’s plaque breaches into the urinary space, the membrane and tissue constituents become exposed and further serve as a nidus of CaOx crystallization. It has also been hypothesized that CaOx can crystallize directly off of the basement membrane without the presence of CaP plaques.35 Furthermore, some unpublished observations from our prior work in mimicking Randall’s plaque36,37 found that intriguing CaOx structures were produced when using chondroitin sulfate (CS) pre-adsorbed onto a collagen sponge scaffold. The CaOx overgrowths that formed on this scaffold grew into spherules comprised of densely-stacked tablets, a morphology remarkably similar to that commonly seen in stones (Fig. 1). Therefore, we were keen to see if similar features might be produced by the BME because it also contains glycosaminoglycans (GAGs). Although the GAG constituents in BME are primarily heparin sulfate, they are very similar to chondroitin sulfate from a crystallochemistry perspective because both are highly charged GAGs with carboxylate and sulfate functionality. In addition, a thin film of BME can be applied to a glass chamber that enables observation of its formation mechanism, which was our goal with this new flow cell system.
Figure 1.

CaOx mineralization of a collagen sponge with pre-adsorbed CS. (A-B) SEM micrographs of CaOx deposits on the CS-coated collagen sponge in a solution of AU (no soluble polymer additive). (B) Higher magnification of boxed region in (A) shows the spherules are comprised of densely stacked layers of crystals. A few small aggregates of crystals are also present. The asterisk in (A) indicates the region of interest selected for the EDS spectrum in the insert, which shows the stacked crystals are composed of CaOx. The tabular habit suggests these are twinned COM crystals. (C) Another region shows similar stacks of COM tablets as well as some rosette type aggregates, and a few small COD crystals with the typical bipyramid habit. (D) The control reaction, with CS adsorbed onto a glass slide (no collagen), formed a few COD bipyramids, many COM tablets that were either isolated or within rosette aggregates, but the densely layered stacked spherules were not seen.
Crystallization experiments were performed under flow conditions using AU solutions doped with some of the most widely studied urinary inhibitors, including Mg2+, citrate, and OPN. Reactions were performed at room temperature (RT) or 37 °C, and crystallization at RT was captured in situ to allow for analysis of crystal nucleation, growth, and terminal crystal habit formation. Of the numerous proteins associated with stones, OPN was chosen for this initial study because it has been found to be present in the organic layers of Randall’s plaque,38 as well as in stones.39,40 In addition, our group has been particularly interested in OPN because, even though it is an inhibitor of crystal nucleation, this inhibitory activity can promote non-classical crystallization processes where the protein induces/stabilizes nanodroplets of a fluidic amorphous mineral precursor that enables intrafibrillar mineralization of collagen,41 which we have argued may actually promote mineralization of collagen fibrils within the kidney’s interstitium.36,37 Furthermore, we used the system to analyze the impact of CaOx overgrowth on a basement membrane impregnated with CaP to mimic the papillary Randall’s plaques found in the kidney. The flow cell system has the added benefit of forming crystals under constant concentration conditions without the need for complicated calcium electrodes that become clogged and do not work efficiently with expensive protein and polymeric additives. This system builds upon both the traditional beaker and gel crystallization experiments by first replicating the effects of known urinary inhibitors (Section 3.1) and then demonstrating previously unseen behavior that more closely mimics physiological stones (Section 3.2–3.3).
2. Experimental
2.1. Materials
Borosilicate glass microscope slides (25 x 75 x 1 mm3), calcium chloride dihydrate (CaCl2•2H2O), sodium oxalate (Na2C2O4), sodium chloride (NaCl), potassium chloride (KCl), anhydrous sodium sulfate (Na2SO4), anhydrous sodium phosphate monobasic (NaH2PO4), sodium citrate dihydrate (Na3C6H5O7•2H2O), and sodium azide (NaN3) were purchased from Fisher Scientific. Magnesium sulfate heptahydrate (MgSO4•7H2O), Nochromix® powder, and sulfuric acid (H2SO4) were purchased from Sigma-Aldrich. Xiameter® RTV-4232 T2 polydimethyl siloxane (PDMS) was purchased from Dow Corning, and Cultrex® Basement membrane extract (BME, Pathclear®) was purchased from Trevigen®. All consumable materials were purchased at the highest purity grade available and used as received.
Osteopontin (OPN) powder derived from bovine milk was kindly provided by Arla Foods Ingredients Group P/S, Denmark (Lacprodan® OPN-10). Deionized water (DIW, 18.2 MΩ-cm) was produced in house using a Barnstead NanoPure Diamond™ system.
2.2. Artificial Urine (AU) solutions
CaOx forming AU stock solutions were prepared in DIW with 80 mM NaCl, 60 mM KCl, 25 mM Na2SO4, 5 mM NaH2PO4, and 0.2 wt% sodium azide (anti-bacterial/fungal agent) with either 10 mM CaCl2 or 2 mM NaOx. CaCl2 and NaOx AU stock solutions were stored at 4 °C until needed. Prior to use, different inhibitors were added to the two stock solutions according to Table 1, solution pH was adjusted to pH=6.0 with 1 M NaOH or 1 M HCl, and AU solutions were vacuum filtered (0.22 μm). Table 1 values were chosen out of a series of experiments that examined all 8 potential combinations of +/− inhibitors because these values best represented the features of interest that were observed. We also examined 2x and 5x concentrations, but this mainly just slowed the overall kinetics without impacting crystal habits, so we chose to focus here on the more interesting morphological effects. AU solution stability was confirmed by measuring pH of AU solutions including all CaCl2, NaOx, and combinations of the two for each of the 4 groups at 37 °C for up to 48 h (Electronic Supplementary Information: ESI Fig. S1). pH was stable around pH=6.0 and no off-target or unexpected crystals formed (e.g., no CaP formed at pH=6.0 within any of the CaCl2 AU solutions).
Table 1.
Inhibitor concentrations used for AU solution groups
| Compound | Group 1 | Group 2 | Group 3 | Group 4 |
|---|---|---|---|---|
| MgSO4•7H2O | 0 mM | 4 mM | 4 mM | 4 mM |
| Na3C6H5O7•2H2O | 0 mM | 0 mM | 3 mM | 3 mM |
| OPN | 0 μg/mL | 0 μg/mL | 0 μg/mL | 25 μg/mL |
2.3. Flow-Cell Assembly
Flow-cells consisted of a silicone elastomer (PDMSe) flow chamber gasket adhered between a glass slide bottom coated with BME and a glass slide top with two inlet ports and one outlet port for AU solutions (Fig. 2 A–B). The glass microscope slides were first cleaned by soaking in Nochromix/Sulfuric acid solution (prepared according to manufacturer specifications), washed in DIW 3x, and N2 dried. To produce the flow cell top, three holes were drilled into a glass slide using a Dremel tool, and Tygon® tubing was adhered to the ports with PDMS and cured. The flow chamber gasket was templated out of a ~1 mm thick PDMSe sheet (prepared according to manufacturer specifications). The specific dimensions of the flow cell top and gasket assembly can be found in the ESI Fig. S2. To assemble the flow cell, the PDMSe gasket was first O2 plasma cleaned (PDC-001 Expanded Plasma Cleaner, Harrick Plasma) to activate the surfaces in order to promote adherence to the glass-slide portions of the assembly (e.g., flow cell top and bottom), and then the PDMSe gasket was manually pressed onto a Nochromix cleaned glass slide. Next, 75 μL of BME solution (stored at 4 °C) was pipetted onto the bottom slide in the region indicated in Fig 2 A where it naturally spread into a film. The top slide was then pressed onto the PDMSe gasket being careful to ensure that the inlet/outlet ports were properly aligned with the flow region of the PDMSe gasket. Finally, the assembly was placed into an incubator and the BME was gelled at 37 °C for 30 min.
Figure 2.

Crystallization flow-cell assembly. (A) Schematic of flow-cell footprint highlighting the placement of the BME, gelation at 37 °C, and respective regions of interest for crystallization. (B) 3D schematic of the flow-cell assembly. (C) Placement of the flow cell below the ultra-long-working-distance objective of a polarized light microscope for in situ analysis of crystal growth at RT.
2.4. CaOx Flow-Cell Experiments
Two FH10 peristaltic pumps (Fisher Scientific) were used to separately flow CaCl2 and NaOx AU solutions through the flow-cell assembly at 42 μL/min. The two solutions were allowed to mix/diffuse where they came into contact along the central axis of the laminar flow cell on the BME substrate. Assuming equal mixing, the final CaOx crystallization concentration was 5 mM CaCl2 and 1 mM NaOx. However, given that the flow is laminar, there is a distinct concentration gradient outward from the central line where the two reactant flows meet. For testing at physiological temperatures, the flow cell and AU solutions were equilibrated in an incubator at 37 °C for 30 min prior to flow testing. After a set period of flow time (0.5 to 24 h) in the incubator, the flow-cell was deconstructed and the BME crystallization surface microscope slide was cleaned of residual salts by carefully immersing in DIW 3x for 1 min each, dehydrated with ethanol, and air dried. Crystals collected from the outlet port of the flow cell were purified 3x by centrifugation (8000 rpm, 45 min) in DIW and decanting. Purified crystals suspended in DIW were pipetted onto a glass slide and dried overnight in air before analysis.
For in situ observation of flow cell crystallization at RT, the flow-cell device was placed onto a polarizing light microscope (PLM) equipped with a 1st -order red (gypsum) wave plate (WP), which enables amorphous and crystalline matter to be distinguished (see section 2.6 for further details), and time-lapse images were taken of the BME substrate to capture crystallization onset and growth (Fig. 2 C). Typically, crystal formation was evident after 0.25-0.5 h of flow after which the time-lapse imaging was started. Images were manually re-focused periodically to capture the most significant portions of the crystallization. Time-lapse images were combined into movies that can be found in the ESI.
2.5. CaP + CaOx Flow-Cell Experiments
CaP forming AU stock solutions were prepared in DIW with 80 mM NaCl, 60 mM KCl, 25 mM Na2SO4, and 0.2 wt% sodium azide with either 10 mM CaCl2 or 5 mM NaH2PO4. CaCl2 and NaH2PO4 AU stock solutions were stored at 4 °C until needed. Prior to use, solution pH was adjusted to pH=7.5 with 1 M NaOH or 1 M HCl, and AU solutions were vacuum filtered (0.22 μm). Solutions were flowed through the BME flow cell platform at 37 °C for 1 h resulting in a CaP impregnated BME. After CaP formation, the CaP solutions were replaced with the relevant CaOx stone forming solutions (groups 1-4) and experiments were allowed to proceed as previously discussed.
2.6. Analysis
For in situ analysis, the flow cell device could be placed below the ultra-long working distance objectives of an Olympus BX60 PLM. A gypsum 1st-order red WP retarder was used to image and identify crystalline and amorphous formations of interest on test surfaces. With the additional retardation added by the λ-plate, amorphous material can be seen and should exhibit the same magenta color as the non-birefringent background, while crystalline matter will be birefringent blue and yellow/orange (at this thickness). All 37 °C flow experiments were also analysed using the PLM after cleaning of residual salts or purification from collected solutions. A FEI Nova NanoSEM 430 with EDS detector at 10 kV with a 5 mm working distance and 5 nm spot-size was used to image test surfaces and to confirm CaOx and CaP chemistry. Prior to SEM, the entire flow-cell assembly bottom slide was coated with 10 nm AuPd to prevent surface charging. A Renishaw inViaTM Raman microscope equipped with a 632 nm laser was used to identify and characterize individual crystalline deposits at 500x magnification with 30 sec laser exposure. All crystallization experiments/time-points reported were performed in triplicate.
3. Results and Discussion
3.1. Groups 1 through 3 Flow-Cell CaOx Crystallization
For crystallization experiments performed on the flow-cell platform, crystallization typically occurred along the central section of the flow cell where the two AU solutions (CaCl2 or NaOx) met and created the highest supersaturation (Fig. 2 A). Flowing AU maintained a constant local supersaturation composition by replenishing free Ca2+, C2O42−, OPN, etc. that were consumed during crystallization. Crystals were found to form both on the BME surface and within the bulk of the BME hydrogel (ESI Fig. S3–4). A minority of crystals also formed on the top of the flow cell assembly away from the BME, and these crystals were used as an internal control to validate the effect of the BME on crystallization (discussed in detail, section 3.4). All flow experiments were performed both at RT using in situ time-lapse microscopy and at 37 °C. Furthermore, crystals formed on the flow cell BME substrate were compared to purified crystals collected in a beaker from the outlet port of the flow assembly. These collected crystals could have formed before they eluted from the flow-cell assembly or statically in the beaker after collection mimicking a traditional crystallization experiment.
Flow crystallization experiments performed using group 1 AU solutions containing no crystallization inhibitors produced a majority of classically twinned COM coffins and dumbbells with interspersed COD bipyramids (Fig. 3 A–B). The different crystal habits were readily distinguishable using optical and SEM inspection and confirmed using Raman analysis (Fig. 4). During flow at 37 °C, COM rapidly formed on/ within the BME with a ~5-30 min induction time, and rapidly grew to cover exposed BME, while COD typically appeared after ~30-60 min. For all experiments performed at 37 °C, reported induction times are approximations since the flow-cells were not directly observable while within the incubators. Instead, flow-cells were only removed at set increments and optically assessed; therefore, crystal appearance is necessarily segmented along these increments. After 2 h, experiments were stopped because the flow cell typically became clogged with an excess of crystals making further analysis difficult; however, 3 experiments were allowed to continue for 24 h to confirm that no additional CaOx crystal habits were observed. Analogous in situ time-lapse experiments were performed at RT to capture the early-stage crystal nucleation and growth of the respective CaOx crystal habits (ESI Fig. S5). There was no significant difference between experiments performed at RT and 37 °C, and using the optical in situ method, no amorphous precursors were detected. At RT, induction times were 21 ± 14 min for COM formation and 51 ± 29 min for COD. These values are consistent with 37 °C approximations.
Figure 3.

Representative micrographs of Groups 1-2 (A-B), and Group 3 (C-D) using polarized light (with gypsum λ-plate) and SEM, showing relevant CaOx crystal habits. Group 1-2 formed COM dumbbells and coffins and COD bipyramids while group 3 formed COM tablets and COD bipyramids.
Figure 4.

Raman spectra of COM and COD crystals. All COM and COD crystal habits were distinguished both by Raman and visual inspection.
Flow experiments performed using group 2 AU solutions containing 4 mM of Mg2+ ions produced the same CaOx crystal types/habits as found in group 1 experiments at both 37 °C and RT with comparable crystal induction times. Mg2+ has been reported to replace Ca2+ in the crystal lattice resulting in decreased nucleation and growth rates.16,42 However, at the tested concentrations, Mg2+ did not significantly impact the resulting crystal habits or kinetics, and no CaOx crystals that resembled physiological stones were detected.
Flow crystallization experiments performed using group 3 AU solutions containing both 4 mM of inhibitory Mg2+ ions and 3 mM of citrate produced COD bipyramids and COM tablets with no evidence of the twinned COM dumbbells and coffins typical of group 1-2 crystallizations (Fig. 3 C–D). COM tablets are non-twinned, plate-like habits with exaggerated (100) faces that are distinguishable from the other COM habits. The kinetics of group 3 crystallization at 37 °C was also significantly different from groups 1-2. COD bipyramids rapidly formed after ~15-30 min of flow, and COM tablets did not typically form until ~30-60 min (ESI Fig. S6). However, both crystal types rapidly grew after initial crystal formation. There was no detectable difference in the crystal morphology between experiments performed at RT and 37 °C, and experiments were typically halted after 8 h due to excessive crystal formation leading to flow-cell obstruction, as mentioned previously. At RT, induction times for COD formation were 29 ± 24 min and 49 ± 32 min for COM. These values are consistent with 37 °C approximations.
The group 3 modification of COM coffins into disk-like tablets is consistent with previous work on the effect of citrate on CaOx.43 AFM analysis has shown that citrate binds strongly to COM’s (100) face due to carboxylic acid-Ca2+ interactions that cause step-specific pinning of growth hillocks during crystallization resulting in COM tablets.18,19 Citrate, and other anionic molecules, can also bind to the (100) face of COD causing the bipyramid to elongate;44,45 however, this was not observed using the concentrations studied for groups 1-3. Citrate has also been found to inhibit CaOx crystal growth and aggregation in 1 v/v % urine,46 which explains the slightly increased induction time of group 3 crystals.
3.2. Group 4 Flow-Cell CaOx Crystallization
Experiments performed using groups 1-3 produced CaOx crystals in general agreement with the literature and showed that the new in situ flow cell platform can effectively be used to form reproducible crystal habits and study CaOx formation. Flow crystallization experiments performed using group 4 solutions containing Mg2+, citrate, and OPN urinary inhibitors produced a non-traditional COM crystal habit, confirmed via Raman spectroscopy, with a central depression resulting in a donut appearance not seen in the previous AU groups, interspersed with COD bipyramids and a sporadic minority of COM tablets (Fig. 5–6). None of the typical twinned COM coffins or dumbbells observed for groups 1-3 were detected. The initial stages of the non-traditional “donut” COM habit resembles structures reported by Grohe9,21,22 caused by OPN preferentially binding to the (100) COM face, resulting in a depression of the growth face. These COM habits when viewed parallel to the [010] direction resemble dumbbells, but when viewed from the [100] resemble donuts with a central depression. Additional SEM images highlighting the (100) depression can be found in the ESI (ESI Fig. S7).
Figure 5.
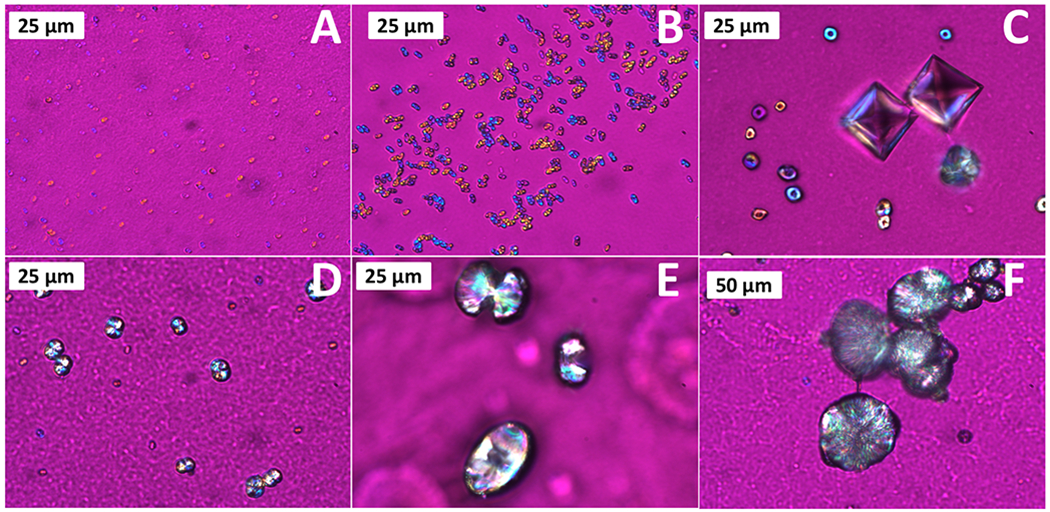
Polarized light micrographs (with gypsum λ-plate) of non-traditional COM structures found in Group 4, showing the onset of crystal formation and growth to COM spherules. (A) crystallization onset as micron-sized droplets; (B-C) growth to COM donuts with distinct dimple structure; (D-E) continued growth and shrinking of central dimple; and (F) fully formed spherule.
Figure 6.

SEM images of Group 4 non-traditional COM structures. (A-F) Stages of growth that correlate with the relative stages of growth seen in Fig. 5. Insets show EDS spectra of CaOx structures (*). (A) Initial crystalline formation with visible depression on the (100) face that (B-E) starts to slowly fill in with additional crystal growth resulting in (F) fully formed COM spherules.
However, the work by Grohe did not report on the terminal habit of these crystalline COM donut structures. The use of the flow cell platform allowed for the development of COM donuts to be captured and analysed to its final crystalline form resembling large COM spherules (Fig. 5–6 and ESI Fig. S8). The OPN modulated COM structures are initially evidenced as 2-5 μm diameter mineral globules or spheroids (Fig. 5–6 A) that then grow into small donut shaped crystalline aggregates with a distinct dimple in the center (Fig. 5–6 B–C). It is possible that these initial mineral globules with rather non-descript structures resulted from an amorphous precursor, but they appeared birefringent by the time they could be resolved using the optical methods employed. As constant-concentration crystal growth proceeds, the central dimple shrinks as additional crystal layers grow (Fig. 5–6 D–E), resulting in a finalized COM spherule with a distinct plate-like substructure radiating from the center (Fig. 5–6 F). In situ time-lapse image capture at RT was also able to confirm the formation of these structures (ESI Fig. S8), and there appeared to be no significant difference between crystallization at 37 °C and RT. The fully-formed COM spherules (at ≥ 16 h flow) closely resemble the morphological characteristics that have been reported for physiological stones (Fig. 7).6,9
Figure 7.

Representative SEM images of fully formed Group 4 COM spherules that closely resemble the morphological characteristics reported for physiological kidney stones.
In addition to the donut-to-spherule COM morphology evolution, crystal growth at 37 °C of group 4 AU solutions was markedly slower than the previous groups with increased induction times due to the urinary inhibitors. COD formed after ~1 h flow, quickly followed by COM tablet formation and growth. The COM donuts did not typically form on the BME until ~6 h, and their relative growth through the various stages highlighted in Fig. 5–6 took an additional 10-15 h of AU flow to achieve fully formed and appreciably large (40-50 μm diameter) COM spherules. Experiments were allowed to proceed for up to 24 h before the experiment was stopped due to clogging of the flow-cell. Furthermore, COD bipyramids slowly became more elongated with an exaggerated (100) face as the flow experiment continued to its completion, presumably due to OPN and/or citrate preferentially binding to the positively charged COD face.47 At RT, induction times for COD formation were 71 ± 47 min, 79 ± 29 min for COM tables, and 340 ± 120 for COM donuts. These values are roughly consistent with 37 °C approximations. A summary of the crystalline habits produced by CaOx AU groups 1-4 is summarized in Fig. 8.
Figure 8.

Summary of CaOx crystal habits formed by the four AU groups and their respective crystal planes/directions of interest. (A) COM dumbbell, (B) COM coffin, (C) COD bipyramid, (D) COM tablet, (E) COM spherule (F) COM donut, and (G) extended COD bipyramid.
3.3. CaP + CaOx Flow-Cell Crystallization
CaOx flow crystallization experiments were also performed using a seed layer of CaP grown on/ within the BME in an attempt to more closely mimic the Randall’s plaque derived biphasic CaOx + CaP stones commonly found in idiopathic stones.5,9 The initial CaP layer was grown on the BME over 1 h using AU solutions without oxalate ions at a pH of 7.5. Once the CaP layer was formed, the AU solutions were switched for the CaOx AU solutions at pH of 6.0, and the experiments proceeded in a fashion identical to sections 3.1–3.2.
Crystalline CaP formation was identified via the birefringence seen in polarized light microscopy (ESI Fig. S9 A), and Raman spectroscopy showed the characteristic apatite peak at 957 cm−1 corresponding to the PO4−3 v1 symmetric stretch (ESI Fig. S9 B). The BME acted as an effective nucleation promoter, and SEM analysis revealed that the CaP formed both within the BME gel and on the gel surface as plate-like crystallites (ESI Fig. S9 C–D). There was no evidence of CaP spherules as seen in Randall’s plaque, but the surfaces at this stage were heavily mineralized and thus late stage; we’ve often observed that amorphous CaP does not last long before transforming into hydroxyapatite platelets. Attempts to form the CaP layer directly on a glass slide without the BME resulted in little to no appreciable CaP formation within the flow cell (see section 3.4 for more details); however, extensive CaP precipitates did form in the outflow collection beaker.
Groups 1 and 4 CaOx flow experiments performed both at RT and 37 °C on the CaP-mineralized BME did not produce any crystal habits that were not reported previously from the BME flow experiments (section 3.1–3.2). Group 1 formed COD and COM dumbbells and coffins, and group 4 formed COD and COM donuts/spherules and tablets (Fig. 9). Induction times were within the same ranges as those reported for the BME without CaP. CaOx crystals were identified on both the CaP surface and protruding from within the bulk (ESI Fig. S10). Raman analysis detected expected CaOx and CaP peaks (ESI Fig. S11). The apatite CaP surface appears to act as a ready template for CaOx formation, but it does not significantly alter the habits of CaOx, suggesting that the BME substrate and the urinary inhibitors used are the dominant nucleation and growth controllers.
Figure 9.

CaOx formation on CaP mineralized BME film using (A-B) Group 1 and (C-D) Group 4 solutions. (A-B) Group 1 resulted in COM dumbbells and coffins and COD bipyramids. (C-D) Group 4 resulted in COM donuts/spherules and tablets and COD bipyramids. CaP did not significantly impact the crystals habits formed relative to the BME flow experiments discussed previously. SEM insets show EDS of (B) CaP and (D) CaOx regions (*)
3.4. Effect of BME on Crystallization
We have shown that urinary crystallization inhibitors can strongly impact the crystal habit, formation, and growth of CaOx crystals on a BME surface using the developed in situ flow-cell platform. However, the explicit impact of the BME gel has not been discussed. To this end, we performed analogous control experiments using the flow-cell platform without the BME growth substrate, using just the bare glass slide surfaces, while keeping all other conditions the same. For all CaOx groups, there were markedly fewer crystals that formed on the bare glass surface than analogous experiments performed using the BME, indicating that the BME either directly promotes the nucleation of crystals or the attachment and growth of crystals that nucleate in solution. Similar conclusions were made when attempting to form CaP on bare glass slides, which resulted in no appreciable crystal formation. In both the CaP and CaOx systems in the presence of BME, the early stage minerals appear to be covered in gelatinous material, seeming to suggest the BME matrix is promoting nucleation of crystals (or possibly amorphous precursors) from within the gel (ESI Fig. S4).
Interestingly, group 1-2 experiments performed on a glass slide showed no evidence of COM dumbbell formation in contradiction to the multitudes of dumbbells identified in the presence of the BME (Section 3.1). This suggests that the BME surface also played an integral role in forming these highly twinned structures. We suspect the heparan sulfate constituent within the BME generated this effect on CaOx formation because this sulfated GAG is so similar in chemical functionality to CS that produced similar structures (Fig. 1). Although there is specificity of GAGs within different tissues, this is generally related to protein and cell binding ligands; such specificity is not likely as pertinent to the crystallochemical interactions divulged here. In addition, heparan sulfate has been found to be up-regulated during nephrolithiasis,48 is present in the organic matrix of kidney stones, and inhibits the formation of CaOx.49 The purported inhibitory action suggests it may have binding interactions with the mineral, and with some specificity could perhaps promote this strong twinning effect. Group 4 experiments on glass showed extensive evidence of COM donut formation; however, across all experiments performed without BME, very few formed full COM spherules were identified. No difference was detected for group 3 experiments. Crystals collected and purified from the outflow port of the flow-cell also were consistent with crystals that formed on the glass surface without the BME, further highlighting the impact that the BME has on the CaOx system.
Use of the BME as a CaOx and CaP growth surface offers several benefits over bare glass; however, the CaOx crystallites formed using this platform did not form the concentric sphere structures with varying chemical makeup that have been shown for physiological stones. Our group has observed concentric laminations in CaP spherulites formed from what appeared to be amorphous gelatinous globules. However, the CaOx formed here did not appear to form via an amorphous phase, and instead the resulting spherulites seem to result from the pronounced twinning that was apparently stimulated by the BME and inhibitors. So if organic impurities were excluded here, they likely remained between the twinned platelets, rather than ending up on diffusion limited zones of exclusion during radial spherulitic growth. Furthermore, the flow-cell system used constant concentration solutions to form the supersaturated conditions making it an excellent platform to study crystal growth and kinetics. However kidney stones are formed over weeks-months during which the physiological environment can change greatly in both the relative supersaturation and chemical constituents present, and it is likely that this temporal variability is important to form concentric stones. Fortunately, the flow-cell platform developed here can easily be modified to create such temporally varied solutions by modulating the AU solution composition during the course of the experiment to more closely mimic the ebb-flow during physiological kidney stone formation. Future studies will investigate this possibility.
Conclusions
We have reported on the development and validation of a simple in vitro flow-cell crystallization platform that addresses several drawbacks of traditional CaOx crystallization studies in beakers. The flow-cell system used a physiologically relevant basement membrane extract as the primary crystal growth surface to study its effect on crystal nucleation and growth, as well as its combined effect with solution additives such as citrate, magnesium, and OPN on the formation and crystal growth of CaOx under flow. In situ time-lapse imaging allowed for the early crystal onset and development to be captured in real time, and CaOx structures were formed that were morphologically similar to physiological kidney stones when the crystallizing solution was ‘inhibited’ to the greatest degree. Furthermore, we used the flow-cell system to mimic the formation and growth of CaOx crystals on CaP-BME hybrids mimicking the papillary Randal’s plaques present in many kidney stones. The work presented here has elucidated the terminal growth habit of different COM structures and has provided an easy to use platform that can be widely adopted by the kidney stone and other crystallization communities.
Supplementary Material
Acknowledgements
Research reported in this publication was supported by the National Institute of Diabetes and Digestive and Kidney Diseases of the National Institutes of Health under Award Number R01DK092311. The content is solely the responsibility of the authors and does not necessarily represent the official views of the National Institutes of Health. The authors gratefully acknowledge Arla Foods Ingredients Group P/S, Denmark, for providing the Lacprodan® OPN-10 used in this study.
Footnotes
Electronic Supplementary Information (ESI) available: Flow-cell assembly details, basement membrane extract micrographs, time-lapse calcium oxalate crystallization micrographs, and calcium phosphate formation and characterization. Also included are time-lapse movies showing crystallization events .
Conflicts of interest
There are no conflicts to declare
References
- 1.Parmar MS, BMJ, 2004, 328, 1420–1424. [DOI] [PMC free article] [PubMed] [Google Scholar]
- 2.Coe FL, Evan A and Worcester E, J. Clin. Invest, 2005, 115, 2598–2608. [DOI] [PMC free article] [PubMed] [Google Scholar]
- 3.Pearle MS, Goldfarb DS, Assimos DG, Curhan G, Denu-Ciocca CJ, Matlaga BR, Monga M, Penniston KL, Preminger GM, Turk TMT and White JR, J. Urol, 2014, 192, 316–324. [DOI] [PubMed] [Google Scholar]
- 4.Daudon M, Bazin D and Letavernier E, Urolithiasis, 2015, 43, S5–S11. [DOI] [PubMed] [Google Scholar]
- 5.Evan AP, Coe FL, Lingeman JE, Shao Y, Sommer AJ, Bledsoe SB, Anderson JC and Worcester EM, Anat. Rec, 2007, 290, 1315–1323. [DOI] [PubMed] [Google Scholar]
- 6.Sokol E, Nigmatulina E, Maksimova N and Chiglintsev A, Eur. J. Mineral, 2005, 17, 285–295. [Google Scholar]
- 7.Khan SR, Pearle MS, Robertson WG, Gambaro G, Canales BK, Doizi S, Traxer O and Tiselius H-G, Nat. Publ. Gr, 2016, 1–23. [DOI] [PMC free article] [PubMed] [Google Scholar]
- 8.Khan SR, Rodriguez DE, Gower LB and Monga M, J. Urol, 2012, 187, 1094–1100. [DOI] [PMC free article] [PubMed] [Google Scholar]
- 9.Aggarwal A, Tessadri R and Grohe B, Int. J. Biochem. Biophys, 2015, 3, 34–48. [Google Scholar]
- 10.Wesson JA and Ward MD, Elements, 2007, 3, 415–421. [Google Scholar]
- 11.Grases F, Masárová L, Söhnel O and Costa-Bauzá A, BJUI Int., 1992, 70, 240–246. [DOI] [PubMed] [Google Scholar]
- 12.Asselman M, Verhulst A, De Broe ME and Verkoelen CF, J. Am. Soc. Nephrol, 2003, 14, 3155–3166. [DOI] [PubMed] [Google Scholar]
- 13.Dussol B, Geider S, Lilova A, Léonetti F, Dupuy P, Daudon M, Berland Y, Dagorn JC and Verdier JM, Urol. Res, 1995, 23, 45–51. [DOI] [PubMed] [Google Scholar]
- 14.Kurutza JW, Carvalhoa M and Nakagawa Y, J. Cryst. Growth, 2003, 255, 392–402. [Google Scholar]
- 15.Worcester EM, J. Am. Soc. Nephrol, 1994, 5, S46–S53. [DOI] [PubMed] [Google Scholar]
- 16.Lee T and Lin YC, Cryst. Growth Des, 2011, 11, 2973–2992. [DOI] [PMC free article] [PubMed] [Google Scholar]
- 17.Hug S, Grohe B, Jalkanen J, Chan B, Galarreta B, Vincent K, LagugnéLabarthet F, Lajoie G, Goldberg HA, Karttunen M and Hunter GK, Soft Matter, 2012, 8, 1226–1233. [Google Scholar]
- 18.Sheng X, Jung T, Wesson JA and Ward MD, Proc. Natl. Acad. Sci, 2005, 102, 267–272. [DOI] [PMC free article] [PubMed] [Google Scholar]
- 19.Qiu SR, Wierzbicki A, Orme CA, Cody AM, Hoyer JR, Nancollas GH, Zepeda S and De Yoreo JJ, Proc. Natl. Acad. Sci, 2004, 101, 1811–1815. [DOI] [PMC free article] [PubMed] [Google Scholar]
- 20.Weaver ML, Qiu SR, Hoyer JR, Casey WH, Nancollas GH and De Yoreo JJ, Calcif. Tissue Int [DOI] [PMC free article] [PubMed] [Google Scholar]
- 21.Langdona A and Grohe B, Colloids Surfaces B Biointerfaces. [DOI] [PubMed]
- 22.Gleberzon JS, Liao Y, Mittler S, Goldberg HA and Grohe B, Urolithiasis, 2018, 47, 425–440. [DOI] [PubMed] [Google Scholar]
- 23.Chien YC, Mansouri A, Jiang W, Khan SR, Gray JJ and McKee MD, J. Struct. Biol, 2018, 204, 131–144. [DOI] [PubMed] [Google Scholar]
- 24.Sheehan ME and Nancollas GH, in Urolithiasis, eds. Smith LH, Robertson WG and Finlayson B, Springer, Boston, MA, 1981, pp. 391–399. [Google Scholar]
- 25.White DJ and Nancollas GH, J. Cryst. Growth, 1982, 57, 267–272. [Google Scholar]
- 26.Wang L, Zhang W, Qiu SR, Zachowicz WJ, Guan X, Tang R, Hoyer JR, De Yoreo JJ and Nancollas GH, J. Cryst. Growth, 2006, 291, 160–165. [Google Scholar]
- 27.Wang L, Qiu SR, Zachowicz W, Guan X, DeYoreo JJ, Nancollas GH and Hoyer JR, Langmuir, 2006, 22, 7279–7285. [DOI] [PubMed] [Google Scholar]
- 28.De Yoreo JJ and Vekilov PG, Rev. Mineral. Geochemistry, 2003, 54, 57–93. [Google Scholar]
- 29.Brečević L, Škrtić D and Garside J, J. Cryst. Growth. [Google Scholar]
- 30.Hektisch HK, Dennis J and Hanoka JI, J. Phys. Chem. Solids, 1965, 26, 493–496. [Google Scholar]
- 31.Petrova EV, Gvozdev NV and Rashkovich LN, J. Optoelectron. Adv. Mater, 2004, 6, 261–268. [Google Scholar]
- 32.Henisch HK, Crystal Growth in Gels, Dover Publications, 1996. [Google Scholar]
- 33.Bisaillon S and Tawashi R, J. Pharm. Sci, 1975, 64, 458–460. [DOI] [PubMed] [Google Scholar]
- 34.Gong X, Wang Y-W, Ihli J, Kim Y-Y, Li S, Walshaw R, Chen L and Meldrum FC, Adv. Mater, 2015, 27, 7395–7400. [DOI] [PMC free article] [PubMed] [Google Scholar]
- 35.Canales BK, Anderson L, Higgins L, Ensrud-Bowlin K, Roberts KP, Wu B, Kim IW and Monga M, Urology, 2010, 76, 1017.e13–1017.e20. [DOI] [PubMed] [Google Scholar]
- 36.Lovett A, Khan S and Gower L, Urolithiasis, 2019, 47, 321–334. [DOI] [PMC free article] [PubMed] [Google Scholar]
- 37.Chidambaram A, Rodriguez D, Khan S and Gower L, Urolithiasis, 2015, 43, 77–92. [DOI] [PMC free article] [PubMed] [Google Scholar]
- 38.Evan AP, Coe FL, Rittling SR, Bledsoe SM, Shao Y, Lingeman JE and Worcester EM, Kidney Int., 2005, 68, 145–154. [DOI] [PubMed] [Google Scholar]
- 39.Kohri K, Yasui T, Okada A, Hirose M, Hamamoto S, Fujii Y, Niimi K and Taguchi K, Urol. Res, 2012, 40, 623–637. [DOI] [PubMed] [Google Scholar]
- 40.Hirose M, Tozawa K, Okada A, Hamamoto S, Higashibata Y, Gao B, Hayashi Y, Shimizu H, Kubota Y, Yasui T and Kohri K, Urol. Res, 2012, 40, 121–129. [DOI] [PubMed] [Google Scholar]
- 41.Rodriguez DE, Thula-Mata T, Toro EJ, Yeh Y-W, Holt C, Holliday LS and Gower LB, Acta Biomater., 2014, 10, 494–507. [DOI] [PMC free article] [PubMed] [Google Scholar]
- 42.Li MK, Blacklock NJ and Garside J, J. Urol, 1985, 133, 122–125. [PubMed] [Google Scholar]
- 43.Wierzbicki A, Sikes CS, Sallis JD, Madura JD, Stevens ED and Martin KL, Calcif. Tissue Int, 1995, 56, 297–304. [DOI] [PubMed] [Google Scholar]
- 44.Parvaneh LS, Donadio D and Sulpizi M, J. Phys. Chem. C, 2016, 120, 4410–4417. [Google Scholar]
- 45.Thomas A, Rosseeva E, Hochrein O, Carrillo-Cabrera W, Simon P, Duchstein P, Zahn D and Kniep R, Chem. A Eur. J, 2012, 18, 4000–4009. [DOI] [PubMed] [Google Scholar]
- 46.Ryall RL, Harnett RM and Marshall VR, Clin. Chim. Acta, 1981, 112, 349–356. [DOI] [PubMed] [Google Scholar]
- 47.Chien Y-C, Masica DL, Gray JJ, Nguyen S, Vali H and McKee MD, J. Biol. Chem, 2009, 284, 23491–23501. [DOI] [PMC free article] [PubMed] [Google Scholar]
- 48.Chikama S, Iida S, Inoue M, Kawagoe N, Tomiyasu K, Matsuoka K, Noda S and Takazono I, Kurume Med. J, 2002, 49, 201–210. [DOI] [PubMed] [Google Scholar]
- 49.Yamaguchi S, Yoshioka T, Utsunomiya M, Koide T, Osafune M, Okuyama A and Sonoda T, Urol. Res, 1993, 21, 187–192. [DOI] [PubMed] [Google Scholar]
Associated Data
This section collects any data citations, data availability statements, or supplementary materials included in this article.