

Abstract
In the present study, the interactions between actinomycin D (ActD) and single stranded DNA (ssDNA) 5′-CGTAACCAACTGCAACGT-3′ and a duplex stranded DNA (dsDNA) with this sequence were investigated by microchip-based non-gel sieving electrophoresis and electrospray ionization mass spectrometry (ESI-MS). The ssDNA was designed according to the conserved regions of open reading frame 1b (replicase 1B) following the Tor 2 SARS genome sequence of 15611-15593. The binding constants of the interactions between ActD and ssDNA/dsDNA were (8.3 ± 0.32) × 106 M−1 (ssDNA) and (2.8 ± 0.02) × 105 M−1 (dsDNA), respectively, calculated from microchip electrophoresis via Scatchard plot. The binding stoichiometries were 1:1 (single/1ActD molecule) and 1:2 (duplex/2ActD molecules) calculated from microchip electrophoresis, and the results were further verified by ESI-MS. The results obtained by these two methods indicated that ActD bound much more tightly to ssDNA used in this work than dsDNA. Furthermore, this is shown that the microchip-based non-gel sieving electrophoresis method is a rapid, highly sensitive and convenient method for the studies of interactions between DNA and small molecule drugs.
Abbreviations: ActD, actinomycin D; CD, circular dichroism; dsDNA, double-stranded DNA; ESI-MS, electrospray ionization mass spectrometry; HIV, human immunodeficiency virus; HPMC, hydroxyprolymethyl cellulose; NMR, nuclear magnetic resonance spectrometry; PMMA, poly(methyl methacrylate); ssDNA, single-stranded DNA
Keywords: Microchip non-gel sieving electrophoresis, Actinomycin D, DNA, Interaction, Electrospray ionization mass spectrometry
1. Introduction
A wide variety of physical and chemical techniques have been used to study ligand–DNA binding, from the simple measurement of UV absorption and melting temperature to highly informative methods including nuclear magnetic resonance spectrometry (NMR) [1], [2], [3], X-ray [4], [5], mass spectrometry (MS) [6], circular dichroism (CD) [7], gel footprinting [8], [9], fluorescence [3], equilibrium dialysis [10], and capillary electrophoresis (CE) [11], [12], [13]. However, NMR, X-ray, MS, CD and fluorescence not only require expensive equipments and elaborate procedures for sample purification prior to analysis, but also are tedious, time-consuming, and requiring a large sample size. Among the above-mentioned methods, CE is a powerful method with low sample consumption and short analysis time for studying the interactions of DNA-drugs [11]. Many biomolecule interacting systems such as protein–DNA, DNA–peptide, protein–protein, protein–drug, antibody–antigen, peptide–drug, peptide–carbohydrate, peptide–dye and carbohydrate–drug have been studied using CE techniques [14]. As a new method combining the CE technology and the microfluidic platform, microchip electrophoresis has the potential to study molecular interactions [15]. There are few reports on characterization or quantification determination of the binding constants by microchip-based electrophoresis [16], [17], and there is no report for the study of the interactions between DNA and small molecules by microchip electrophoresis.
Microchip electrophoresis has being studied as a highly promising method for rapid and sensitive analysis, and is widely applied to genetic analysis [18], [19], drug discovery [20], clinical diagnostic [21], [22], [23], proteomics [24], [25] and so on [26], [27], [28]. The manipulation and transportation of analytes in microchip devices is based on electrokinetic phenomena, e.g., electrophoretic and electroosmotic effects. Buffer and sample flow within the channel network can be precisely controlled through high voltages applied on the buffer/sample reservoirs. The technique allows the manipulation of picoliter volumes with high precision that ultimately leads to performance equivalent to or exceeding current techniques. In contrast to conventional CE, the higher surface-to-volume ratio in microchip devices results in better heat dissipation, therefore, allows separations at higher field strengths. In a word, compared with conventional bench-scale systems, the advantages of microchip electrophoresis are numerous, such as less reagent consumption, low manufacturing costs, increased performance, faster analysis, high sample throughput, integration and automation possibility, and disposability [29], [30].
ActD's biological activity has been attributed to binding ability with the double-stranded DNA (dsDNA) through the intercalation onto the planar phenoxazone ring into the double helix and then forming a stable complex with DNA and blocking the movement of RNA polymerase that interferes with DNA-dependent RNA synthesis [31], [32]. However, recent discovery showed that the sequence-specific ActD binding to single strand DNA (ssDNA) could inhibit human immunodeficiency virus (HIV) reverse transcriptase and other polymerase [33]. Drugs with high selection for single-stranded forms of the HIV genome should cause minimal damage to the host genome DNA. ActD could inhibit HIV reverse transcriptase and other polymerase. This result provides useful information for the treatment of new disease caused by some new viruses. The severe acute respiratory syndrome-associated coronavirus (SARS-CoV) is a new viral RNA coronavirus with single-stranded forms of SARS genome that causes an acute respiratory illness in this century [21]. It is worth studying whether or not ActD also play a role in inhibiting SARS-CoV.
To our knowledge, no article concerning the research of ActD–oligonucleotides interactions and even quantitative determination of the binding constants and stoichiometries was reported using microchip electrophoresis. In the present work, we explored the interactions between 18-mer ssDNA with a sequence of 5′-CGTAACCAACTGCAACGT-3′, or the 18-mer dsDNA and ActD by microchip electrophoresis. The peak height of DNA was monitored to get practical data. The binding constants and stoichiometries were obtained using Scatchard analysis. To validate the results provided by microchip electrophoresis, the stoichiometries of ActD and oligonucleotides were compared with ESI-MS data.
2. Materials and methods
2.1. Materials
ActD was purchased from AMRESCO Inc. (30175 Solon Industrial, Parkway, Solon, OH, USA). The single-stranded DNAs of 3′-GCATTGGTTGACGTTGCA-5′ and 5′-CGTAACCAACTGCAACGT-3′, whose sequence were designed according to the conserved regions of open reading frame 1b (replicase 1B) following the Tor 2 severe acute respiratory syndrome (SARS) genome sequence of 15611-15593 [23], were purchased from the TaKaRa Biotechnology Co., Ltd. (Dalian, China). A 100 mM Tris (tris(hydroxymethyl)methylamine, Sigma)/100 mM boric acid/2 mM EDTA buffer (TBE)/2.0% hydroxyprolymethyl cellulose (HPMC) (HPMC, 50 cps. Sigma Chemical Co., St. Louis, MO)/with a pH 8.5 was used as running buffer in the experiment. A 1 μmol/L SYTOX orange nucleic acid stain (Molecular Probes, Eugene, OR) solution was prepared in 2.0% HPMC TBE buffer in order to label DNA on-line. All buffer solutions were prepared in doubly distilled water.
2.2. Sample preparation
For microchip electrophoresis analysis, each of the ssDNAs was dissolved in 10 mM Tris/50 mM NaCl/1 mM EDTA buffer (pH 8.5) to prepare the 18-mer dsDNA by the annealing test. Equal aliquots of the equimolar ssDNAs (50 μL) were mixed, and then was annealed by heating to 96 °C for 6 min to obtain the dsDNA and cooled to room temperature slowly (about 2–3 h). The 20 μL of the solution containing the annealed dsDNA (0.1 μM) or the ssDNA was incubated with a 20 μL of ActD with different concentration (in water) in a 37 °C water bath for 2 h prior to analysis. For ESI-MS analysis, sample preparation was performed as follows: the 16.7 ng non-self-complementary 18 bases single strands were separately diluted into 100 μM stock solutions with 1 M ammonium acetate. After a 50 μL of each non-self-complementary stock solution was mixed, the solution of 100 μL was annealed by heating to 85 °C for 10 min and cooling to room temperature slowly (over 3 h). Then 20 μL of the solution containing the annealed duplex DNA was interacted with 30 μL of the different μM ActD (in water) to make the complex in a 37 °C water bath for 2 h. Each 50-μL solution containing the complex was diluted with spray solvent (50/50, v/v, MeOH/100 mM aqueous ammonium acetate) to 100 μL for mass spectrometry analysis.
2.3. Microchip electrophoresis analyzer
The homemade microchip analytical apparatus with a 532 nm wavelength laser used in this study was illustrated in our literatures [21], [34]. In brief, the output radiation (532 nm) from an air-cooled LD-pumped solid-state laser (20 mW) (Mektec Seiwa Corporation, Beijing, China) passes through a 532 nm filter (Omega Optical, Brattleboro, VT). The beam is reflected by a dichroic beamsplitter tube (Omega Optical) and focused into the channel through a 20× microscope objective (0.4 N.A). The emission signal is collected by the same objective and transmitted back through the dichroic beamsplitter. The emission beam passes through a 570 nm bandpass filter (Omega Optical), which may be alternated easily to fit a wide selection of dyes, and is focused by a focusing lens through a 400 μm pinhole. The photomultiplier tuber (R212, Japan) is mounted in an integrated detection module including high voltage power supply, voltage divider, and amplifier. The focus was finished by a charge coupled device (CCD) camera. The whole optical system was installed on the X–Y–Z translational stage (3D micro-manipulator, which adjusting precision is 1 μm) and the focus can be controlled via picture displayed on the screen.
2.4. Microchip
The homemade poly(methyl methacrylate) (PMMA) microchips used in this study were depicted in our former publications [35], [36]. In brief, there are three suits of capillary channels on one microchip chip. Each reservoir volume is 13 μL.
2.5. Microchip electrophoresis
Separations were carried out using a homemade microchip electrophoresis analyzer described above. A PMMA microchip was used with an effective length of 4 cm and a total length of 5.5 cm. Buffer and separation media were pipetted into reservoirs, and the microchannels were filled by applying vacuum on one of the reservoirs. Sample was pipetted into the sample reservoir, and, the platinum electrodes were dipped into all reservoirs. After the run was finished, the microchannels were rinsed with distilled water. The pretreatment of the channel walls did not need before separation. The conditions for each run were as follows: the injection voltage and time were 400 V/cm and 30 s, respectively. The separation voltage and time were 130 V/cm and 220 s, respectively.
2.6. Quantitative model of the binding assay
Regarding molecular interactions, the binding constant is an important parameter. Scatchard analysis is a common way to linearize the binding data, and the model can be expressed as equation:
where r is the ratio of concentrations of the bound ligand (or receptor) to total receptor (or ligand) and C f is the unbound ligand (or receptor) concentration. K is the apparent binding constant and n is the number of binding sites [37]. In the microchip electrophoresis section of this work, r is the ratio of concentration of the bound DNA to total ActD in the reacting solution.
2.7. ESI-MS with an ion-trap mass spectrometer
Mass spectrometric measurements were carried out with a Finnigan LCQ ion trap instrument (Thermo Finnigan, San Jose, CA) equipped with a standard heated capillary electrospray source. Since DNA is a kind of negatively charged polyelectrolyte at neutral pH, the electrospray source was operated in the negative mode, with a needle voltage of −4 kV. To obtain a good spray, it was necessary to add 25% methanol to the injected solution. Methanol was added just before injection, after the complexation equilibrium in NH4OAc was established. The solutions containing noncovalent complexes, single-stranded DNA or double-stranded DNA were infused at 3 μL/min directly into the mass spectrometer. The spray voltage was 4.0 kV. The capillary temperature was 175 °C. Sheath gas flow rate was 70 arb. Auxiliary gas flow rate was 5 arb. Tube lens offset voltage was 55 V. Lens voltage was 50 V. Multipole 1 offset voltage was 7 V. Multipole 2 offset voltage was 10.5 V. Entrance lens was 90 V. The N2 bath gas flow was increased by approximately 1.5 times volume more than that normally used for electrospray at 200 °C to ensure efficient desolvation. The analyzer was operated at a background pressure of 1.79 × 10⁻⁵ Torr, as measured by a remote ion gauge. In all experiments, helium was introduced to an estimated pressure of 1 mTorr for improving the trapping efficiency. Data were collected for approximately 10 scans and analyzed with both the instrument software and the ICIS software developed by the manufacturer.
3. Results and discussion
The experimental results showed that the relative standard deviations (R.S.D.) of the migration time and peak height for 18-mer ssDNA peak and dsDNA are 1.29% and 4.22%, 1.31% and 4.75%, respectively. They show that the run-to-run reproducibility is good.
In general, the LIF method may cause disturbances at the binding sites of the biomolecules because it is necessary to use a fluorigenic labeling or to need a derivatization reaction. If the interactions of ligand–DNA were completed before DNA was labeled by the fluorescence dye, disturbance at the binding sites of the biomolecules might be avoided. Therefore, separation and analysis with on-line labeling DNA on microchips were carried out after the interactions of ActD and 18-mer dsDNA happened. Meanwhile, many marcobiomolecules are prone to be adsorbed electrostatically on the surface of plastic channel and, in general, this phenomenon is unfavorable, or even fatal for the analysis of macrobiomolecules. In our experiments, the use of hydroxyprolymethyl cellulose as an additive that gave a dynamical coating in the running buffer could suppress the electroosmotic flow (EOF) as well as the adsorption of DNA to the PMMA channel wall, the channel was dynamically coated with hydroxyprolymethyl cellulose; on the other hand, hydroxyprolymethyl cellulose worked as a sieving matrix of DNA fragments separation.
3.1. The interaction between ActD and ssDNA or dsDNA
Standard samples containing 0.0127–1.27 μM of the 18-mer ssDNA or 0.005–0.3 μM of the 18-mer dsDNA were analyzed by microchip electrophoresis. The peak height of each sample was proportional to the concentration of ssDNA or dsDNA. The relationships between peak height and ssDNA or dsDNA concentration could be expressed as y = 252.59x − 1.73 (r = 0.998) and y = 1151.7x + 0.55 (r = 0.997), respectively. Then the corresponding concentrations of ssDNA in the binding assay were calculated from this calibration curve. Fig. 1 shows electrophoergraphs of interaction between 0.127 μM 18-mer ssDNA (5′–3′) and various concentrations of ActD. Fig. 2 shows electropherograms of 0.05 μM 18-mer dsDNA mixed with various concentrations of ActD. When a mixture of ssDNA or dsDNA and ActD was injected into the channel of microchip, SYTOX orange dye in the buffer intercalated the 18-mer ssDNA or dsDNA, and thus the ssDNA or dsDNA could be detected. Then the dye could not intercalate ActD, which could not be detected in the assay. With increasing the concentrations of ActD, the peak heights of ssDNA or dsDNA fall as shown in Fig. 1, Fig. 2. Since the fluorescent dye reacted with free DNA, the observed signals represent the fraction which did not bind to ActD. When the concentration of ActD was excessive, the peaks of ssDNA and dsDNA could be not detected. This is a basic for the quantitative determination. The ActD contributed positive charges to DNA, therefore, the complex became neutral or near-neutral. As a result, through an electro-migration injection mode, the complex might not be loaded into separation channel or, although there were a few complexes injected, separation time was too short to detect them in the separation conditions using the dynamoelectric injection mode.
Fig. 1.
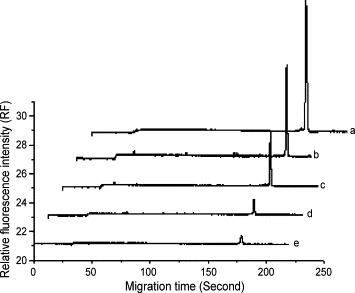
Electrophoergraphs of interaction between 0.127 μM 18-mer ssDNA (5′–3′) and various concentrations of ActD. (a) 0 μM ActD; (b) 0.1 μM ActD; (c) 0.3 μM ActD; (d) 0.8 μM ActD; (e) 1.25 μM ActD.
Fig. 2.
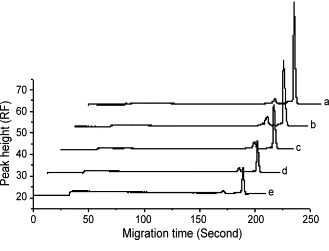
Electropherograms of 0.05 μM 18-mer dsDNA mixed with various concentrations of ActD. (a) 0 μM ActD; (b) 0.25 μM ActD; (c) 0.5 μM ActD; (d) 0.75 μM ActD; (e) 1.0 μM ActD.
To quantitatively characterize the interaction between ActD and the 18-mer ssDNA or dsDNA, the concentrations of free ssDNA and free dsDNA were calculated from the calibration curves, and thus the r-values were obtained. Two K were calculated to be (8.3 ± 0.32) × 106 M−1, (2.8 ± 0.02) × 105 M−1 from the slope, respectively. When the intercept was divided by the slope, a value of 1.22 ± 0.11 or 1.96 ± 0.1 for n was obtained. These results indicated the binding stoichiometries for ssDNA and dsDNA were 1:1 and 1:2, respectively. The results were in good agreement with the data obtained using the spectrophotometer by Wadkins and Jovin [38] and Sha [11]. Compared with the above two binding constants, the results indicated that ActD bound much more tightly to the single strand than DNA helix with a specific sequence in SARS genome sequence.
3.2. Electrospray of single and duplex oligodeoxynucleotides
To easily understand the ESI spectra of oligonucleotides and their complex (oligonucleotide–ActD), ssDNA and dsDNA were analyzed by ESI-MS. The oligonucleotides concentration was optimized as 10 μM. Fig. 3 shows the ESI/spectra of 10 μM solutions of 18-mer single-stranded oligonucleotides (A and B) and annealed 18-mer dsDNA (C). Fig. 3, Fig. 4 shows that the single-stranded DNA with four negatively charged is dominating, and then the duplex DNA with six negatively charged is in the majority, a small quantity of single-stranded DNAs with four negatively charged, which are 3′-GCATTGGTTGACGTTGCA-5′ and 5′-CGTAACCAACTGCAACGT-3′, appeared in Fig. 3C. These results are in favor of estimating the noncovalent complex of ActD and 18-mer dsDNA.
Fig. 3.
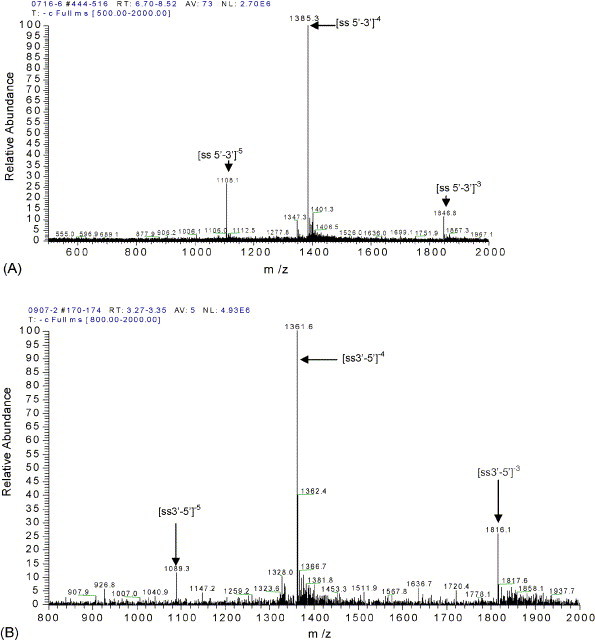
ESI/MS spectra of single and duplex oligodeoxynucleotides: (A) 5′-CGTAACCAACTGCAACGT-3′; (B) 3′-GCATTGGTTGACGTTGCA-5′; (C) d(CGTAACCAACTGCAACGT)2. The designation ss and ds are single-stranded and double-stranded.
Fig. 4.
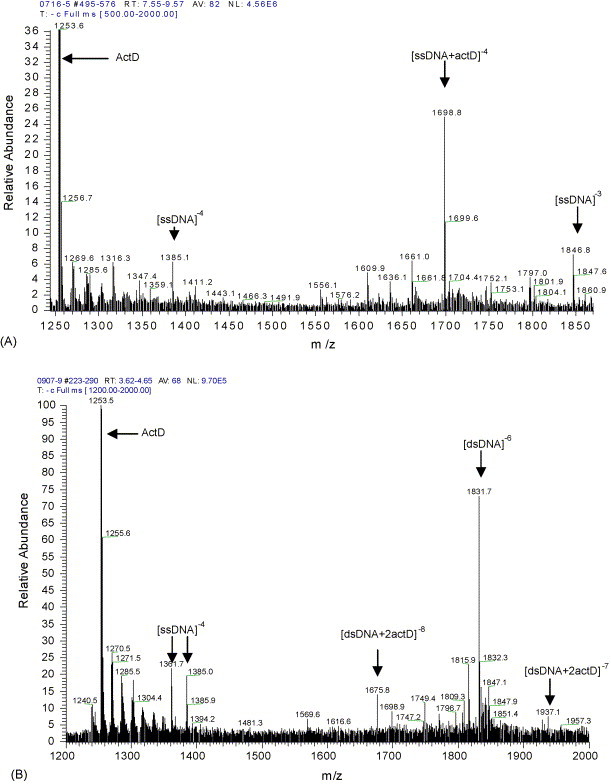
Product-ion mass spectra (MS/MS) of 5′-CGTAACCAACTGCAACGT-3′ (A) and d(CGTAACCAACTGCAACGT)2 (B) with ActD.
To detect the noncovalent duplex in the gas phase using ESI-MS, we referenced the reported method [40]. In brief, the non-self-complementary strands in 1 M ammonium acetate were annealed and the annealed sample in 100 mM ammonium acetate was sprayed. The molar numbers of the ssDNAs added were equal, and the duplex DNA was inspected by microchip electrophoresis. Distinctly, the annealing process insures duplex formation for non-self-complementary oligodeoxynucleotides. ESI/MS spectra of two complementary ssDNA and dsDNA in Fig. 3 show that the single or duplex stranded oligonucleotides do not form any nonspecific aggregation of duplex. These results favor the subsequently observation of dsDNA and its noncovalent complexes between drug and duplex oligonucleotides. ESI-MS can reveal binding stoichiometry for relatively small amounts of material and study the noncovalent complexes of small organic molecules to single-[6] and double-stranded [39], [40], [41] oligonucleotides.
3.3. Observation of noncovalent complexes between ActD and 18-mer ssDNA or 18-mer dsDNA
The solution was injected to ESI-MS and the binding stoichiometry was measured by mixing ssDNA or dsDNA with ActD in a 1:1 molar ratio. Fig. 4A shows a 1:1 ssDNA/ActD complex is mostly product. Therefore, ActD has 1:1 binding stoichiometry. Because the ion-trap instrument here we used has an upper mass limit of m/z 2000, we could not get the whole charge distribution for each species. So, the ration of the abundance of the even-charge complex to that of the even-charge free single or duplex was used to evaluate the binding affinity. The result in Fig. 4A shows that the ration of the even-charge ssDNA–ActD complex/the even-charge free ssDNA is approximately 3, which indicates that there is stronger binding affinity between ActD and 18-mer single-stranded DNA (5′–3′). Then, the results in Fig. 4B show that the ration of the even-charge dsDNA–ActD complex/the even-charge free dsDNA is only nearly one fourth, which is significantly less than the former, and there are formation of 1:2 oligonucleotide duplex/ActD complexes and 1:1 oligonucleotide single/ActD complexes. The above demonstrated results showed that ActD bound much more tightly to the single strand used here than double-stranded DNA, and ActD has 1:2 binding stoichiometry (18-mer dsDNA/ActD). This result is in good agreement with that obtained by microchip electrophoresis.
4. Conclusion
The microchip electrophoresis has been proved to be a successful method for studying ligand–DNA interactions. The results from both microchip electrophoresis and ESI-MS showed that ActD bound much more tightly to the ssDNA related SARS-CoV than its complementary dsDNA.
Acknowledgements
This project is supported by the NSFC of China (grant Nos. 20275039, 20035010 and 20299030) and the Guangzhou's board of health of China (grant Nos. 2005-YB-031, 2006-YB-030). The authors gratefully acknowledge these financial supports.
Contributor Information
Xiaomian Zhou, Email: zhouximi@yahoo.com.
Bingcheng Lin, Email: bclin@dicp.ac.cn.
References
- 1.Liu X., Chen H., Patel D.J. J. Biomol. NMR. 1991;1:323–347. doi: 10.1007/BF02192858. [DOI] [PubMed] [Google Scholar]
- 2.Wadkins R.M., Jares-Erijman E.A., Klement R., Rudiger A., Jovin T.M. J. Mol. Biol. 1996;262:53–68. doi: 10.1006/jmbi.1996.0498. [DOI] [PubMed] [Google Scholar]
- 3.Chin K.H., Chen F.M., Chou S.H. Nucleic Acids Res. 2003;31:2622–2629. doi: 10.1093/nar/gkg353. [DOI] [PMC free article] [PubMed] [Google Scholar]
- 4.Chen H., Liu X., Patel D.J. J. Mol. Biol. 1996;258:457–479. doi: 10.1006/jmbi.1996.0262. [DOI] [PubMed] [Google Scholar]
- 5.Kamitori S., Takusagawa F. J. Am. Chem. Soc. 1994;116:4154–4165. [Google Scholar]
- 6.Hsieh Y.L., Li Y.T., Henion J.D. Biol. Mass Spectrom. 1994;116:272–276. doi: 10.1002/bms.1200230506. [DOI] [PubMed] [Google Scholar]
- 7.Hommer R.B. Arch. Biochem. Biophys. 1969;129:405–407. doi: 10.1016/0003-9861(69)90193-3. [DOI] [PubMed] [Google Scholar]
- 8.Goodisman J., Rehfuss R., Ward B., Dabrowiak J.C. Biochemistry. 1992;31:1046–1058. doi: 10.1021/bi00119a013. [DOI] [PubMed] [Google Scholar]
- 9.Scramrov A.V., Beabealashivilli R.S. FEBS Lett. 1983;164:97–101. doi: 10.1016/0014-5793(83)80027-1. [DOI] [PubMed] [Google Scholar]
- 10.Kollmann G., Martin D., Shapiro B. Int. J. Radiat. Biol. 1969;16:121–128. doi: 10.1080/09553006914551141. [DOI] [PubMed] [Google Scholar]
- 11.Sha F., Chen F.M. Biophys. J. 2000;79:2095–2104. doi: 10.1016/S0006-3495(00)76457-5. [DOI] [PMC free article] [PubMed] [Google Scholar]
- 12.He X.Y., Li D.Z., Liang A.Y., Lin B.C. J. Chromatogr. A. 2002;982:285–291. doi: 10.1016/s0021-9673(02)01592-3. [DOI] [PubMed] [Google Scholar]
- 13.He X.Y., Li D.Z., Liang A.Y., Lin B.C. Chin. Chem. Lett. 2003;14:304–307. [Google Scholar]
- 14.Gomez F.A., Mirkovich J.N., Dominguez V.M., Liu K.W., Macias D.M. J. Chromatogr. A. 1996;727:291–299. [Google Scholar]
- 15.Stettler A.R., Schwarz M.A. J. Chromatogr. A. 2005;1063:217–225. doi: 10.1016/j.chroma.2004.11.079. [DOI] [PubMed] [Google Scholar]
- 16.Chiem N.H., Harrison D.J. Electrophoresis. 1998;19:3040–3044. doi: 10.1002/elps.1150191641. [DOI] [PubMed] [Google Scholar]
- 17.Liu X.J., Liu X., Liang A.Y., Shen Z., Zhang Y., Dai Z.P., Xiong B.H., Lin B.C. Electrophoresis. 2006;27:3125–3218. doi: 10.1002/elps.200500890. [DOI] [PubMed] [Google Scholar]
- 18.Zhou X.M., Shao S.J., Xu G.D., Liu W., Zhong R.T., Liu D.Y., Tang J.W., Gao Y.N., Sun L., Cheng S.J., Lin B.C. J. Chromatogr. B. 2005;816:145–151. doi: 10.1016/j.jchromb.2004.11.045. [DOI] [PubMed] [Google Scholar]
- 19.Liu D.Y., Zhou X.M., Zhong R.T., Ye N.N., Chang G.H., Xiong W., Mei X.D., Lin B.C. Talanta. 2006;68:616–622. doi: 10.1016/j.talanta.2005.04.064. [DOI] [PMC free article] [PubMed] [Google Scholar]
- 20.Houston J., Banks M. Curr. Opin. Biotechnol. 1998;9:643–649. [Google Scholar]
- 21.Zhou X.M., Liu D.Y., Zhong R.T., Dai D.P., Wu D.P., Wang H., Du Y.G., Xia Z.N., Zhang L.P., Mei X.D., Lin B.C. Electrophoresis. 2004;25:3032–3039. doi: 10.1002/elps.200305966. [DOI] [PMC free article] [PubMed] [Google Scholar]
- 22.Verpoorte E. Electrophoresis. 2002;23:677–712. doi: 10.1002/1522-2683(200203)23:5<677::AID-ELPS677>3.0.CO;2-8. [DOI] [PubMed] [Google Scholar]
- 23.Nakajima H., Yagi M., Kudo Y., Nakagama T., Shimosaka T., Uchiyama K. Talanta. 2006;70:122–127. doi: 10.1016/j.talanta.2005.12.059. [DOI] [PubMed] [Google Scholar]
- 24.Lueking A., Horn M., Eickhoff H., Bussow K., Lehrach H., Walter G. Anal. Biochem. 1999;270:103–111. doi: 10.1006/abio.1999.4063. [DOI] [PubMed] [Google Scholar]
- 25.Sanders G., Manz A. Trends Anal. Chem. 2000;19:364–378. [Google Scholar]
- 26.Chen G., Lin Y.H., Wang J. Talanta. 2006;68:497–503. doi: 10.1016/j.talanta.2005.07.004. [DOI] [PubMed] [Google Scholar]
- 27.Martin P. Talanta. 2005;66:1048–1062. [Google Scholar]
- 28.Chang W., Ono Y., Kumemura M., Korenaga T. Talanta. 2005;67:646–650. doi: 10.1016/j.talanta.2005.03.017. [DOI] [PubMed] [Google Scholar]
- 29.Effenhauser C.S., Bruin G.J., Paulus A. Electrophoresis. 1997;18:2203–22013. doi: 10.1002/elps.1150181211. [DOI] [PubMed] [Google Scholar]
- 30.DeWitt S. Curr. Opin. Chem. Biol. 1999;3:350–356. doi: 10.1016/S1367-5931(99)80052-0. [DOI] [PubMed] [Google Scholar]
- 31.Waring M.J. Annu. Rev. Biochem. 1981;50:159–192. doi: 10.1146/annurev.bi.50.070181.001111. [DOI] [PubMed] [Google Scholar]
- 32.Chen F.M. Biochemistry. 1992;31:6223–6228. doi: 10.1021/bi00142a008. [DOI] [PubMed] [Google Scholar]
- 33.Jeeninga R.E., Huthoff H.T., Gultyaey A.P., Berkhout B. Nucleic Acids Res. 1998;26:5472–5479. doi: 10.1093/nar/26.23.5472. [DOI] [PMC free article] [PubMed] [Google Scholar]
- 34.Zhou X.M., Dai Z.P., Lin B.C. Chem. J. Chin. Univ. 2004;3:336–340. [Google Scholar]
- 35.Zhou X.M., Dai Z.P., Liu X., Luo Y., Wang H., Lin B.C. JSS. 2005;26:219–224. [Google Scholar]
- 36.Zhou X.M., Dai Z.P., Liu X., Luo Y., Wang H., Mao X.L., Wu D.P., Lin B.C. Chem. J. Chin. Univ. 2005;26:52–54. [Google Scholar]
- 37.Scatchard G. NY Ann. Acad. Sci. 1949;51:660–672. [Google Scholar]
- 38.Wadkins R.M., Jovin T.M. Biochemsitry. 1991;30:9469–9478. doi: 10.1021/bi00103a012. [DOI] [PubMed] [Google Scholar]
- 39.Gao Q., Cheng X., Smith R.D., Yang C.F., Goldberg I.H. J. Mass Spectrom. 1996;31:31–36. doi: 10.1002/(SICI)1096-9888(199601)31:1<31::AID-JMS244>3.0.CO;2-I. [DOI] [PubMed] [Google Scholar]
- 40.Triolo A., Arcamone F.M., Raffaelli A., Alvadori P.J. Mass Spectrom. 1997;32:1186–1194. doi: 10.1002/(SICI)1096-9888(199711)32:11<1186::AID-JMS575>3.0.CO;2-G. [DOI] [PubMed] [Google Scholar]
- 41.Wan K.X., Shibue T., Gross M.L. J. Am. Chem. Soc. 2000;122:300–307. [Google Scholar]