

Abstract
Feline coronaviruses (FCoV) colonize the intestinal tract, however, due to not fully understood mutations, they can spread systemically and cause feline infectious peritonitis (FIP). Recent studies on human medicine report that gut microbiota is involved in the development of systemic disorders and could influence the immune response to viral diseases. The aim of this study was to provide preliminary data on the fecal microbiota composition in healthy cats compared to FCoV-infected cats, with and without FIP. Cats were equally grouped as healthy FCoV-negative, healthy FCoV-positive or FIP affected (total n = 15). Fecal sample were evaluated for the microbiota composition. A total of 3,231,916 sequences were analyzed. The samples' alpha-diversity curves did not reach a proper plateau and, for the beta-diversity, the samples seemed not to group perfectly by category, even if the healthy FCoV-positive group showed a hybrid microbial composition between FCoV-negative and FIP groups. Although there were no taxa significantly linked to the different conditions, some peculiar patterns were recognized: Firmicutes was always the most represented phylum, followed by Bacteroidetes and Actinobacteria. In FCoV-positive cats, the Firmicutes and Bacteroidetes were respectively over- and under-represented, compared to the other groups. Among FIP cats, three subjects shared a similar microbiome, one cat showed a different microbial profile and the other one had the lowest number of diverse phyla. Despite the limited number of animals, some differences in the fecal microbiome between the groups were observed, suggesting to further investigate the possible correlation between gut microbiota and FCoV infection in cats.
Keywords: Feline infectious peritonitis, Gut microbiota, Feline coronavirus
Highlights
-
•
Mutated form of enteric feline coronaviruses (FCoV) may spread systemically inducing feline infectious peritonitis (FIP).
-
•
Gut microbiota is known to be influenced by viral diseases in people and in some animal species.
-
•
Fecal microbiota was evaluated in 15 cats divided in three groups as healthy, positive to FCoV and affected by FIP.
-
•
Some microbiota peculiarities have been observed associated with the presence of coronavirus and/or disease.
-
•
Feline gut microbiota composition may be associated with FCoV infection and thus need to be further investigated.
1. Introduction
One topic of great interest in the last few years has been the evaluation of intestinal microbiota, which is the consortium of all living microorganisms that inhabit the gastrointestinal (GI) tract. This new insight into the complexity of the intestinal microbiota, by the use of next generation sequencing techniques, and its intimate relationship with the host has spurred researchers to better understand the importance of a balanced microbial ecosystem for the regulation of host health and immunity (Suchodolski, 2016). In the last few years molecular methods, mostly targeting the small subunit ribosomal RNA gene (16S rRNA), have been used for identification of bacterial microbiota. This gene is ubiquitously present in all bacteria and archaea and contains both conserved and variable sequence regions, enabling researchers to distinguish organisms at different phylogenetic levels. Such approach has demonstrated that the gastrointestinal tract of both human and animals harbors a highly complex microbial ecosystem, consisting of several hundreds of different bacterial phylotypes (Handl et al., 2011). The importance of microbiota for the host is highlighted by murine studies that clearly indicate a reciprocal regulation between microbiota and T cell development (Williams et al., 2006; Round and Mazmanian, 2009; Lopes et al., 2016). In human medicine, variations of the gut microbiota have been correlated not only with gastrointestinal diseases (Frank et al., 2007), but also with obesity (Ley et al., 2005), allergies, autoimmune (Vieira et al., 2014; Block et al., 2016) and infectious diseases (Goedert, 2016; Tincati et al., 2016).
Feline Infectious Peritonitis (FIP) is a systemic fatal disease affecting mostly young cats (Pedersen, 2014a) sustained by the feline coronavirus (FCoV), which commonly occurs in multicat environments. The FCoVs usually inhabit the intestinal tract (feline enteric coronavirus, FECV). During viral replication within the enterocyte, a mutated variant, also called FIP virus (FIPV) may be generated (Pedersen, 2014a). Whichever is the exact mutation, FIPV loses tropism for enterocytes and gains the capability to replicate inside macrophages (Kipar et al., 2010). Moreover, FCoV induces macrophage-monocyte proliferation in haemo-lymphatic tissues and thus allow a progressive viral adaptation to the replication within these cells (Kipar and Meli, 2014). Although both viral biotypes (FECV and FIPV) can spread systemically, only the FIPV may induce FIP, due to the higher rate of interactions between the virus and monocytes. Moreover, the host immune response has a pivotal role in the development of the disease. Indeed, the cell-mediated immunity seems to be protective. On the other hand, it is known that the humoral response induces development of antibodies that enhance the in vitro virus uptake in macrophages and this, in turn, contributes in vivo to the development of the clinical signs seen during the effusive (wet) form of the disease. The non-effusive (dry) form is considered as an intermediate status involving a partially effective cellular response (Pedersen, 2014a).
The in vivo diagnosis of FIP may be challenging, especially in dry forms, but several tests may help supporting a clinical diagnosis of wet FIP. Nowadays, the definitive diagnosis is usually achieved post-mortem, by demonstrating the presence of intralesional FCoV through immunohistochemistry (Pedersen, 2014b; Tasker, 2018). In vivo, the suspicion of FIP is based on signalment and clinical history, as well as on laboratory data (Pedersen, 2014b; Stranieri et al., 2017a; Tasker, 2018). During wet forms of the disease, the effusion analysis is usually diagnostic (Giordano et al., 2015; Stranieri et al., 2017b; Tasker, 2018).
The feline gut microbiota shares many similarities with its human counterpart and, as previously described for people and animals, the development of infectious diseases, especially when associated with a strong immune system involvement, may be enhanced by an unbalanced composition of the gut microbiota (Suchodolski et al., 2015; Tizard and Jones, 2018). Thus, the aim of this study was to compare the fecal microbiota composition, evaluated through next generation sequencing (NGS), of FCoV negative clinically healthy cats with that of FCoV positive clinically healthy cats and of cats with FIP, in order to highlight possible differences.
2. Materials and methods
2.1. Animals/Caseload
Twenty-one cats, submitted for clinical examinations to both the Veterinary Teaching Hospital of our University and to private practitioners, were recruited.
The inclusion criteria, applied after the screening analyses, in order to reduce possible confounding factors, were: (1) Private owned cats living indoor. (2) No administration of antibiotics in the previous sixty days. (3) Negative testing for feline immunodeficiency virus (FIV) antibodies and feline leukemia virus (FeLV) antigen. (4) Age ≤ 2.5 years. (5) Availability of fresh feces (6) Absence of clinical signs (for inclusion in the groups of clinically healthy FCoV positive or negative cats). (7) Presence of clinical signs and clinicopathological abnormalities consistent with FIP (Stranieri et al., 2018), followed by a post-mortem confirmation of diagnosis (for the inclusion in FIP group). (8) All the cats were fed only with similar diets based on dry and canned commercial food.
2.2. Sample collection
At admission, 2 mL of whole blood was collected from each cat by venipuncture of the jugular vein: 1 mL was transferred into an EDTA tube and 1 mL into a plain tube (Venoject, Terumo Italia). When effusion was present, it was sampled by ultrasound-guided drainage and stored in EDTA tubes. According to the standard operating procedures of our laboratory whole blood and effusion were analyzed within 12–18 h from the sampling. From each animal, a fresh fecal sample (at least 15 g) was collected and immediately stored, frozen at −20 °C.
The FIP cats, due to the severe course of the disease, were humanly euthanized, after owner's consent. A complete necropsy, followed by routine histology and immunohistochemistry and RT-PCR for Feline coronavirus, was performed. Immunohistochemistry and RT-PCR were performed on tissue biopsies from liver, spleen, mesenteric lymph node, intestine, kidney and lung and, in cats with neurological signs also on brain and cerebellum, in order to confirm the clinical suspicion of FIP. In one case, since the owner declined necropsy, the diagnosis of FIP was confirmed by immunocytochemistry on the effusion sample.
All the above procedures, were performed within routine diagnostic workouts and therefore, according to the decisions of the Ethical Committee of the university of Milan, residual aliquots of samples or tissues collected under informed consent of the owners can be used for research purposes without any additional formal request of authorization to the Ethical Committee. (EC decision 29 Oct 2012, renewed with the protocol n° 02–2016).
2.3. Screening analyses
The purpose of clinicopathological tests was to confirm the absence of subclinical changes in healthy cats and to evaluate the clinical status of those affected by FIP. A complete blood cell count was performed on whole blood in EDTA using the Sysmex XT-2000iV hematology laser analyzer (Sysmex Corporation), along with a blood smear evaluation. Serum samples were obtained by centrifugation (3750 g × 5 min) of blood collected in plain tubes and used to run a biochemical routine panel (including total proteins, albumin, bilirubin, creatinine, alanine aminotransferase, aspartate aminotransferase, alkaline phosphatase, urea) with an automated spectrophotometer (RX Daytona, Randox Laboratories), using reagents provided by the manufacturer. Tests for the detection of FIV antibodies and FeLV antigens were performed on serum with a lateral flow ELISA kit (SNAP FIV/FeLV Combo Test, IDEXX Veterinary Diagnostic).
Additional laboratory tests were performed for cats suspects of FIP to further support the clinical diagnosis of the disease (Pedersen, 2014b; Tasker, 2018). Specifically, serum protein electrophoresis was performed on agarose gel using the automated analyzer Hydrasis (Sebia Italia) and the specific manufacturer's reagents (Hydragel 7/15 β1–β2, Sebia Italia), as previously reported (Stranieri et al., 2017a). Based on the total protein concentration, measured with the biuret method, and on the percentages of the electrophoretic fractions, the concentration (g/L) of each electrophoretic fraction was calculated. Moreover, feline α-1-acid-glycoprotein (AGP) was measured in serum using a radial immunodiffusion (SRID) kit (Tridelta Development Ltd), following the manufacturer's instructions (Duthie et al., 1997; Paltrinieri et al., 2007; Hazuchova et al., 2017). When present, effusion was analyzed by measuring total protein concentration with a refractometer, and cell counts using the Sysmex XT-2000iV hematology laser analyzer mentioned above. A cytologic evaluation was also performed. Particular attention was given to ΔTNCC (the ratio between DIFF and BASO counts of the Sysmex XT-2000iV) due to its high diagnostic accuracy for FIP-related effusion (Giordano et al., 2015; Stranieri et al., 2017b). In two cases, due to the severe health conditions, it was not possible to perform an adequate blood sample for the screening analyses. However, a complete necropsy followed by tissue biopsies was performed in order to confirm the suspicion for FIP.
For molecular testing, 10 mg of each frozen fecal specimen was diluted in 400 μL of PBS. The mixture was vortexed, incubated at 40 °C for 5 min and then centrifuged (5500 g × 4 min). The supernatant was transferred into a new sterile Eppendorf tube, incubated at 95 °C for 5 min and then centrifuged (11,000 g × 1 min). RNA was extracted from the supernatant using a kit for viral RNA extraction (NucleoSpin® RNA Virus, Macherey-Nagel), following manifacturer's instructions. Amplification of a 177 bp fragment of the conserved 3′ untranslated region (3’ UTR) using a nested RT-PCR was performed as previously described (Herrewegh et al., 1995). FCoV RNA was used as positive control and RNase-free water as negative control. RT-PCR amplicons were visualized under an ultraviolet transilluminator following electrophoresis through a 2% agarose, ethidium bromide stained gel. Based on the presence or absence of amplicons, samples were considered as positive or negative for FCoV, respectively.
For immunohistochemistry, the biopsy samples were fixed in 10% isosmotic formalin. The samples were processed as already described in other studies (Zini et al., 2018). The primary antibody, manually added by an operator, was a mice monoclonal antibody against FCoV (clone FIPV3–70 Serotec). The immunocytochemistry was performed only on one sample (cat 5F) using a similar procedure, except for the antigen unmasking step.
2.4. Microbiota analyses
Microbiota analyses were outsourced to an external laboratory. Investigation of microbial communities (Metabarcoding analysis) in each frozen fecal sample was performed by amplicon sequencing of a hypervariable genomic region (V3-V4 region 16SrRNA gene amplification) using an NGS approach on Illumina Platform. Total DNA was extracted from each fecal sample using a commercial kit (QIAamp DNA Stool Mini Kit, QIAGEN S.r.l.). The quality of the genomic DNA was verified using a 2200 TapeStation DNA Screen Tape device (Agilent) and an ND-1000 spectrophotometer (NanoDrop) and its concentration ascertained using a Qubit assay (Life Technologies). The DNA was normalized to 5 ng/μL and then 2.5 μL was used for PCR amplification. Indexed NGS libraries were evaluated with the D1000 screen Tape (Agilent Tape Station 2200) and then quantified with ABI9700 qPCR instrument using the KAPA Library Quantification Kit in triplicates, according to the manufacture's protocol (Kapa Biosystems). Five μL of the pooled library at a final concentration of 4 nM were used for sequencing using Illumina Miseq with a 250 Paired end-read sequencing module.
2.5. Statistical methods
Pre-processing steps were performed and the raw reads quality of the extracted sequences was checked (using FastQC v0.11.2). Reads were trimmed with Phred scale quality threshold of 19 (representing the probability of an incorrect base call) allowing the reads to be truncated after base quality dropped below 18 (Phred scale). Reads IDs were edited (multiple_split_libraries_fastq.py, Qiime script) in order to be compatible for the following QIIME pipeline scripts. The 97% clustered Qiime formatted Greengenes v.13.8 reference database was used. Before the statistical analysis, alpha rarefaction and beta diversity were evaluated. Alpha rarefaction was an evaluation of within-sample diversity by species richness. A graphical alpha-rarefaction plot was created using Qiime pipeline. Beta diversity is an estimation of between-sample diversity by microbial profile. A graphical representation was calculated using Bray Curtis Qiime beta-diversity pipeline.
Finally, statistical analyses were performed with “R” statistical software (software R v3.2; packages edgeR v3.10.5, Robinson M.D., 2010 and Phyloseq v1.14.0, McMurdie and Holmes, 2013). Samples were assigned to groups relying on samples' metadata and the Taxonomy table (genus level) was normalized. For each group of samples, a statistical analysis was performed using the edgeR ExactTest function, to generate a list of statistically relevant taxonomies that are differentially present among the conditions. Exact test specifications for differential expression between two groups of taxonomy tables was performed. It implements the exact test proposed by Robinson and Smyth (2008) for a difference in mean between two groups of random variables following a negative binomial distribution.
Finally, comparison of different phyla, classes and orders relative abundance among groups was performed using Analyse-it for Microsoft Excel. Specifically, a Kruskall-Wallis test was performed, followed, when statistically relevant results were found, by a Wilcoxon Mann-Whitney test, for the comparison between two groups. Statistical significance was set at P < .05.
3. Results
3.1. Screening analyses
Based on the results of the screening analyses including FCoV PCR on feces and IHC on tissues, after the application of inclusion criteria, 15 cats were selected and classified as follows: five healthy negative for FCoV PCR on feces (H group), five healthy positive for FCoV PCR on feces (COR group) and five positive for FCoV PCR on feces and affected by FIP (FIP group) confirmed by IHC. Of the 15 animals enrolled, eight were female and seven were male. Breeds were quite variable, even though the domestic shorthair was the most represented (six cats), followed by two ragdolls, an exotic, a holy birman, a norwegian forest, a bobtail, a maine coon, a scottish fold and a sphynx. Hematology, biochemistry and the clinical examination, were unremarkable for all the clinically healthy cats, regardless the FCoV positivity, whereas cats of the FIP group showed changes consistent with the disease (Table 1 ).
Table 1.
Clinicopathological abnormalities of cats belonging to the FIP group.
| ID | Hematology | Biochemistry | SPE | AGP | ΔTNCC | IHC |
|---|---|---|---|---|---|---|
| 1F | na | na | na | Na | na | + |
| 2F | na | na | na | na | na | + |
| 3F | Microcytic hypochromic anemia | ↑total protein, ↑bilirubin |
↓Albumin, ↑α2, β1, β2, γ globlulin | 4.86 | 21.0 | + |
| 4F | Mild leukopenia | Mild azotemia, ↑ALT |
↑ γ globulin | 0.54 | na | + |
| 5F | nr | Mild azotemia, ↑total protein, ↑ALT ↑bilirubin |
↓Albumin, ↑β2, γ globlulin | 2.0 | 7.70 | +(ICC) |
Cats 1F and 2F were humanly euthanized in an external clinic due to the severe clinical conditions and subsequently referred to the University for necropsy. For this reason, no information regarding routine hematology and biochemistry were available for these animals. ID = identification number; SPE = serum protein electrophoresis; AGP = alpha-1-acid glycoprotein; ΔTNCC = delta total nucleated cell count; IHC = FIPV immunohistochemistry; nr = not relevant; na = not available; ALT = alanine aminotranferase; ICC = FIPV immunocytochemistry.
3.2. Microbiota analysis
A total of 3,231,916 sequences, with an average of 215,461 sequences/sample (median 219,276, range 195,516.5–235,660.5) were of adequate quality and were subsequently analyzed. The alpha-diversity rarefaction curves did not reach a proper plateau for almost all the samples (Fig. 1 ). This means that the sequencing depth was enough to identify only the most abundant bacteria for each sample, excluding the rarest ones. The evaluation of beta-diversity showed that the samples were not grouped perfectly by category. However, the COR group seemed to have a hybrid microbial composition, between the microbial composition of H and FIP groups (Fig. 2 ). According to the statistical analysis there were no taxa significantly linked to the different conditions (zero differential taxa found for FIP vs H, FIP vs COR, COR vs H). However, it was possible in some cases, to identify specific pattern between groups or for single animals as detailed below.
Fig. 1.
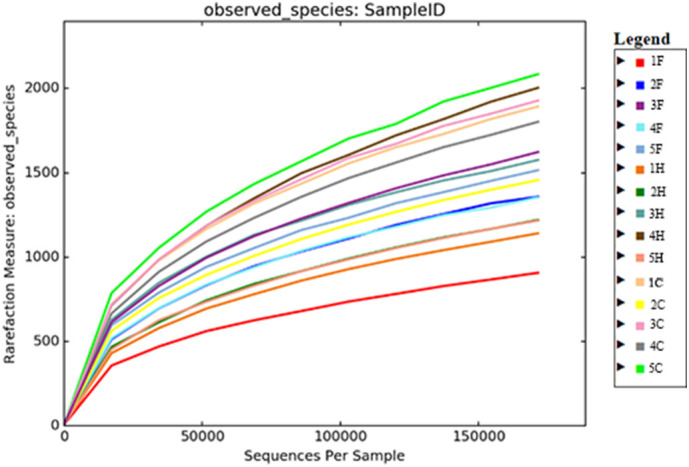
Alpha rarefaction for the entire caseload. Each sample is represented in a different colour. F FIP affected cats; H = healthy FCoV negative cats; C = healthy FCoV positive cats.
Fig. 2.
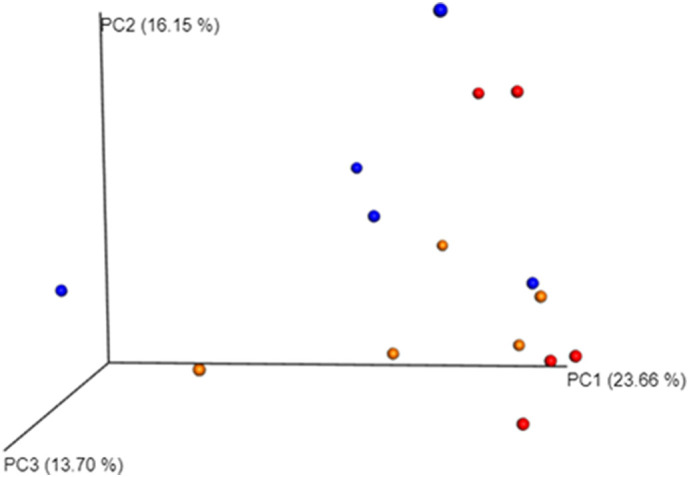
Beta diversity. Principal coordinates analysis of weighted distances. Proportions of variance explained by each principal coordinate axis is denoted in the corresponding axis label. In red cats belonging to healthy coronavirus positive group (C), in blue cats affected by FIP (F) and in orange healthy cats, negative for coronavirus (H). Each dot represents a gut microbial community from a single cat. Dots that are close to each other represent microbial communities similar in sequence composition. PC1 axis represents the highest variance; PC2 the second highest variance; PC3 represents the third highest variance; (For interpretation of the references to colour in this figure legend, the reader is referred to the web version of this article.)
Eleven different phyla were identified, with the majority represented by six of them (Fig. 3 ). Firmicutes was the main represented phylum, followed by Bacteroidetes, Actinobacteria and Proteobacteria. Nevertheless, COR group showed a major abundance of Firmicutes and minor of Bacteroidetes, compared to the other groups. This was also confirmed by the Bacteroidetes:Firmicutes ratio (0.9 in H group, 0.5 in FIP group and 0.1 in COR group; P = .13. Although the phylum relative abundance was not significantly different among the three groups, Bacteroides and Firmicutes were close to the significance level (P = .13 and 0.08 respectively).
Fig. 3.

Relative abundance of the predominant phyla in the fecal microbiota in the three groups (y-axis). Group of FIP affected cats (F, n = 5), healthy coronavirus negative (H, n = 5) and positive (C, n = 5) on x-axis. Each colour correspond to different phylum.
In the FIP group, three cats shared a similar microbiota composition, while cat 1F showed a completely different composition and cat 2F showed a lower number of diverse phyla (Fig. 4 ). The same pattern could be observed in relative class abundance (Table 2 ). COR group had a major proportion of Erysipelothrichi and Clostridia and lower Bacteroidia with respect of the other two groups (P = .05, 0.10 and 0.13, respectively). Again, cat 1F showed a completely different pattern of microbiota composition and cat 2F had a lower number of different classes (Fig. 5 ). The same trend was observed also in relative order abundance. For family and genus, the great amount of data made impossible to find any evident pattern. Lactobacillus presence was quite variable in healthy cats, whereas in the FIP group it was present only the cat with dry form (4F).
Fig. 4.

Relative abundance of the predominant phyla for each subject in the fecal microbiota. FIP affected cats (F, n = 5), healthy coronavirus negative (H, n = 5) and positive (C, n = 5). Each colour correspond to different phylum.
Table 2.
Median relative abundance of the most common classes in the fecal microbiota.
| Class (%) | FIP (n = 5) | COR (n = 5) | H (n = 5) |
|---|---|---|---|
| Actinobacteria | 0.0024 | 0.0007 | 0.0900 |
| Coriobacteriia | 0.1024 | 0.0908 | 0.0624 |
| Bacteroidia | 0.2948 | 0.1221 | 0.3795 |
| Bacilli | 0.0002 | 0.0303 | 0.0105 |
| Clostridia | 0.4988 | 0.5244 | 0.3677 |
| Erysipelotrichi | 0.0055 | 0.1630 | 0.0367 |
| Fusobacteriia | 0.0108 | 0.0018 | 0.0021 |
| Betaproteobacteria | 0.0020 | 0.0017 | 0.0055 |
| Deltaproteobacteria | 0.0014 | 0.0011 | 0.0006 |
| Epsilonproteobacteria | 0.0011 | 0.0023 | 0.0061 |
| Gammaproteobacteria | 0.0218 | 0.0135 | 0.0082 |
Fig. 5.

Relative abundance of the predominant classes for each subject in the fecal microbiota. FIP affected cats (F, n = 5), healthy coronavirus negative (H, n = 5) and positive (C, n = 5). Each colour correspond to different class.
4. Discussion
Until recently, traditional bacterial culture was commonly used to identify gut microbial population, but it is now recognized that the vast majority of intestinal microorganisms cannot be cultured using standard plating techniques (Suchodolski, 2016). The study of microbiota composition is a new field of interest in veterinary medicine. Microbiota evaluation is tricky both in the execution and in the interpretation of results, moreover the use of next generation sequencing technique is quite expensive. For this reason, in literature several studies involved a low number of animal (Schmid et al., 2018; Płoneczka-Janeczko et al., 2017; Desai et al., 2009)
To our knowledge, this is the first study about the gut microbiota composition in cats with feline coronaviruses.
Alpha rarefaction and beta diversity analyses are the most common and historically relevant statistics for metagenome studies aimed to determine easily and visually the presence of groups between samples. The alpha rarefaction aims to demonstrate that enough reads were sequenced for each sample for the main taxa identification. The beta diversity graphically represents the distance between microbiological communities from each sample. No differences in the fecal microbiota were observed among the three groups. However, despite the low number of animals, in several cases, P values were close to statistical significance. The analysis of a higher number of animals is needed to confirm the impact of systemic infection on the intestinal microbiota, as previously reported in people (Goedert, 2016).
Moreover, the peculiar enteric tropism FCoV could explain these results. Whether is the microbiota influenced by FCoV presence, or if certain animals with peculiar microbiota composition are predisposed to FCoV infection is unclear. In literature, only two studies investigated the correlation between gut microbiota and coronaviral diseases, specifically in swine transmissible gastro-enteritis virus (TGEV) infection (Koh et al., 2015; Liu et al., 2015). However, results were not comparable with our findings because of the different pathogenic role of FCoV compared to TGEV, as FECV infection is usually asymptomatic, and because of the different diet and bacterial phylotypes observed in swine compared to cats.
In contrast to what was previously reported for cats (Weese et al., 2015), our results showed a low abundance of Proteobacteria. In humans, increase in Proteobacteria relative abundance is associated with “dysbiosis” and gastrointestinal symptoms (Kaakoush et al., 2012; Suchodolski et al., 2012; Shin et al., 2015). In our study, none of the cats had gastrointestinal disorders and this could explain the Proteobacteria lower abundance, together with the individual variability.
In humans, low Bacteroidetes to Firmicutes ratio is another marker of dysbiosis (Shin et al., 2015). Interestingly in our study, the COR group showed a lower Bacteroidetes to Firmicutes ratio compared to the others. This could be related to the FCoV enteric tropism (stronger than in FIP cats), even if none of the animals showed gastrointestinal signs. This findings in COR group, could be a hint for an alteration in microbiota stability, even in absence of overt clinical signs.
In FIP group, two cats showed a completely different microbiota composition compared to the others. Specifically, cat 2F had a lower number of diverse phyla. Despite the possible individual variability, such a lack in gut microbiota diversity has previously been reported in people treated with antibiotics (Modi et al., 2014). In our caseload, as this was an exclusion criterion, this low abundance in cat 2F may be related to other variables (e.g. diet).
Lactobacillus seems to have a probiotic activity, however, elevated concentration had been reported in systemic disorders, such as type II diabetes in people, thus making unclear its protective role (Sato et al., 2014). In the FIP group, Lactobacillus was only found in cat 4F, affected by a dry form. The meaning of this finding is unclear. Besides, few studies have investigated this genus in cats, so it could be interesting to evaluate its presence in a larger number of animals, both healthy and diseased.
5. Conclusions
The gut microbiota composition observed in FCoV infected cats provide preliminary insight into an area that could be relevant for both feline health and deeper understanding of the microbiota and immune system interplay. Due to the application of strict inclusion criteria to reduce all the factors that could influence microbiota composition, the present study focused on a small sized sample and this can certainly be a limitation, although in literature several studies on the same topic have be conducted on a similar or even smaller sample size. Therefore, our findings should be confirmed on a larger caseload, possibly including also FCoV seronegative and non shedder cats, in order to definitively exclude any possible viral influence on gut microbiota. Nevertheless, these results could give new insight on causes and clinical significance of the microbiota changes associated with FCoV infection and possibly on FIP pathogenesis.
Acknowledgments
Acknowledgements
We thank the personnel of the Pathology and Clinical Pathology laboratories of the University of Padua for performing all the histology and immunohistochemistry.
Funding
This work was partially supported by the University of Milan [G46D15001850005 - Fondo Sviluppo Università degli Studi di Milano, Italy]. Preliminary results were presented as an Oral Presentation at the 72th SISVET Congress, Turin, 20-20 June 2018.
Conflict of interest statement
None of the authors has any financial or personal interest that could influence or bias the content of the paper.
Footnotes
Supplementary data to this article can be found online at https://doi.org/10.1016/j.rvsc.2019.07.003.
Appendix A. Supplementary data
Supplementary material
References
- Block K., Zheng Z., Dent A., Kee B., Huang H. Gut microbiota regulates K/BxN autoimmune arthritis through follicular helper T but not Th17 cells. J. Immunol. 2016;196(4):1550–1557. doi: 10.4049/jimmunol.1501904. [DOI] [PMC free article] [PubMed] [Google Scholar]
- Desai A.R., Musil K.M., Carr A.P., Hill J.E. Characterization and quantification of feline fecal microbiota using cpn60 sequence-based methods and investigation of animal-to-animal variation in microbial population structure. Vet. Microbiol. 2009;137(1–2):120–128. doi: 10.1016/j.vetmic.2008.12.019. [DOI] [PubMed] [Google Scholar]
- Duthie S., Eckersall P.D., Addie D.D., Lawrence C.E., Jarrett O. Value of alpha 1-acid glycoprotein in the diagnosis of feline infectious peritonitis. Vet. Rec. 1997;141(12):299–303. doi: 10.1136/vr.141.12.299. [DOI] [PubMed] [Google Scholar]
- Frank D., St Amand A., Feldman R., Boedeker E., Harpaz N., Pace N. Molecular-phylogenetic characterization of microbial community imbalances in human inflammatory bowel diseases. Proc. Natl. Acad. Sci. U. S. A. 2007;104(34):13780–13785. doi: 10.1073/pnas.0706625104. [DOI] [PMC free article] [PubMed] [Google Scholar]
- Giordano A., Stranieri A., Rossi G., Paltrinieri S. High diagnostic accuracy of the Sysmex XT-2000iV delta total nucleated cells on effusions for feline infectious peritonitis. Vet. Clin. Pathol. 2015;44(2):295–302. doi: 10.1111/vcp.12241. [DOI] [PMC free article] [PubMed] [Google Scholar]
- Goedert J. Effect of HIV, immune deficiency, and confounding on the distal gut microbiota. EBioMedicine. 2016;5:14–15. doi: 10.1016/j.ebiom.2016.01.034. [DOI] [PMC free article] [PubMed] [Google Scholar]
- Handl S., Dowd S.E., Garcia-Mazcorro J.F., Steiner J.M., Suchodolski J.S. Massive parallel 16S rRNAgene pyrosequencing reveals highly diverse fecal bacterial and fungal communities in healthy dogs and cats. FESM Microbiol. Ecol. 2011;76:301–310. doi: 10.1111/j.1574-6941.2011.01058.x. [DOI] [PubMed] [Google Scholar]
- Hazuchova K., Held S., Neiger R. Usefulness of acute phase proteins in differentiating between feline infectious peritonitis and other diseases in cats with body cavity effusions. J. Feline Med. Surg. 2017;19(8):809–816. doi: 10.1177/1098612X16658925. [DOI] [PMC free article] [PubMed] [Google Scholar]
- Herrewegh A., de Groot R., Cepica A., Egberink H., Horzinek M., Rottier P. Detection of feline coronavirus RNA in feces, tissues, and body fluids of naturally infected cats by reverse transcriptase PCR. J. Clin. Microbiol. 1995;33(3):684–689. doi: 10.1128/jcm.33.3.684-689.1995. [DOI] [PMC free article] [PubMed] [Google Scholar]
- Kaakoush N.O., Day A.S., Huinao K.D., Leach S.T., Lemberg D.A., Dowd S.E., Mitchell H.M. Microbial dysbiosis in pediatric patients with Crohn’s disease. J. Clin. Microbiol. 2012;50(10):3258–3266. doi: 10.1128/JCM.01396-12. [DOI] [PMC free article] [PubMed] [Google Scholar]
- Kipar A., Meli M.L. Feline infectious peritonitis: still an enigma? Vet. Pathol. 2014;51(2):505–526. doi: 10.1177/0300985814522077. [DOI] [PubMed] [Google Scholar]
- Kipar A., Meli M.L., Baptiste K.E., Bowker L.J., Lutz H. Sites of feline coronavirus persistence in healthy cats. J. Gen. Virol. 2010;91(Pt 7):1698–1707. doi: 10.1099/vir.0.020214-0. [DOI] [PubMed] [Google Scholar]
- Koh H., Kim M., Lee J., Kim H., Park S. Changes in the swine gut microbiota in response to porcine epidemic Diarrhea infection. Microbes Environ. 2015;30(3):284–287. doi: 10.1264/jsme2.ME15046. [DOI] [PMC free article] [PubMed] [Google Scholar]
- Ley R., Bäckhed F., Turnbaugh P., Lozupone C., Knight R., Gordon J. Obesity alters gut microbial ecology. Proc. Natl. Acad. Sci. U. S. A. 2005;102(31):11070–11075. doi: 10.1073/pnas.0504978102. [DOI] [PMC free article] [PubMed] [Google Scholar]
- Liu S., Zhao L., Zhai Z., Zhao W., Ding J., Dai R., Sun T., Meng H. Porcine epidemic Diarrhea virus infection induced the unbalance of gut microbiota in piglets. Curr. Microbiol. 2015;71(6):643–649. doi: 10.1007/s00284-015-0895-6. [DOI] [PubMed] [Google Scholar]
- Lopes M., Carneiro M., Dos Santos L., Vieira L. Indigenous microbiota and Leishmaniasis. Parasite Immunol. 2016;38(1):37–44. doi: 10.1111/pim.12279. [DOI] [PubMed] [Google Scholar]
- McMurdie P.J., Holmes S. phyloseq: an R package for reproducible interactive analysis and graphics of microbiome census data. PLoS One. 2013;8(4) doi: 10.1371/journal.pone.0061217. [DOI] [PMC free article] [PubMed] [Google Scholar]
- Modi S., Collins J., Relman D. Antibiotics and the gut microbiota. J. Clin. Invest. 2014;124(10):4212–4218. doi: 10.1172/JCI72333. [DOI] [PMC free article] [PubMed] [Google Scholar]
- Paltrinieri S., Giordano A., Tranquillo V., Guazzetti S. Critical assessment of the diagnostic value of feline alpha1-acid glycoprotein for feline infectious peritonitis using the likelihood ratios approach. J. Vet. Diagn. Investig. 2007;19(3):266–272. doi: 10.1177/104063870701900306. [DOI] [PubMed] [Google Scholar]
- Pedersen N. An update on feline infectious peritonitis: virology and Immunopathogenesis. Vet. J. 2014;201:123–132. doi: 10.1016/j.tvjl.2014.04.017. [DOI] [PMC free article] [PubMed] [Google Scholar]
- Pedersen N. An update on feline infectious peritonitis: diagnostics and therapeutics. Vet. J. 2014;201:133–141. doi: 10.1016/j.tvjl.2014.04.016. [DOI] [PMC free article] [PubMed] [Google Scholar]
- Płoneczka-Janeczko K., Bania J., Bierowiec K., Kiełbowicz M., Kiełbowicz Z. Bacterial diversity in feline conjunctiva based on 16S rRNA gene sequence analysis: a pilot study. Biomed. Res. Int. 2017;3710404 doi: 10.1155/2017/3710404. [DOI] [PMC free article] [PubMed] [Google Scholar]
- Robinson M., Smyth G. Small-sample estimation of negative binomial dispersion, with applications to SAGE data. Biostatistics. 2008;9(2):321–332. doi: 10.1093/biostatistics/kxm030. [DOI] [PubMed] [Google Scholar]
- Round J., Mazmanian S. The gut microbiota shapes intestinal immune responses during health and disease. Nat. Rev. Immunol. 2009;9(5):313–323. doi: 10.1038/nri2515. [DOI] [PMC free article] [PubMed] [Google Scholar]
- Sato J., Kanazawa A., Ikeda F., Yoshihara T., Goto H., Abe H., Komiya K., Kawaguchi M., Shimizu T., Ogihara T., Tamura Y., Sakurai Y., Yamamoto R., Mita T., Fujitani Y., Fukuda H., Nomoto K., Takahashi T., Asahara T., Hirose T., Nagata S., Yamashiro Y., Watada H. Gut dysbiosis and detection of “live gut bacteria” in blood of Japanese patients with type 2 diabetes. Diabetes Care. 2014;37(8):2343–2350. doi: 10.2337/dc13-2817. [DOI] [PubMed] [Google Scholar]
- Schmid S.M., Suchodolski J.S., Price J.M., Tolbert M.K. Omeprazole minimally alters the Fecal microbial Community in six Cats: a pilot study. Front. Vet. Sci. 2018;16(5):79. doi: 10.3389/fvets.2018.00079. [DOI] [PMC free article] [PubMed] [Google Scholar]
- Shin N.R., Whon T.W., Bae J.W. Proteobacteria: microbial signature of dysbiosis in gut microbiota. Trends Biotechnol. 2015;33(9):496–503. doi: 10.1016/j.tibtech.2015.06.011. [DOI] [PubMed] [Google Scholar]
- Stranieri A., Giordano A., Bo S., Braghiroli C., Paltrinieri S. Frequency of electrophoretic changes consistent with feline infectious peritonitis in two different time periods (2004-2009 vs 2013-2014) J. Feline Med. Surg. 2017;19(8):880–887. doi: 10.1177/1098612X16664389. [DOI] [PMC free article] [PubMed] [Google Scholar]
- Stranieri A., Paltrinieri S., Giordano A. Diagnosing feline infectious peritonitis using the Sysmex XT-2000iV based on frozen supernatants from cavitary effusions. J. Vet. Diagn. Investig. 2017;29(3):321–324. doi: 10.1177/1040638716689115. [DOI] [PubMed] [Google Scholar]
- Stranieri A., Giordano A., Paltrinieri S., Giudice C., Cannito V., Lauzi S. Comparison of the performance of laboratory tests in the diagnosis of feline infectious peritonitis. J. Vet. Diagn. Investig. 2018;30(3):459–463. doi: 10.1177/1040638718756460. [DOI] [PMC free article] [PubMed] [Google Scholar]
- Suchodolski J. Diagnosis and interpretation of intestinal dysbiosis in dogs and cats. Vet. J. 2016;215:30–37. doi: 10.1016/j.tvjl.2016.04.011. [DOI] [PubMed] [Google Scholar]
- Suchodolski J.S., Dowd S.E., Wilke V., Steiner J.M., Jergens A.E. 16S rRNA gene pyrosequencing reveals bacterial dysbiosis in the duodenum of dogs with idiopathic inflammatory bowel disease. PLoS One. 2012;7(6) doi: 10.1371/journal.pone.0039333. [DOI] [PMC free article] [PubMed] [Google Scholar]
- Suchodolski J.S., Foster M.L., Sohail M.U., Leutenegger C., Queen E.V., Steiner J.M., Marks S.L. The fecal microbiome in cats with diarrhea. PLoS One. 2015;10(5) doi: 10.1371/journal.pone.0127378. [DOI] [PMC free article] [PubMed] [Google Scholar]
- Tasker S. Diagnosis of feline infectious peritonitis: update on evidence supporting available tests. J. Feline Med. Surg. 2018;20(3):228–243. doi: 10.1177/1098612X18758592. [DOI] [PMC free article] [PubMed] [Google Scholar]
- Tincati C., Douek D., Marchetti G. Gut barrier structure, mucosal immunity and intestinal microbiota in the pathogenesis and treatment of HIV infection. AIDS Res. Ther. 2016;13:19. doi: 10.1186/s12981-016-0103-1. [DOI] [PMC free article] [PubMed] [Google Scholar]
- Tizard I.R., Jones S.W. The microbiota regulates immunity and immunologic diseases in dogs and cats. Vet. Clin. North Am. Small Anim. Pract. 2018;48(2):307–322. doi: 10.1016/j.cvsm.2017.10.008. [DOI] [PubMed] [Google Scholar]
- Vieira S., Pagovich O., Kriegel M. Diet, microbiota and autoimmune diseases. Lupus. 2014;23(6):518–526. doi: 10.1177/0961203313501401. [DOI] [PMC free article] [PubMed] [Google Scholar]
- Weese J., Nichols J., Jalali M., Litster A. The rectal microbiota of cats infected with feline immunodeficiency virus infection and uninfected controls. Vet. Microbiol. 2015;180:96–102. doi: 10.1016/j.vetmic.2015.08.012. [DOI] [PubMed] [Google Scholar]
- Williams A., Probert C., Stepankova R., Tlaskalova-Hogenova H., Phillips A., Bland P. Effects of microflora on the neonatal development of gut mucosal T cells and myeloid cells in the mouse. Immunology. 2006;119(4):470–478. doi: 10.1111/j.1365-2567.2006.02458.x. [DOI] [PMC free article] [PubMed] [Google Scholar]
- Zini E., Nolli S., Ferri F., Massari F., Gerardi G., Nicoli S., Romanelli G., Montinaro V., Trez D., Cavicchioli L., Ferro S. Pheochromocytoma in dogs undergoing Adrenalectomy. Vet. Pathol. 2018;56(3):358–368. doi: 10.1177/0300985818819174. [DOI] [PubMed] [Google Scholar]
Associated Data
This section collects any data citations, data availability statements, or supplementary materials included in this article.
Supplementary Materials
Supplementary material