

Abstract
The purpose of this study was to investigate the components of renin–angiotensin system (RAS), liver function and histology in liver fibrogenesis in the rats induced by low-dose chronic carbon tetrachloride (CCL4) administration and evaluate the relationship between biochemical variables and components of RAS. Male Sprague–Dawley (SD) rats were randomly divided into the CCL4 group which received intraperitoneal injection of 40% CCL4 dissolved in olive oil every three days for four consecutive weeks (Initial dose was 5 mL/kg, other dose: 3 mL/kg) and the control group which received the same dose of olive oil. The micro-structure of the liver was examined by H&E. Hepatic Ang II and Ang(1–7) was detected. Real-time PCR and Western-blot were performed to determine the gene and protein expression of the RAS. The components of RAS were all up-regulated in CCL4 group, and the increased extent of ACE-Ang II-AT1 axis was higher than the ACE2-Ang(1–7)-Mas axis. There was a significant correlation between ACE and ACE2 gene expression, AT1 and MAS gene expression, Ang II and Ang(1–7) in the liver of rats. ACE (or ACE2) gene expression strongly correlated with the index of liver injury significantly. These results suggest hepatic fibrogenesis induced by chronic CCL4 administration may be associated with the relationship of ACE-Ang II-AT1 axis and ACE2-Ang(1–7)-MAS axis.
Keywords: ACE, ACE2, Ang II, Ang(1–7), Liver fibrosis
1. Introduction
Recent evidence indicates that the tissue renin–angiotensin system (RAS) takes part in the pathogenesis of liver fibrosis (Paizis et al., 2002, Bataller et al., 2005, Yang et al., 2005, Nabeshima et al., 2006), angiotensin converting enzyme (ACE), a dipeptidyl carboxypeptidase, is a key enzyme in RAS as it converts angiotensin I (Ang I) to angiotensin II (Ang II). Ang II mediates pivotal biological actions (by the AT1 receptor) involved in tissue repair, myofibroblast proliferation, infiltration of inflammatory cells and collagen synthesis (Bataller et al., 2000, Bataller et al., 2003b, Yoshiji et al., 2003, Yang et al., 2005). The importance of the ACE-Ang II-AT1 receptor axis in hepatic fibrosis is supported further by studies which have shown that inflammation and fibrosis in response to both CCL4 treatment and BDL (bile duct ligation) are attenuated in AT1-knockout mice (Kanno et al., 2003, Yang et al., 2005). Furthermore, systemic infusion of angiotensin II can stimulate proliferation of bile duct epithelial cells, exacerbate liver fibrosis and increase serum transaminases and endotoxin levels in BDL rat livers (Bataller et al., 2003a, Bataller et al., 2005). In almost all of the published studies, both Angiotensin converting enzyme inhibitor (ACEI) and Ang II receptor blocker (ARB) have been established to have beneficial effects for the attenuation of fibrosis and down-regulation of key inflammatory and profibrotic cytokines involved in the pathogenesis of hepatic fibrosis (Wei et al., 2000, Jonsson et al., 2001, Ohishi et al., 2001, Yoshiji et al., 2001).
More recently, the discovery of ACE2 (Donoghue et al., 2000, Tipnis et al., 2000), a homologue of ACE, has revolutionized our understanding of the RAS. It can degrade Ang II to Ang(1–7) and cleave Ang I to generate Ang1–9. Ang1–9 has no known effects, but is converted to Ang(1–7) by ACE (Rice et al., 2004).The actions of Ang(1–7) are mainly mediated by the G-protein-coupled receptor MAS. ACE2, together with Ang(1–7) and MAS, represents another axis [ACE2-Ang(1–7)-MAS axis] of the RAS (Santos et al., 2008). This axis can be viewed as the principal counter-regulatory mechanism for the ACE-Ang II-AT1 receptor axis. Apparently, ACE2 acts as a key regulator controlling the balance between these two axes by simultaneously diminishing Ang II and forming Ang(1–7). The discovery of ACE2 has stimulated investigations into the potential role of this enzyme in the prevention and treatment of diseases. In experimental models of hypertension and diabetes, the expression of tissue ACE2 is reduced, contributing to Ang II-mediated tissue injury (Crackower et al., 2002, Tikellis et al., 2003). ACE2 is also a functional receptor for the severe acute respiratory syndrome (SARS) coronavirus, which facilitates the infection of target cells (Li et al., 2003, Imai et al., 2005, Guo et al., 2008).
Several studies recently reported that hepatic ACE2 expression was up-regulated in cirrhotic human livers or in a liver injury model in the rats (Paizis et al., 2005, Herath et al., 2007, Huang et al., 2009). However, changes in the two axes of the RAS and the ratio of ACE/ACE2 Ang II/Ang(1–7) and AT1/Mas have not been determined after CCL4 induced liver injury. In the current study, we aimed to examine the contents of the ACE-Ang II-AT1 axis and the ACE2-Ang(1–7)-MAS axis in a model of liver fibrosis induced by CCL4. Specifically, we evaluated the correlation between the ACE-Ang II-AT1 axis and the ACE2-Ang(1–7)-MAS axis, and the relationship between biochemical variables and the two axes of the RAS in liver tissue.
2. Materials and methods
2.1. Animal and experimental model
Male Sprague–Dawley (SD) rats weighing about 125 g ± 10 g were purchased from Shanghai Laboratory Animal Center, Chinese Academy Science (SIBC, CAS) and housed in a controlled environment in the animal facility with a 12 h light–dark cycle. After 1 week acclimatization, the rats were randomly divided into two groups, the control group and the CCL4 group (n = 8 in each group).The CCL4 group received intraperitoneal injection of 40% CCL4 (Sigma–Aldrich, Co., USA) dissolved in olive oil every three days for four consecutive weeks (Initial dose was 5 mL/kg, other dose: 3 mL/kg) and the control group received the same dose of olive oil. All procedures were approved by the Investigation and Ethics Committee and the Institutional Animal Care and Use Committee of our institution.
2.2. Experimental protocol
2.2.1. Relative hepatic weight (RHW)
The rats weighed once a week and the weight of liver was measured at the end of the whole experiment.
2.2.2. Blood processing
Blood samples were obtained from the abdominal aorta at the end of the experiment. Serum was collected from the blood sample by immediate centrifugation at 3500g for 10 min at 4 °C. The serum was collected in tubes and stored at −70 °C for measuring liver function.
2.2.3. Biochemical and histological assessment of liver injury
Serum alanine aminotransferase (ALT), aspartate aminotransferase (AST), total protein (TP) and albumin (ALB) concentrations were measured using kits that were purchased from Nanjing jiancheng Bioengineering Institute. For histological analysis, liver samples were fixed in 10% formaldehyde solution, dehydrated, embedded in paraffin, and cut into 3 μm-thick sections. Staining for hematoxylin and eosin (H&E) was carried out with standard techniques.
2.2.4. Radioimmunoassay for Ang II
The hepatic tissue (100 mg) was homogenized in 1 ml 0.9% NaCl (contain 10 μl 0.3 M Na2EDTA, 5 μl 0.32 M dimercaptopropanol and 10 μl 0.34 M 8-hydroxyquinoline). After centrifugation, the supernatant was used to measure Ang II in a radioimmunoassay. The concentration of protein in liver served as the endogenous control. The kits were purchased from Beijing North Institute of Biological Technology and the intra- and inter-assay coefficients of variation were less than 10% and 15%, respectively.
2.2.5. ELISA for Ang(1–7)
The concentration of Ang(1–7) in liver homogenate (the homogenate was same as above) was measured by enzyme-linked immunosorbent assay (ELISA). The kits were purchased from R&D Systems.
2.2.6. Real-time polymerase chain reaction (RT-PCR) analysis
Total RNA was extracted from rat liver using TRNZOL reagent according to the manufacturer’s instructions (Invitrogen, Carlsbad, CA, USA). Total RNA (2 μg) was subjected to first-strand cDNA synthesis using random primers, M-MLV reverse transcriptase and RNase inhibitor (SunShine Bio, Nanjing, China). The specific primers for the polymerase chain reaction (PCR) were as follows: ACE: 5′-ATGCCTCTGCGTGGGACTTC-3′ (forward) and 5′-TACTGCACGTGGCCCATCTC-3′ (reverse); ACE2: 5′-AATCGTAGGCTCTGGGCTTGG-3′ (forward) and 5′-TTCGATCAACTGGTTTCGGTTGTA-3′ (reverse); AT1:5′-C CCACTCAAGCCTGTCTACGAA-3′ (forward) and 5′-GTGTGCTTTGAACCTGTCACTCC-3′ (reverse); MAS:5′-TGACAGCCATCAGTGTGGAGA-3′ (forward) and 5′-GCATGAAAGTGCCCACAGGA-3′ (reverse); β-actin:5′-CCCTGTGCTGCTCACCGA-3′ (forward) and 5′-ACAGTGTGGGTGACCCCGTC-3′ (reverse); The amplified product sizes were 112, 198, 120, 116 and 186 bp respectively, and RNA expression levels were quantified by SYBR Green real-time PCR using a real-time PCR detection system (Prism 7300; Applied Biosystems Inc., Foster City, USA). β-actin served as the endogenous control. In order to calculate differences in the expression level of each target gene, the ΔΔCT method for relative quantification was used according to the manufacturer’s manual.
2.2.7. Western-blot analysis
Liver proteins for Western-blot were extracted with radio immunoprecipitation assay lysis buffer (RIPA, 50 mM Tris pH 7.5, 150 mM NaCl, 1 mM EDTA, 1% TritonX-100, 10% glycerol, 0.5% Sodium deoxycholate, 0.1% SDS, 1 mM phenylmethanesulfonyl fluoride (PMSF), 10 mg/L aprotinin, 10 mg/L leuprptin) and the protein was quantified by bicinchoninic acid (BCA, Beyotime, shanghai China). Protein (100 μg) was run by SDS–PAGE on a 8% gel, and the separated proteins transferred to polyvinylidene difluoride membranes (PVDF; Millipore, Bedford, USA). After transfer, the membranes were blocked in 5% non-fat milk in tris-buffered saline with 0.1% Tween-20 (TBST) for an hour at room temperature and then incubated overnight at 4 °C with primary antibodies of ACE2 (1:300; Santa Cruz Biotechnology, CA, USA) and β-actin antibody (1:10,000; Cell Signaling, Beverly, USA), and then were washed 5 times for 10 min in TBST. Immunoreactive bands were detected with horseradish peroxidase-conjugated secondary antibodies (1:10,000, Abcam, America) and an enhanced chemiluminescence system (Pierce, Rockford, USA). The density of individual bands was quantified by densitometric scanning of the blots using Quantity One software (Bio-Rad, Hercules, CA, USA).
2.3. Statistical analysis
Data are expressed as the mean ± SE. Multiple comparisons were performed using one-way analysis of variance (ANOVA) and Bonferroni’s test. Pearson correlation coefficient was used between the individual variables. P < 0.05 was considered significant. All statistical analyses were performed using SPSS16.0 software (SPSS, Chicago, USA).
3. Results
3.1. Biochemical measurements
Compared with the control group, plasma TP and ALB decreased in the CCL4 group, while their relative hepatic weight, ALT and AST increased significantly (Fig. 1 ).
Fig. 1.
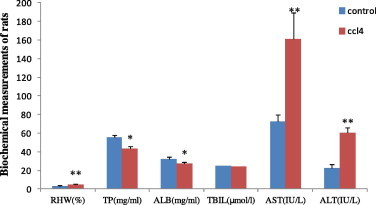
The contents of RHW, plasma TP, ALB, ADG, ALB, AST and ALT in rats of control group and CCL4 group. RHW, relative hepatic weight; TP, total protein; ADG, average daily gain; ALB, albumin; AST, aspartate aminotransferase; ALT, alanine aminotransferase. ∗P < 0.05, ∗∗P < 0.01 compared with the respective control.
3.2. Morphological studies
At the fourth week after injection of CCL4, the livers of the CCL4 group were grossly enlarged, discolored and blunt edged, they covered the entire abdominal cavity and there was some multifocal necrosis on the surface of liver (Fig. 2 D). Histological analysis showed portal fibrosis and fibrous expansion of portal tracts with marked portal-to-portal and portal-to-central bridging (Fig. 2E and F). The control group showed the normal hepatic architecture and no apoptotic cells (Fig. 2A–C).
Fig. 2.
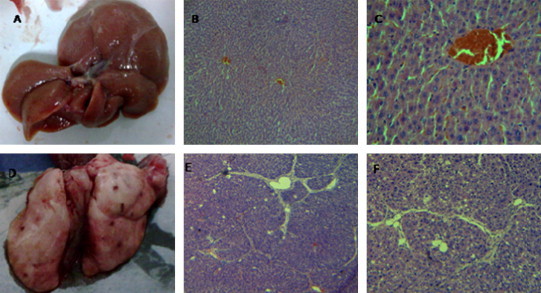
Representative appearance and microphotographs of the liver tissue and sections (H&E staining, original magnification, 40× (B and E) 100× (C and F)). At the fourth weeks we collect the livers that were fixed with 4% buffered paraformaldehyde then embedded in paraffin. Sections of 3 μm thickness were prepared and evaluated for liver injury by H&E. A, B and C are the control group with normal liver appearance, architecture and absence of fibrosis; D, E and F are following injection of CCL4 showing some necrosis points on the surface of liver and fibrous expansion of portal areas with portal-to-portal bridging.
3.3. Hepatic Ang II and Ang (1–7)
There was a significant increase of Ang II (1215 ± 75.02 versus 1914 ± 71.40 pg/mg protein, P < 0.01) and Ang(1–7) (90.2 ± 12 versus 118.6 ± 18.6 ng/mg protein, P < 0.05) in the livers of the CCL4 group compared with the control group. We also found the ratio of Ang II/Ang(1–7) in the rats of the CCL4 group increased significantly compared to the control group (13.58 ± 1.05 versus 16.44 ± 2.14, P = 0.021).
3.4. Expression of ACE, AT1, ACE2 and MAS gene in liver tissue
Injection of CCL4 resulted in significant changes in hepatic ACE, AT1, ACE2 and MAS gene expression, which increased 2.06, 0.61, 2.11 and 0.71-fold, respectively (P = 0.006, P = 0.046, P = 0.029, P = 0.044) (Fig. 3 ) but ACE/ACE2 and AT1/MAS in the CCL4 group had no significant changes (1.03 ± 0.3 versus 1.15 ± 0.63, P = 0.682; 0.97 ± 0.07 versus 1.11 ± 0.14, P = 0.478), compared with the control group.
Fig. 3.
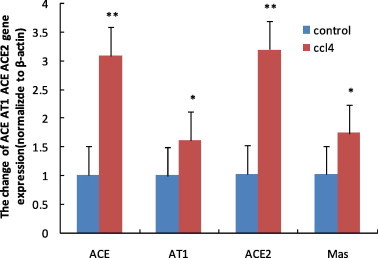
ACE, AT1, ACE2 and MAS mRNA expression in control and CCL4 group. Total RNA was extracted from liver and then RNAwas subjected to first-strand cDNA synthesis using M-MLV reverse transcriptase. The expression of RNA was quantified by SYBR Green real-time PCR using a sequence detection system. β-actin was served as the endogenous control. The ΔΔCT method for relative quantification was used to calculate differences in the expression level of each target gene. ∗P < 0.05, ∗∗P < 0.01, compared with the respective control group.
3.5. Western-blot analysis of ACE2 protein expression
Western-blot analysis for ACE2 protein in the whole liver homogenates confirmed the measures of ACE2 mRNA levels. ACE2 protein was detectable at very low levels in healthy livers. However, the ACE2 protein expression levels increased significantly (P = 0.0002) after injection of CCL4 (Fig. 4 ).
Fig. 4.
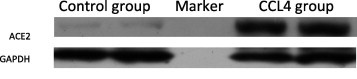
Western-blot analysis for ACE2 protein levels in the liver tissue. GAPDH is internal control. The density of individual bands was quantified by densitometric scanning of the blots using Quantity One software.
3.6. Relationship between ACE and ACE2, AT1 and MAS gene expression, hepatic Ang II and Ang(1–7)
Because the two axes of RAS have opposite effects, we evaluated a potential correlation between ACE and ACE2, AT1 and MAS gene expression, hepatic Ang II and Ang(1–7) and our data indicate that there is a high correlation between ACE and ACE2 (r = 0.75, P = 0.014), AT1 and MAS (r = 0.633, P = 0.011,), concentrations of hepatic Ang II and Ang (1–7) (r = 0.68, P = 0.004).
3.7. Relationship between biochemical variables and the components of RAS
We evaluated the relationship between biochemical variables and the gene expression of ACE, AT1, ACE2 and MAS in liver tissue. We also assessed the correlation between biochemical variables and hepatic Ang II or Ang (1–7). ACE gene expression had a significant correlation with ALT (r = 0.829, P < 0.0001) and AST (r = 0.661, P = 0.007), a moderate correlation with TP (P = −0.53, P = 0.044). ACE2 gene expression had a significant correlation with ALT (r = 0.618, P = 0.014), AST (r = 0.672, P = 0.002) and TP (r = −0.77, P = 0.006). Hepatic Ang II, Ang (1–7) and MAS gene expression also had a moderate correlation with ALT (Table 1 ).
Table 1.
Relationship between biochemical variables and the components of RAS.
| Relationship | ACE mRNA | AT1 mRNA | ACE2 mRNA | MAS mRNA | Hepatic Ang II | Hepatic Ang(1–7) |
|---|---|---|---|---|---|---|
| ALT | r = 0.829⁎⁎ | r = 0.496 | r = 0.618⁎ | r = 0.559⁎ | r = 0.527⁎ | r = 0.521⁎ |
| P < 0.0001 | P = 0.060 | P = 0.014 | P = 0.030 | P = 0.043 | P = 0.047 | |
| AST | r = 0.661⁎⁎ | r = 0.427 | r = 0.672⁎⁎ | r = 0.368 | r = 0.461 | r = 0.512 |
| P = 0.007 | P = 0.112 | P = 0.002 | P = 0.178 | P = 0.084 | P = 0.051 | |
| TP | r = −0.53⁎ | r = −0.449 | r = 0.77⁎⁎ | r = −0.288 | r = -0.422 | r = −0.224 |
| P = 0.044 | P = 0.093 | P = 0.006 | P = 0.298 | P = 0.117 | P = 0.442 |
TP, total protein; AST, aspartate aminotransferase; ALT, alanine aminotransferase.
Relationship analysis of data is compared by Pearson correlation coefficient and r is the correlation coefficient.
P < 0.05.
P < 0.01.
4. Discussion
The model of intoxication with CCL4 has been used for decades to investigate the response of liver injury, because the elementary lesions caused by this hepatotoxin replicate those seen in most cases of human and animal liver diseases (Anderson et al., 1981, Zangar et al., 2000, Lee et al., 2008). CCL4 metabolites react with polyunsaturated fatty acids to propagate a chain reaction leading to lipid peroxidation or bind covalently to lipids and proteins, resulting in destruction of cell membranes and also induced liver damage (Slater, 1987). The damage to liver cell membranes causes leakage of intracellular enzymes, causing serum ALT and AST to increase. Serum Alb is mainly synthesized in the liver and is held within closely defined parameter in the physiological state, but Alb synthesis decreased when liver cells are damaged. Serum ALT, AST and Alb can reflect the degree of liver injury. In our experiment, serum Alb and TP of rats were significantly decreased (P < 0.05) after induced by CCL4, and relative hepatic weight, serum ALT and AST activity increased significantly (P < 0.01). Histological observations showed that there was multifocal necrosis on the surface of liver and fibrous expansion of portal areas with portal-to-portal bridging in CCL4 group. These data indicated that liver injury was induced by CCL4.
A number of studies have provided evidence that RAS contributes to the pathogenesis of chronic liver disease. ACE is a key enzyme in RAS and converts Ang I to the potent vaso-constrictor Ang II that can induce endothelial cell differentiation and proliferation by AT1 receptor (Kobayashi et al., 2006). Bataller et al. (2005) reported that systemic infusion of Ang II augments hepatic fibrosis in BDL rats. Furthermore, blockade of RAS by ACE inhibitors or angiotensin type 1 receptor antagonists significantly attenuates liver fibrosis in several animal models (Wei et al., 2000, Ohishi et al., 2001, Yoshiji et al., 2001, Terui et al., 2002). ACE2, a homologue of ACE, can degrade Ang II and in turn generate Ang(1–7), which, by binding the G protein-coupled receptor MAS, acts as the main counter-regulator of the traditional ACE-Ang II-AT1 axis. Pereira et al. found the pharmacological blockade of endogenous Ang(1–7) accelerated liver fibrosis (Pereira et al., 2007). Knockout of the ACE2 gene in mice aggravated liver fibrosis following bile duct ligation or chronic carbon tetrachloride (CCL4). Recombinant ACE2 attenuated experimental liver fibrosis (Oesterreicher et al., 2009).These data suggest that the ACE2-Ang(1–7)-Mas axis plays a protective role in hepatic fibrosis and the elevated ACE2 during hepatic injury degrades Ang II and generates Ang(1–7), which counterbalances the generation and multiple deleterious effects of Ang II.
In the present study, we found that the expression of hepatic ACE2 mRNA and protein in CCL4 group increased. This observation is in accordance with some previous studies (Herath et al., 2007, Huang et al., 2009, Huang et al., 2010). Furthermore, we also found an increase of Ang(1–7) and Mas in liver of rats induced by CCL4. This result seems to be helpful for livers of rats, but an increase of ACE, Ang II and AT1 had already found in liver of rats from CCL4 group. It was uncertain that which axis plays the major role in the process of liver fibrosis, so the present study evaluated the ACE/ACE2, AT1/MAS, Ang II/Ang(1–7) and found that all three ratios were higher in the CCL4 group than that of the control group. It suggested that the ACE-AT1-MAS axis may play a major role in liver fibrosis. This may be related to chronic injection of CCL4 which induced ongoing hepatic injury.
The present study identified a positive correlation between ACE and ACE2 mRNA levels in liver tissues. This finding is consistent with a previous study reported by Huang et al. (2009). However, no work did not evaluate the relationship between AT1 and MAS mRNA levels, Ang II and Ang(1–7). The present study identified a positive correlation between AT1 and MAS mRNA levels, Ang II and Ang(1–7) in liver tissues. We consider this finding very important for elucidation of the mechanisms of interplay between ACE-Ang II-AT1axis and ACE2-Ang(1–7)-MAS axis and for establishing the role of ACE2-Ang(1–7)-MAS axis as a counter-regulator of ACE-Ang II-AT1axis.
The relationship between biochemical variables and the expression of two axes of RAS remains unclear. We assessed the association between biochemical variables and the two axes of RAS in liver tissue fibrosis. In the current study, we found that there are significant correlations between ACE (or ACE2) and ALT (or AST/TP). Hepatic Ang II (or hepatic Ang(1–7)) has a positive correction with AST (Table 1). The correlations between RAS and liver function indirectly support the hypothesis that RAS plays an important role in liver injury.
In conclusion, RAS in the liver is associated with the biochemical characteristics of the injury liver in the rats induced by CCL4. ACE2 is a newly emerging component of RAS that is a compensatory mechanism involved in liver injury. Further investigations in liver fibrosis should be undertaken to confirm the ACE2-Ang(1–7)-Mas axis. Improving the expression and activity of ACE2 to reduce Ang II in liver may be an effective method of treating liver fibrosis.
Acknowledgements
This work was supported by a grant (30871838) from National Natural Science Foundation of China and Priority Academic Program Development of Jiangsu Higher Education Institutions (PAPD) and Graduate Students’ Innovative projects of Jiangsu Higher Education Institutions (CXZZ12-0296).
References
- Anderson P.H., Matthews J., Berrett S., Brush P., Patterson D. Changes in plasma enzyme activities and other blood components in response to acute and chronic liver damage in cattle. Research in Veterinary Science. 1981;31(1):1–4. [PubMed] [Google Scholar]
- Bataller R., Ginès P., Nicolás J.M., Görbig M.N., Garcia-Ramallo E., Gasull X., Bosch J., Arroyo V., Rodés J. Angiotensin II induces contraction and proliferation of human hepatic stellate cells. Gastroenterology. 2000;118(6):1149–1156. doi: 10.1016/s0016-5085(00)70368-4. [DOI] [PubMed] [Google Scholar]
- Bataller R., Gäbele E., Schoonhoven R., Morris T., Lehnert M., Yang L., Brenner D.A., Rippe R.A. Prolonged infusion of angiotensin II into normal rats induces stellate cell activation and proinflammatory events in liver. American Journal of Physiology – Gastrointestinal and Liver Physiology. 2003;285(3):G642–G651. doi: 10.1152/ajpgi.00037.2003. [DOI] [PubMed] [Google Scholar]
- Bataller R., Schwabe R.F., Choi Y.H., Yang L., Paik Y.H., Lindquist J., Qian T., Schoonhoven R., Hagedorn C.H., Lemasters J.J. NADPH oxidase signal transduces angiotensin II in hepatic stellate cells and is critical in hepatic fibrosis. Journal of Clinical Investigation. 2003;112(9):1383–1394. doi: 10.1172/JCI18212. [DOI] [PMC free article] [PubMed] [Google Scholar]
- Bataller R., Gäbele E., Parsons C.J., Morris T., Yang L., Schoonhoven R., Brenner D.A., Rippe R.A. Systemic infusion of angiotensin II exacerbates liver fibrosis in bile duct-ligated rats. Hepatology. 2005;41(5):1046–1055. doi: 10.1002/hep.20665. [DOI] [PubMed] [Google Scholar]
- Crackower M.A., Sarao R., Oudit G.Y., Yagil C., Kozieradzki I., Scanga S.E., Oliveira-dos-Santos A.J., da Costa J., Zhang L., Pei Y. Angiotensin-converting enzyme 2 is an essential regulator of heart function. Nature. 2002;417(6891):822–828. doi: 10.1038/nature00786. [DOI] [PubMed] [Google Scholar]
- Donoghue M., Hsieh F., Baronas E., Godbout K., Gosselin M., Stagliano N., Donovan M., Woolf B., Robison K., Jeyaseelan R. A novel angiotensin-converting enzyme-related carboxypeptidase (ACE2) converts angiotensin I to angiotensin 1–9. Circulation Research. 2000;87(5):e1–e9. doi: 10.1161/01.res.87.5.e1. [DOI] [PubMed] [Google Scholar]
- Guo H., Guo A., Wang C., Yan B., Lu H., Chen H. Expression of feline angiotensin converting enzyme 2 and its interaction with SARS-CoV S1 protein. Research in Veterinary Science. 2008;84(3):494–496. doi: 10.1016/j.rvsc.2007.05.011. [DOI] [PMC free article] [PubMed] [Google Scholar]
- Herath C.B., Warner F.J., Lubel J.S., Dean R.G., Jia Z., Lew R.A., Smith A.I., Burrell L.M., Angus P.W. Upregulation of hepatic angiotensin-converting enzyme 2 (ACE2) and angiotensin-(1–7) levels in experimental biliary fibrosis. Journal of Hepatology. 2007;47(3):387–395. doi: 10.1016/j.jhep.2007.03.008. [DOI] [PMC free article] [PubMed] [Google Scholar]
- Huang M., Li X., Meng Y., Xiao B., Ma Q., Ying S., Wu P., Zhang Z. Upregulation of angiotensin-converting enzyme (ACE) 2 in hepatic fibrosis by ACE inhibitors. Clinical and Experimental Pharmacology and Physiology. 2010;37(1):e1–e6. doi: 10.1111/j.1440-1681.2009.05302.x. [DOI] [PubMed] [Google Scholar]
- Huang Q., Xie Q., Shi C.C., Xiang X.G., Lin L.Y., Gong B.D., Zhao G.D., Wang H., Jia N.N. Expression of angiotensin-converting enzyme 2 in CCL4-induced rat liver fibrosis. International Journal of Molecular Medicine. 2009;23(6):717–723. doi: 10.3892/ijmm_00000185. [DOI] [PubMed] [Google Scholar]
- Imai Y., Kuba K., Rao S., Huan Y., Guo F., Guan B., Yang P., Sarao R., Wada T., Leong-Poi H. Angiotensin-converting enzyme 2 protects from severe acute lung failure. Nature. 2005;436(7047):112–116. doi: 10.1038/nature03712. [DOI] [PMC free article] [PubMed] [Google Scholar]
- Jonsson J.R., Clouston A.D., Ando Y., Kelemen L.I., Horn M.J., Adamson M.D., Purdie D.M., Powell E.E. Angiotensin-converting enzyme inhibition attenuates the progression of rat hepatic fibrosis. Gastroenterology. 2001;121(1):148–155. doi: 10.1053/gast.2001.25480. [DOI] [PubMed] [Google Scholar]
- Kanno K., Tazuma S., Chayama K. AT1A-deficient mice show less severe progression of liver fibrosis induced by CCl4. Biochemical and Biophysical Research Communications. 2003;308(1):177–183. doi: 10.1016/s0006-291x(03)01357-3. [DOI] [PubMed] [Google Scholar]
- Kobayashi K., Imanishi T., Akasaka T. Endothelial progenitor cell differentiation and senescence in an angiotensin II-infusion rat model. Hypertension Research. 2006;29(6):449–455. doi: 10.1291/hypres.29.449. [DOI] [PubMed] [Google Scholar]
- Lee H.S., Kim H.H., Ku S.K. Hepatoprotective effects of Artemisiae capillaris herba and Picrorrhiza rhizoma combinations on carbon tetrachloride-induced subacute liver damage in rats. Nutrition Research. 2008;28(4):270–277. doi: 10.1016/j.nutres.2008.02.001. [DOI] [PubMed] [Google Scholar]
- Li W., Moore M.J., Vasilieva N., Sui J., Wong S.K., Berne M.A., Somasundaran M., Sullivan J.L., Luzuriaga K., Greenough T.C. Angiotensin-converting enzyme 2 is a functional receptor for the SARS coronavirus. Nature. 2003;426(6965):450–454. doi: 10.1038/nature02145. [DOI] [PMC free article] [PubMed] [Google Scholar]
- Nabeshima Y., Tazuma S., Kanno K., Hyogo H., Iwai M., Horiuchi M., Chayama K. Anti-fibrogenic function of angiotensin II type 2 receptor in CCl4-induced liver fibrosis. Biochemical and Biophysical Research Communications. 2006;346(3):658–664. doi: 10.1016/j.bbrc.2006.05.183. [DOI] [PubMed] [Google Scholar]
- Oesterreicher C.H., Taura K., De Minicis S., Seki E., Penz-Oesterreicher M., Kodama Y., Kluwe J., Schuster M., Oudit G.Y., Penninger J.A., Brenner D.A. Angiotensin-converting-enzyme 2 inhibits liver fibrosis in mice. Hepatology. 2009;50(3):929–938. doi: 10.1002/hep.23104. [DOI] [PMC free article] [PubMed] [Google Scholar]
- Ohishi T., Saito H., Tsusaka K., Toda K., Inagaki H., Hamada Y., Kumagai N., Atsukawa K., Ishii H. Anti-fibrogenic effect of an angiotensin converting enzyme inhibitor on chronic carbon tetrachloride-induced hepatic fibrosis in rats. Hepatology Research. 2001;21(2):147–158. doi: 10.1016/s1386-6346(01)00102-4. [DOI] [PubMed] [Google Scholar]
- Paizis G., Cooper M.E., Schembri J.M., Tikellis C., Burrell L.M., Angus P.W. Up-regulation of components of the renin-angiotensin system in the bile duct-ligated rat liver. Gastroenterology. 2002;123(5):1667–1676. doi: 10.1053/gast.2002.36561. [DOI] [PubMed] [Google Scholar]
- Paizis G., Tikellis C., Cooper M.E., Schembri J.M., Lew R.A., Smith A.I., Shaw T., Warner F.J., Zuilli A., Burrell L.M. Chronic liver injury in rats and humans upregulates the novel enzyme angiotensin converting enzyme 2. Gut. 2005;54(12):1790–1796. doi: 10.1136/gut.2004.062398. [DOI] [PMC free article] [PubMed] [Google Scholar]
- Pereira R.M., dos Santos R.A.S., Teixeira M.M., Leite V.H.R., Costa L.P., da Costa Dias F.L., Barcelos L.S., Collares G.B., Simões e Silva A.C. The renin–angiotensin system in a rat model of hepatic fibrosis: evidence for a protective role of angiotensin-(1–7) Journal of Hepatology. 2007;46(4):674–681. doi: 10.1016/j.jhep.2006.10.018. [DOI] [PubMed] [Google Scholar]
- Rice G.I., Thomas D.A., Grant P.J., Turner A.J., Hooper N.M. Evaluation of angiotensin-converting enzyme (ACE), its homologue ACE2 and neprilysin in angiotensin peptide metabolism. Biochemical Journal. 2004;383(Pt. 1):45–51. doi: 10.1042/BJ20040634. [DOI] [PMC free article] [PubMed] [Google Scholar]
- Santos R.A.S., Ferreira A.J., Simões e Silva A.C. Recent advances in the angiotensin-converting enzyme 2-angiotensin (1–7)-Mas axis. Experimental Physiology. 2008;93(5):519–527. doi: 10.1113/expphysiol.2008.042002. [DOI] [PubMed] [Google Scholar]
- Slater T. Free radicals and tissue injury: fact and fiction. The British Journal of Cancer. Supplement. 1987;8:5–10. [PMC free article] [PubMed] [Google Scholar]
- Terui Y., Saito T., Watanabe H., Togashi H., Kawata S., Kamada Y., Sakuta S. Effect of angiotensin receptor antagonist on liver fibrosis in early stages of chronic hepatitis C. Hepatology. 2002;36(4):1022. doi: 10.1053/jhep.2002.32679. [DOI] [PubMed] [Google Scholar]
- Tikellis C., Johnston C.I., Forbes J.M., Burns W.C., Burrell L.M., Risvanis J., Cooper M.E. Characterization of renal angiotensin-converting enzyme 2 in diabetic nephropathy. Hypertension. 2003;41(3):392–397. doi: 10.1161/01.HYP.0000060689.38912.CB. [DOI] [PubMed] [Google Scholar]
- Tipnis S.R., Hooper N.M., Hyde R., Karran E., Christie G., Turner A.J. A human homolog of angiotensin-converting enzyme. Journal of Biological Chemistry. 2000;275(43):33238–33243. doi: 10.1074/jbc.M002615200. [DOI] [PubMed] [Google Scholar]
- Wei H.S., Lu H.M., Li D.G., Zhan Y.T., Wang Z.R., Huang X., Cheng J.L., Xu Q.F. The regulatory role of AT 1 receptor on activated HSCs in hepatic fibrogenesis: effects of RAS inhibitors on hepatic fibrosis induced by CCl∼ 4. World Journal of Gastroenterology. 2000;6(6):824–828. doi: 10.3748/wjg.v6.i6.824. [DOI] [PMC free article] [PubMed] [Google Scholar]
- Yang L., Bataller R., Dulyx J., Coffman T.M., Ginès P., Rippe R.A., Brenner D.A. Attenuated hepatic inflammation and fibrosis in angiotensin type 1a receptor deficient mice. Journal of Hepatology. 2005;43(2):317–323. doi: 10.1016/j.jhep.2005.02.034. [DOI] [PubMed] [Google Scholar]
- Yoshiji H., Kuriyama S., Yoshii J., Ikenaka Y., Noguchi R., Nakatani T., Tsujinoue H., Fukui H. Angiotensin II type 1 receptor interaction is a major regulator for liver fibrosis development in rats. Hepatology. 2001;34(4):745–750. doi: 10.1053/jhep.2001.28231. [DOI] [PubMed] [Google Scholar]
- Yoshiji H., Kuriyama S., Yoshii J., Ikenaka Y., Noguchi R., Yanase K., Namisaki T., Yamazaki M., Tsujinoue H., Imazu H. Angiotensin II induces the tissue inhibitor of metalloproteinases-1 through the protein kinase-C signaling pathway in rat liver fibrosis development. Hepatology Research. 2003;27(1):51–56. doi: 10.1016/s1386-6346(03)00160-8. [DOI] [PubMed] [Google Scholar]
- Zangar R.C., Benson J.M., Burnett V.L., Springer D.L. Cytochrome P450 2E1 is the primary enzyme responsible for low-dose carbon tetrachloride metabolism in human liver microsomes. Chemico-Biological Interactions. 2000;125(3):233–243. doi: 10.1016/s0009-2797(00)00149-6. [DOI] [PubMed] [Google Scholar]