

Abstract
Angiotensin converting enzyme 2 (ACE2) is a component of the renin–angiotensin system (RAS) which converts Ang II, a potent vasoconstrictor peptide into Ang 1–7, a vasodilator peptide which may act as a negative feedback hormone to the actions of Ang II. The discovery of this enzyme added a new level of complexity to this system. The mesangial cells (MC) have multiple functions in glomerular physiology and pathophysiology and are able to express all components of the RAS. Despite of being localized in these cells, ACE2 has not yet been purified or characterized. In this study ACE2 from mice immortalized MC (IMC) was purified by ion-exchange chromatography. The purified enzyme was identified as a single band around 60–70 kDa on SDS-polyacrylamide gel and by Western blotting using a specific antibody. The optima pH and chloride concentrations were 7.5 and 200 mM, respectively. The N-terminal sequence was homologous with many species ACE2 N-terminal sequences as described in the literature. ACE2 purified from IMC was able to hydrolyze Ang II into Ang 1–7 and the Km value for Ang II was determined to be 2.87 ± 0.76 μM. In conclusion, we purified and localized, for the first time, ACE2 in MC, which was able to generate Ang 1–7 from Ang II. Ang 1–7 production associated to Ang II degradation by ACE2 may exert a protective effect in the renal hemodynamic.
Keywords: ACE2, Mesangial cells, Renin–angiotensin system
1. Introduction
Angiotensin converting enzyme 2 (ACE2) is a zinc metalloprotease described by two different groups in 2000 which shares homology with angiotensin converting enzyme (ACE) in its catalytic domain and provides different key functions in the renin–angiotensin system (RAS) [1], [2]. In 2003 it was shown to serve as a receptor for the Severe Acute Respiratory Syndrome (SARS) coronavirus [3].
ACE2 contains a single HEXXH zinc-binding motif and is able to hydrolyze angiotensin I (Ang I) to produce angiotensin (1–9) [1] and also has a greater high affinity for angiotensin II (Ang II) to generate angiotensin (1–7) (Ang I–7) [4], [5]. The specificity is not limited to peptides belonging to the RAS and can also act on several peptides from other systems such as neurotensin 1–13, apelin 13, dynorphin 1–13 and some of the kinin metabolites, but not on bradykinin [4].
This enzyme added more complexity to the RAS which is known to be involved on cardiovascular and renal homeostasis through the control of blood pressure, body fluid homeostasis and other cardiovascular functions, counter-regulating Ang II-induced effects [6]. Ang 1–7 may act as a negative feedback hormone to the actions of Ang II being cardio and renoprotective [7]. Most tissues, including kidney, heart, and testis express a local RAS that acts independently of the circulating one [1], [2], [6], [8], [9].
The mesangial cells (MC) are able to express the protein and mRNA for all the components of the RAS, for example, renin, angiotensinogen, ACE [10], [11], [12], [13] and have multiple functions in the glomerular physiology and pathophysiology. Studies in rat kidney have shown the presence of ACE2 in renal tubules and glomeruli [14], [15], [16], suggesting the possible existence of the enzyme in MC.
In contrast to the growing availability of data on the enzyme kinetics and possible physiological roles of ACE2, comparatively little is known about ACE2 at the cellular level.
Since cultured MC provide a convenient model for the study of renal synthesis and release of bioactive products, which could act as autocrine, intacrine and/or paracrine mediators [17], [18], [19], this cell line can be introduced as a suitable in vitro model in order to improve the knowledge of events related to regulation of the renal ACE2 levels and to further elucidate its role(s) in vivo as a target of treatment for kidney diseases.
The aim of this study was to evaluate the existence of ACE2 in mice immortalized mesangial cells (IMC) and then, to isolate, purify, characterize and localize this enzyme.
2. Materials and methods
This study was approved by the Ethics Committee of the Federal University of São Paulo (UNIFESP), São Paulo, Brazil.
2.1. Immortalized mesangial cells culture (IMC)
IMC from mice were purchased from The American Type of Culture Collection (ATCC: CRL-1927). Cells were plated onto DMEM/F12 (3:1) (Gibco, USA) supplemented with 5% fetal bovine serum (FBS), 5000 U/L penicillin and 50 mg/L streptomycin. Before the experiments, the IMC were incubated with DEMEN/F12 without FBS for 20 h [20]. The culture flasks were rinsed twice with 5 mL of 25 mM Tris–HCl buffer pH 8.0 containing 20 mM pepstatin and 10 mM PMSF, protease inhibitors, to eliminate all serum residues and scraped with 2 mL of the same buffer at 4 °C. The cells from 40 culture plates were collected, sonicated and centrifuged at 3000 rpm for 10 min. The supernatant constituting the cell lysate was dialyzed and concentrated 100 fold against 25 mM Tris–HCl buffer containing 10 μM ZnCl2, 20 mM pepstatin and 10 mM PMSF pH 8.0 at 4 °C using Amicon Ultra (Millipore, USA) with a 30 kDa pore membrane. The aliquots were fractioned and stored at −20 °C.
2.2. Purification of ACE2 from IMC
Concentrated samples were purified on a Fast Liquid Protein Chromatography system (FPLC, Amersham Pharmacia Biotech, USA) using 1 mL Resource-Q ion exchange column (Amersham Pharmacia Biotech, USA) equilibrated with 25 mM Tris–HCl buffer pH 8.0, containing 10 μM ZnCl2 (buffer A). The enzyme was eluted with 25 mM Tris–HCl buffer pH 8.0, containing 1 M NaCl, 10 μM ZnCl2 (buffer B) using a linear gradient of 0–100% buffer B. Fractions (0.5 mL) were collected at a flow rate of 0.5 mL/min. The optical density of each fraction was quantified at 280 nm and ACE2 activity was determined using fluorogenic substrate.
2.3. Protein determination
Protein concentration was determined by Bradford Method [21] using bovine albumin as standard (Bio-Rad Protein Assay Kit, Bio-Rad Laboratories, USA) except when absorbance at 280 nm was used for the chromatographic elution profile.
2.4. Enzymatic activity assay
ACE2 catalytic activity was measured fluorometrically using Abz-Ser-Pro-Tyr(NO2)-OH (Abz-SPY(NO2)) as substrate (Peptides International, USA). An aliquot of purified enzyme was incubated in 1 mL of 100 mM Tris–HCl buffer pH 7.5, containing 10 μM ZnCl2, 0.5 μM captopril (ACE inhibitor), 50 nM thiorphan (Neprilysin inhibitor) and 10 μM of fluorogenic substrate at 37 °C for 4 h. ACE and Neprilysin inhibitors were used to avoid unspecific substrate cleavage in chromatographic fractions. The fluorescence was measured using F-2000 Fluorescent Spectrophotometer (Hitachi, Japan) with an excitation of 320 nm and an emission of 420 nm.
2.5. Characterization of purified ACE2
2.5.1. Specificity ACE2 assay
The enzyme was pre-incubated with 1 μM, 10 μM and 100 μM of DX600 (Phoenix Pharmaceutical, USA) for 30 min at 37 °C, then incubated with the fluorogenic substrate for ACE2 as described above.
2.5.2. pH profile of purified ACE2
The activity of purified ACE2 at different pH values was measured at 37 °C and incubation with Abz-SPY(NO2) as mentioned. The following buffers were used: 125 mM sodium acetate (4.0 > pH > 5.5), 125 mM sodium phosphate (5.5 > pH > 8.0), 125 mM Tris–HCl (8.0 > pH > 8.5) and 125 mM glycine (pH < 9.0).
2.5.3. Effect of Cl− on purified ACE2 activity
The effect of Cl− on purified ACE2 was determined in 100 mM Tris–HCl buffer pH 7.5 with NaCl concentration ranging from 50 mM to 1500 mM. ACE2 activity was determined as mentioned above.
2.5.4. Effect of temperature on purified ACE2 activity
In order to analyze the influence of temperature on ACE2 activity, the enzyme was pre-incubated by itself for 30 min at 4 °C, 37 °C and 56 °C before the addition of the buffer and the fluorogenic substrate. ACE2 activity was measured as mentioned above.
2.5.5. SDS-PAGE and Western blotting analysis
Proteins were analyzed by sodium duodecil sulfate-polyacrylamide gel (7.5%) electrophoresis (SDS-PAGE) under reducing condition [22]. Electrophoretic transfer was performed for 1 h under constant voltage (45 V), using a transfer nitrocellulose membrane (Millipore, USA) and transfer buffer (15 mmol/L Tris, 190 mmol/L glycine, and 0.1% SDS). The membrane was incubated in 0.1 mol/L TBS containing 3 mg/mL bovine albumin for 1 h before overnight incubation with anti-ACE2 polyclonal antibody (H-175, Santa Cruz Biotechnology, USA) (1:500 dilution). Subsequent steps were performed using the streptavidin/phosphatase alkaline system (Amershan Pharmacia Biosciences, USA) and the protein bands were developed using BCIP/NBT as substrate (Bio-Rad Laboratories, USA) as recommended by the manufacturer. Full Range Rainbow (Amersham Biosciences, USA) was used as protein molecular weight marker. Image analysis was performed using GS-710 Callibrated Imaging Densitometer (Bio-Rad Laboratories, USA).
2.5.6. Amino-terminal sequence of purified ACE2
After SDS-PAGE, proteins were electroblotted to a PVDF protein sequencing membrane (Bio-Rad Laboratories, USA) using a 100 mM CAPS buffer, pH 11.0. Membrane was stained with 2% Ponceau-S in 1% acetic acid targeting the protein localization. ACE2 band was excised from the membrane and submitted to N-terminal amino acid sequencing on a PPSQ-23 Automated Protein Sequencer (Shimadzu Corporation, Japan). The sequencing was generously performed by Dr Isaura Yoshico Hirata, from the Biophysics Division, UNIFESP, Brazil.
2.5.7. Identification of peptide bond in Ang II hydrolyzed by purified ACE2
The product derived from Ang II after hydrolysis by purified ACE2 were separated by HPLC with UV detection and compared with standard peptides. Ang II (10 nmol) was incubated for 24 h with purified enzyme in 10 mM Hepes buffer, pH 7.4 containing 125 mM NaCl and 10 μM ZnCl2 10 μM pepstatin, 20 μM PMSF, 1 μM captopril and 50 nM Thiorphan. Aliquots were taken at 0 and 24 h of incubation. The hydrolysis products were analyzed by reverse-phase HPLC using an Aquapore ODS 300 column, 7 μm, equilibrated with 0.1% phosphoric acid containing 5% acetonitrile (v/v). Peptides were separated by isocratic elution for 5 min followed by 20 min of linear gradient of 5–35% (v/v) acetonitrile in 0.1% phosphoric acid at 1.5 mL/min. Reaction products were detected by absorbance at 214 nm. Peptide fragments were identified by elution position and quantified by integration area.
2.5.8. Kinetics parameters
The Michaelis–Menten constant (K m) was determined for purified ACE2 using variable concentration of Ang II as substrate (0.5–13 μM) at 37 °C, in 10 mM Hepes buffer, pH 7.4 containing 125 mM NaCl, 10 μM ZnCl2, 1 μM captopril and 50 nM thiorphan. The product of hydrolysis of the Ang II by ACE2 was analyzed by reverse-phase HPLC. K m value was determined by Lineweaver–Burk equation and data were analyzed using the computer software GraphPad Prism version 4.0 for Windows (Graphpad Software, USA).
2.6. Immunofluorescence
IMC were grown on sterilized coverslips, fixed by incubation in 2% paraformaldehyde in phosphate-buffer saline (PBS) and permeabilized in PBS with 0.2% gelatin. Fixed cells were incubated for 4 h with polyclonal antibody (C18 – Santa Cruz Biotechnologies, USA) (1:10 dilution). The subsequent steps were carried out with 1 h incubation of FITC anti-goat (Sigma, USA) (1:100 dilution) and 4′,6-diamidino-2-phenylindole (DAPI, Sigma, USA). Results were analyzed by confocal laser microscopy (Bio-Rad 1024-UV, USA).
3. Results
3.1. Purification of ACE2 from IMC
The concentrated supernatant (100 μL), with ACE2 activity of 43.3 nM/mL/min and specific activity of 7.41 nM/mg was applied to an ion-exchange column equilibrated with 25 mM Tris–HCl buffer, pH 8,0, containing 10 μM ZnCl2. ACE2 enzymatic activity was eluted as one peak with specific activity of 40.3 nM/mg and was purified 5.4 fold (Fig. 1 and Table 1 ).
Fig. 1.
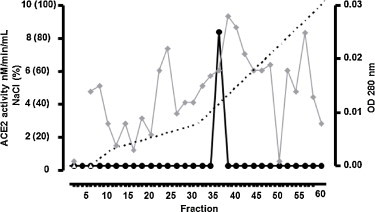
Ion-exchange chromatography using Resource-Q column of concentrated cell lysate from IMC. ACE2 was eluted in one peak (P1) with enzymatic activity using Abz-SPY(NO2) as substrate. Fractions (0.5 mL) were collected at a flow rate of 0.5 m/min with a linear gradient (0–100% NaCl 1 M). ( ) OD 280 nm (–●–) ACE2 activity (-----) % NaCl.
Table 1.
Purification of angiotensin-converting enzyme2 (ACE2) from immortalized mesangial cells using Abz-SPY(NO2) as substrate.
| Step | Volume (mL) | Protein (mg/mL) | Total | Enzymatic activity (nM/min/mL) | Specific activity (nM/mg) | Purification (X) | Recovery (%) |
|---|---|---|---|---|---|---|---|
| Cell lysate | 0.1 | 5.84 | 0.584 | 43.3 | 7.41 | 1 | 100 |
| Resource Q | 2.5 | 0.03 | 0.075 | 1.21 | 40.33 | 5.44 | 12.84 |
3.2. Purified ACE2 characterization
3.2.1. Optimum pH
Using the Abz-SPY(NO2) as substrate and buffers at pH ranging from 4.0 to 9.0, the optimum pH value determined for the activity of ACE2 enzyme was 7.5 (Fig. 2A).
Fig. 2.
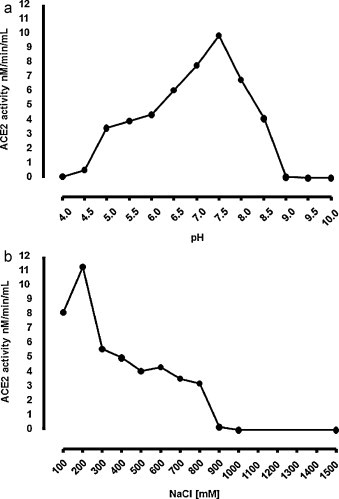
(A) pH profiles of ACE. The optimal pH ACE activity was assayed using Abz-SPY(NO2) as substrate in buffers with pH ranging from 4.0 at 9.0. (B) Effect of NaCl on the activity ACE2. The influence of Cl− on ACE2 activity was determined using Abz-SPY(NO2) as substrate in buffer with NaCl concentrations ranging from 50 to 1500 mM.
3.2.2. Effects of Cl−, temperature and DX600 on ACE2 activity
The concentration of Cl− required for maximal activation of ACE2 was 200 mM (Fig. 2B) and the enzymatic stability was maintained between 4 °C and 37 °C when the enzyme was pre-incubated at different temperatures. ACE2 enzymatic activity was completely inhibited by 1 μM, 10 μM and 100 μM DX600, described as a specific ACE2 inhibitor.
3.2.3. SDS-PAGE and Western blotting
The molecular mass determined by SDS-PAGE for purified ACE2 from IMC was around 60–70 kDa. The homogeneity of ACE2 analyzed under dissociation conditions (Fig. 3A). The molecular mass was confirmed by Western blotting using anti-ACE2 antibody (Fig. 3B).
Fig. 3.
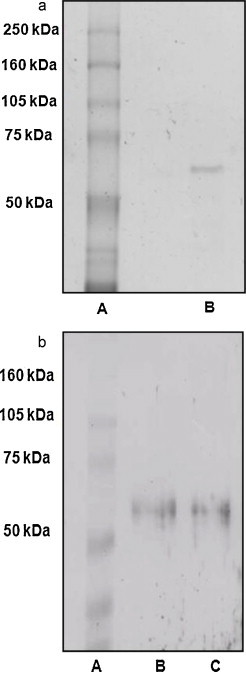
(A) SDS-PAGE (7.5%) of reduced purified ACE2. Lane A: molecular mass marker; lane B: purified material. Protein was stained with the Bio-Rad Silver reagent (Bio-Rad, USA). (B) Western blotting of purified ACE2. Proteins were separated by SDS/PAGE (7.5% gel), transferred to a nitrocellulose membrane and revealed with anti-ACE2 antibody. Lane A: molecular mass marker; lanes B and C: purified material.
3.2.4. Identification of peptide bond in AII hydrolyzed by purified ACE2
The enzymatic activity of purified ACE2 was analyzed using the preferred substrate Ang II. The purified ACE2 was able to hydrolyze Ang II into Ang 1–7 (Fig. 4A and B).
Fig. 4.
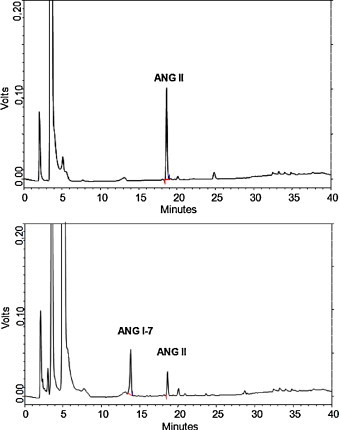
Identification of peptide bond in ANG II hydrolyzed by purified ACE2. The conditions for reverse-phase HPLC are given in Section 2. (A) Zero time of incubation of ACE2 with ANG II. (B) After 24 h of incubation of ACE2 with ANG II resulting in ANG 1–7 generation.
3.2.5. Amino-terminal sequence of purified ACE2
The N-terminal sequence of purified ACE2 determined by Edman degradation is shown in Table 2 . A single sequence was obtained for the enzyme, and it is homologous with the N-terminal sequence of Homo sapiens, Mus musculus, Equus caballus, Macaca mulatta, Cercopithius aethrops and Rattus norvegicus ACE2.
Table 2.
Amino-terminal sequence of ACE2. Alignment with amino-terminal sequences from human, mouse, horse, monkey and rat ACE2.
| Description | Sequence |
|---|---|
| ACE2 from IMC | SWLLLS |
| ACE2 Equus caballus | SWLLLS |
| ACE2 Mus musculus | SWLLLS |
| ACE2 Homo sapiens | SWLLLS |
| ACE2 Macaca mulatta | SWLLLS |
| ACE2 Cercopithecus aethiops | SWLLLS |
| ACE2 Rattus norvegicus | SWLLLS |
3.2.6. Kinetics parameters
The K m of purified ACE2 was determined by constructing a Lineweaver–Burk plot (1/substrate versus 1/velocity) using Ang II as substrate. The K m value was 2.87 ± 0.76 μM (Fig. 5 ).
Fig. 5.
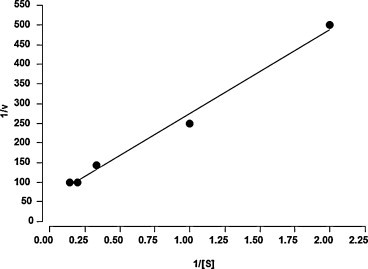
Lineweaver–Burk plot for ACE2 activitu using ANG II as substrate. ANG II concentrations were expressed in μM. Velocity was expressed as μM/min.
3.3. Localization of ACE2 on IMC
To localize ACE2 in IMC these cells were grown to confluence and probed with a specific ACE2 antibody. Results of confocal microscopy are shown in Fig. 6A–C. The nucleus of IMC was localized with DAPI used as control (Fig. 6B). Under these conditions the localization of ACE2 in IMC was mostly on the nuclei nevertheless on the cytoplasm with low intensity (Fig. 6C).
Fig. 6.
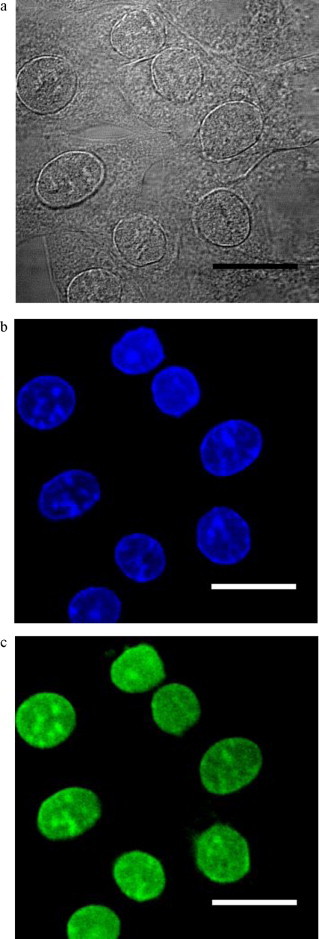
Confocal fluorescence microscopy of the ACE2 localization in mice IMC. (A) Immortalized mesangial cells (DIC image). (B) Nuclei labeling with DAPI. (C) Localization of ACE2 in immortalized mesangial cells using anti-ACE2 polyclonal antibody. Original magnification 40×. Bar: 10 μm.
4. Discussion
ACE2, a zinc metalloprotease, was described as a new member of RAS [1], [2]. The pathophysiological role of this enzyme remains to be determined, but its localization in the heart and kidney, and several other tissues, suggests a crucial role for ACE2 in cardiovascular and renal disease [23]. In mice kidney, ACE2 expression was identified in cortical tubules [24] and apical borders of the proximal convoluted tubules. Ye and collaborators described that ACE and ACE2 are strongly co-localized on the apical surface of the proximal tubules and are expressed in podocytes and in parietal epithelial cells of the Bowman's capsule. ACE2 was also co-localized with smooth muscle actin which may indicates its presence in MC. Tikellis and collaborators showed ACE2 mRNA in the kidney and localized to both tubules and glomeruli. The moderated expression of ACE2 in the glomeruli was confirmed by immunohistochemistry [16].
In the present study, we demonstrated for the first time the presence of ACE2 in MC. The enzyme was purified 5.4 fold from murine immortalized MC lysate, presenting a specific activity of 43.3 nM/mg (Fig. 1 and Table 1). The purified enzyme presented a specific activity of 40.3, was identified as a single band on SDS-polyacrylamide gel (Fig. 3A) and by Western blotting using a specific antibody (Fig. 3B), confirming a molecular mass around 60–70 kDa and the homogeneity of the enzyme. ACE2 from IMC was inhibited by DX600, a specific ACE2 inhibitor.
In the literature, ACE2 isoforms were described with molecular mass ranging between 70 and 130 kDa. Donoghue and collaborators were able to express a 90 kDa recombinant ACE2 in the extracellular medium and cellular lysate using transfected CHO cells [1]. The same molecular mass was described for the enzymes identified in rat and mouse tissues [1], [14]. However, ACE2 expressed in mammal cells has a molecular mass of 120 kDa reduced to 85 kDa after enzymatic deglycosylation [2]. Other study also described ACE2 isoform with molecular masses ranging from 120 to 130 kDa in rat kidney [16]. The authors suggest that these differences could be explained by post-transductional modifications. An ACE2 presenting a molecular mass similar to the enzyme described in this study, 70 kDa, was purified from astrocyte cell culture, and was able to convert Ang II into Ang 1–7, suggesting that this protein is a secreted form of the enzyme [25]. Therefore, the lower molecular mass of purified ACE2 described by this study may be explained by deglycosylation process or this enzyme could be a secreted ACE2 isoform.
The effect of Cl− on Abz-SPY(NO2) hydrolysis by ACE2 was higher at a concentration of 200 mM of NaCl (Fig. 2B) and an optimum pH of 7.5 (Fig. 2A). The enzyme activity was completely inhibited by Cl− at concentrations ranging from 1 M to 1.5 M, differing from the data described by Yan collaborators that showed maximal enzymatic activity at 1.5 M NaCl at pH 7.5 for purified ACE2 from transfected SF21 cells [26] and also from Vickers and collaborators that reported an optimum activity for recombinant ACE2 from SF9 cells in the presence of 1 M NaCl at pH 6.5 [4]. Guy and collaborators showed maximal activity at pH 7.0 in the presence of 300 mM NaCl [27]. ACE2 has conserved both chloride ligands essential for its activity similar to ACE [28], suggesting that on other loci, such as renal tubular brush borders, is exposed to large ion fluxes and may be regulated in a such manner. The result revealed that the purified ACE2 from mouse mesangial cells had totally different NaCl dependent catalytic properties, but still has hydrolysis activity to Ang II, which means the purified product has ACE2 activity. We believe the purity of this enzyme could be a reason for different properties revealed in this study.
The amino-terminal sequencing studies showed that purified ACE2 was similar to the sequence of H. sapiens, M. musculus, E. caballus, M. mulatta, C. aethrops and R. norvegicus, supporting the identity of the enzyme (Table 2).
In this study ACE2 was localized mainly in the nuclei from IMC and poorly distributed on the cytoplasm (Fig. 6). Camargo de Andrade and collaborators [13] showed the co-localization of ACE, Ang II and Ang 1–7 inside the cell nuclei of rat MC. The nuclear presence of Ang II, the main substrate of ACE2 and the product of Ang II hydrolysis by this enzyme, Ang 1–7, can support our results. Moreover, it has already been demonstrated by immunofluorescence staining that ACE2 is localized within glomerular structures of mouse kidney, supporting the idea that the renal system contains an endogenous system for angiotensin peptide production [15].
Rice and collaborators compared the kinetics of hydrolysis of Ang I and Ang II by ACE2, showing a high catalytic efficiency of Ang II hydrolyzed by ACE2 when compared to Ang I hydrolysis by this enzyme. The peptides angiotensin 1–9, Ang 1–7 and angiotensin 1–5, were poorly hydrolyzed or not hydrolyzed at all by ACE2 [5].
In this study, the purified ACE2 was able to convert Ang II into Ang 1–7 (Fig. 4A and B) (K m = 2.87 ± 0.76 μM, Fig. 5), suggesting that ACE2 prevents Ang II accumulation in the glomeruli, by regulating the degradation of angiotensin peptides and supporting the concept that ACE2 acts in a conter-regulatory manner to ACE and may play an important role to modulate the balance between vasoconstrictors and vasodilators in the kidney.
Recently, Oudit and collaborators demonstrated a reduction of mesangial matrix expansion when diabetic model mice were treated with human recombinant ACE2. In the same study, the treatment of primary rat MC culture with hrACE2 attenuated high glucose and Ang II induced NADPH activity [29]. Taken together, these data support the hypothesis that the protective effect of ACE2 is mediated, at least in part, by a reduction in Ang II and an increase in Ang 1–7.
Other study demonstrated an opposite effect of Ang 1–7 in diabetic kidney disease [30] and a possible stimulation of cell growth pathways in MC caused by this vasodilator peptide was suggested by Dilauro and Burns [31].
The identification of ACE2 in this study, clearly demonstrate that MC express ACE2, and that it could be responsible for Ang 1–7 production, since this peptide was detected in the same cells by immunofluorescence analysis [13]. Although ACE2 may convert Ang II to Ang 1–7 in MC, the relative contribution of ACE2 to total Ang 1–7 formation and function remains unclear. There is agreement that angiotensins like Ang II and Ang 1–7 exerts substantial direct effects on the renal microvasculature and glomerular mesangium. The identification and characterization of ACE2 in MC could be helpful to elucidate the mechanisms related to the regulation of the levels of angiotensin peptides in these cells and the production of ACE2 could prevent the local exposure to high levels of Ang II, and therefore, exert a renoprotective effect.
Acknowledgments
We are grateful to Zaira Palomino Jara who helped in the HPLC analysis. We also acknowledges the financial support from the Fundação de Amparo à Pesquisa do Estado de São Paulo (FAPESP, 05-57543-0).
References
- 1.Donoghue M., Hsieh F., Baronas E., Godbout K., Gosselin M., Stagliano N., Donovan M., Woolf B., Robison K., Jeyaseelan R., Breitbart R.E., Acton S. Circ. Res. 2000;87:E1–E9. doi: 10.1161/01.res.87.5.e1. [DOI] [PubMed] [Google Scholar]
- 2.Tipnis S.R., Hooper N.M., Hyde R., Karran E., Christie G., Turner A.J. J. Biol. Chem. 2000;275:33238–33243. doi: 10.1074/jbc.M002615200. [DOI] [PubMed] [Google Scholar]
- 3.Li W., Moore M.J., Vasilieva N., Sui J., Wong S.K., Berne M.A., Somasundaran M., Sullivan J.L., Luzuriaga K., Greenough T.C., Choe H., Farzan M. Nature. 2003;426:450–454. doi: 10.1038/nature02145. [DOI] [PMC free article] [PubMed] [Google Scholar]
- 4.Vickers C., Hales P., Kaushik V., Dick L., Gavin J., Tang J., Godbout K., Parsons T., Baronas E., Hsieh F., Acton S., Patane M., Nichols A., Tummino P. J. Biol. Chem. 2002;277:14838–14843. doi: 10.1074/jbc.M200581200. [DOI] [PubMed] [Google Scholar]
- 5.Rice G.I., Thomas D.A., Grant P.J., Turner A.J., Hooper N.M. Biochem. J. 2004;383:45–51. doi: 10.1042/BJ20040634. [DOI] [PMC free article] [PubMed] [Google Scholar]
- 6.Der Sarkissian S., Huentelman M.J., Stewart J., Katovich M.J., Raizada M.K. Prog. Biophys. Mol. Biol. 2006;91:163–198. doi: 10.1016/j.pbiomolbio.2005.05.011. [DOI] [PubMed] [Google Scholar]
- 7.Leung P.S. JOP. 2001;2:3–8. [PubMed] [Google Scholar]
- 8.Epelman S., Tang W.H., Chen S.Y., Van Lente F., Francis G.S., Sen S. J. Am. Coll. Cardiol. 2008;52:750–754. doi: 10.1016/j.jacc.2008.02.088. [DOI] [PMC free article] [PubMed] [Google Scholar]
- 9.Burns K.D. Curr. Opin. Nephrol. Hypertens. 2007;16:116–121. doi: 10.1097/MNH.0b013e3280123c0e. [DOI] [PubMed] [Google Scholar]
- 10.Andrade A.Q., Casarini D.E., Schor N., Boim M.A. Braz. J. Med. Biol. Res. 2002;35:17–24. doi: 10.1590/s0100-879x2002000100003. [DOI] [PubMed] [Google Scholar]
- 11.Vidotti D.B., Casarini D.E., Cristovam P.C., Leite C.A., Schor N., Boim M.A. Am. J. Physiol. Renal Physiol. 2004;286:F1039–1045. doi: 10.1152/ajprenal.00371.2003. [DOI] [PubMed] [Google Scholar]
- 12.Casarini D.E., Boim M.A., Stella R.C., Krieger-Azzolini M.H., Krieger J.E., Schor N. Am. J. Physiol. 1997;272:F405–F409. doi: 10.1152/ajprenal.1997.272.3.F405. [DOI] [PubMed] [Google Scholar]
- 13.Camargo de Andrade M.C., Di Marco G.S., de Paulo Castro Teixeira V., Mortara R.A., Sabatini R.A., Pesquero J.B., Boim M.A., Carmona A.K., Schor N., Casarini D.E. Am. J. Physiol. Renal Physiol. 2006;290:F364–F375. doi: 10.1152/ajprenal.00110.2005. [DOI] [PubMed] [Google Scholar]
- 14.Li N., Zimpelmann J., Cheng K., Wilkins J.A., Burns K.D. Am. J. Physiol. Renal Physiol. 2005;288:F353–F362. doi: 10.1152/ajprenal.00144.2004. [DOI] [PubMed] [Google Scholar]
- 15.Ye M., Wysocki J., William J., Soler M.J., Cokic I., Batlle D. J. Am. Soc. Nephrol. 2006;17:3067–3075. doi: 10.1681/ASN.2006050423. [DOI] [PubMed] [Google Scholar]
- 16.Tikellis C., Johnston C.I., Forbes J.M., Burns W.C., Burrell L.M., Risvanis J., Cooper M.E. Hypertension. 2003;41:392–397. doi: 10.1161/01.HYP.0000060689.38912.CB. [DOI] [PubMed] [Google Scholar]
- 17.Mene P., Simonson M.S., Dunn M.J. Physiol. Rev. 1989;69:1347–1424. doi: 10.1152/physrev.1989.69.4.1347. [DOI] [PubMed] [Google Scholar]
- 18.Arita D.Y., Di Marco G.S., Schor N., Casarini D.E. J. Cell Biochem. 2002;87:58–64. doi: 10.1002/jcb.10277. [DOI] [PubMed] [Google Scholar]
- 19.Di Marco G.S., Vio C.P., Dos Santos O.F., Schor N., Casarini D.E. Cell Physiol. Biochem. 2007;20:919–924. doi: 10.1159/000110452. [DOI] [PubMed] [Google Scholar]
- 20.Ebihara F., Di Marco G.S., Juliano M.A., Casarini D.E. J. Renin Angiotensin Aldosterone Syst. 2003;4:228–233. doi: 10.3317/jraas.2003.037. [DOI] [PubMed] [Google Scholar]
- 21.Bradford M.M. Anal. Biochem. 1976;72:248–254. doi: 10.1016/0003-2697(76)90527-3. [DOI] [PubMed] [Google Scholar]
- 22.Laemmli U.K. Nature. 1970;227:680–685. doi: 10.1038/227680a0. [DOI] [PubMed] [Google Scholar]
- 23.Crackower M.A., Sarao R., Oudit G.Y., Yagil C., Kozieradzki I., Scanga S.E., Oliveira-dos-Santos A.J., da Costa J., Zhang L., Pei Y., Scholey J., Ferrario C.M., Manoukian A.S., Chappell M.C., Backx P.H., Yagil Y., Penninger J.M. Nature. 2002;417:822–828. doi: 10.1038/nature00786. [DOI] [PubMed] [Google Scholar]
- 24.Ye M., Wysocki J., Naaz P., Salabat M.R., LaPointe M.S., Batlle D. Hypertension. 2004;43:1120–1125. doi: 10.1161/01.HYP.0000126192.27644.76. [DOI] [PubMed] [Google Scholar]
- 25.Gallagher C.M., Diz Di P.E., Ferrario C.M., Tallant E.A. Hypertention. 2004;98 [Google Scholar]
- 26.Yan Z.H., Ren K.J., Wang Y., Chen S., Brock T.A., Rege A.A. Anal. Biochem. 2003;312:141–147. doi: 10.1016/s0003-2697(02)00461-x. [DOI] [PubMed] [Google Scholar]
- 27.Guy J.L., Jackson R.M., Acharya K.R., Sturrock E.D., Hooper N.M., Turner A.J. Biochemistry. 2003;42:13185–13192. doi: 10.1021/bi035268s. [DOI] [PubMed] [Google Scholar]
- 28.Natesh R., Schwager S.L., Sturrock E.D., Acharya K.R. Nature. 2003;421:551–554. doi: 10.1038/nature01370. [DOI] [PubMed] [Google Scholar]
- 29.Oudit G.Y., Liu G.C., Zhong J., Basu R., Chow F.L., Zhou J., Loibner H., Janzek E., Schuster M., Penninger J.M., Herzenberg A.M., Kassiri Z., Scholey J.W. Diabetes. 2009;59:529–538. doi: 10.2337/db09-1218. [DOI] [PMC free article] [PubMed] [Google Scholar]
- 30.Shao Y., He M., Zhou L., Yao T., Huang Y., Lu L.M. Acta Pharmacol. Sin. 2008;29:829–837. doi: 10.1111/j.1745-7254.2008.00812.x. [DOI] [PubMed] [Google Scholar]
- 31.Dilauro M., Burns K.D. Sci. World J. 2009;9:522–535. doi: 10.1100/tsw.2009.70. [DOI] [PMC free article] [PubMed] [Google Scholar]