

Abstract
Immunosuppression caused by bovine viral diarrhea virus (BVDV) has been associated with lymphocyte depletion, leukopenia and impairment of leukocyte function; however, no work has been done on the relationship between BVDV and regulatory T lymphocytes (Tregs). The objective of this study was to compare the mRNA expression of genes associated with Tregs (CD25, FoxP3, CTLA4, and IDO), after experimental infection of beef calves with low (LV) or high (HV) virulence BVDV. Thirty BVDV-naïve calves were randomly assigned to three groups. Calves were intra-nasally inoculated with LV (n = 10, strain SD-1) or HV (n = 10, strain 1373) BVDV or BVDV-free cell culture medium (control, n = 10). Quantitative RT-PCR was used to determine the expression of target genes in tracheo-bronchial lymph nodes and spleen on day 5 post-infection. The mRNA expression of CD25 was up-regulated in tracheo-bronchial lymph nodes of LV (P < 0.05), but not in HV compared to the control group. The expression of FoxP3 and CTLA4 was not increased in tracheo-bronchial lymph nodes of either of the BVDV-inoculated groups. A dramatic up-regulation of IDO mRNA was observed in tracheo-bronchial lymph nodes of LV (P < 0.05), but not HV compared to the control calves. In conclusion, experimental infection with BVDV did not provide evidence of Treg activation based on expression of FoxP3 and CTL4. Differential expression of CD25 and IDO mRNA on day 5 post-infection with HV or LV BVDV might reflect temporal differences in transcription occurring during the immune response elicited by these viral strains, or differences in viral infectivity of the host cells.
Keywords: Bovine viral diarrhea virus, Gene expression, Regulatory T lymphocytes, Immunosuppression
1. Introduction
Bovine viral diarrhea virus (BVDV) is an important pathogen that affects cattle industry worldwide. BVDV causes respiratory, reproductive and gastrointestinal disease [1], [2]. Most acute infections with non-cytopathic (ncp) BVDV are transient and self-limiting. However, this virus is associated with increased host susceptibility to secondary infections. It is believed that this group of viruses induces immunosuppression, and that the viral infection combined with secondary infections can result in severe polymicrobial clinical disease [1]. Immunosuppression caused by BVDV has been associated with lymphocyte depletion, leukopenia, and impairment in leukocyte function [3]. However, there has been no published work done on the relationship between BVDV and the induction of suppressor T lymphocytes.
Activated T cells (CD4+CD25+) expressing the transcription factor forkhead-box P3 (FoxP3) represent a population of immunosuppressive cells, called “T-regulatory cells (Tregs)” [4]. These cells are responsible for modulating the immune system and maintaining homeostasis by inhibiting functions of activated effector cells [5], [6]. Previous reports have indicated that Tregs function in all mammalian species so far examined, including cattle (reviewed in Garden et al. [7]).
The expression of the transcription factor FoxP3 is currently utilized as a defining marker of Tregs [8], [9], [10], [11]. However, FoxP3 negative T cells with regulatory functions also exist [12]. FoxP3 is an intranuclear protein that plays a major role in the development and function of Tregs [13]. In addition to FoxP3, functional Tregs often express the cytotoxic T-lymphocyte antigen 4 (CTLA4), a surface protein receptor associated with transmission of an inhibitory signal to T cells. CLTA-4 is capable of down regulating the adaptive immune response [4]. Moreover, CLTA4-expressing Treg cells induce the expression of the enzyme indoleamine 2,3-dioxygenase (IDO) in antigen presenting cells. This enzyme degrades tryptophan and limits immune cell activation [14]. Lack of this essential amino acid inhibits T-cell activation and promotes T-cell apoptosis [14].
Induction of CD4+CD25+ FoxP3+ Tregs is a mechanism that has been described during the infection with some viruses, such as human immunodeficiency virus (HIV), hepatitis C virus (HCV), Epstein–Barr virus (EBV), Cytomegalovirus (CMV), human T lymphotropic virus (HTLV), Vaccinia virus (VACV), hepatitis B virus (HBV), porcine reproductive respiratory syndrome virus (PRRSV), simian immunodeficiency virus (SIV), and feline immunodeficiency virus (FIV) [15]. It is believed that Tregs generally suppress the immune response or allow the virus to evade the immune response in these infections [6]. Recent studies have demonstrated induction of Tregs during the early phase of acute infection with PRRSV [16], [17], [18], [19], [20]. Moreover, the increased frequency of CD25+ FoxP3+ T cells during infection with PRRSV in pigs has been associated with an increased secretion of IL-10 and TGF-β, which have recognized immunosuppressive function and are products of induced and natural Tregs [18], [20]. The induction of these T cell subsets could explain the delay in PRRSV cell mediated immunity that is commonly observed [21] and the PRRS induced immunosuppression of infected pigs that defines the classical course of infection [6]. Therefore, an upregulation of Treg associated genes in calves infected with BVDV could indicate a role for these T cell subsets in BVDV pathogenesis.
We hypothesized that acute infection with ncp BVDV would up-regulate the mRNA expression of genes associated with Tregs in lymphoid tissues in beef calves. We also hypothesized that high virulence ncp BVDV-2 would induce a significantly stronger expression of mRNA for genes associated with Tregs during the course of infection than low virulence ncp BVDV-1. The goal of this set of assessments was to elucidate differences in gene expression in lymphoid tissue from calves infected with high or low virulence BVDV that is likely to be associated with immunosuppression and the course of clinical disease, particularly in light of characterization of mRNA expression for type 1 interferon, pro-apoptotic signals, pro-inflammatory and anti-inflammatory cytokine responses that have been already published for the same tissues [22], [23]. The objectives of this study were to: 1. Evaluate the mRNA expression of genes associated with Tregs (CD25, FoxP3, CTLA4, and IDO) in lymphoid tissues from an early acute infection with non-cytopathic (ncp) BVDV in beef calves and 2. Compare the mRNA expression of these Treg genes in lymphoid tissues during early acute infection between high (BVDV-2 strain 1373) and low (BVDV-1 strain SD-1) virulence strains of BVDV.
2. Methods
2.1. Animals
This study was performed using samples from a previous experimental trial in which a total of thirty beef calves (7 months old) were enrolled [22]. All calves were clinically normal, free of BVDV based on virus isolation from serum and immuno-histochemical staining of ear notch biopsies, and the calves were all seronegative for both BVDV-1 and BVDV-2 based on serum virus neutralization assays measured at a dilution of 1:2. Animals were obtained from a farm owned by Auburn University, located in Huntsville, AL. This farm was managed under a closed biosecurity program that did not allow for the introduction of new animals. The animals were transported from the farm of origin to the Auburn University farm (documented to have no BVDV positive animals) three days before the beginning of the study.
2.2. Experimental design and treatments
The study was designed as a randomized, controlled trial. Calves were randomly assigned by use of a random number generator (Research Randomizer, www.randomizer.org), into one of three treatment groups:
LV (n = 10): Animals challenged with a low virulence type 1a ncp BVDV (strain SD-1); HV (n = 10): Animals challenged with a high virulence type 2 ncp BVDV (strain 1373); or control (n = 10), receiving cell culture medium without BVDV.
All 30 calves were housed together at the farm (free of BVDV) prior to inoculation. As treatment groups were inoculated, they were separated and transported to the Auburn University BVDV isolation farm (located at 1.6 miles away from the original farm), with the exception of the control group, which remained at the original farm throughout the experimental period.
In addition, to avoid shedding and exchange of BVDV among the groups and to prevent accidental BVDV infection of the control group, the study was performed in three sequential rounds of inoculation and necropsy, which were spatially and temporally separated. During the first week, 10 calves assigned to the LV group were separated from the main group and transported to the BVDV-isolation unit. After inoculation, LV calves stayed on the BVDV isolation farm until day 5 post-infection. On that day, the calves were euthanized and the bodies were transported for necropsy to the Department of Pathobiology, College of Veterinary Medicine, Auburn University.
During the second week, 10 animals assigned to the control group were gathered together, loaded, and transported for approximately 5 min around the same geographic area. These calves were returned to pasture on the original farm. This transportation was performed to provide similar management conditions for all the groups. At the original farm, the 10 control calves were separated from the remaining 10 calves and maintained in a different pasture. On day 5 post-transportation and mock challenge, calves in the control group were euthanized and transported to necropsy.
During the second through the fourth week, there were no BVDV-infected calves at the BVDV isolation farm. This quiescent period allowed for viral clearance from the environment of the farm. It was our desire to prevent co-infection of the HV group (infected with 1373) with LV BVDV strain SD-1 when these calves were transported to the BVDV isolation farm. It has been reported that BVDV can survive in a cool, protected environment for several days [24]. In addition, after departure of the LV group and before arrival of the HV group, concrete floors, chutes and pens at the BVDV isolation farm were disinfected using bleach (sodium hypochlorite, NaOCl 5.25%). Finally, on the fifth week, 10 animals assigned to the HV group were collected and transported to the BVDV-isolation farm, where they were experimentally inoculated with BVDV-2 1373. On day 5 post-infection, HV calves were euthanized and the bodies transported for necropsy.
At both farms, calves in the same group (LV, HV or control) were housed together on the same pasture and allowed to eat and drink from the same feeders and water troughs. All animal protocols were reviewed and approved by the Institutional Animal Care and Use Committee (IACUC) of Auburn University.
2.3. BVDV challenge inoculation
Calves were experimentally inoculated with LV (strain SD-1) or HV (strain 1373) ncp BVDV isolates. The strain BVDV1a SD-1 was originally isolated from a persistently infected heifer [25]. The strain BVDV-2 1373 was originally isolated from a severe acute BVDV outbreak in Ontario, Canada [26]. The stock BVDV strains used in the present study were biologically cloned via successive passages in Madin–Darby bovine kidney (MDBK) cells by use of limiting dilution method with subsequent minimal propagation by incubation of the MDBK monolayer for 48 h at 37 °C under 5% CO2 to produce an adequate amount of stock virus with the desired 50% cell culture infectious dose (CCID50/mL) for characterization and animal challenge exposure studies. The virus was obtained following freeze–thaw cycles to disrupt the cells and release the viral particles. Inoculum cell culture supernatant was stored at −80 °C until the day of use. After freezing of the viral batch, an aliquot of the BVDV inoculum was titrated on Madin-Darby bovine kidney (MDBK) cells and detected using immunohistochemical detection of infected cells [22]. The titer was calculated using the Reed–Muench method to determine the final CCID50/mL for inoculation. The challenge virus was aliquoted (5 mL) into individual tubes within 1 h prior to inoculation and stored on ice until use. The inoculum used consisted of cell culture supernatants containing 1.3 × 10⁵ CCID50/mL of BVDV-1a strain SD-1 or 1.3 × 10⁵ CCID50/mL of BVDV-2 strain 1373. The virus was suspended in Dulbecco's Modified Eagle's medium (DMEM) supplemented with 10% equine serum, l-alanyl and l-glutamine. The inoculation was performed by intranasal aerosolization of 5 mL of inoculum with an aerosolizer and a vacuum pump. One additional sample of each inoculum was transported on ice to the farm and subsequently returned to the lab for immediate determination of the CCID50/mL after inoculations were complete to determine the minimal viral challenge under the procedure.
2.4. Sampling
On day 5 post challenge, animals were euthanized using a captive bolt device and the bodies were transported for necropsy. A full gross and microscopic examination was performed on all calves. Tissue samples were collected from spleen and tracheo-bronchial lymph nodes for gene assessment. Immediately after tissue collection, fresh samples were submerged in 5 mL of RNAse inhibitor1 , in order to prevent RNA degradation. The stabilized samples were stored at −80° C until processing.
2.5. Virus isolation
Virus isolation from spleen samples was performed to confirm BVDV infection in the inoculated animals. For virus isolation, 250 μL of macerated sample (approximately 3 cm2 of tissue in 3 mL of DMEM) was added to individual 25 cm2 tissue culture flasks containing a monolayer of MDBK cells. This was followed by incubation for 3 days and finally assessment of infection in 96-well plates using immune-peroxidase staining as previously described [22].
2.6. mRNA gene expression analysis
2.6.1. RNA extraction and purification
Spleen and tracheo-bronchial lymph node tissue samples (approximately 30 mg) were disrupted and homogenized in buffer containing guanidine isothiocyanate using a bullet blender2 and 1 mm glass beads. Total RNA for quantitative real time RT-PCR (qRT-PCR) was extracted and purified from spleen and tracheo-bronchial lymph node samples using an RNA extraction kit3 , according to the manufacturer's protocol. Following extraction, total RNA concentration was determined using a spectrophotometer (Nanodrop®).
2.6.2. Reverse transcription
Synthesis of cDNA was performed from 1 μg of total RNA template using a First cDNA strand reverse transcription kit4 , according to the manufacturer's protocol. After reverse transcription, final cDNA products had a concentration of approximately 2 μg/μL in a total volume of 20 μL. Synthesized cDNA was diluted 10-fold with RNase free water to reach a template concentration of approximately 200 ng/μL to be used for qRT-PCR. Four aliquots were prepared from each cDNA sample in order to avoid consecutive freezing–thawing events that could affect cDNA integrity and concentration.
2.6.3. Quantitative real time RT-PCR
Primer pairs and PCR protocol were previously optimized to identify the conditions generating a single amplicon, with a fluorescence signal showing a CT value less than 30 and a dissociation curve with the predicted melting temperature. Then, qRT-PCR was performed in 5 μL reactions to amplify the target gene sequences and determine the relative mRNA level using a ABI 7900HT real time PCR system and SYBR green DNA detection system5 . The PCR mix (5 μL) was prepared using 2.5 μL of the master mix, 0.2 μL of dd H2O and 0.15 μL of each primer in a final concentration of 1 μM. Finally, 2 μL of cDNA template (200 ng/μL) was added. The PCR reaction was conducted at 95 °C for 10 min (pre-incubation), followed by 45 cycles of 95 °C for 15 s (denaturation), 60–71 °C (primer dependent) for 10 s (annealing) and 72 °C for 10 s (extension). Upon completion of qRT-PCR amplification, melting curve analysis was performed to evaluate the specificity and quality of the amplification. Melting curve analysis was done by incubation of the qRT-PCR products for 60 s at each step with temperature gradually increasing by 0.1 °C/s from 65 to 95 °C. All samples were analyzed in triplicates to increase the accuracy of the results and the average of the runs was used to calculate the relative amount of mRNA. Non-template negative controls were concurrently run with the samples, replacing the template DNA with PCR-grade water.
2.6.4. Normalization and relative quantification of target genes
qRT-PCR procedure yielded crossing points or threshold cycle (CT) as the fundamental quantitative units, corresponding to the PCR cycle wherein the amount of DNA of the amplified gene generates a fluorescent signal significantly higher than the baseline. The CT value therefore correlates negatively to the amount of target mRNA, i.e. the greater the amount of mRNA in the sample, the sooner the threshold is reached and the lower the CT value obtained. The results of gene expression assessment were analyzed using the comparative ΔΔCt method [27]. Gene expression analysis was performed by calculating the relative quantity of the mRNA or fold expression of target genes, normalized to a housekeeping gene (18s rRNA, unaffected by the studied conditions), and compared with results from the uninfected control group [27]. Additionally, comparisons between the BVDV-challenged groups and the control group were done contrasting the differences of CT values obtained for target genes and the reference gene (▵Ct method).
The housekeeping genes glyceraldehyde-3-phosphate dehydrogenase (GAPDH) and 18S rRNA were used as endogenous reference genes. The efficiency of the qRT-PCR, was determined for each primer by creating a standard amplification curve using 500 ng, 50 ng, 5 ng, and 0.5 ng per reaction of cDNA template for each target gene.
Target genes and specific primer sequences are documented in Table 1 .
Table 1.
Primers used for quantitative RT-PCR during the mRNA expression analysis of genes associated with functional populations of regulatory T lymphocytes (CD25, Foxp3, CTLA4 and IDO) after experimental challenge with low (BVDV-1 strain SD-1) or high (BVDV-2 strain 1373) virulence non-cytopathic BVDV in beef calves.
| Genes | Abbreviation | Forward 5′–3′ | Reverse 5′–3′ | Reference |
|---|---|---|---|---|
| Interleukin 2 receptor α chain | CD25 | GCAGGGACCACAAATTTCCA | GGTACTCAGTGGTAAATATGAACGTATCC | [48] |
| Forehead-box p3 | FoxP3 | AAGAGCCCAGGGACAACTTTC | GGGTTCAAGGAGGAAGAGGAA | [48] |
| Cytotoxic T-lymphocyte antigen 4 | CTLA4 | GCAGCCAGGTGACCGAAGT | TCATCCAGGAAGGTTAGCTCATC | [48] |
| Indoleamine 2,3-dioxygenase | IDO | CGAATATACTTGTCTGGTTGG | GGAGAACATCAAAGCACTG | [49] |
2.7. Statistical analysis
Data were analyzed using Statistical Analysis System version 9.1 (SAS Institute, Cary, NC). Sample size was calculated using a power calculation (Proc Power of SAS) on the basis of the expected mean of target gene expression level (≥1.5 fold-regulation of mRNA level; normalized to the housekeeping gene and relative to the control group) for each experimental group, the SDs (±0.2 fold-regulation) of the means, and a statistical power of 99% based on previous measurements in earlier studies [28]. Statistical parametric assumptions of normality and constant variance were tested using Shapiro Wilk's and Levene's tests, respectively. Additionally, normal probability, residuals and quartile–quartile plots were constructed and analyzed to confirm any significant departure from normality and constant variability of the data. Since relative mRNA expression data were not normally distributed (heavily skewed), and had a heterogeneous variance, the comparison of means of the gene expression data were logarithmically transformed. The outcomes produced by the transformation were examined for possible violations of the tentative assumption of normality.
The general linear model procedure (Proc GLM) was used for the analysis of variance to compare the relative mRNA level of target genes among groups (using the Least Significant difference, LSD Test). Differences with P-values less than 0.05 were considered statistically significant.
3. Results
Two calves in the LV group were euthanized due to reasons not related to the BVDV infection (e.g. bone fracture due to aggressive temperament). All calves in the study were BVDV negative on the day of experimental inoculation (day 0) on the basis of virus isolation from serum samples. BVDV was isolated from spleen samples in all the animals in the LV (8/8) and HV (10/10) groups on day 5 after challenge, demonstrating an acute infection with BVDV in all the inoculated calves. In contrast, spleen samples from the control group were BVDV negative at the end of the experimental period (data previously published) [22].
The level of CD25 mRNA expression was different in tracheo-bronchial lymph nodes of calves inoculated with HV or LV BVDV on day 5 after inoculation. The mRNA expression for CD25 (IL-2 receptor α chain) was up-regulated in tracheo-bronchial lymph nodes of calves in LV group when compared to the control group (P < 0.05, Table 2 , comparison by ΔCt method). Calves experimentally challenged with HV BVDV did not show a significant increase in CD25 mRNA levels in tracheo-bronchial lymph nodes on day 5 post inoculation. In addition, the CD25 mRNA levels were significantly higher (P < 0.05) in tracheo-bronchial lymph nodes of calves in the LV group compared to those in calves in the HV group (Fig. 1 , comparison by ΔΔCt method). The transcription levels of the CD25 gene in spleen of both groups of BVDV-inoculated calves did not differ from those of the uninfected control calves (P > 0.05, Table 3 , comparison by ΔCt method).
Table 2.
Changes in mRNA expression (ΔCT method) of genes associated with regulatory T lymphocytes (CD25, FoxP3, CTLA4, IDO) in tracheo-bronchial lymph node (TBLN) samples of calves challenged with low (LV) or high (HV) virulence BVDV strains compared to the control calves. Data are expressed as differences of CT values obtained for target genes and the reference gene (18S rRNA). a,b Significant difference among groups (P < 0.05). The lower the ΔCT value, the higher the mRNA expression of the target gene.
|
ΔCT values |
|||
|---|---|---|---|
| Genes | LV | HV | Control |
| CD25 | 9.79 ± 0.77a | 12.45 ± 0.71b | 13.17 ± 0.96b |
| FoxP3 | 9.12 ± 0.61a | 8.53 ± 0.35a | 9.01 ± 0.30a |
| CTLA4 | 8.40 ± 0.32a | 7.54 ± 0.23a | 8.56 ± 0.34a |
| IDO | 5.80 ± 0.54a | 8.39 ± 0.57b | 10.21 ± 0.86b |
Fig. 1.
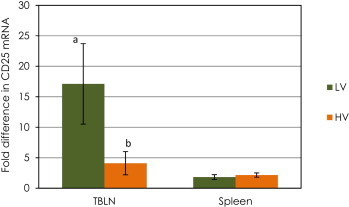
Changes in mRNA expression (ΔΔCT method) of CD25 (Interleukin 2 receptor α chain) in spleen and tracheo-bronchial lymph nodes (TBLN) of calves challenged with low (LV) or high (HV) virulence BVDV strains relative to that of the control calves. Data are expressed as fold difference of mRNA expression normalized to the housekeeping gene (18S rRNA), relative to the values obtained for uninfected calves. a,b Significant difference between groups (P < 0.05).
Table 3.
Changes in mRNA expression (ΔCT method) of genes associated with regulatory T lymphocytes (CD25, FoxP3, CTLA4, IDO) in spleen samples of calves challenged with low (LV) or high (HV) virulence BVDV strains compared to the control calves. Data are expressed as differences of CT values obtained for target genes and the reference gene (18S rRNA). a,b Significant difference among groups (P < 0.05). The lower the ΔCT value, the higher the mRNA expression of the target gene.
|
ΔCT values |
|||
|---|---|---|---|
| Genes | LV | HV | Control |
| CD25 | 13.56 ± 0.30a | 13.35 ± 0.31a | 14.22 ± 0.44a |
| FoxP3 | 8.49 ± 0.39a | 8.41 ± 0.25a | 8.26 ± 0.19a |
| CTLA4 | 7.72 ± 0.46a | 7.34 ± 0.24a | 6.87 ± 0.29a |
| IDO | 6.23 ± 0.37a | 6.14 ± 0.44a | 8.08 ± 0.76a |
The expression of FoxP3 and CTLA4 did not increase in the tracheo-bronchial lymph node or spleen samples in either of the BVDV-inoculated groups compared to the control group (Table 2, Table 3, comparison by ΔCt method). Significant differences were not found in the expression of FoxP3 and CTLA4 between groups (Fig. 2, Fig. 3).
Fig. 2.
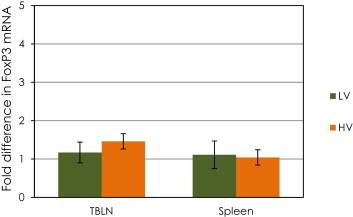
Changes in mRNA expression (ΔΔCT method) of the transcription factor Forkhead-box P3 (FoxP3) in spleen and tracheo-bronchial lymph nodes (TBLN) of calves challenged with low (LV) or high (HV) virulence BVDV strains relative to that of the control calves. Data are expressed as fold difference of mRNA expression normalized to the housekeeping gene (18S rRNA), relative to the values obtained for uninfected calves. There were no significant differences between groups.
Fig. 3.
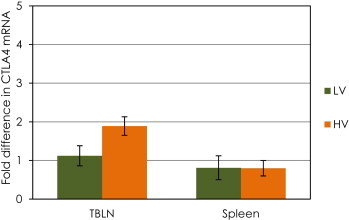
Changes in mRNA expression (ΔΔCT method) of the Cytotoxic T-lymphocyte antigen 4 (CTLA4) in spleen and tracheo-bronchial lymph nodes (TBLN) of calves challenged with low (LV) or high (HV) virulence BVDV strains relative to that of the control calves. Data are expressed as fold difference of mRNA expression normalized to the housekeeping gene (18S rRNA), relative to the values obtained for uninfected calves. There were no significant differences between groups.
A dramatic up-regulation of IDO mRNA (27.6-fold, Fig. 4 ) was observed on day 5 post inoculation in tracheo-bronchial lymph nodes of calves in the LV group relative to the control calves (P < 0.05, Table 2, comparison by ΔCt method). There was a significant difference in the mRNA expression level of IDO in tracheo-bronchial lymph nodes between LV and HV groups (P < 0.05, Fig. 4, comparison by ΔΔCt method). In contrast, the mRNA expression of IDO in spleen samples from calves inoculated with BVDV was similar to that observed in the control calves. (Table 3, P > 0.05, comparison by ΔCt method).
Fig. 4.
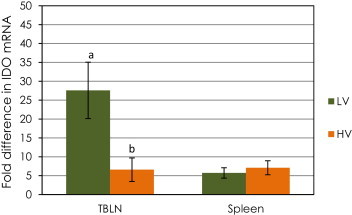
Changes in mRNA expression (ΔΔCT method)of the enzyme Indoleamine 2,3-dioxygenase (IDO) in spleen and tracheo-bronchial lymph nodes (TBLN) of calves challenged with low (LV) or high (HV) virulence BVDV strains relative to that of the control calves. Data are expressed as fold difference of mRNA expression normalized to the housekeeping gene (18S rRNA), relative to the values obtained for uninfected calves. a,b Significant difference between groups (P < 0.05).
4. Discussion
A significant upregulation of CD25 mRNA expression was observed in the calves in the LV group. Calves in the HV group did not show a significant increase in CD25 mRNA expression when compared to that of the control group. These results appear to indicate that up-regulation of the IL-2 alpha chain is greater on day 5 post-infection for LV infected calves and that this might be related to the context of immune response to LV infection. CD25 is related to clonal expansion and the early induction of Treg cells. The highly virulent BVDV-2 strain 1373, responsible for causing severe acute disease, has been associated with a greater than 50% reduction in circulating lymphocytes and lymphoid depletion in vivo [22], [25], [29], [30]. In a recent report we showed that the calves inoculated with the highly virulent BVDV-2 strain 1373 had a significant reduction in lymphocyte count on day 5 post infection compared with the calves infected with the low virulence BVDV-1a strain SD-1 and the control group [22]. The observed lymphopenia during BVDV-2 infection might have occurred as a consequence of lymphocytes apoptosis and/or necrosis. [31]. This previously observed depletion of leukocytes could be responsible for a lower mRNA expression of genes associated with Treg markers. Previous studies by Ridpath et al. [31] have shown a decrease in replicating cells and an increase in the fraction of dead cells in cultured lymphoid cell lines in vitro after infection with the highly virulent BVDV-2 strain 1373. On the other hand, infection with a low virulence virus did not have an apparent effect on cell health or replication [31], which might support our observations of differential CD25 mRNA expression.
The expression FoxP3 and CTLA4 were not increased in tracheo-bronchial lymph node or spleen samples from either of the BVDV-inoculated groups. Thus, under these experimental conditions, infection with ncp BVDV in either LV or HV groups did not demonstrate to up-regulate the expression of genes considered the hallmarks of Tregs activity in lymphoid tissue on day 5 post infection.
Induction of CD4+CD25+ FoxP3+ Tregs has been associated with infection by some viruses, such as HIV, HCV, HBV, CMV, HTLV-1, HBV, VACV, Influenza virus, coronavirus, arterivirus, PRRSV, SIV and FIV [15]. It is proposed that activation of Treg cells generally suppresses immunity, or provide a mechanism for the virus to evade the immune response in several species [13], [15], [17]. Recent studies have demonstrated induction of Tregs during early phase of acute infection with PRRSV [16], [17], [18], [19], [20]. Moreover, the increased frequency of CD25+ FoxP3+ T cells during infection with PRRSV in pigs has been associated with an increased production of the inhibitory cytokines IL-10 and TGF-beta [18], [20], lymphocyte suppression activity in vitro [20], [32] and increased susceptibility to natural Mycoplasma hyopneumoniae infection [17]. The induction of this T cell subset could explain the decreased and delayed local [33], [34], [35] and systemic [6] PRRSV-directed cell mediated immunity in PRRS infection, and the generalized immunosuppression observed in acutely infected pigs. Furthermore, in humans the suppression of virus-specific immunity associated with an increased expression of Treg associated genes (FoxP3, CD25 and CTLA4) in patients infected with HIV [36], [37] may contribute to uncontrolled viral replication and consequently lead to inflammatory damage and secondary infection during HIV infection [13].
Previous studies have shown the induction of CD4+CD25+ FoxP3+ regulatory T cells with suppressor activity in cattle infected with Mycobacterium avium subsp. paratuberculosis [38]. Moreover, Walz et al. [39] showed an upregulation of CD25, CCL5 and FoxP3 transcription level in placentomes of heifers infected with BVDV-2 strain PA131 compared with uninfected control heifers. The authors concluded that there was immune recognition of BVDV at the maternal-fetal interface and the virus may alter the normal expression of regulatory T cell markers [39].
The transcription factor FoxP3 has been previously described as a master regulator for development and function of suppressor regulatory T cells. Thus, regulatory T cells have been typically defined by the expression of FoxP3. However, most activated human T cells can transiently express FoxP3 under certain conditions [13], and FoxP3 negative T cells with regulatory functions have also been demonstrated to exist [40]. Interestingly, an ex vivo experiment performed by Hoek et al. [41] showed evidence that the bovine CD4+ CD25high FoxP3+ T cell population were not suppressive, regulatory T cells. In that study WC1.1+ and WC1.2+ γδ T cells, significant cell populations of calf blood, showed modulatory properties transcribing IL-10 [41].
A strong up-regulation of IDO mRNA level was detected by day 5 post challenge in tracheo-bronchial lymph nodes of the calves in the LV group. This inhibitory molecule is produced by antigen presenting cells and has been most commonly associated with pregnancy related immune suppression that protects the developing fetus from maternal rejection [42]. In addition, reports have previously associated IDO production with viral infections such as influenza virus, hepatitis C virus and HIV [43], [44], [45]. Enhanced tryptophan degradation by this enzyme contributes importantly to disease progression and clinical complications in HIV patients [46]. In the present study, no significant increase of IDO mRNA level was observed on day 5 post challenge in calves experimentally infected with BVDV-2 strain 1373. In contrast, LV BVDV infection with SD-1 did yield a highly significant increase in IDO mRNA level. This differential expression of IDO mRNA in calves inoculated with BVDV of different virulence might be associated with specific virus differences in temporal regulation of the transcription process during the immune response, or with greater efficacy of infection of macrophages and dendritic cells by BVDV-1a strain SD-1. These antigen-presenting cells have a major role in IDO production.
In the present study a confounding effect of BVDV genotype might be influencing the differences in the expression of the gene markers. The use of two type 2 BVDV strains of different virulence might have more clearly shown the specific effect of virulence. The present study was designed to recreate the scenario of comparing BVDV infections that are likely to occur naturally in the field. That is, it is quite common to find infection with a low virulence BVDV-1 virus or higher virulence BVDV-2 virus in the field. However, some BVDV-2 viruses are of low virulence. Prevalence studies examining BVDV isolates from cattle derived from diagnostic laboratory submissions have shown that BVDV-1 genotype was more frequently isolated in the field. In that study 61% of the isolates were BVDV-1 compared to 39% for BVDV-2 genotypes in animals with bovine respiratory disease complex [47]. Most BVDV infections are subclinical. However, BVDV is considered a strong potentiator of secondary infections even in mild infections providing no observed clinical signs. This is a consequence of the ability of BVDV to cause generalized clinical immunosuppression, resulting in polymicrobial respiratory disease. For these reasons we used a model based on two different genotypes (BVDV-1 and BVDV-2).
The mRNA expression of CD25 and IDO was up-regulated in tracheo-bronchial lymph nodes, but not in spleen of calves in the LV group. This reflects a spatial regulation of transcription. Since experimental challenge was done intra-nasally, differential expression in these lymphoid organs may be due to the level of viral replication induced by the LV virus in tissue local to the inoculation over the short duration after challenge.
In conclusion, experimental infection with ncp BVDV did not provide the expected evidence of Treg activation on day 5 post infection, based on strongly enhanced expression of the FoxP3 gene. Further, the functionally associated CTL4 gene was also not affected by either LV or HV BVDV infection on day 5 post infection. The differential expression of CD25 and IDO mRNA on the fifth day after infection between calves inoculated with high and low virulence BVDV might reflect differences in the subpopulations of leukocytes activated by HV and LV viruses during the early phase of infection. It is possible that LV infection yields IDO mediated suppressor activity by interaction of macrophages and dendritic cells with activated lymphocytes expressing the alpha chain of the IL-2 receptor. HV virus may interact with different leukocyte subpopulations and possibly enhance damage inducing pathways (e.g. through production of IL-17). The differential expression of genes in HV and LV infection on the fifth day after infection may also reflect temporal–spatial differences in the sequence of transcriptional events occurring during the immune response against these two viral strains, or may be due to specific BVDV genotype differences in viral infectivity of the host cells. Overall, under these experimental conditions, the analysis of mRNA expression for genes associated with regulatory T lymphocytes (CD25, FoxP3, CTLA4, and IDO) on the fifth day after infection with ncp BVDV did not provide a solid basis for postulating a role of classical Treg cells in the early pathogenesis of BVDV infection or the differential pathogenesis of high and low virulence BVDV strains.
Acknowledgments
The authors thank The University of Georgia, Office of Vice-president of Research (Grant no. 2505), Auburn University and Novartis Animal Health® for their financial support.
Footnotes
RNAlater reagent, RNeasy protect kit, QIAGEN® Valencia, CA USA.
Next Advance® Averill Park, NY, USA.
RNeasy mini kit QIAGEN®, Valencia, CA USA.
Roche®, Indianapolis, IN USA.
Applied Biosystems® Power SYBR Green PCR Master Mix.
References
- 1.Baker J. The clinical manifestation of bovine viral diarrhea infection. Veterinary Clinics of North America. Food Anim Pract. 1995;11:425–445. doi: 10.1016/s0749-0720(15)30460-6. [DOI] [PubMed] [Google Scholar]
- 2.Houe H. Epidemiological features and economical importance of bovine virus diarrhoea virus (BVDV) infections. Vet Microbiol. 1999;64:89–107. doi: 10.1016/s0378-1135(98)00262-4. [DOI] [PubMed] [Google Scholar]
- 3.Peterhans E., Jungi T.W., Schweizer M. BVDV and innate immunity. Biologicals. 2003;31:107–112. doi: 10.1016/s1045-1056(03)00024-1. [DOI] [PubMed] [Google Scholar]
- 4.Lehner T. Special regulatory T cell review: the resurgence of the concept of contrasuppression in immunoregulation. Immunology. 2008;123:40–44. doi: 10.1111/j.1365-2567.2007.02780.x. [DOI] [PMC free article] [PubMed] [Google Scholar]
- 5.Sakaguchi S. Naturally arising CD4+ regulatory t cells for immunologic self-tolerance and negative control of immune responses. Annu Rev Immunol. 2004;22:531–562. doi: 10.1146/annurev.immunol.21.120601.141122. [DOI] [PubMed] [Google Scholar]
- 6.Silva-Campa E., Mata-Haro V., Mateu E., Hernández J. Porcine reproductive and respiratory syndrome virus induces CD4+CD8+CD25+Foxp3+ regulatory T cells (Tregs) Virology. 2012;430:73–80. doi: 10.1016/j.virol.2012.04.009. [DOI] [PubMed] [Google Scholar]
- 7.Garden O.A., Pinheiro D., Cunningham F. All creatures great and small: regulatory T cells in mice, humans, dogs and other domestic animal species. Int Immunopharmacol. 2011;11:576–588. doi: 10.1016/j.intimp.2010.11.003. [DOI] [PubMed] [Google Scholar]
- 8.Hori S., Nomura T., Sakaguchi S. Control of regulatory T cell development by the transcription factor Foxp3. Science. 2003;299:1057–1061. doi: 10.1126/science.1079490. [DOI] [PubMed] [Google Scholar]
- 9.Fontenot J.D., Gavin M.A., Rudensky A.Y. Foxp3 programs the development and function of CD4+CD25+ regulatory T cells. Nat Immunol. 2003;4:330–336. doi: 10.1038/ni904. [DOI] [PubMed] [Google Scholar]
- 10.Fontenot J.D., Rasmussen J.P., Williams L.M., Dooley J.L., Farr A.G., Rudensky A.Y. Regulatory T cell lineage specification by the forkhead transcription factor Foxp3. Immunity. 2005;22:329–341. doi: 10.1016/j.immuni.2005.01.016. [DOI] [PubMed] [Google Scholar]
- 11.Campbell D.J., Ziegler S.F. FOXP3 modifies the phenotypic and functional properties of regulatory T cells. Nat Rev Immunol. 2007;7:305–310. doi: 10.1038/nri2061. [DOI] [PubMed] [Google Scholar]
- 12.Roncarolo M.G., Gregori S. Is FOXP3 a bona fide marker for human regulatory T cells. Eur J Immunol. 2008;38:925–927. doi: 10.1002/eji.200838168. [DOI] [PubMed] [Google Scholar]
- 13.Belkaid Y. Regulatory T cells and infection: a dangerous necessity. Nat Rev Immunol. 2007;7:875–888. doi: 10.1038/nri2189. [DOI] [PubMed] [Google Scholar]
- 14.Fallarino F., Grohmann U., Hwang K.W., Orabona C., Vacca C., Bianchi R. Modulation of tryptophan catabolism by regulatory T cells. Nat Immunol. 2003;4:1206–1212. doi: 10.1038/ni1003. [DOI] [PubMed] [Google Scholar]
- 15.Li S., Gowans E.J., Chougnet C., Plebanski M., Dittmer U. Natural regulatory T cells and persistent viral infection. J. Virol. 2008;82:21–30. doi: 10.1128/JVI.01768-07. [DOI] [PMC free article] [PubMed] [Google Scholar]
- 16.Dwivedi V., Manickam C., Binjawadagi B., Linhares D., Murtaugh M.P., Renukaradhya G.J. Evaluation of immune responses to porcine reproductive and respiratory syndrome virus in pigs during early stage of infection under farm conditions. Virology. 2012;396:264–271. doi: 10.1186/1743-422X-9-45. [DOI] [PMC free article] [PubMed] [Google Scholar]
- 17.LeRoith T., Hammond S., Todd S.M., Ni Y., Cecere T., Pelzer K.D. A modified live PRRSV vaccine and the pathogenic parent strain induce regulatory T cells in pigs naturally infected with Mycoplasma hyopneumoniae. Vet Immunol Immunopathol. 2011;140:312–316. doi: 10.1016/j.vetimm.2010.12.011. [DOI] [PubMed] [Google Scholar]
- 18.Silva-Campa E., Flores-Mendoza L., Reséndiz M., Pinelli-Saavedra A., Mata-Haro V., Mwangi W. Induction of T helper 3 regulatory cells by dendritic cells infected with porcine reproductive and respiratory syndrome virus. Virology. 2009;387:373–379. doi: 10.1016/j.virol.2009.02.033. [DOI] [PubMed] [Google Scholar]
- 19.Silva-Campa E., Cordoba L., Fraile L., Flores-Mendoza L., Montoya M., Hernández J. European genotype of porcine reproductive and respiratory syndrome (PRRSV) infects monocyte-derived dendritic cells but does not induce Treg cells. Virology. 2010;396:264–271. doi: 10.1016/j.virol.2009.10.024. [DOI] [PubMed] [Google Scholar]
- 20.Wongyanin P., Buranapraditkun S., Chokeshai-Usaha K., Thanawonguwech R., Suradhat S. Induction of inducible CD4+CD25+Foxp3+ regulatory T lymphocytes by porcine reproductive and respiratory syndrome virus (PRRSV) Vet Immunol Immunopathol. 2010;133:170–182. doi: 10.1016/j.vetimm.2009.07.012. [DOI] [PubMed] [Google Scholar]
- 21.Molitor T.W., Bautista E.M., Choi C.S. Immunity to PRRSV: double-edged sword. Vet Microbiol. 1997;55:265–276. doi: 10.1016/S0378-1135(96)01327-2. [DOI] [PMC free article] [PubMed] [Google Scholar]
- 22.Palomares R.A., Walz H.G., Brock K.V. Expression of type I interferon-induced antiviral state and pro-apoptosis markers during experimental infection with low or high virulence bovine viral diarrhea virus in beef calves. Virus Res. 2013;173:260–269. doi: 10.1016/j.virusres.2013.02.010. [DOI] [PubMed] [Google Scholar]
- 23.Palomares R.A., Brock K.V., Walz P.H. Differential expression of pro-inflammatory and anti-inflammatory cytokines during experimental infection with low or high virulence bovine viral diarrhea virus in beef calves. Vet Immunol Immunopathol. 2014;157:149–154. doi: 10.1016/j.vetimm.2013.12.002. [DOI] [PubMed] [Google Scholar]
- 24.Houe H. Epidemiology of bovine viral diarrhea virus. Vet Clin North Am Food Anim Pract. 1995;11:521–547. doi: 10.1016/s0749-0720(15)30465-5. [DOI] [PubMed] [Google Scholar]
- 25.Deng R., Brock K.V. Molecular cloning and nucleotide sequence of a pestivirus genome, noncytopathic bovine viral diarrhea virus strain SD-1. Virology. 1992;191:867–879. doi: 10.1016/0042-6822(92)90262-n. [DOI] [PubMed] [Google Scholar]
- 26.Carman S., van Dreumel T., Ridpath J., Hazlett M., Alves D., Dubovi E. Severe acute bovine viral diarrhea in Ontario, 1993–1995. J Vet Diagn Invest. 1998;10:27–35. doi: 10.1177/104063879801000106. [DOI] [PubMed] [Google Scholar]
- 27.Livak K.J., Schmittgen T.D. Analysis of relative gene expression data using real-time quantitative PCR and the 2(−Delta Delta C(T)) Method. Methods. 2001;25:402–408. doi: 10.1006/meth.2001.1262. [DOI] [PubMed] [Google Scholar]
- 28.Lee S.R., Pharr G.T., Boyd B.L., Pinchuk L.M. Bovine viral diarrhea viruses modulate toll-like receptors, cytokines and co-stimulatory molecules genes expression in bovine peripheral blood monocytes. Comp Immunol Microbiol Infect Dis. 2008;31:403–418. doi: 10.1016/j.cimid.2007.06.006. [DOI] [PubMed] [Google Scholar]
- 29.Liebler-Tenorio E.M., Ridpath J.E., Neill J.D. Distribution of viral antigen and development of lesions after experimental infection with highly virulent bovine viral diarrhea virus type 2 in calves. Am J Vet Res. 2002;63:1575–1584. doi: 10.2460/ajvr.2002.63.1575. [DOI] [PubMed] [Google Scholar]
- 30.Liebler-Tenorio E.M., Ridpath J.F., Neill J.D. Lesions and tissue distribution of viral antigen in severe acute versus subclinical acute infection with BVDV2. Biologicals. 2003;31:119–122. doi: 10.1016/s1045-1056(03)00026-5. [DOI] [PubMed] [Google Scholar]
- 31.Ridpath J.F., Bendfeldt S., Neill J.D., Liebler-Tenorio E. Lymphocytopathogenic activity in vitro correlates with high virulence in vivo for BVDV type 2 strains: criteria for a third biotype of BVDV. Virus Res. 2006;118:62–69. doi: 10.1016/j.virusres.2005.11.014. [DOI] [PubMed] [Google Scholar]
- 32.Cecere T.E., Todd S.M., Regulatory LeRoith T. T cells in arterivirus and coronavirus infections: do they protect against disease or enhance it? Viruses. 2012;4:833–846. doi: 10.3390/v4050833. [DOI] [PMC free article] [PubMed] [Google Scholar]
- 33.Riber U., Nielsen J., Lind P. In utero infection with PRRS virus modulates cellular functions of blood monocytes and alveolar lung macrophages in piglets. Vet Immunol Immunopathol. 2004;99:169–177. doi: 10.1016/j.vetimm.2004.02.008. [DOI] [PubMed] [Google Scholar]
- 34.Rossow K.D., Collins J.E., Goyal S.M., Nelson E.A., Christopher-Hennings J., Benfield D.A. Pathogenesis of porcine reproductive and respiratory syndrome virus infection in gnotobiotic pigs. Vet Pathol. 1995;32:361–373. doi: 10.1177/030098589503200404. [DOI] [PubMed] [Google Scholar]
- 35.Zeman D., Neiger R., Yaeger M., Nelson E., Benfield D., Leslie-Steen P. Laboratory investigation of PRRS virus infection in three swine herds. J Vet Diagn Invest. 1993;5:522–528. doi: 10.1177/104063879300500404. [DOI] [PubMed] [Google Scholar]
- 36.Andersson J., Boasso A., Nilsson J., Zhang R., Shire N.J., Lindback S. The prevalence of regulatory T cells in lymphoid tissue is correlated with viral load in HIV-infected patients. J Immunol. 2005;174:3143–3147. doi: 10.4049/jimmunol.174.6.3143. [DOI] [PubMed] [Google Scholar]
- 37.Kornfeld C., Ploquin M.J., Pandrea I., Faye A., Onanga R., Apetrei C. Antiinflammatory profiles during primary SIV infection in African green monkeys are associated with protection against AIDS. J Clin Invest. 2005;115:1082–1091. doi: 10.1172/JCI23006. [DOI] [PMC free article] [PubMed] [Google Scholar]
- 38.Coussens P.M., Sipkovsky S., Murphy B., Roussey J., Colvin C.J. Regulatory T cells in cattle and their potential role in bovine paratuberculosis. Comp Immunol Microbiol Infect Dis. 2012;35:233–239. doi: 10.1016/j.cimid.2012.01.004. [DOI] [PubMed] [Google Scholar]
- 39.Walz H.L., Palomares R.A., Caldwell J.M., Walz P.H., Brock K.V. Evaluation of CD25, Foxp3, and CCL5 gene expression in placentomes of pregnant cattle inoculated with bovine viral diarrhea virus. Conference of Research Workers in Animal Diseases; Chicago, IL; 2011. p. 4. 18. [Google Scholar]
- 40.Regulatory Bach J.F. T cells under scrutiny. Nat Rev Immunol. 2003;3:189–198. doi: 10.1038/nri1026. [DOI] [PubMed] [Google Scholar]
- 41.Hoek A., Rutten V.P., Kool J., Arkesteijn G.J., Bouwstra R.J., Van Rhijn I. Subpopulations of bovine WC1(+) gammadelta T cells rather than CD4(+)CD25(high) Foxp3(+) T cells act as immune regulatory cells ex vivo. Vet Res. 2009;40:6–20. doi: 10.1051/vetres:2008044. [DOI] [PMC free article] [PubMed] [Google Scholar]
- 42.Zhu B.T. Development of selective immune tolerance towards the allogeneic fetus during pregnancy: role of tryptophan catabolites. Int J Mol Med. 2010;25:831–835. doi: 10.3892/ijmm_00000411. (Review) [DOI] [PubMed] [Google Scholar]
- 43.Fox J.M., Sage L.K., Huang L., Barber J., Klonowski K.D., Mellor A.L. Inhibition of indoleamine 2,3-dioxygenase enhances the T-cell response to influenza virus infection. J Gen Virol. 2013;94:1451–1461. doi: 10.1099/vir.0.053124-0. [DOI] [PMC free article] [PubMed] [Google Scholar]
- 44.Higashitani K., Kanto T., Kuroda S., Yoshio S., Matsubara T., Kakita N. Association of enhanced activity of indoleamine 2,3-dioxygenase in dendritic cells with the induction of regulatory T cells in chronic hepatitis C infection. J Gastroenterol. 2013;48:660–670. doi: 10.1007/s00535-012-0667-z. [DOI] [PubMed] [Google Scholar]
- 45.Manéglier B., Malleret B., Guillemin G.J., Spreux-Varoquaux O., Devillier P., Rogez-Kreuz C. Modulation of indoleamine-2,3-dioxygenase expression and activity by HIV-1 in human macrophages. Fundam Clin Pharmacol. 2009;23:573–581. doi: 10.1111/j.1472-8206.2009.00703.x. [DOI] [PubMed] [Google Scholar]
- 46.Schroecksnadel K., Zangerle R., Bellmann-Weiler R., Garimorth K., Weiss G., Fuchs D. Indoleamine-2,3-dioxygenase and other interferon-gamma-mediated pathways in patients with human immunodeficiency virus infection. Curr Drug Metab. 2007;8:225–236. doi: 10.2174/138920007780362608. [DOI] [PubMed] [Google Scholar]
- 47.Fulton R.W., Ridpath J.F., Confer A.W., Saliki J.T., Burge L.J., Payton M.E. Bovine viral diarrhoea virus antigenic diversity: impact on disease and vaccination programmes. Biologicals. 2003;31(2):89–95. doi: 10.1016/s1045-1056(03)00021-6. [DOI] [PubMed] [Google Scholar]
- 48.Seo K.S., Lee S.U., Park Y.H., Davis W.C., Fox L.K., Bohach G.A. Long-term staphylococcal enterotoxin C1 exposure induces soluble factor-mediated immunosuppression by bovine CD4+ and CD8+ T cells. Infect Immun. 2007;75(1):260–269. doi: 10.1128/IAI.01358-06. [DOI] [PMC free article] [PubMed] [Google Scholar]
- 49.Plain K.M., de Silva K., Earl J., Begg D.J., Purdie A.C., Whittington R.J. Indoleamine 2,3-dioxygenase, tryptophan catabolism, and mycobacterium avium subsp. Paratuberculosis: a model for chronic mycobacterial infections. Infect Immun. 2011;79(9):3821–3832. doi: 10.1128/IAI.05204-11. [DOI] [PMC free article] [PubMed] [Google Scholar]