

Abstract
Methods that predict antibody epitopes could help to promote the development of diagnostic tools, vaccines or immunotherapies by affecting the epitope binding of antibodies during an immunological response to antigens.
It is generally assumed that there is a direct relationship between antibody accessibility to antigens and accessible surface of proteins. Based on this assumption, prediction systems often includes solvent accessibility values calculated from the primary sequence of proteins or from their three dimensional structures as a predictive criterion. However, the current prediction systems seem weakly efficient in view of benchmark tests.
We were interested in evaluating how amino acids that have been experimentally identified as epitopic elements could differ from the rest of the antigenic molecule at the level of surface exposure, hence we assessed the average accessibility of epitopes. The approach used here utilises published epitopes deduced from numerous identification techniques, including sequence scanning and structure visualisation after crystallography, and it involves many types of antigens from toxins to allergens. Our results show that epitopic residues are not distributed among any specific Relative Surface Accessibility and Protrusion Index values and that, in some cases, epitopes cover the entire antigenic sequence.
These results led to the conclusion that the classification of known epitopes with respect to the experimental conditions used to identify them should be introduced before attempting to characterise epitopic areas in a generic way.
Keywords: Accessibility, Bioinformatics, Epitope, Prediction, Protein surface, Protrusion index
1. Introduction
Immunological responses are characterised by the neutralisation of exogenous proteins by specific antibodies. Exogenous proteins, also called antigens, can be derived from viral particles, toxins or allergens. Recognition and binding of an antigen by the antibody products of B-cells are driven by epitopes, which are portions of the antigen molecule. Numerous studies are being conducted to identify B-cell epitopes because the localisation of these specific areas is of clinical interest for the development of diagnostic tools, vaccines and immunotherapies. Such knowledge could also lead to a better understanding of immunological mechanisms, particularly in the field of allergic response, by probing risk factors and advancing preventive strategies.
The B-cell epitopes are classified into two categories: Continuous epitopes are composed of contiguous amino acids along the primary sequence, whereas discontinuous epitopes combine several shorter segments scattered along the sequence and brought together in spatial proximity when the protein is folded. This classification is tightly related to the different experimental techniques developed to locate epitopes on antigens. The ability of synthetic overlapping peptides to bind antibodies leads to the identification of continuous epitopes. Usually, such epitopes consist of peptides of around ten amino acids, but their minimum size remains poorly defined (Van Regenmortel, 2006). In the context of allergic response, the identification of critical amino acids for antibody-binding may be useful in the development of immunotherapy strategies by modifying B-cell epitopes to prevent IgE binding while preserving T cell epitopes (e.g., Cocco et al., 2003, Robotham et al., 2002).
Discontinuous epitopes can be identified by directed mutagenesis of the antigen followed by the measurement of the antibody's residual affinity (Swoboda et al., 2002). The creation of a random peptide library displayed at the surface of phages or yeasts followed by immunopanning, whereby antibodies bind to surface-exposed peptides that mimic the epitopes, is an alternative method to identify discontinuous epitopes known as the mimotopes technique (Levy et al., 2007, Prabakaran et al., 2006, Riemer et al., 2004). Nevertheless, the fine identification of discontinuous epitopes is generally achieved by microscopic techniques that resolve antigen–antibody complexes, such as the electron-microscopy density map (e.g., Belnap et al., 2003), the NMR (e.g., Morgan et al., 2004, Naik et al., 2008) and X-ray crystallography (e.g., Padavattan et al., 2007). Epitopes are then deduced from these observations by identifying the points of contact between the two molecules at the atomic level, which usually encompasses between 15 and 22 amino acids (Rubinstein et al., 2008, Van Regenmortel, 1996).
The human body can produce around 108 to 109 different antibodies, due to the high number of potential variable domains encoded following genetic recombination. Consequently, the antibody repertoire contains an almost infinite capacity to bind various peptides with different affinities. Accurate prediction tools could therefore help by reducing the number of potential epitopes. Further, the development of experimental techniques increases our understanding of these epitopes and their binding characteristics. B-cell epitope-specific databases centralise this information and enable statistical studies to describe B-cell epitopes in a predictive manner. AntiJen (Toseland et al., 2005) mainly contains continuous epitopes whereas Epitome (Schlessinger et al., 2006) is composed of epitopes identified from the structural analysis of antigen–antibody complexes. The Immune Epitope DataBase (Vita et al., 2010) gathers data on both B and T cell epitopes that have been curated from several publicly available databases, the scientific literature and those directly submitted by authors. Epitopes collected in such databases are described by their amino acid sequences plus the residue positions within the antigen sequences, particularly for discontinuous epitopes.
The most cited characteristic of an epitope is its presence on the protein surface. It is generally calculated from the three dimensional structures by determining the solvent-accessible surface (SAS) of the residues or by examination of their protrusion index, an alternative to the influence of atomic radii parameter on surface computations (Pintar et al., 2002). The importance of surface exposure for antibody binding has been observed for the first time by Novotný et al. (1986) and Thornton et al. (1986) using lysozyme, myoglobin, cytochrome c and myohemerythrin. This surface exposure characteristic has even been integrated with experimental work as a confirmation of in vitro epitope identification methods (Dolimbek et al., 2008, López-Torrejón et al., 2007, Robotham et al., 2009) and as an element of the epitope localisation by the mimotope technique (Pacios et al., 2008, Tordesillas et al., 2009). The basic assumption that epitopes will be found in regions of proteins that have a high degree of exposure to the solvent was also an element taken into account for both continuous and discontinuous epitope predictions. Epitope predictions are based on either protein sequence or three dimensional structure. In this last case, SAS visualisation of the known or homology-modelled antigen structure is often associated with changes in the electrostatic potential and these two features enable to select candidate sequences for immunoassays or for directed mutagenesis to build less reactive molecules (García-Casado et al., 2003, Sordet et al., 2009). Moreover, the accessible characteristic of epitopic elements is one of those integrated into prediction servers based on 3D structures, such as Discotope (Haste Andersen et al., 2006) and Ellipro (Ponomarenko et al., 2008).
Methods for sequence-based predictions originally used a combination of different amino acid propensity scales, such as HPLC-derived hydrophobicity, solvent accessibility, flexibility, hydropathy and the propensity for adopting a certain secondary structure. However, a complete benchmark of the available scales from the AAindex database, including the surface accessibility propensity (Emini et al., 1985), has been achieved by Blythe and Flower (2005) and displays a weak predictive performance. As an illustration of these results, a recent work comparing experimental data with epitope predictions does not show a correlation between the continuous epitopes identified and the computed surface accessibility for the dengue virus 3 protein sequence (da Silva et al., 2009). Aiming to improve the accuracy of continuous B-cell epitope predictions, some other tools using learning approaches have since been developed to classify sequences from two types of datasets: one from epitope fragments and one from non-epitope fragments. Indeed, these methods slightly improve performance predictions compared to amino acid scales; however, one drawback is that they work in a black box without giving any consideration to the underlying molecular mechanisms. Furthermore, their non-epitope dataset construction collects randomly selected fragments from SWISS-PROT database or randomly constructed peptides (El-Manzalawy et al., 2008, Saha and Raghava, 2006). These true negative datasets cannot be validated but their content may influence the prediction accuracy. The incorporation of structural predictions about secondary structures and solvent accessibility into the learning techniques of support vector machines seems to improve slightly the outcome, particularly improving specificity at the expense of sensitivity (Sweredoski and Baldi, 2009). Unfortunately, this work requires entire protein sequences and as a consequence it has been done on a very limited dataset (14 well known antigens and HIV antigenic proteins).
The prediction approaches that have been applied to date to epitopes rely either on the individual visualisation of the three-dimensional structure of an antigen, which has a limited scope, or on the comparisons made between the epitope sequences from several antigens and those of randomly built non-epitopes with a weak accuracy. To circumvent the limits of these approaches, the present work describes the surface accessible features of continuous and discontinuous epitopes as compared to the remaining molecule based on an extended structural dataset without regard to the antigen type. This generic approach aims to assess the average exposure of epitopes and to determine whether this could act as a discriminating factor for prediction methods.
2. Material and methods
2.1. Data collection
Both continuous and discontinuous epitope sequences from natural peptides, identified by positive B-cell assays involving known antibody isotypes, have been extracted from the IEDB v 2.0 WEB site (August 2009) along with their associated PubMed identifiers. Continuous epitopes greater than 20 amino acids in length have been removed.
The antigen sequences have been retrieved by their protein identifiers from the entrez protein database (http://www.ncbi.nlm.nih.gov/protein). Their 3D structures were downloaded from PDB site (http://www.pdb.org) using UniprotKB (http://www.uniprot.org) cross-references. Only structures representing a single polypeptide chain, i.e., without any complexed agent masking the epitope sites, were conserved. When multiple structures were available for a given antigen, the longest one or one resolved by X-ray crystallography was preferred.
In some cases it was deemed necessary to examine articles in detail and check the location of the epitopes.
2.2. Surface calculations
Since the epitopes are described by their amino acid sequences in databases the antigen surfaces were characterised by the residue accessibility (Lee and Richards, 1971) and the residue protrusion index. The residue accessibility is represented by the Relative Solvent Accessibility (RSA), which is defined for each residue as the ratio of the sum of the Accessible Surface Areas (ASA) of its atoms to the maximal ASA that the residue would have in an unfolded and extended polypeptide chain. The ASA of atoms within each of the coordinate files of the dataset was computed using the Areaimol program from the CCP4 package (Collaborative Computational Project, Number 4, 1994), version 6.1.1 (January 2008), with default parameters (probe diameter 1.4 Å, water molecules ignored) and as an implementation of the Lee and Richards (1971) algorithm. The maximal ASAs of amino acids are taken from Miller et al. (1987) and correspond to the surface exposed area of the central residue in a theoretical tripeptide GXG, where G denotes glycine and X denotes the residue in question.
The Areaimol program is not the only program used to compute the solvent-accessible surface. Nevertheless, RSA profiles do not vary significantly when the alternative DSSP program (Kabsch and Sander, 1983) is used to compute the ASA and then normalised according to the Shrake and Rupley's (Shrake and Rupley, 1973) dictionary of maximum possible values for each amino acid (data not shown).
The Protrusion Index (PI) has been computed using the CX program (Pintar et al., 2002). Since the program calculates values for each coordinated atom, three values have been examined for their ability to represent amino acid protrusion. The first value corresponds to the maximal Protrusion Index collected from all of the atoms of one residue, assuming that binding interactions take place between the most exposed atoms. The second value corresponds to the protrusion index of the alpha-carbon of each residue, as described by Pintar et al. to compare the CX results with the solvent accessibility values. In other words, the maximum value represents the protrusion of the residue side chain whereas the c-alpha value represents the protrusion of the amino acid due to the structure folding. The mean atom value per residue corresponds to the third value, which represents its average protrusion from the protein surface. As expected, maximum and c-alpha protrusion values are generally correlated (spearman correlation rho = 0.9017408, p-value < 2.2 × 10⁻¹⁶). However, 3D structures resolved by NMR display lower c-alpha protrusion values. The mean protrusion value has therefore been chosen as a compromise between the previous ones.
The Areaimol and CX programs have both been applied to each coordinate file in a batch mode producing modified PDB files. For the structures identified by the NMR technique, the first model was chosen unless a different best-representative conformer was indicated in the REMARK field. The correspondence between an epitope and its position inside the structure is not based on the amino acid number of the coordinate file. Indeed, in a PDB file, the residue number in the protein chain does not always match the amino acid number in the corresponding protein sequence that is found in the protein database due to gaps or modified residues (David and Yip, 2008). Thus, the protein sequences have been rebuilt from the ATOM annotated lines of the PDB files. Epitopes have then been mapped on these sequences using a pattern matching procedure.
Graphs have been drawn using the R software environment and the Lattice package.
3. Results
3.1. Dataset composition
Following the selection process of coordinate files, 61 three-dimensional structures remain that comply with our criterion: a single polypeptide chain with at least one B-cell epitope mapped on it. Table 1 summarises the corresponding PDB identifiers, the protein names extracted from the PDB files, the resolution techniques, the number of epitopes mapped on each structure and the number of PubMed references where these epitopes are published. It reveals a heterogeneous dataset according to the precision level, the completeness of the protein and the antigen type. Indeed, the structures built from crystallography may be more precise than theoretical models. However, some structures may only be a fragment of the whole antigen, as in the case of 2VUA Id, which is part of the A type botulinum enterotoxin. In such cases, only the fragment is analysed for epitopic residues because it represents a challenge for some immunological mechanisms. Two structures of the prion molecule have been left in because a discontinuous epitope has been confidently mapped in the mutated form. In addition, antigens can be allergens (egg, milk, pollen, mites), bacterial toxins (botulism, anthrax, tuberculosis), viral proteins (hepatitis, Lyme disease, HIV) or autoimmune proteins (multiple sclerosis).
Table 1.
List of PDB identifiers and their corresponding molecule name.
| PDB ID | Compound name | Experimental data type | Number of epitope sequences | Number of references |
|---|---|---|---|---|
| 1A9V | MITE ALLERGEN DER P 2 | Solution NMR | 15 | 9 |
| 1ACC | ANTHRAX PROTECTIVE ANTIGEN | X-ray diffraction | 4 | 4 |
| 1AG2 | PRION PROTEIN DOMAIN PRP (121–231) | Solution NMR | 32 | 12 |
| 1BJ7 | BOVINE LIPOCALIN ALLERGEN BOS D 2 | X-ray diffraction | 1 | 1 |
| 1BTT | BAND 3 ANION TRANSPORT PROTEIN | Solution NMR | 2 | 1 |
| 1BV1 | BIRCH POLLEN ALLERGEN BET V 1 | X-ray diffraction | 1 | 1 |
| 1CEJ | PLASMODIUM FALCIPARUM MEROZOITE SURFACE PROTEIN 1 | Solution NMR | 12 | 6 |
| 1CQA | BIRCH POLLEN PROFILIN | X-ray diffraction | 1 | 1 |
| 1DNR | EPIDERMAL GROWTH FACTOR RECEPTOR | Theoretical model | 1 | 1 |
| 1DZL | L1 PROTEIN OF HUMAN PAPILLOMAVIRUS 16 | X-ray diffraction | 2 | 1 |
| 1ECO | ERYTHROCRUORIN (CARBONMONOXY) | X-ray diffraction | 10 | 2 |
| 1EFE | MINI-PROINSULIN | Solution NMR | 4 | 2 |
| 1F0N | MYCOBACTERIUM TUBERCULOSIS ANTIGEN 85B | X-ray diffraction | 11 | 1 |
| 1FCV | BEE VENOM HYALUROGLUCOSAMINIDASE ALLERGEN | X-ray diffraction | 1 | 1 |
| 1FO7 | PRION PROTEIN | Solution NMR | 17 | 6 |
| 1HA0 | HEMAGGLUTININ PRECURSOR OF INFLUENZA VIRUS | X-ray diffraction | 8 | 7 |
| 1HEV | HEVEIN ALLERGEN | Solution NMR | 19 | 5 |
| 1K8T | ANTHRAX CALMODULIN-SENSITIVE ADENYLATE CYCLASE | X-ray diffraction | 1 | 1 |
| 1KUR | ALLERGEN JUN A 3 | Theoretical model | 6 | 1 |
| 1L8M | P. FALCIPARUM HISTIDINE-RICH PROTEIN III | Theoretical model | 1 | 1 |
| 1NEA | NAJA NIGRICOLLIS VENOM TOXIN ALPHA | Solution NMR | 4 | 3 |
| 1NJ0 | EXTERIOR MEMBRANE GLYCOPROTEIN (GP120) OF HIV-1 | Solution NMR | 1 | 1 |
| 1P4P | BORRELIA BURGDOFERI OUTER SURFACE PROTEIN B | X-ray diffraction | 4 | 4 |
| 1P83 | MYCOBACTERIUM TUBERCULOSIS 10 KDA CHAPERONIN | Solution NMR | 6 | 3 |
| 1POC | BEE-VENOM PHOSPHOLIPASE A2 ALLERGEN | X-ray diffraction | 1 | 1 |
| 1PY9 | AUTOANTIGEN MYELIN-OLIGODENDROCYTE GLYCOPROTEIN | X-ray diffraction | 1 | 1 |
| 1Q4Z | SARS CORONAVIRUS E2 GLYCOPROTEIN | Theoretical model | 32 | 12 |
| 1QCL | HUMAN MYELIN BASIC PROTEIN | Theoretical model | 1 | 1 |
| 1R6F | YERSINIA PESTIS VIRULENCE-ASSOCIATED V ANTIGEN | X-ray diffraction | 18 | 2 |
| 1S0G | BOTULINUM NEUROTOXIN TYPE B | X-ray diffraction | 35 | 2 |
| 1SEA | STAPHYLOCOCCAL ENTEROTOXIN A | Theoretical model | 14 | 5 |
| 1TCS | MONGOLIAN SNAKE-GOURD TRICHOSANTHIN | X-ray diffraction | 1 | 1 |
| 1TG8 | DENGUE VIRUS ENVELOPE GLYCOPROTEIN | X-ray diffraction | 4 | 1 |
| 1U3I | GLUTATHIONE S-TRANSFERASE FROM SCHISTOSOMA MANSONI | X-ray diffraction | 9 | 6 |
| 1UOI | AMYLOID BETA A4 PROTEIN | Theoretical model | 40 | 30 |
| 1WRF | MITE GROUP 2 ALLERGEN DER F 2 | Solution NMR | 4 | 2 |
| 1XKG | MAJOR MITE FECAL ALLERGEN DER P 1 | X-ray diffraction | 9 | 3 |
| 1Y16 | MAJOR PRION PROTEIN | Solution NMR | 30 | 11 |
| 1Y2S | MAJOR PRION PROTEIN | Solution NMR | 9 | 5 |
| 1YQY | B. ANTHRAX LETHAL FACTOR | X-ray diffraction | 41 | 2 |
| 1YUY | HEPATITIS C VIRUS RNA-DEPENDANT RNA POLYMERASE | X-ray diffraction | 10 | 1 |
| 2AKB | CIRCUMSPOROZOITE PROTEIN | Theoretical model | 1 | 1 |
| 2BBX | TSR DOMAIN OF MALARIA TRAP PROTEIN | Solution NMR | 2 | 1 |
| 2BRL | HEPATITIS C VIRUS RNA-DIRECTED RNA POLYMERASE | X-ray diffraction | 167 | 2 |
| 2FKG | BORRELIA OUTER SURFACE PROTEIN A | X-ray diffraction | 6 | 4 |
| 2HHI | MYCOBACTERIUM TUBERCULOSIS IMMUNOGENIC PROTEIN | Solution NMR | 4 | 1 |
| 2JMH | MITE ALLERGEN BLO T 5 | Solution NMR | 17 | 3 |
| 2OG3 | SARS CORONAVIRUS NUCLEOCAPSID PROTEIN | X-ray diffraction | 3 | 3 |
| 2OKK | GLUTAMIC ACID DECARBOXYLASE [GAD65) AUTOANTIGEN | X-ray diffraction | 5 | 3 |
| 2QUO | HEAT-LABILE ENTEROTOXIN B CHAIN | X-ray diffraction | 1 | 1 |
| 2SAK | STAPHYLOKINASE | X-ray diffraction | 3 | 2 |
| 2SNS | STAPHYLOCOCCAL THERMONUCLEASE PRECURSOR | X-ray diffraction | 1 | 1 |
| 2VC4 | RICIN TOXIN A CHAIN | X-ray diffraction | 7 | 2 |
| 2VUA | BOTULINUM NEUROTOXIN HEAVY CHAIN | X-ray diffraction | 33 | 5 |
| 2Z9T | BETA-2-MICROGLOBULIN | X-ray diffraction | 3 | 2 |
| 2ZB6 | HEMAGGLUTININ PROTEIN | X-ray diffraction | 38 | 3 |
| 3BLG | BETA-LACTOGLOBULIN ALLERGEN | X-ray diffraction | 27 | 11 |
| 3SEB | STAPHYLOCOCCAL ENTEROTOXIN B | X-ray diffraction | 3 | 3 |
| 4TSS | TOXIC SHOCK SYNDROME TOXIN-1 | X-ray diffraction | 3 | 3 |
| 8LYS | HEN EGG WHITE LYSOZYME | X-ray diffraction | 2 | 2 |
Continuous epitopes are preferentially represented given that 901 continuous epitope sequences are shown versus 56 discontinuous ones. The accessibility of epitopic residues is based on two parameters: the RSA and PI of each amino acid in the protein sequence. The RSA and PI values have then been divided according to their inclusion in structures where continuous epitopes have been identified and/or discontinuous epitopes have been resolved and compared based on their presence within epitopes.
3.2. Relative surface exposure of epitopic and non-epitopic amino acids
The datasets display different distributions (Fig. 1 ). First, no obvious differences were found between distributions of the RSA and PI values of continuous epitopic elements when compared to non-epitopic values (Fig. 1a and b). Moreover, the amino acids of continuous epitopes were not expected to be predominantly ranked among the classes of less relative accessibility or protrusion values, around 50% and 70% respectively.
Fig. 1.
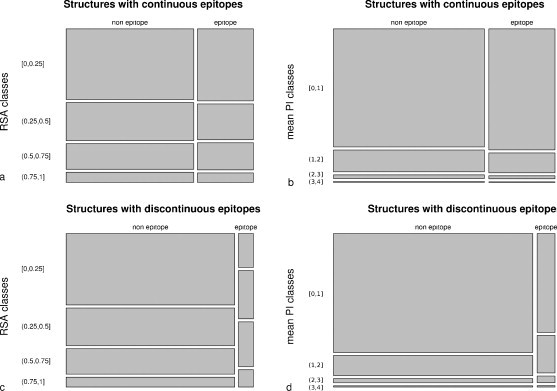
Treemaps of the relationship between the amino acid accessibility values and their presence within epitopes considering the epitope type (continuous, discontinuous) and the calculation mode (RSA, PI). The treemap consists of a square, which is divided first into horizontal bars whose widths are proportional to the number of amino acids whether or not they have been described within epitopes. Each bar is then split vertically according to the amino acid values for accessibility.
On the contrary, amino acids from discontinuous epitopes are distributed differently as compared to their non-epitopic neighbours and display a range of values representing exposed or protruding residues (Fig. 1c and d). The distinction between these two distributions was confirmed using the chi-squared test with p-values less than 2.2 × 10⁻¹⁶ for RSA and PI classes where the inter-dependency of variables could be confidently rejected. Nevertheless, no clear-cut classification of epitopic and non-epitopic values could be statistically achieved.
The RSA and PI values were then studied across protein sequences (Fig. 2, Fig. 3 ). A short overview of the resulting graphs confirms that no threshold distinguishes epitopes as surface exposed elements because their exposure varies from zero to some of the maximum values. In addition, it appears that epitope sequences often entirely cover the molecules (Fig. 2). This representation along the sequence is not representative of discontinuous epitopes. However, even though residues of discontinuous epitopes do not appear in the appropriate order, i.e., according to their spatial coordinates, the hypothesis of epitope exposure suggests that they should be located primarily on the molecule's surface, which is not actually the case (Fig. 3).
Fig. 2.
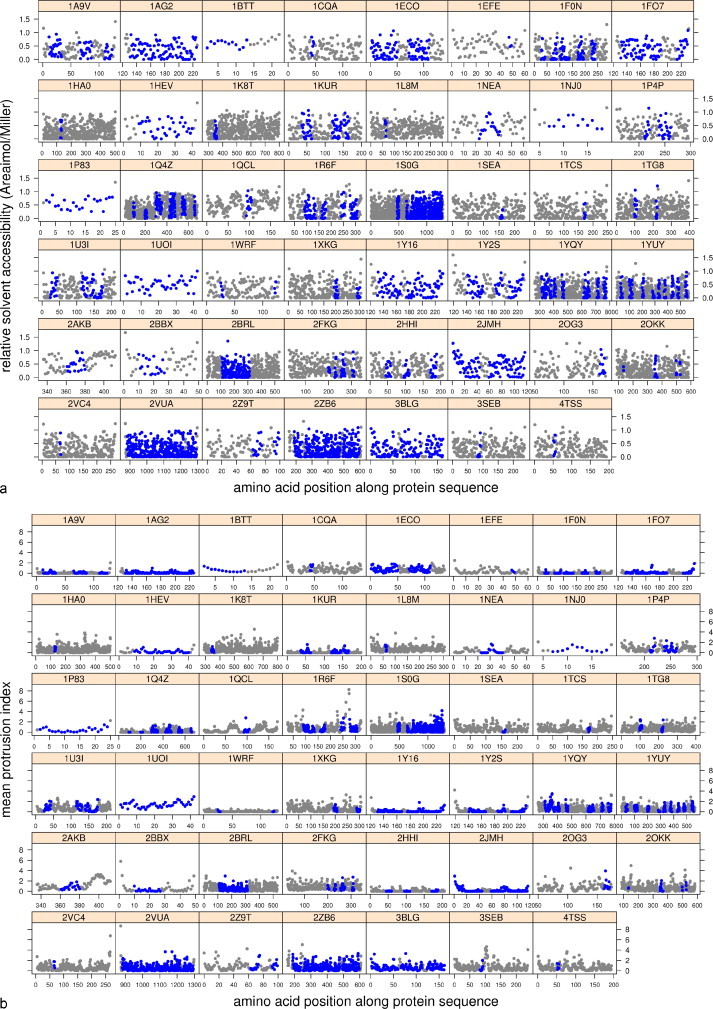
Distribution of RSA (a) and PI (b) of amino acids along the protein sequences where continuous epitopes have been identified (blue spot indicates an epitopic residue).
Fig. 3.
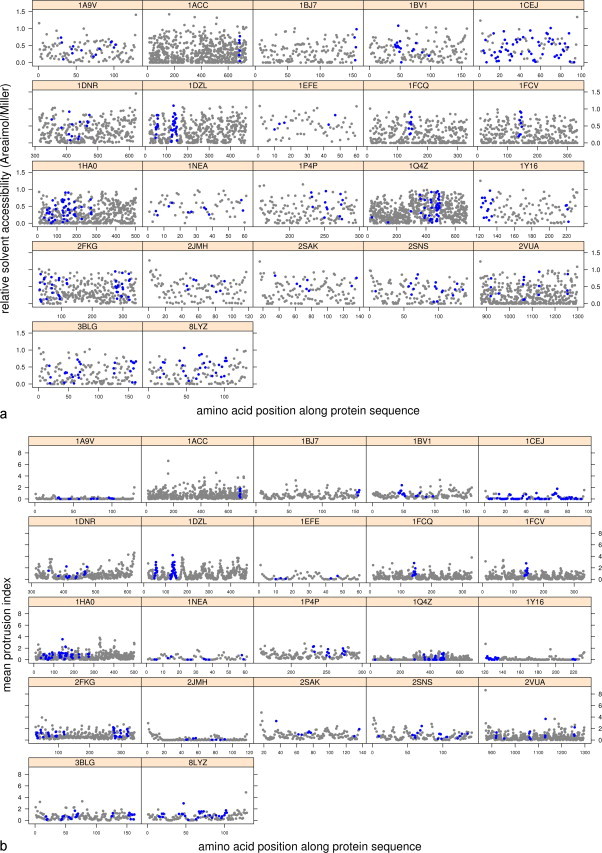
Distribution of RSA (a) and PI (b) of amino acids along the protein sequences where discontinuous epitopes have been identified (blue spot indicates an epitopic residue).
We have also compared distributions on the surface of individual epitopic areas. Again, our data do not show any unique characteristic property. More precisely, the exposure values of both continuous and discontinuous epitope subsets reveal some contradictions from one structure to another (e.g., 1SEA vs 1NEA; Fig. 2) from one epitope to another within a single structure (2OKK, 1XKG and 1Q4Z; Fig. 2) or according to the type of epitope (1NEA; Fig. 2 vs Fig. 3). Comparisons made between the RSA and the mean PI distributions of each structure along their sequence reveals the same tendency. However, the PI seems to better represent the shape of the protein surface because that value takes into account the surrounding atoms. Thus, the epitopic amino acids displaying more than 50% of RSA (i.e., a ratio greater than 0.5) do not systematically appear as prominent areas on the molecule's surface; the structures of 2BBX (Fig. 2), 1EFE and 2JMH (Fig. 3) are some examples of this result.
The almost complete coverage of epitopes all along some of the sequences was also surprising. As such, the relationship between the number of bibliographic references and the overlapping of the identified epitopes was examined on several structures and the results are presented in Fig. 4 . The 2VUA structure represents the A type botulinum enterotoxin heavy chain and four bibliographic references report epitopes. The 3BLG structure represents a milk allergen for which nine references report identified epitopes. The 2ZB6 structure represents a fragment of the measles hemagglutinin protein referred to in seven references. Finally, the 1AG2 structure represents a fragment of a prion protein where epitopes have been collected from 10 references. The domains corresponding to the structures of 2VUA and 2ZB6 are responsible for the binding of the toxins to cells and are therefore studied in immunotherapy contexts. With the exception of the 2VUA structure, some areas of protein sequences seem more frequently identified in the literature as belonging to an epitope. For instance, there appear to be epitope “hot spots” around position 250 for 2ZB6, around the positions 140, 150 and 220 for 1AG2 and at the positions around 60 and 150 for 3BLG. Comparing these locations to peaks in the protrusion index demonstrates a nice correlation for the 2ZB6 structure. Unfortunately, this site also corresponds to an unresolved gap in the 3D structure between positions 239 and 247. Finally, the identification frequencies do not regularly match to a high Protrusion Index value for the structures. Examples of this can be seen for 1AG2 (position 180) and 3BLG (position 150).
Fig. 4.
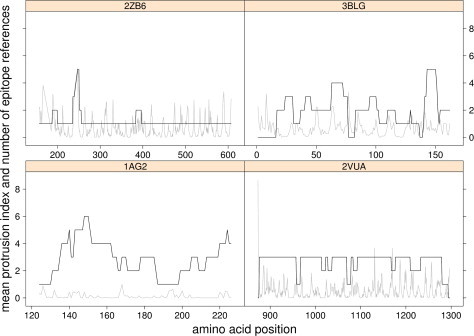
Number of epitope identification references related to each amino acid along the protein sequences (black line) and their mean protrusion index (grey line).
4. Discussion
Antigen surface exposure of epitopes is commonly thought to be necessary, although not sufficient, for antibody binding. In order to evaluate the average level of exposure for a given epitope, a generic approach has been applied to a set of diverse antigens for which epitopes have been experimentally identified and collected from the IEDB database. This approach involves comparing the accessibility values of epitope residues to the remaining elements of the molecules. Two numeric values have been calculated: the RSA, representing the residue accessibility in terms of exposed surface, and the PI, representing its distance from the overall shape of the proteins. Comparing the RSA and PI results, the distributions of amino acids into classes of values or protein surface profiles are similar. More precisely, it appears that the amino acids within epitopes are not distributed above any threshold for either RSA or PI values. Moreover, they cannot be classified into any specific range of accessibility values, since the epitope distribution is equivalent to any other fragment of the structures. These observations suggest that this approach could not be used to help describe potential epitopes or to locate unknown epitopes.
These findings were not expected. Thus the relevance of our approach and the quality of the datasets were carefully examined before attempting to make any assumption.
4.1. Accessibility computations
RSA is often evaluated by the mean of a threshold, classifying the amino acids into either buried or exposed states. Some authors recommend that this threshold be set at 5% (Ahmad et al., 2003, Rubinstein et al., 2008). In our study, this threshold would have classified almost all of the amino acids as exposed. Therefore, surface ratio values have been preferred to exposure percentages, because terminal amino acids often display higher values. Some residues have a value greater than 1 when they occur in sharp turns, when they have unusual conformations or when they are chain termini with free amino or carboxylate groups. These features add to the ASA values of such residues (Jacob and Unger, 2007, Miller et al., 1987). Terminal amino acids also display high PI values.
The RSA is one of the most important attributes that can be used to facilitate and enhance the overall protein structure prediction in fold recognition or de novo folding simulations. Likewise, RSA predictions can be used to filter out misfolded models. Learning methods applied to the RSA prediction from protein sequences seem more accurate when the “casting” threshold of training datasets is set to 25%, a more discriminating factor than 5% (Ahmad and Gromiha, 2002, Pollastri et al., 2002, Wagner et al., 2005). This threshold might be efficient in the case of discontinuous epitopes but seems inappropriate for short protein sequences (1BTT, 1NJ0, 1P83, 2AKB, 1UOI and perhaps 2BBX), which are less folded or more extended.
Another way to characterise the accessibility of epitope constituents is to compute the accessible surface area of amino acids using a large spherical probe of 10 Å, representing the antibody binding domain size as described by Novotný et al. (1986) on myoglobin and cytochrome c. In view of our results, epitopic residues that are weakly accessible to solvent, modelled by a small ball of 1.4 Å in diameter, have little chance to be accessible to an antibody binding domain.
4.2. Quality of the datasets
Despite some uncertainty regarding whether specific three-dimensional structures are representative of antigenic forms, the sequence overlapping by epitopes, particularly continuous epitopes, remains an issue for consideration. Assuming that the experimental protocols vary in their precision level, reported continuous epitopes may also include some discontinuous epitope pieces. Epitope sequences longer than 20 amino acids have been removed from our analysis as being less informative and therefore less precise estimates of epitope localisation. The precision level is a stronger consideration for immunotherapy or vaccine developments than for the development or implementation of diagnostic tools. Consequently, this gives rise to a multiplicity of identification techniques, as illustrated in our epitope dataset by more than 30 different assay types (and more may be referred to in IEDB). Sometimes the same technique yields different results. As an example, epitope mapping of a midge allergen (Chi t 1.01) by immunoassays with different synthetic peptide lengths has localised epitopes to different areas (van Kampen et al., 2001). It has already been noted that uncontrolled events appear throughout the binding assays and may generate partially misleading results (Albrecht et al., 2009, Van Regenmortel, 2006). Some of the molecules used for immunisation have become denatured before or after being injected into the animal or may become denatured by adsorption to plastic when used in solid phase immunoassays. Fragments of the native protein may then cross react with antibodies. Likewise, an antibody will not recognise a peptide in the same manner when it is free in solution or adsorbed onto a solid phase.
4.3. Proposed hypotheses
The inability to characterise an epitope on the basis of amino acid surface exposure brings us to the following assumptions:
-
-
Since there is no threshold value that distinguishes epitopic from non-epitopic residues, further analyses should attempt to identify particular antigenic 3D shapes.
-
-
Alternatively, epitopes may be present anywhere on the antigenic molecule such that surface exposure should not be considered an intrinsic feature of all epitopes, as suggested by Ponomarenko and Bourne (2007) and Van Regenmortel (1996).
The first hypothesis comes from the observation that the discontinuous epitopes seemed spread over some exposed classes of RSA and PI values. Actually, only a few residues would be accessible to antibodies regardless of epitope type, which can be characterised by a protrusion index peak along this specific area. This repartition of accessibility values complies with the epitope definition as a group of amino acids that are more or less contiguous, where one part interacts with antibodies and is exposed on the surface and the other part contributes to the spatial conformation of the group and could be buried within the structure. The exposed residues would form points of contact with the antibody-binding domain and are best observed in our computations on discontinuous epitopes because these elements are used to identify antigenic determinants by X-ray crystallography.
Considering the second hypothesis, the epitope localisation would be related to the volume of data collected from the literature. It is tempting to associate the number of covered antigen sequences and the number of identified epitopes of each type. We can note that the discontinuous epitopes are less numerous and the number of structures in which they have been successfully mapped further reduces this dataset. The identification of discontinuous epitopes often comes from the interaction of a monoclonal antibody with the antigen, which represents only one potential interaction among a mass of others. The limited number of known discontinuous epitopes or of Ab–Ag complex structures could partly explain the poor performance of current prediction tools obtained from Ponomarenko and Bourne's benchmark (2007). In contrast, the identification of continuous epitopes requires less expensive methods and are therefore more frequently used, resulting in an increase in the number of continuous epitopes identified. By extension, the sequences covered could reflect the antibody diversity coming from different pools of sera used by the different research teams. No distinctions between major vs minor epitopes have been introduced in the present work. Such distinctions would imply an epitope hierarchy, which does not lend itself to a generic treatment of the dataset. Moreover, such information is not systematically provided by authors and is not always available.
The focus on four examples by examining how frequently each amino acid of the protein sequence has been identified within a continuous epitope would not favour one assumption over another, since they do not display the same profile. However, in two cases (2ZB6 and 1AG2), a tight link could be observed by the superimposition of protrusion index peaks with some peaks of reference numbers. On the contrary, the structure of 3BLG, an ingested allergen, does not display such correspondence. This example highlights the problem of antigenic structure, since an ingested allergen would undergo several denaturation steps during the digestion process (pH changes, digestive enzymes activity). One could argue that its epitopes would not be exposed on the native protein surface. Unfortunately, another structure representing an inhaled allergen, the house dust mite 1XKG, does not contain any more exposed epitopes despite being exempt from the digestion process.
5. Conclusions
In conclusion, our work did not confirm the requisite for B-cell epitopes to be exposed on surface. Indeed, it indicates that the level of surface exposure has no discriminatory ability. As such, it would be difficult to include it as a parameter for any prediction system.
However, the presence of epitopes all along several antigenic sequences appears more disconcerting. Apparently the epitope identification method depends on a well-defined context. Specificity and binding affinity seem important for immunotherapy studies, while major epitopes seem more relevant for the development of diagnostic tools. The data relative to the size of epitopes and the antibody affinities may not be directly compared from one approach to another. For instance, is an epitope that can be bound by many polyclonal antibodies, i.e., those that are able to react with many patients’ sera, structurally equivalent to one that is able to bind a monoclonal antibody?
Beyond the type distinction (continuous vs discontinuous epitope types), it could be helpful to take this well-defined context into account when compiling datasets through the use of a dedicated terminology. Such measures would enlarge the existing immune epitope ontology, which would be important before applying any generic approach to structural description.
Acknowledgements
This work was supported by the ANR (PREDEXPITOPE, ANR-08-ALIA-14).
References
- Ahmad S., Gromiha M.M. NETASA: neural network based prediction of solvent accessibility. Bioinformatics. 2002;18:819–824. doi: 10.1093/bioinformatics/18.6.819. [DOI] [PubMed] [Google Scholar]
- Ahmad S., Gromiha M.M., Sarai A. Real value prediction of solvent accessibility from amino acid sequence. Proteins. 2003;50:629–635. doi: 10.1002/prot.10328. [DOI] [PubMed] [Google Scholar]
- Albrecht M., Kühne Y., Ballmer-Weber B.K., Becker W., Holzhauser T., Lauer I., Reuter A., Randow S., Falk S., Wangorsch A., Lidholm J., Reese G., Vieths S. Relevance of IgE binding to short peptides for the allergenic activity of food allergens. J. Allergy Clin. Immunol. 2009;124:328–336. doi: 10.1016/j.jaci.2009.05.031. 336.e1–6. [DOI] [PubMed] [Google Scholar]
- Belnap D.M., Watts N.R., Conway J.F., Cheng N., Stahl S.J., Wingfield P.T., Steven A.C. Diversity of core antigen epitopes of hepatitis B virus. Proc. Natl. Acad. Sci. U. S. A. 2003;100:10884–10889. doi: 10.1073/pnas.1834404100. [DOI] [PMC free article] [PubMed] [Google Scholar]
- Blythe M.J., Flower D.R. Benchmarking B cell epitope prediction: underperformance of existing methods. Protein Sci. 2005;14:246–248. doi: 10.1110/ps.041059505. [DOI] [PMC free article] [PubMed] [Google Scholar]
- Cocco R.R., Järvinen K., Sampson H.A., Beyer K. Mutational analysis of major, sequential IgE-binding epitopes in alpha s1-casein, a major cow's milk allergen. J. Allergy Clin. Immunol. 2003;112:433–437. doi: 10.1067/mai.2003.1617. [DOI] [PubMed] [Google Scholar]
- da Silva A.N.M.R., Nascimento E.J.M., Cordeiro M.T., Gil L.H.V.G., Abath F.G.C., Montenegro S.M.L., Marques E.T.A. Identification of continuous human B-cell epitopes in the envelope glycoprotein of dengue virus type 3 (DENV-3) PLoS One. 2009;4:e7425. doi: 10.1371/journal.pone.0007425. [DOI] [PMC free article] [PubMed] [Google Scholar]
- David F.P.A., Yip Y.L. SSMap: a new UniProt-PDB mapping resource for the curation of structural-related information in the UniProt/Swiss-Prot Knowledgebase. BMC Bioinformatics. 2008;9:391. doi: 10.1186/1471-2105-9-391. [DOI] [PMC free article] [PubMed] [Google Scholar]
- Dolimbek B.Z., Steward L.E., Aoki K.R., Atassi M.Z. Immune recognition of botulinum neurotoxin B: antibody-binding regions on the heavy chain of the toxin. Mol. Immunol. 2008;45:910–924. doi: 10.1016/j.molimm.2007.08.007. [DOI] [PubMed] [Google Scholar]
- El-Manzalawy Y., Dobbs D., Honavar V. Predicting linear B-cell epitopes using string kernels. J. Mol. Recognit. 2008;21:243–255. doi: 10.1002/jmr.893. [DOI] [PMC free article] [PubMed] [Google Scholar]
- Emini E.A., Hughes J.V., Perlow D.S., Boger J. Induction of hepatitis A virus-neutralizing antibody by a virus-specific synthetic peptide. J. Virol. 1985;55:836–839. doi: 10.1128/jvi.55.3.836-839.1985. [DOI] [PMC free article] [PubMed] [Google Scholar]
- García-Casado G., Pacios L.F., Díaz-Perales A., Sánchez-Monge R., Lombardero M., García-Selles F.J., Polo F., Barber D., Salcedo G. Identification of IgE-binding epitopes of the major peach allergen Pru p 3. J. Allergy Clin. Immunol. 2003;112:599–605. doi: 10.1016/s0091-6749(03)01605-1. [DOI] [PubMed] [Google Scholar]
- Haste Andersen P., Nielsen M., Lund O. Prediction of residues in discontinuous B-cell epitopes using protein 3D structures. Protein Sci. 2006;15:2558–2567. doi: 10.1110/ps.062405906. [DOI] [PMC free article] [PubMed] [Google Scholar]
- Jacob E., Unger R. A tale of two tails: why are terminal residues of proteins exposed? Bioinformatics. 2007;23:e225–e230. doi: 10.1093/bioinformatics/btl318. [DOI] [PubMed] [Google Scholar]
- Kabsch W., Sander C. Dictionary of protein secondary structure: pattern recognition of hydrogen-bonded and geometrical features. Biopolymers. 1983;22:2577–2637. doi: 10.1002/bip.360221211. [DOI] [PubMed] [Google Scholar]
- Lee B., Richards F.M. The interpretation of protein structures: estimation of static accessibility. J. Mol. Biol. 1971;55:379–400. doi: 10.1016/0022-2836(71)90324-x. [DOI] [PubMed] [Google Scholar]
- Levy R., Forsyth C.M., LaPorte S.L., Geren I.N., Smith L.A., Marks J.D. Fine and domain-level epitope mapping of botulinum neurotoxin type A neutralizing antibodies by yeast surface display. J. Mol. Biol. 2007;365:196–210. doi: 10.1016/j.jmb.2006.09.084. [DOI] [PMC free article] [PubMed] [Google Scholar]
- López-Torrejón G., Díaz-Perales A., Rodríguez J., Sánchez-Monge R., Crespo J.F., Salcedo G., Pacios L.F. An experimental and modeling-based approach to locate IgE epitopes of plant profilin allergens. J. Allergy Clin. Immunol. 2007;119:1481–1488. doi: 10.1016/j.jaci.2007.02.004. [DOI] [PubMed] [Google Scholar]
- Miller S., Janin J., Lesk A.M., Chothia C. Interior and surface of monomeric proteins. J. Mol. Biol. 1987;196:641–656. doi: 10.1016/0022-2836(87)90038-6. [DOI] [PubMed] [Google Scholar]
- Morgan W.D., Lock M.J., Frenkiel T.A., Grainger M., Holder A.A. Malaria parasite-inhibitory antibody epitopes on Plasmodium falciparum merozoite surface protein-1(19) mapped by TROSY NMR. Mol. Biochem. Parasitol. 2004;138:29–36. doi: 10.1016/j.molbiopara.2004.06.014. [DOI] [PubMed] [Google Scholar]
- Naik M.T., Chang C., Kuo I., Kung C.C., Yi F., Chua K., Huang T. Roles of structure and structural dynamics in the antibody recognition of the allergen proteins: an NMR study on Blomia tropicalis major allergen. Structure. 2008;16:125–136. doi: 10.1016/j.str.2007.10.022. [DOI] [PubMed] [Google Scholar]
- Novotný J., Handschumacher M., Haber E., Bruccoleri R.E., Carlson W.B., Fanning D.W., Smith J.A., Rose G.D. Antigenic determinants in proteins coincide with surface regions accessible to large probes (antibody domains) Proc. Natl. Acad. Sci. U. S. A. 1986;83:226–230. doi: 10.1073/pnas.83.2.226. [DOI] [PMC free article] [PubMed] [Google Scholar]
- Pacios L.F., Tordesillas L., Cuesta-Herranz J., Compes E., Sánchez-Monge R., Palacín A., Salcedo G., Díaz-Perales A. Mimotope mapping as a complementary strategy to define allergen IgE-epitopes: peach Pru p 3 allergen as a model. Mol. Immunol. 2008;45:2269–2276. doi: 10.1016/j.molimm.2007.11.022. [DOI] [PubMed] [Google Scholar]
- Padavattan S., Schirmer T., Schmidt M., Akdis C., Valenta R., Mittermann I., Soldatova L., Slater J., Mueller U., Markovic-Housley Z. Identification of a B-cell epitope of hyaluronidase, a major bee venom allergen, from its crystal structure in complex with a specific Fab. J. Mol. Biol. 2007;368:742–752. doi: 10.1016/j.jmb.2007.02.036. [DOI] [PubMed] [Google Scholar]
- Pintar A., Carugo O., Pongor S. CX, an algorithm that identifies protruding atoms in proteins. Bioinformatics. 2002;18:980–984. doi: 10.1093/bioinformatics/18.7.980. [DOI] [PubMed] [Google Scholar]
- Pollastri G., Baldi P., Fariselli P., Casadio R. Prediction of coordination number and relative solvent accessibility in proteins. Proteins. 2002;47:142–153. doi: 10.1002/prot.10069. [DOI] [PubMed] [Google Scholar]
- Ponomarenko J.V., Bourne P.E. Antibody–protein interactions: benchmark datasets and prediction tools evaluation. BMC Struct. Biol. 2007;7:64. doi: 10.1186/1472-6807-7-64. [DOI] [PMC free article] [PubMed] [Google Scholar]
- Ponomarenko J., Bui H., Li W., Fusseder N., Bourne P.E., Sette A., Peters B. ElliPro: a new structure-based tool for the prediction of antibody epitopes. BMC Bioinformatics. 2008;9:514. doi: 10.1186/1471-2105-9-514. [DOI] [PMC free article] [PubMed] [Google Scholar]
- Prabakaran P., Gan J., Feng Y., Zhu Z., Choudhry V., Xiao X., Ji X., Dimitrov D.S. Structure of severe acute respiratory syndrome coronavirus receptor-binding domain complexed with neutralizing antibody. J. Biol. Chem. 2006;281:15829–15836. doi: 10.1074/jbc.M600697200. [DOI] [PMC free article] [PubMed] [Google Scholar]
- Riemer A., Scheiner O., Jensen-Jarolim E. Allergen mimotopes. Methods. 2004;32:321–327. doi: 10.1016/j.ymeth.2003.08.010. [DOI] [PubMed] [Google Scholar]
- Robotham J.M., Hoffman G.G., Teuber S.S., Beyer K., Sampson H.A., Sathe S.K., Roux K.H. Linear IgE-epitope mapping and comparative structural homology modeling of hazelnut and English walnut 11S globulins. Mol. Immunol. 2009;46:2975–2984. doi: 10.1016/j.molimm.2009.06.020. [DOI] [PubMed] [Google Scholar]
- Robotham J.M., Teuber S.S., Sathe S.K., Roux K.H. Linear IgE epitope mapping of the English walnut (Juglans regia) major food allergen, Jug r 1. J. Allergy Clin. Immunol. 2002;109:143–149. doi: 10.1067/mai.2002.120558. [DOI] [PubMed] [Google Scholar]
- Rubinstein N.D., Mayrose I., Halperin D., Yekutieli D., Gershoni J.M., Pupko T. Computational characterization of B-cell epitopes. Mol. Immunol. 2008;45:3477–3489. doi: 10.1016/j.molimm.2007.10.016. [DOI] [PubMed] [Google Scholar]
- Saha S., Raghava G.P.S. Prediction of continuous B-cell epitopes in an antigen using recurrent neural network. Proteins. 2006;65:40–48. doi: 10.1002/prot.21078. [DOI] [PubMed] [Google Scholar]
- Schlessinger A., Ofran Y., Yachdav G., Rost B. Epitome: database of structure-inferred antigenic epitopes. Nucleic Acids Res. 2006;34:D777–D780. doi: 10.1093/nar/gkj053. [DOI] [PMC free article] [PubMed] [Google Scholar]
- Shrake A., Rupley J.A. Environment and exposure to solvent of protein atoms. Lysozyme and insulin. J. Mol. Biol. 1973;79:351–371. doi: 10.1016/0022-2836(73)90011-9. [DOI] [PubMed] [Google Scholar]
- Sordet C., Culerrier R., Granier C., Didier A., Rougé P. IgE-binding epitopic peptide mapping on a three-dimensional model built for the 13S globulin allergen of buckwheat (Fagopyrum esculentum) Peptides. 2009;30:1021–1027. doi: 10.1016/j.peptides.2009.03.005. [DOI] [PubMed] [Google Scholar]
- Sweredoski M.J., Baldi P. COBEpro: a novel system for predicting continuous B-cell epitopes. Protein Eng. Des. Sel. 2009;22:113–120. doi: 10.1093/protein/gzn075. [DOI] [PMC free article] [PubMed] [Google Scholar]
- Swoboda I., De Weerd N., Bhalla P.L., Niederberger V., Sperr W.R., Valent P., Kahlert H., Fiebig H., Verdino P., Keller W., Ebner C., Spitzauer S., Valenta R., Singh M.B. Mutants of the major ryegrass pollen allergen, Lol p 5, with reduced IgE-binding capacity: candidates for grass pollen-specific immunotherapy. Eur. J. Immunol. 2002;32:270–280. doi: 10.1002/1521-4141(200201)32:1<270::AID-IMMU270>3.0.CO;2-X. [DOI] [PubMed] [Google Scholar]
- Thornton J.M., Edwards M.S., Taylor W.R., Barlow D.J. Location of ‘continuous’ antigenic determinants in the protruding regions of proteins. EMBO J. 1986;5:409–413. doi: 10.1002/j.1460-2075.1986.tb04226.x. [DOI] [PMC free article] [PubMed] [Google Scholar]
- Tordesillas L., Pacios L.F., Palacin A., Quirce S., Armentia A., Barber D., Salcedo G., Diaz-Perales A. Molecular basis of allergen cross-reactivity: non-specific lipid transfer proteins from wheat flour and peach fruit as models. Mol. Immunol. 2009;47:534–540. doi: 10.1016/j.molimm.2009.07.028. [DOI] [PubMed] [Google Scholar]
- Toseland C.P., Clayton D.J., McSparron H., Hemsley S.L., Blythe M.J., Paine K., Doytchinova I.A., Guan P., Hattotuwagama C.K., Flower D.R. AntiJen: a quantitative immunology database integrating functional, thermodynamic, kinetic, biophysical, and cellular data. Immunome Res. 2005;1:4. doi: 10.1186/1745-7580-1-4. [DOI] [PMC free article] [PubMed] [Google Scholar]
- van Kampen V., Liebers V., Sander I., Chen Z., Baur X., Raulf-Heimsoth M., Falkenberg F.W. B-cell epitopes of the allergen Chi t 1.01: peptide mapping of epitopes recognized by rabbit, murine, and human antibodies. Allergy. 2001;56:118–125. doi: 10.1034/j.1398-9995.2001.056002118.x. [DOI] [PubMed] [Google Scholar]
- Van Regenmortel M.H.V. Mapping epitope structure and activity: from one-dimensional prediction to four-dimensional description of antigenic specificity. Methods. 1996;9:465–472. doi: 10.1006/meth.1996.0054. [DOI] [PubMed] [Google Scholar]
- Van Regenmortel M.H.V. Immunoinformatics may lead to a reappraisal of the nature of B cell epitopes and of the feasibility of synthetic peptide vaccines. J. Mol. Recognit. 2006;19:183–187. doi: 10.1002/jmr.768. [DOI] [PubMed] [Google Scholar]
- Vita R., Zarebski L., Greenbaum J.A., Emami H., Hoof I., Salimi N., Damle R., Sette A., Peters B. The immune epitope database 2.0. Nucleic Acids Res. 2010;38:D854–D862. doi: 10.1093/nar/gkp1004. [DOI] [PMC free article] [PubMed] [Google Scholar]
- Wagner M., Adamczak R., Porollo A., Meller J. Linear regression models for solvent accessibility prediction in proteins. J. Comput. Biol. 2005;12:355–369. doi: 10.1089/cmb.2005.12.355. [DOI] [PubMed] [Google Scholar]
- CCP4 The CCP4 suite: programs for protein crystallography. Acta Crystallogr. D: Biol. Crystallogr. 1994;50:760–763. doi: 10.1107/S0907444994003112. [DOI] [PubMed] [Google Scholar]