Abstract
Germinal center B cells (GCBCs) are critical for generating long-lived humoral immunity. How GCBCs meet the energetic challenge of rapid proliferation is poorly understood. Dividing lymphocytes typically rely on aerobic glycolysis over oxidative phosphorylation for energy. Here we report that GCBCs are exceptional among proliferating B and T cells as they actively oxidize fatty acids (FAs) and conduct minimal glycolysis. In vitro, GCBCs had a very low glycolytic extracellular acidification (ECAR) but consumed oxygen in response to FAs. [13C6]-glucose feeding revealed that GCBCs generate significantly less phosphorylated glucose and little lactate. Further, GCBCs did not metabolize glucose into TCA cycle intermediates. Conversely, [13C16]-palmitic acid labeling demonstrated that GCBCs generate most of their acetyl-CoA and acetylcarnitine from FAs. FA oxidation (FAO) was functionally important, as drug-mediated and genetic dampening of FAO resulted in a selective reduction GCBCs. Hence, GCBCs appear to uncouple rapid proliferation from aerobic glycolysis.
Introduction
With around 15–20% of germinal center B cells (GCBCs) being in S-phase at any given time1,2, germinal centers GCs are proliferative foci3 in which most high affinity memory B cells and long-lived plasma cells are formed4. Little is known about how the metabolic demand of proliferative GCBCs is met and how this relates to cellular fate of GCBCs. Regulation of metabolic pathways plays a critical role in fate decisions and functions of activated immune cells5–10. Given the key role the GC reaction plays in long-lived protective immunity, autoimmunity, and lymphomagenesis, it is of central importance to understand how metabolism is programmed in GCBCs.
In general, proliferative cells, including activated T cells, mainly ferment imported glucose into lactic acid rather than oxidizing it in the mitochondria, even in the presence of oxygen, a process termed aerobic glycolysis11. In contrast, mitochondrial metabolism is sufficient to maintain cellular functions in quiescent naive and memory T cells12. While direct metabolic measurements of ex vivo GCBCs have been lacking, two recent studies have reported relative hypoxia in the GC microenvironment13,14, a situation typically associated with glycolysis15. Functional studies in this work led to the conclusion that GCBCs may be glycolytic. However, for technical reasons, these functional studies mainly utilized in vitro activated B cells, rather than authentic GCBCs, and thus neither study directly probed the metabolic state of freshly isolated primary GCBCs. This is important, as in vitro activated B cells may not accurately represent GCBCs, given that these two cell types are transcriptionally and functionally distinct16,17.
To more clearly determine the metabolic profile of GCBCs, here we have used directly ex vivo bona fide GCBCs and appropriate in vivo-generated proliferating B cell controls to evaluate GCBC metabolism using multiple methods. This direct examination of GCBCs showed that they minimally utilize aerobic glycolysis and instead use FA to conduct oxidative phosphorylation (OXPHOS), which engages both mitochondria and peroxisomes. We further showed, using both inhibitor and genetic approaches, that optimal GCBC development and survival depend on FAO both in vivo and in vitro.
Results
Highly proliferative GCBCs are non-glycolytic
We used an established system to generate populations of hapten-specific responding B cells so that we could compare in vivo generated GCBCs to similarly proliferative in vivo-generated non-GCBCs and in vitro activated control B cells (Extended Data Fig. 1). We then purified those cells and examined their metabolic activity as well as function. The untouched bead-based purification procedures we used resulted in high viability of all analyzed cell types throughout experimental procedures (Extended Data Fig. 2). In line with our finding that GCBCs retain high viability in the cultures we used, others have found that bead-isolated human GCBCs show over 90% viability after 1 h culture without stimulation18 and that viable GCBCs can be maintained in vitro without stimulation19. Despite the highly proliferative nature of GCBCs, these cells had a very low glycolytic extracellular acidification rate (ECAR) when measured directly ex vivo, which reflects the production of lactate from pyruvate during glycolysis (Fig. 1a). In contrast, as expected, activated T cells had a high ECAR20 and in vitro- or in vivo–activated non-GCBCs B cells also displayed high ECAR (Fig. 1a), consistent with prior reports21,22. In addition to validating GCBC viability throughout entire Seahorse XFe96 assays (Extended Data Fig. 2), we verified that GCBCs maintain their gene expression profile and therefore their identity throughout experimental procedures (Extended Data Fig. 3). Therefore, the minimal ECAR detection in GCBCs was not due to lethality nor to cell-intrinsic changes during culture. GCBCs, unlike activated T or activated non-GC B cells, also did not acidify the media significantly more than resting naive B cells (NBCs) when exposed to glucose (Fig. 1b) indicative of absence of active glycolysis. Addition of oligomycin, an inhibitor of ATP synthase and a stimulator of maximal glycolysis, revealed that GCBCs also possessed little glycolytic reserve, suggesting these cells had very low functional glycolytic capability, even when stimulated to engage this metabolic pathway (Fig. 1b, right). Taken together these results indicate that GCBCs are only minimally glycolytic.
Fig. 1: GCBCs perform oxphos but not aerobic glycolysis.
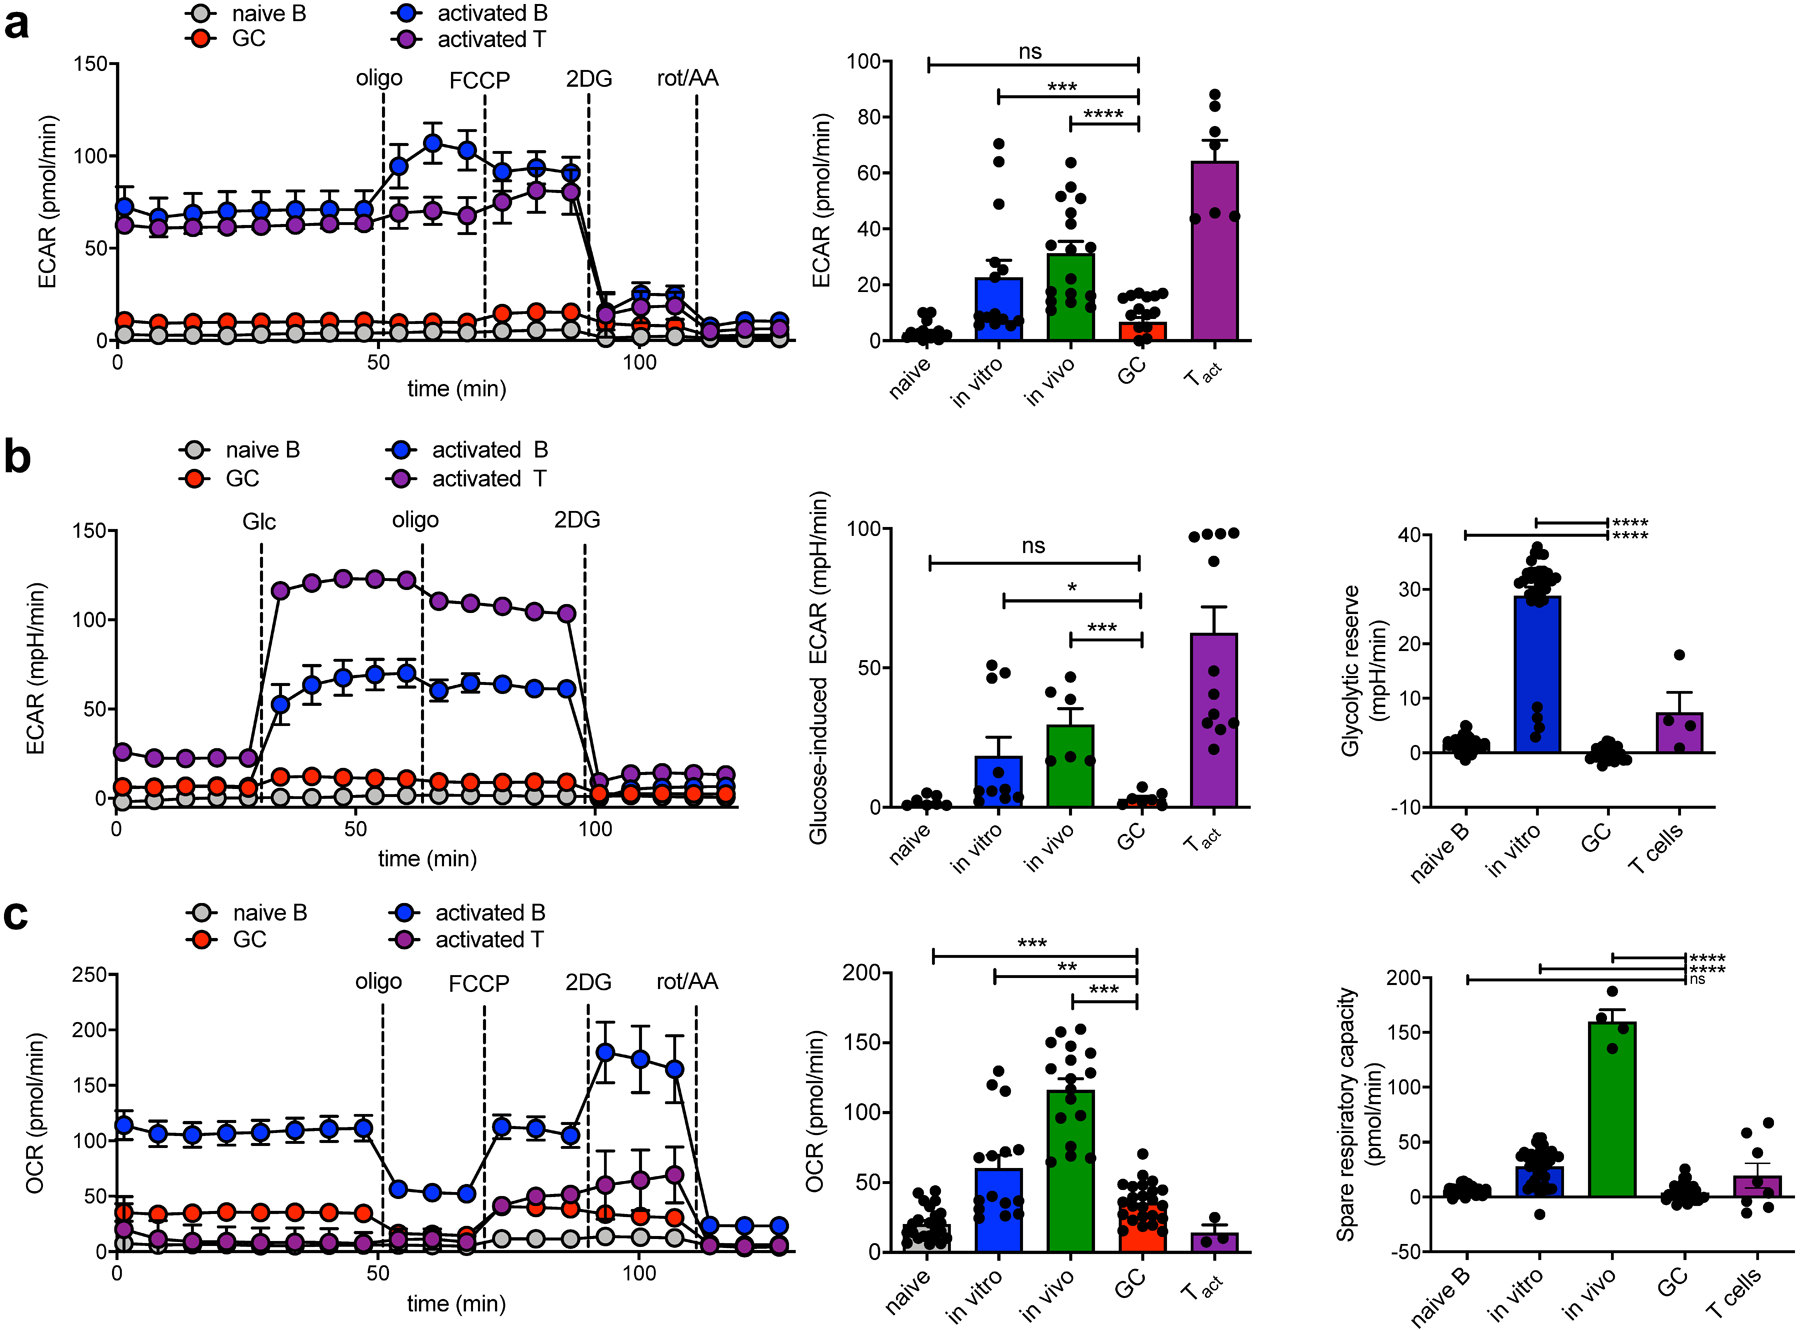
a, Representative trace (left) and mean data (right) of extracellular acidification rate (ECAR). Values are averages of 5–8 basal ECAR measurements minus average of 3–5 ECAR readings after 2DG treatment of individual wells from indicated cell types subjected to a mitochondrial stress test in the Seahorse XFe96 flux analyzer. See Extended Data Fig. 1 for preparation of these cells. b, Representative trace (left) and mean data (center) of glycolytic ECAR when assayed in minimal media and treated with glucose in-Seahorse. Values are averages of 5 ECAR measurements after glucose stimulation minus averages of 5–8 basal ECAR readings of individual wells from indicated cell types. Glycolytic reserve (right) is the difference between glycolytic capacity and glycolysis rate and was measured as the difference between resulting ECAR values after in-Seahorse exposure to glucose and maximal ECAR values obtained after Oligomycin treatment. c, Representative trace (left) and mean data (center) of oxygen consumption rate from cells as in (a). Values are averages of 5–8 basal OCR measurements minus averages of 3–5 OCR readings after rot/AA treatment of individual wells from indicated cell types. Spare respiratory capacity is the difference between basal OCR values and maximal OCR values obtained after FCCP uncoupling (right). Results are representative of (for sample data) or represent the mean of 3–6 independent experiments. Bars represent mean +/− SEM; ns = not significant; *p ≤ 0.05; **p ≤ 0.01; ***p ≤ 0.001; ****p ≤ 0.0001 by unpaired, two-tailed t-test.
In contrast, GCBCs displayed 2–3–fold higher oxygen consumption rate (OCR) compared to NBCs (Fig. 1c). As expected, activated T cells had a very low OCR while activated B cells had a robust ECAR and OCR. Notably, activated T and B cells, but not GCBCs, demonstrated spare respiratory capacity (Fig. 1c, right), suggesting that GCBCs were maximally using their mitochondria to conduct OXPHOS.
GCBCs oxidize both endogenous and exogenous FA
The inhibitor etomoxir blocks carnitine palmitoyltransferase I (CPT1)-mediated FA import into mitochondria23, though it has recently been reported to have off-target effects at high concentrations (200 μM24). 40 μM Etomoxir – a dose consistent with selective CPT1 inhibition – significantly reduced OCR in GCBCs, as well as in other cell types analyzed (Fig. 2a), indicative of a mitochondrial contribution to FAO.
Fig. 2: GCBCs rely on FAO.
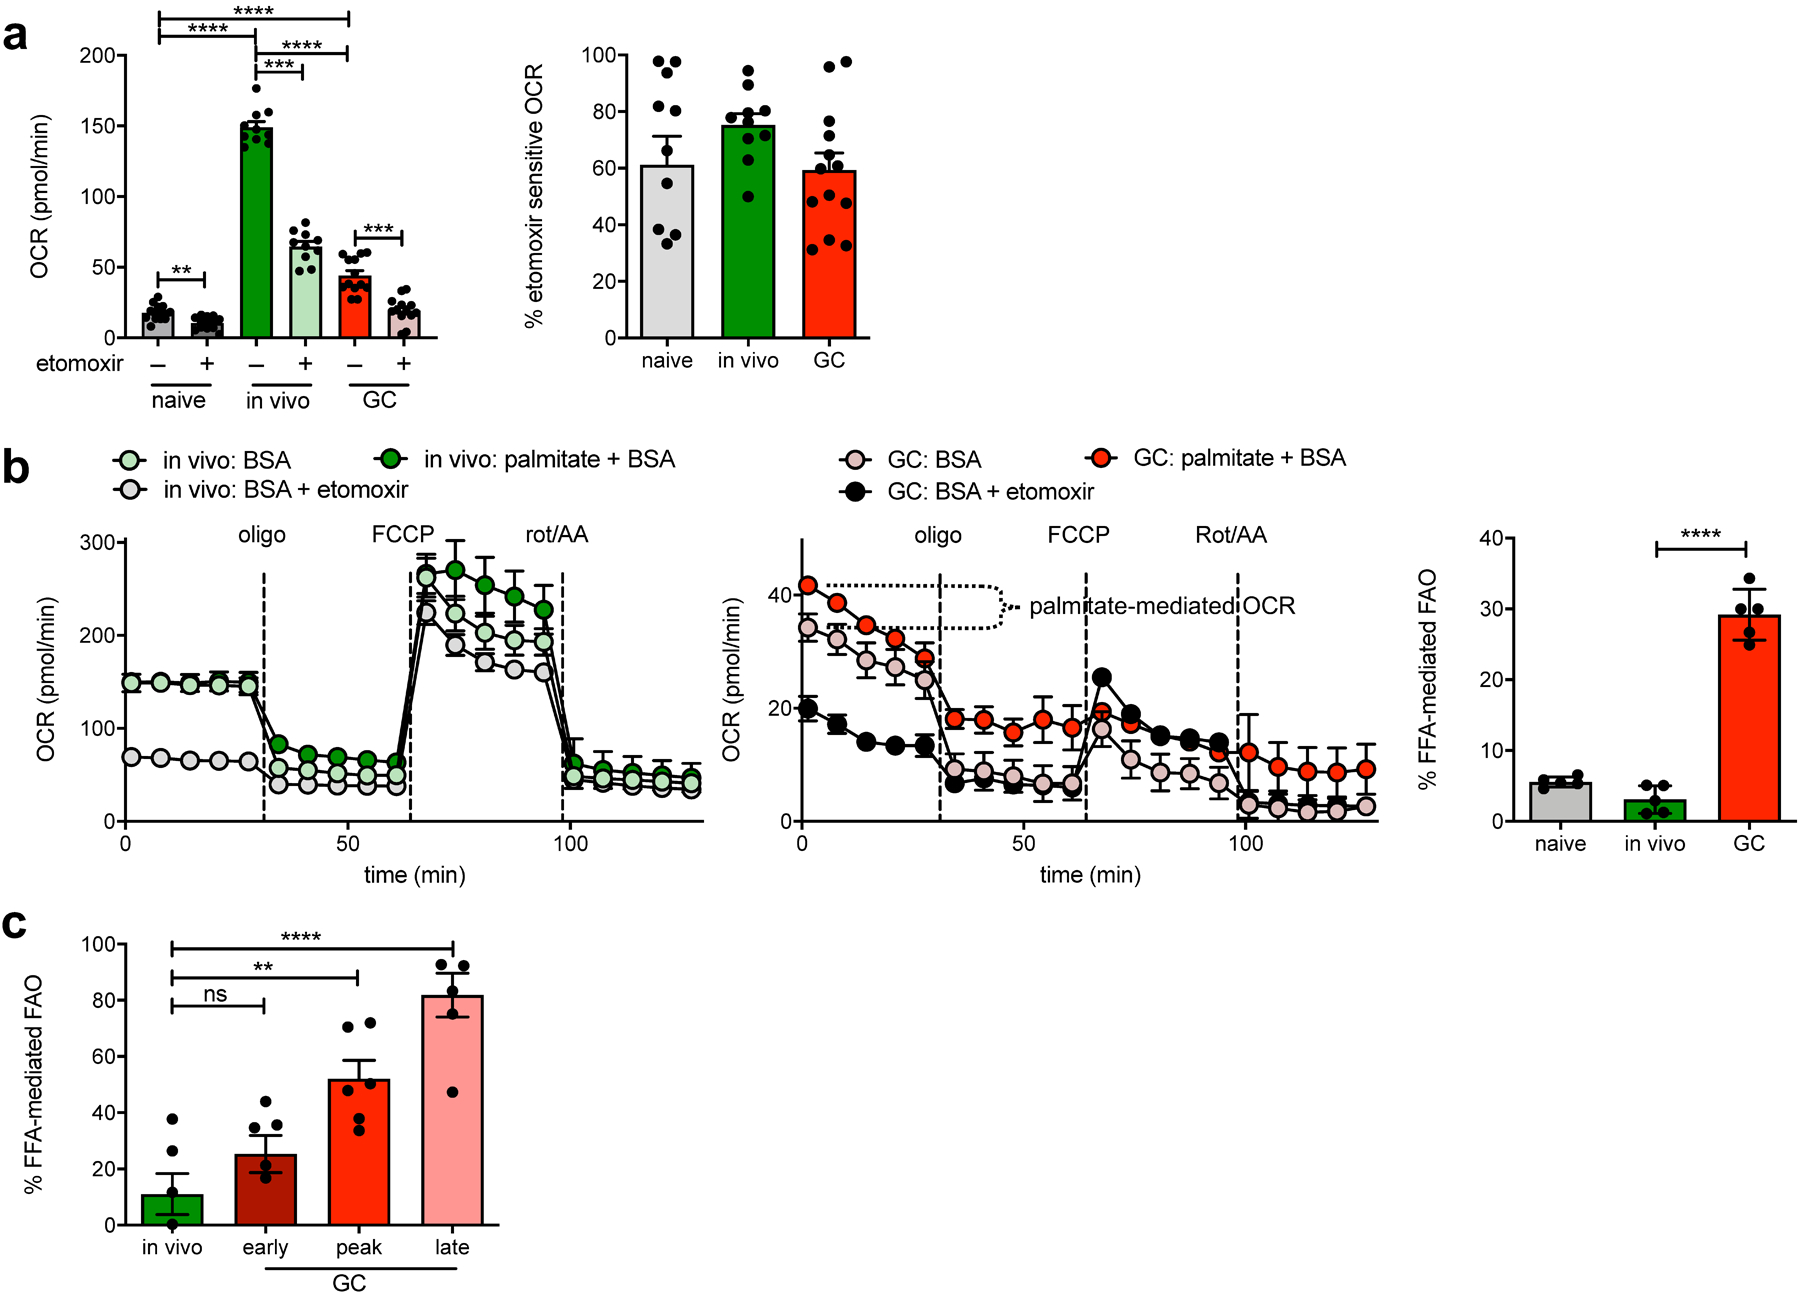
a, Measurement of basal OCR values of naive, in vivo–activated or GCBCs, prepared as in Extended Data Fig. 1 and treated with 40uM etomoxir or its vehicle prior to analysis. Raw OCR values (left) from multiple experiments and proportion of total OCR that is etomoxir-sensitive (right; calculated as: [etomoxir inhibited OCR – rotenone/AA OCR] / [basal OCR – rotenone/AA OCR]). b, Representative OCR trace of in vivo activated (left) or GCBCs pre-treated with etomoxir or its vehicle control (center). Symbols are means of three replicate wells and error bars are +/− SEM. Traces marked “palm+BSA” were from wells with added palmitate-conjugated BSA, used to identify the contribution of exogenous fatty acids to etomoxir-sensitive oxygen consumption. Right: Tabulated data that indicate percent contribution of palmitate to etomoxir-sensitive OCR (calculated as: OCRpalm - OCRBSA / OCRpalm - OCReto). c, Percent of FFA-mediated OCR that was stimulated by palmitate addition to in vivo activated or early (d8), peak (d13) and late (d23) GCBCs (calculated as in right of (b)). Bars represent mean +/− SEM; *p ≤ 0.05; **p ≤ 0.01; ***p ≤ 0.001; ****p ≤ 0.0001 by unpaired, two-tailed t-test.
To investigate the sources of fatty acids (FAs) used by GCBCs we measured OCR after addition of exogenous palmitic acid to minimal media. GCBCs, but not activated B cells, increased OCR in the presence of exogenous FAs (Fig. 2b); hence GCBCs use both endogenous (as reflected by OCR in the absence of added FAs) and exogenous FAs as energy sources. Notably, reliance on exogenous FAs increased substantially with GC maturation, such that GCBCs from the latest time point studied (d23) derive ~80% of their FAO potential from exogenous FAs (Fig. 2c). These finding suggests that over time GCBCs exhaust their endogenous FA stores.
GCBCs take up exogenous FFA but only minimal exogenous glucose
We administered the fluorescent glucose analog 2-Deoxy-2-[(7-nitro-2,1,3-benzoxadiazol-4-yl)amino]-D-glucose (2-NBDG) to mice for 35 min to measure cellular uptake under physiological conditions. Since GCBCs are larger than NBCs but smaller than in vivo- (Fig. 3a, right) or in vitro–activated B cells (Extended Data Fig. 4a), we normalized 2-NBDG fluorescence to cell size to control for this variable. Consistent with our findings that GCBCs display only minimal ECAR, GCBCs displayed only minimal uptake of 2-NBDG at any stage of the response (Fig. 3a and Extended Data Fig. 4b). Except NBCs, all analyzed cell populations – including GC T follicular helper cells (GC TFH) – displayed significantly higher 2-NBDG incorporation in vivo compared to GCBCs (Fig. 3a and Extended Data Fig. 4b). Activated B and CD4+ T cells also displayed higher uptake than GCBCs when exposed to 2-NBDG in culture (Extended Data Fig. 4a), in keeping with the high ECAR of these cells. Consistent with our finding that GCBCs respond to exogenous FAs with higher OCR, GCBCs express the FA transporter CD36 and bind the fluorescent fat probe BODIPY™ FL C16 in vivo (Extended Data Fig. 4d) and in vitro (Fig. 3b, Fig. Extended Data Fig. 4c–e). As flow cytometric analysis does not differentiate between uptake of fluorescent metabolites inside the cell or just binding to the surface, we assessed the cells by imaging cytometric analysis (Fig. 3a,b). We used the adaptive erode function to measure subcellular distribution of 2-NBDG fluorescence and BODIPY™ FL C16 (Fig. 3c,d). Interestingly, GCBCs displayed an even lower intracellular to surface ratio of 2-NBDG uptake compared to NBCs, indicative of high surface staining of 2-NBDG, without actual intracellular uptake (Fig. 3c and Extended Data Fig. 4f,h). In contrast, GCBCs and activated B cells not only displayed strong BODIPY™ FL C16 signal but also efficient uptake inside the cells (Fig. 3d and Extended Data Fig. 4g,h). These data indicate that GCBCs display only minimal uptake of glucose under physiological conditions in vivo.
Fig. 3. GCBCs uptake of glucose and FFA.
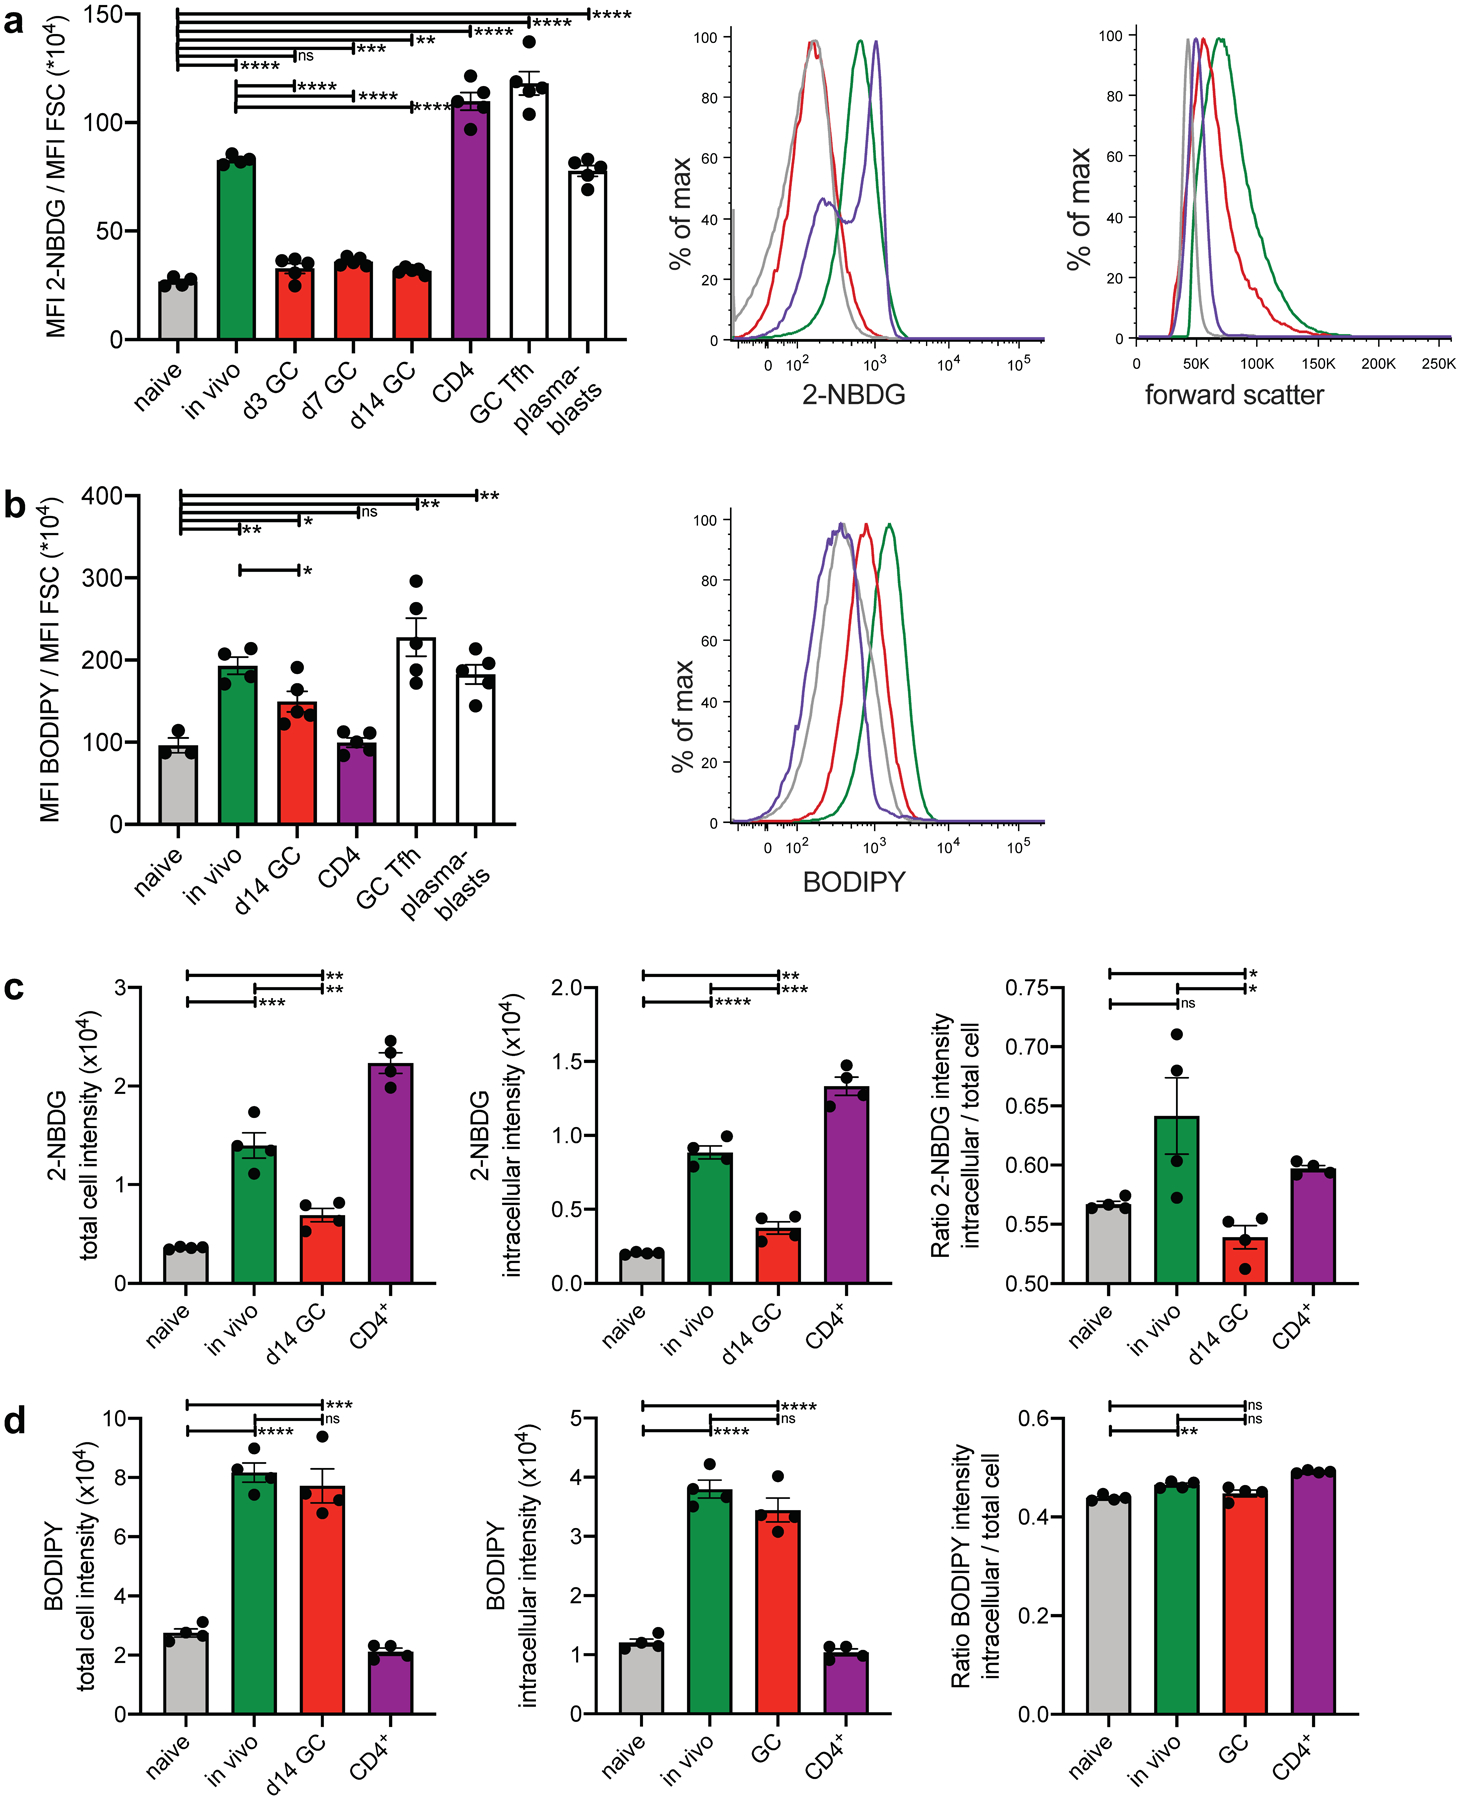
a, In vivo 2-NBDG uptake. Mice were injected with 2-NBDG then sacrificed 30min later and splenocytes analyzed by flow cytometry. Tabulated data of mean 2-NBDG fluorescence normalized to cell size (left); representative flow histograms of 2-NBDG fluorescence (center) and forward scatter (right) of naive, in vivo activated, and GCBCs, as well as CD4+ T cells. Colors of bars in left histograms correspond to group labels of flow histogram traces in center and right. Only d14 GC are shown in center and right. b, In vivo BODIPY uptake. Mice were injected with BODIPY™ FL C16 then sacrificed 60min later and splenocytes analyzed by flow cytometry. Tabulated data of mean BODIPY™ FL C16 fluorescence normalized to cell size (left) and representative flow histogram of BODIPY™ FL C16 fluorescence (right) of cells as in (a). c and d, cells treated as in (a) and (b) were analyzed by Amnis ImageStream to determine cellular location of the fluorescent probes. The adaptive erode function was used to generate masks encompassing the measurement of fluorescence of either the total cell (100% adaptive erode, left of c and d; see Extended Data Fig. 4g left for representative images) or only the inside of the cell (70% adaptive erode, middle of c and d; see Extended Data Fig. 4g right for representative images of adaptive erode function). The ratios of intracellular to total 2-NBDG (c) and BODIPY™ FL C16 (d) are plotted to the right. (a-d) One representative experiment is presented (results of independent experiments and representative Amnis ImageStream images are shown in Fig. S4). Bars represent mean +/− SEM; *p ≤ 0.05; **p ≤ 0.01; ***p ≤ 0.001; ****p ≤ 0.0001 by unpaired, two-tailed t-test.
GCBCs perform FAO in peroxisomes and mitochondria
Since etomoxir blocks only mitochondrial FA uptake, and etomoxir only partly suppressed OCR in GCBCs, we hypothesized that GCBCs might carry out non-mitochondrial FAO in peroxisomes25. Peroxisomes are known to catabolize long-chain FAs with the very first step of FAO being the conversion of FA into acyl-CoA. Consistent with this, imaging cytometry demonstrated a marked increase in peroxisomal content of GCBCs, as well as in activated B cells (Fig. 4a). To address whether these peroxisomes contributed to overall OCR of GCBCs or activated B cells, we used thioridazine, a selective inhibitor of peroxisomal FAO26. Thioridazine inhibited OCR in GCBCs to a markedly greater extent than it did in activated B cells (Fig. 4b). As expected, addition of etomoxir after thioridazine treatment led to a further reduction of OCR in GCBCs and also reduced OCR in activated B cells. Hence, GCBCs conduct both mitochondrial and peroxisomal FAO. Though activated B cells also induce peroxisomes, under the conditions studied they do not detectably use peroxisomes for energy as thioridazine did not reduce OCR in these cells. This finding is consistent with the lack of spare respiratory capacity in GCBCs, indicating maximal mitochondrial utilization whereas activated B cells have substantial spare respiratory capacity and thus may not require peroxisomal FAO to meet energy requirements.
Fig. 4. GCBCs upregulate and rely on peroxisomal FAO for oxygen consumption.
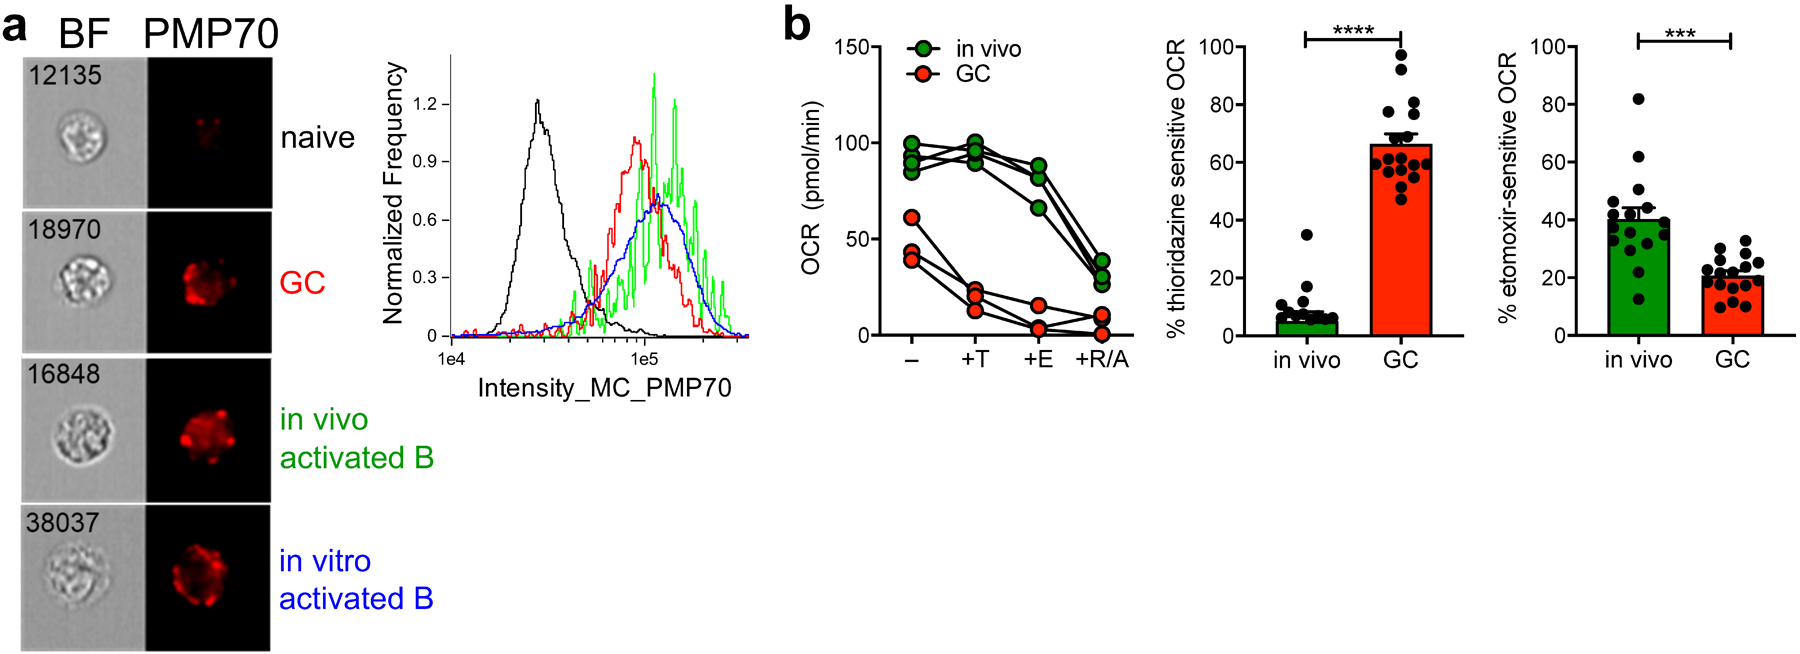
a, Representative Amnis ImageStream images (left) and histogram traces (right) of indicated cell types stained intracellularly for the peroxisomal protein PMP70. b, Representative OCR traces (left) of in vivo activated or GCBCs treated in-Seahorse sequentially with 100nM thioridazine (inhibitor of peroxisomal β-oxidation), 40μM etomoxir (inhibitor of mitochondrial FA uptake), and rotenone/antimycin a. Tabulated results (center and right) from four experiments, expressed as a percentage of thioridazine or etomoxir sensitive OCR, computed after subtraction of values measured after rotenone/antimycin a treatment. Bars represent mean +/− SEM; *** p < 0.001, **** p < 0.0001 by unpaired, two-tailed t-test.
GCBCs depend on mitochondrial and peroxisomal FAO
To determine whether mitochondrial and/or peroxisomal FAO is essential for GC survival, we inhibited these pathways during in vitro culture in the presence of anti-CD40 stimulation, which supports GCBC viability18,27. Only dual treatment with etomoxir and thioridazine resulted in significantly, albeit modestly, reduced GCBC survival (Fig 5a). Further, in vitro etomoxir and thioridazine dual inhibition significantly reduced the fraction of GCBCs in S-phase, indicative of cell cycle inhibition (Fig. 5b).
Fig. 5. GCBCs are sensitive to dual mitochondrial and peroxisomal FAO in vitro and in vivo.
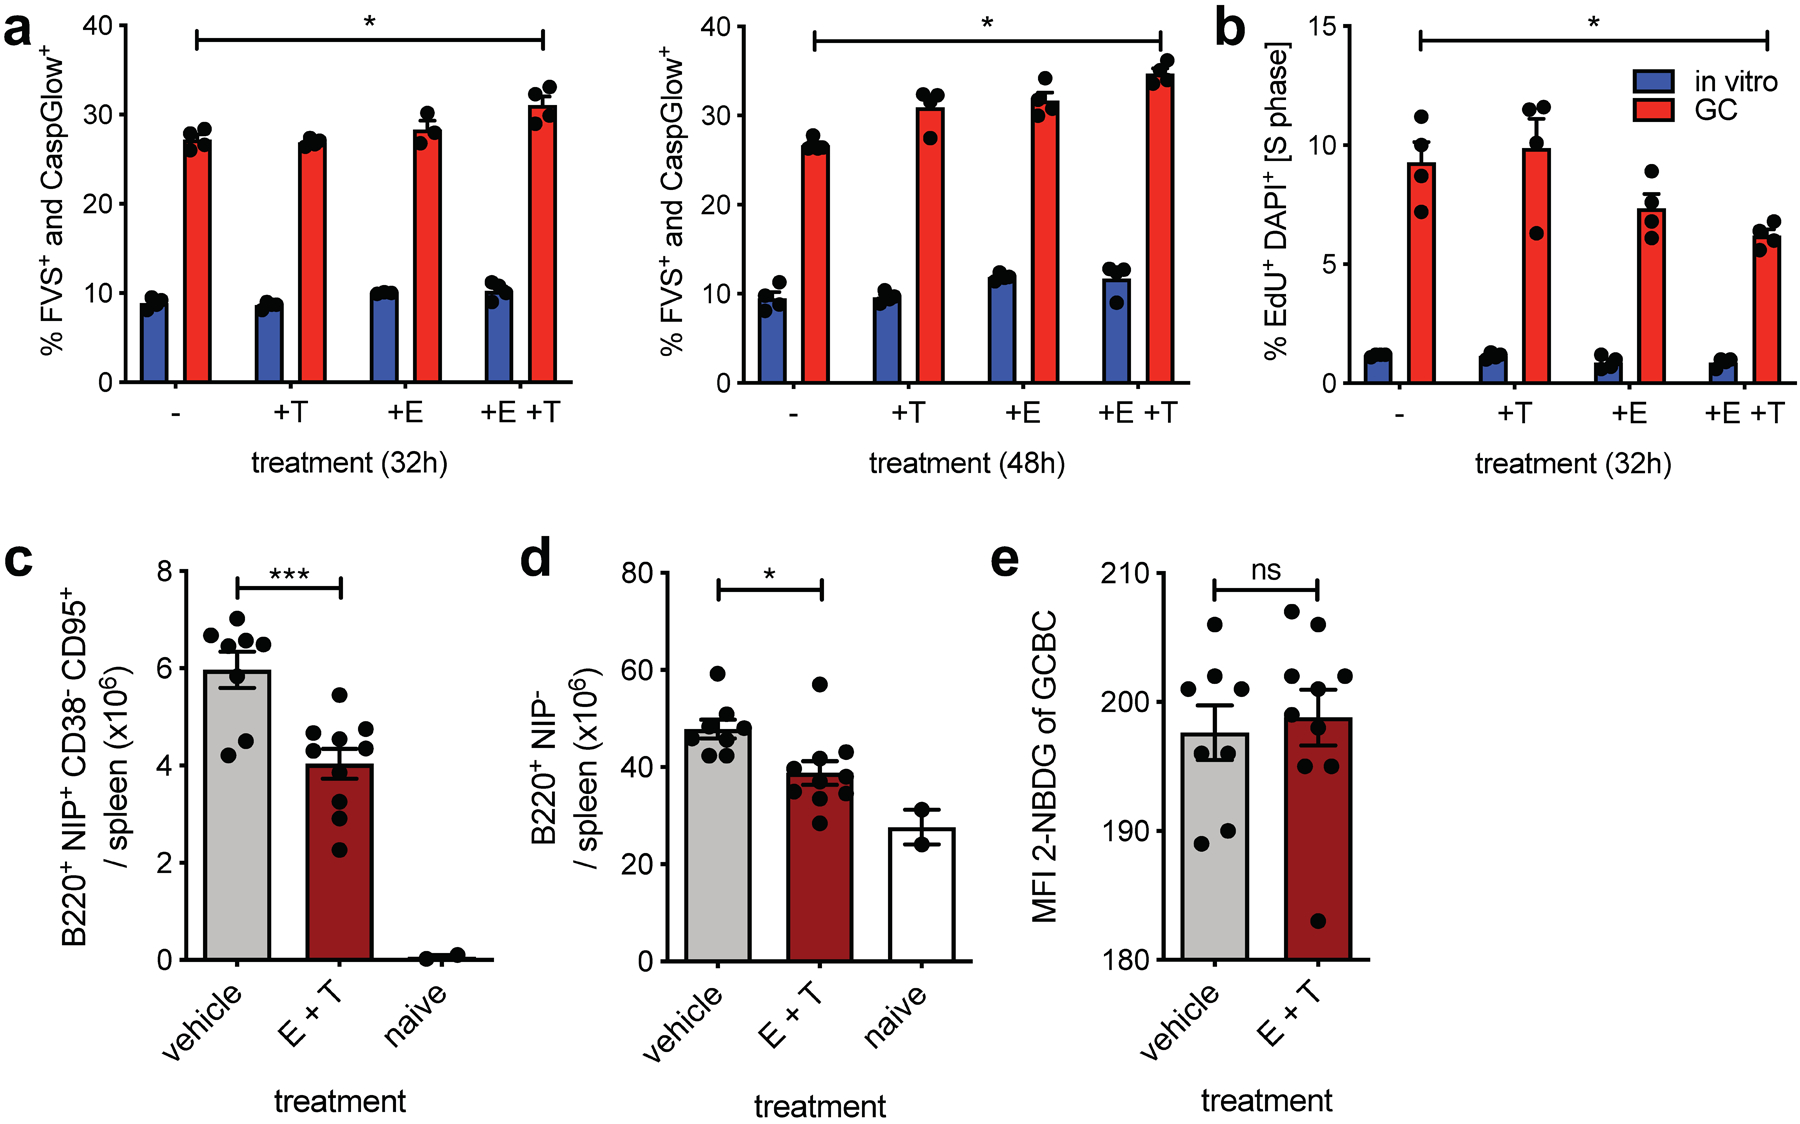
a, Tabulated cell death data, measured by flow cytometry as fixable viability stain (FVS) and Caspglow™ positive, from in vitro activated or d13 GCBCs cultured with anti-CD40 in the presence of the indicated inhibitors for the indicated times (n=4). b, Cell cycle analysis of cells treated as in (a) pulsed with 25 μM EdU for 30min prior to harvest (n=4). c, d and e, Absolute number of live splenic NP-specific GCBCs (c), naïve NP− B cells (d) and MFI of 2-NBDG of GCBCs after 30min 2-NBDG in vitro pulse (e) from mice at d14 post NP-CGG immunization given 22mg/kg etomoxir and 11mg/kg thioridazine or vehicle only at d9 and d13 post-immunization. (a) and (b) depict 1 representative of 2 experiments with 4 replicate cultures of indicated samples. GCBCs were pooled from 19 B1–8+/– Balb/c mice at day 14 after NP-CGG immunization and NBC were pooled from 6 unmanipulated B1–8+/– Balb/c mice to generate in vitro activated B cells. (c-d) are from one experiment with two inhibitor doses, which was replicated with an additional in vivo dose in Extended Data Fig. 5; Bars represent mean +/− SEM; *p ≤ 0.05; ***p ≤ 0.001, **** p ≤ 0.0001 by unpaired, two-tailed t-test.
To test whether combined FAO inhibition would influence GCBCs in vivo, we injected mice undergoing a GC reaction with etomoxir and thioridazine and assessed impact on GCBCs. Indeed, dual inhibition significantly reduced GCBC numbers in vivo (Fig. 5c). In vivo inhibition of both FAO pathways also affected total numbers of resting splenic B cells, which also rely on OXPHOS, albeit to a smaller degree (Fig. 5d). Experiments with extended in vivo dosages of etomoxir and thioridazine also resulted in significant GCBC reduction, but also affected NBCs to a greater degree (Extended Data Fig. 5). Notably, even under conditions of FAO inhibition in vivo, GCBCs did not show increased 2-NBDG uptake (Fig. 5e and Extended Data Fig. 5c), which suggest that GCBCs possess an inherent program to repress glycolysis. These experiments indicate that inhibition of FAO has functional consequences for GCBC both in vitro and in vivo.
13C tracing shows that GCBCs dominantly oxidize FAs
To validate these findings, and to better understand GCBC-specific metabolic mechanisms, we performed in vitro 13C labeling of GCBCs and control cells and analyzed the metabolites by liquid chromatography-high resolution mass spectrometry (LC-HRMS). To this end we cultured freshly prepared cells for 4 h in the presence of 2mg/ml [13C6]-glucose with anti-CD40 stimulation. GCBCs maintained their identity during these cultures. GCBCs contained lower amounts of intracellular hexoses compared to in vivo–activated B cells (Fig. 6a), indicative of less active uptake of glucose. Consistent with this result, GCBCs depleted less labeled glucose from the media compared to in vivo-activated B cells (Fig. 6b). Furthermore, GCBCs failed to phosphorylate [13C6]-glucose to [13C6]-glucose-6-phosphate (G-6-P; Fig. 6c and Extended Data Fig 6a,b). The inability to efficiently phosphorylate glucose is consistent with the minimal glucose-uptake by GCBCs as measured by flow cytometry. In addition, at steady state after culture, GCBCs had relatively little total G-6-P (Fig. 6d). In line with lack of glucose phosphorylation, GCBCs generated less [13C]-fructose-1,6 bisphosphate (Fig. 6e) compared to in vivo-activated B cells. Hexokinase activity is required to convert glucose into G-6-P, which is the initial step in glycolysis and which is necessary to allow more glucose to be transported into the cells in a gradient-dependent manner28. GCBCs expressed almost undetectable amounts of mRNA encoding hexokinase 2 (Extended Data Fig. 6h), which would contribute to the inability of GCBCs to accumulate [13C6]-G-6-P (Fig. 6c).
Fig. 6. 13C carbon tracing of glucose and palmitate in cultured B cells by LC-HRMS.
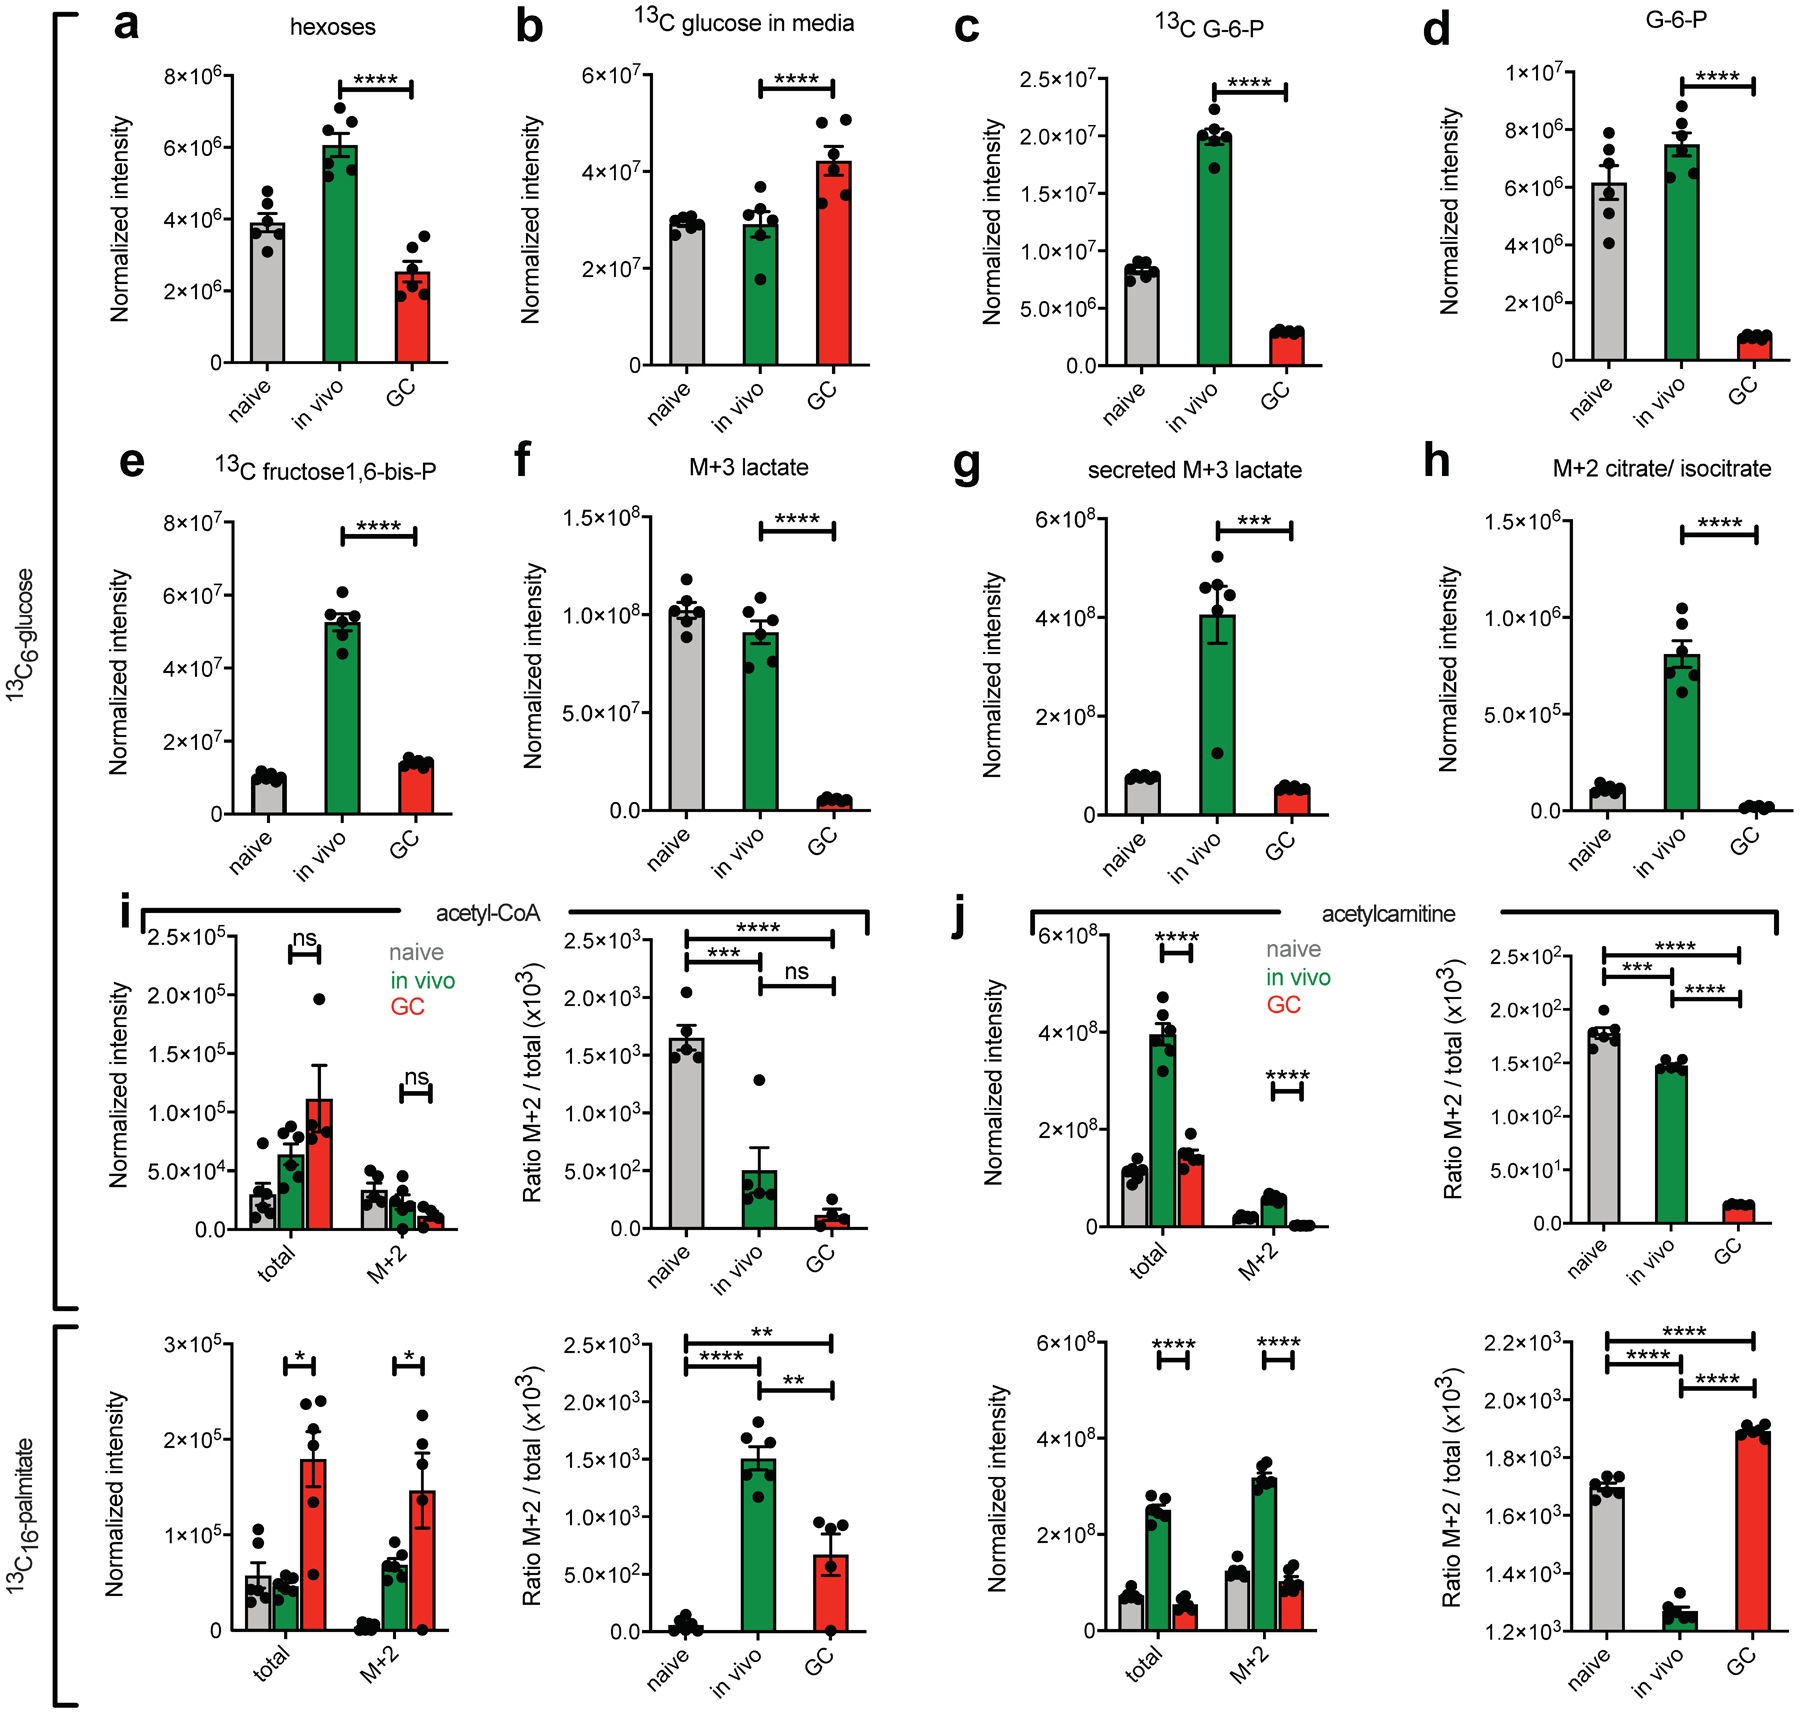
a-j, Bead-purified naive, in vivo activated and GCBCs were cultured in glucose and glutamine free RPMI media with anti-CD40 stimulation to maintain viability. Cells were either exposed to 2mg/ml ([13C6]-glucose (a-h and upper panels of i and j) or 100mM [13C16]-palmitate and 2mg/ml unlabeled glucose (lower panels of i and j) for 4h. Cell lysates (a, c-j) and supernatants (b) were then subjected to LC-HRMS. Shown are normalized intensities (as described in the Methods section) for depicted molecules and ratios of labeled (M+2) to total amounts. Depicted is one representative experiment with n=3–6 per sample. Each n represents a pool of 3 individual wells with 1×10⁶ cells each. Data from an independent experiment are in Extended Data Fig. 6. Bars represent mean +/− SEM. Statistical comparisons are not shown for naïve cells except for ratios in right panels of (i) and (j). *p ≤ 0.05; **p ≤ 0.01; ***p ≤ 0.001; ****p ≤ 0.0001 by unpaired, two-tailed t-test.
Under aerobic conditions, glucose is metabolized fully to produce two molecules each of pyruvate, NADH, ATP, H+ and H2O29. Consistent with minimal aerobic glycolytic activity, GCBCs generated little [13C3]-pyruvate from [13C6]-glucose (Extended Data Fig. 6c). Pyruvate is converted to lactate by lactate dehydrogenase and secreted from the cell. Compared to in vivo-activated B cells, GCBCs [13C3]-lactate levels intracellularly and extracellularly were 16.5- and 7.5-fold lower, respectively (Fig. 6f and Extended Data Fig. 6d,e; Fig. 6g and Extended Data Fig. 6f). In line with these findings, GCBCs metabolize only minimal amounts of glucose into TCA cycle intermediates, as measured by the M+2 isotopologue of citrate, which results from the condensation of unlabeled oxaloacetate and [13C2]-acetyl-CoA in the first step of the TCA cycle (Fig. 6h).
GCBCs have higher absolute concentrations of acetyl-CoA compared to in vivo-activated and naïve B cells and generate higher amounts of [13C2]-acetyl-CoA when cultured in the presence of [13C16]-palmitate. The opposite is the case when cultured in the presence of [13C6]-glucose (Fig. 6i, left). GCBCs derive a much greater fraction of total acetyl-CoA from [13C16]-palmitate than from [13C6]-glucose (Fig. 6i, right), which is indicative of the high rates of FAO in GCBCs. The acetyl group from acetyl-CoA is transferred to carnitine as a way to shuttle acetyl-Co from the mitochondria to the cytosol30. GCBCs have significantly less overall acetyl-carnitine compared to in vivo-activated B cells (Fig. 6j, left). However, in strong contrast to in vivo-activated B cells, GCBCs generated labeled acetyl-carnitine only when incubated with [13C16]-palmitate, but not with [13C6]-glucose (Fig. 6J, right), confirming that GCBCs directly metabolize exogenous lipid sources rather than generating lipid fuel from glucose. Finally, we found that GCBCs had significantly lower amounts of ATP compared to in vivo-activated and NBCs (Extended Data Fig. 6g). These results are consistent with the findings that GCBCs lacked glycolytic reserve and spare respiratory capacity.
We aimed to extend our 13C tracing study by labeling live animals. To establish the system, we administered 4-Hydroxy-3-nitrophenylacetic AminoEthylCarboxyMethyl-FICOLL (NP-Ficoll) to generate in vivo activated B cells, which are known to be glycolytic (Fig. 1b). We then performed a 480 min [13C6]-glucose infusion using an insulin clamp (3 mU/kg/min) to maintain euglycemia, which is an optimized system to provide robust isotopic labeling of metabolically active cell types31. We were readily able to detect [13C3]-lactate in heart and liver, but we were not able to detect uptake or metabolism in in vivo-activated B cells, which served as the positive control glycolytic cells (Extended Data Fig. 7). This failure to label even known glycolytic B cells can be attributed to the high glucose avidity and biomass of skeletal muscle and liver, which presumably extracted virtually all the labeled [13C6]-glucose we could inject. Hence, we conclude it is not possible to perform in vivo [13C6]-glucose tracing in B cells.
GCBC transciptome is not commensurate with glycolysis or hypoxia
We performed RNA-sequencing experiments to evaluate how gene expression could control the GCBC metabolic program. Most glycolysis pathway genes were significantly downregulated in GCBCs compared to in vivo–activated B cells in our RNA sequencing dataset (GSE128710; Fig. 7a). Furthermore, genes in the glycolysis pathway were significantly down-regulated in GCBCs compared to in vivo-activated B cells by gene set enrichment analysis (GSEA) (Fig. 7b). To integrate our RNA-sequencing and metabolomics results, we mapped gene expression data onto the glycolysis/gluconeogenesis KEGG pathway along with the abundance of metabolites based on our 13C tracing data for GCBCs and in vivo–activated B cells. The combined visualization illustrates significant down-regulation of key genes and absence of related metabolites in the glycolysis pathway in GCBCs compared to, glycolytic in vivo-activated B cells (Fig. 7c).
Fig. 7. Comparison of GCBCs and activated B cells for glycolysis-relevant gene expression.
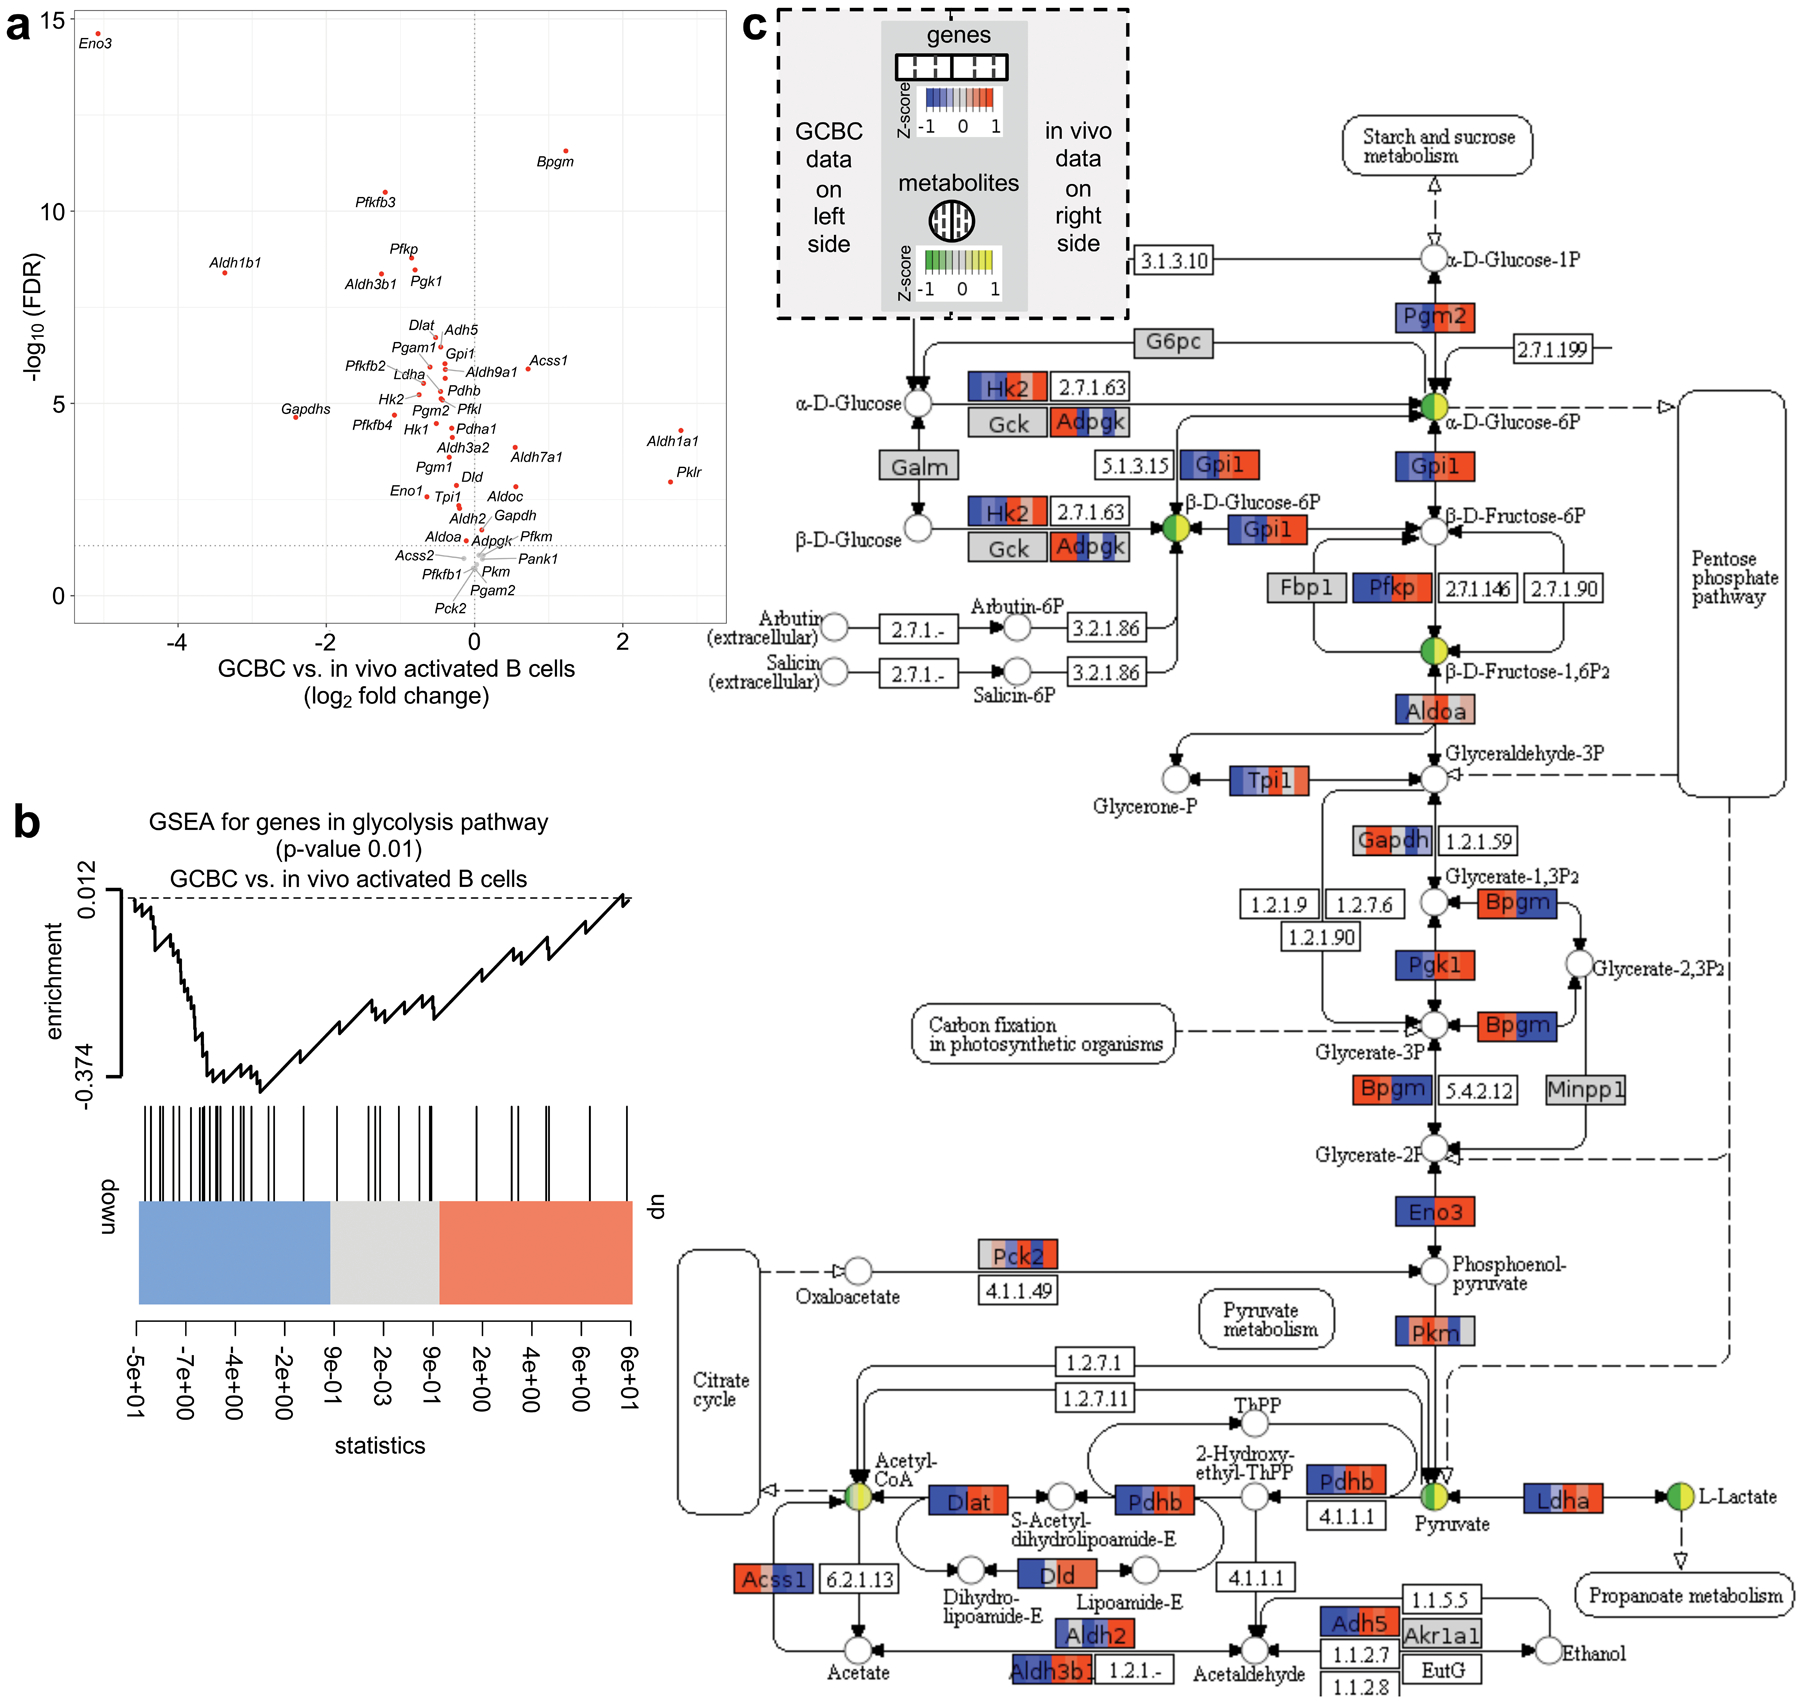
a, plot depicts the 43 genes expressed at > 10 transcript per million (TPM) in our RNA sequencing datasets (n=3; GSE128710) out of 67 genes annotated in the glycolysis pathway (source: https://rgd.mcw.edu/wg/; PW:0000640). X-axis shows log2-fold change of these genes between GCBCs compared to in vivo activated B cells. Y-axis displays the −log10 transformed FDR values. Significantly differentially expressed genes (FDR < 0.05) are marked in red; p-values were calculated using the moderated t-test implemented in the R limma package. b, gene set enrichment analysis (GSEA) plot illustrating significant (p=0.01) downregulation of glycolysis pathway genes (as in (a)) in GCBCs (n=3) compared to in vivo activated B cells (n=3). The p-value was calculated using rankSumTestWithCorrelation function from R limma package. c, Glycolysis/ Gluconeogenisis KEGG pathway (https://www.genome.jp/kegg-bin/show_pathway?map00010) annotated with gene expression and 13C tracing data using Pathview (https://pathview.uncc.edu/). Genes are represented as boxes and metabolites as circles. Each box and circle is divided into 6 partitions, with the leftmost three representing GCBCs and the rightmost 3 representing in vivo activated B cells. The colors in each segment encode Z-scored log2-transformed normalized gene expression data for all replicates (n = 3) in boxes and Z-scored carbon tracing measurements (first 3 replicates as in Fig. 6) in circles. For genes with multiple isoforms, Z-scores of the highest expressed isoform are shown in boxes. Z-scores are encoded by color intensity according to the scale key at the top of the figure. Genes and metabolites with lower Z-scores are indicated by blue and green, while genes and metabolites with high Z-scores are indicated by orange and yellow, respectively. Genes with < 10 TPM are indicated in gray. Numbers in boxes are either other molecules and chemical compounds as per the KEGG Pathway map or they are not annotated in the Pathview version of KEGG.
Since GCs have been reported to be hypoxic sites, as revealed by hypoxyprobe staining14,32, and since hypoxia is thought to favor glycolysis and increased lactate production15, we wanted to evaluate what might have seemed a paradox given that we could not detect functional, metabolomic, or transcriptomic evidence for glycolysis in GCBCs. In hypoxic settings, specific genes are upregulated in response to hypoxia-inducible factor 1-alpha (HIF-1α) stabilization, thus reliably indicating if the target tissue was indeed sensing functional hypoxia33,34. To evaluate this in GCBCs and other activated B cells, we analyzed our RNA sequencing dataset for expression of glycolysis-related HIF-1α target genes (Extended Data Fig. 8a), additional HIF-1α-responsive genes (Extended Data Fig. 8b) and GC-specific control genes (Extended Data Fig. 8c). This analysis revealed that GCBCs actually significantly downregulated—rather than induced—genes involved in hypoxia, compared to in vivo-activated and NBCs (Extended Data Fig. 8d). Further, GCBCs had only low expression of glycolysis-related HIF-1α target genes (Extended Data Fig. 8a). Hence, GCBC gene expression does not reflect functional hypoxia, in line with lack of glycolysis and an OXPHOS-mediated metabolic program.
Genetic impairment of FAO selectively affects GCBCs
To test whether FAO played a role in GCBCs in vivo, we targeted FA import into mitochondria by reducing mRNA encoding CPT2, an enzyme essential for this process. To this end we activated NBCs from CD45.1 or CD45.2 allotype-marked B1–8 B cell receptor (BCR) gene-targeted mice, which have an increased precursor frequency of cells responsive to the hapten NP35,36. After in vitro activation we infected cells with retroviruses expressing short hairpin (sh)RNA against carnitine palmitoyltransferase 2 (Cpt2) or the control gene T-cell surface glycoprotein CD8 alpha chain (Cd8a) along with the Ametrine reporter. One day after transduction, we determined the frequencies of transduction with each retrovirus (referred to as “input”) and co-transferred the CD45.2 Cpt2- and CD45.1 CD8a- knockdown transduced B cells into T cell-primed CD45.1/2 AM14tg+ Vk8R+/− recipients. These recipients cannot mount an endogenous B cell response to NP-CGG immunization35,36 but have intact lymphoid architecture (Fig. 8a,b). Cpt2 mRNA was reduced 2.1 to 2.4-fold in Ametrine-expressing GCBCs that were transduced with shRNA directed against Cpt2 (Fig. 8c). Compared to the co-transferred Cd8-knockdown control B cells, significantly fewer Cpt2-knockdown B cells contributed to the GC reaction, whereas non-GC reactions against the same antigen were not affected (Fig. 8d). Thus, genetically mediated reduction in Cpt2 expression, which in turn would impair mitochondrial FAO, confers selective disadvantage to GCBCs.
Fig. 8. Competitive disadvantage of GCBCs after targeted CPT2 mRNA reduction.
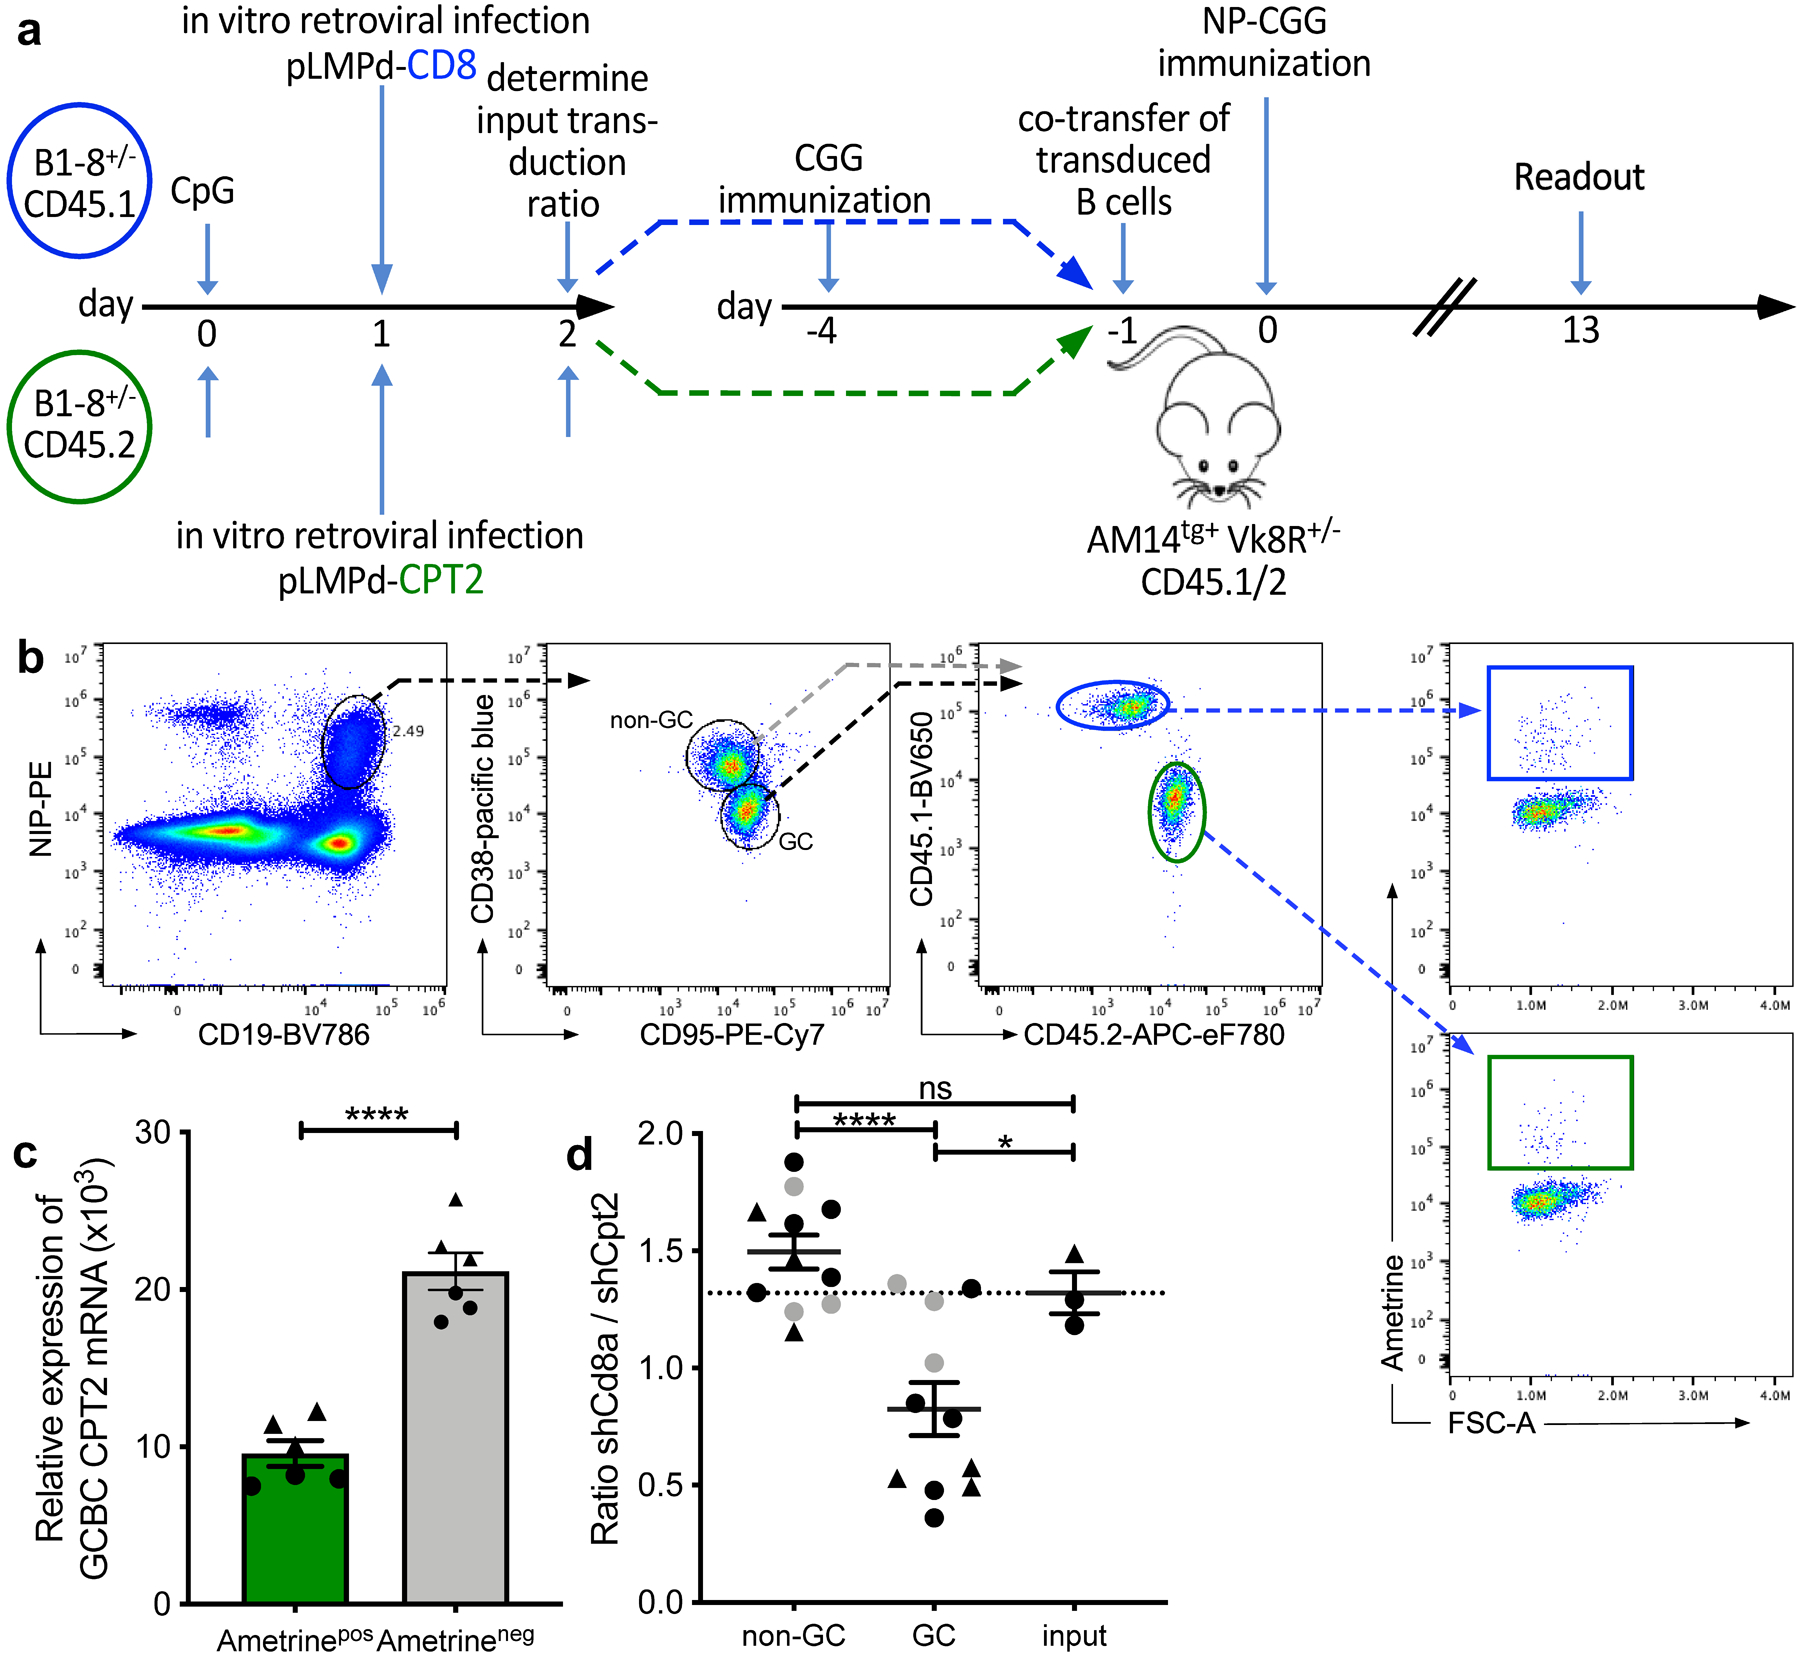
a, Experimental outline of competitive GC development using in vitro-transduced B cells with shRNA retroviral vectors. B cells from CD45.1 or CD45.2 Balb/c mice were transduced with retroviral shRNA vectors targeting the mRNAs encoding CD8 (control gene; CD45.1 in blue) or CPT2 (CD45.2 in green) after stimulation with CpG DNA. Retrovirally transduced cells express the fluorescent reporter protein Ametrine. Transduced cells were co-transferred into NP-unresponsive CD45.1/2 AM14tg+ Vk8R+/– mice that had been CGG carrier-primed 4 days earlier. Recipients were immunized i.p. with NP-CGG in alum and analyzed 13 days later. b, Gating strategy to identify CD8- and CPT2-transfected live Ametrine+ non-GC (CD38+ CD95−) and GCBCs (CD38− CD95+) singlets within the same animal. Complete gating strategy is shown for GCBCs only but was also applied for non-GCBCs. c, qRT-PCR of sort-purified GCBCs 7 days post immunization. Shown are 3 replicates of CPT2 mRNA levels of 2 individual mice (indicated as circles or triangles) normalized to GAPDH. d, Competitive ratio of control CD8- to CPT2-targeted B cells in non-GC, GCBCs and input cells. The ratio is the number of shRNAmiR-CD8a transduced CD45.1/1 Ametrine positive B cells divided by the number of shRNAmiR-CPT2 CD45.2/2 transduced Ametrine positive B cells after gating on each compartment. Dashed line represents input transduction ratio at the time of cell transfer. Data are from two independent experiments depicted as circles or triangles; data points in grey represent mice with less than 200 Ametrine positive cells recovered. Statistical comparison with and without data points depicted in grey resulted in the same degrees of statistical significance. Bars represent mean +/− SEM; ***p ≤ 0.001; ****p ≤ 0.0001 by unpaired, two-tailed t-test.
Discussion
The central finding of this work is that even though GCBCs are highly proliferative, they rely on oxidation of FA and do not metabolize glucose to a significant extent. This is GC-specific, since other types of highly proliferative B cells that are not of GC phenotype do carry out aerobic glycolysis, in addition to FAO. Additionally, GCBCs have less expression of genes involved in the glycolysis pathway, compared to activated non-GC B cells. Genetic and inhibitor data both in vivo and in vitro supported a functional role for FAO in GCBCs.
Our results contrast with prior reports that implied that GCBCs relied on glycolysis13,14,37. Increased uptake of 2-NBDG compared to NBC in vivo was previously reported, but the differences were modest and may have been influenced by the larger size of GCBCs13. Repeated injections of 2-deoxyglucose, an inhibitor of glucose uptake, also had a minor effect on GCBC numbers in their studies, but this drug could have affected GCBC precursors seeding the GC—given the early start (day 4) and prolonged duration of the treatment—as well as non-B cells – in particular GC Tfh cells which we found to be glycolytic (see above). A recent study did not find an effect of 2-deoxyglucose on Ag-induced GC responses, but did find an effect on TFH in lupus-prone mice38.
Recent studies have reported, using chemical probes, that the GC is a hypoxic environment 14,32. Since hypoxia favors glycolysis, this result was interpreted to support the idea that GCBCs perform glycolysis37. Tissue probe-based measurements, however, are qualitative and do not determine actual oxygen tensions. Mitochondrial respiration can take place at low oxygen tensions (e.g. 3%) commonly found in many tissues, while cell culture at higher O2 tensions can even induce glycolysis39. Therefore, metabolic pathways utilization cannot be inferred from qualitative measurements of relative hypoxia.
Functional hypoxia should result in expression of genes that are induced by hypoxia and HIF-1α, the hypoxia-induced transcription factor (TF). While another report claimed enriched expression in genes expressed in GCBCs vs NBC of a set of 26 such genes originally identified in tumor tissues14, we could not confirm this in our RNA sequencing datasets. Specific examination of known hypoxia-induced genes, in particular those genes known to be involved in glycolysis, also did not reveal GCBC-specific upregulation; in fact, compared to both NBC and activated B cells, a targeted set of hypoxia-induced genes was significantly depleted in the GCBCs transcriptome. Hence, we found no convincing transcriptional pattern reflecting a hypoxia response in GCBCs as a whole.
Why might GCBCs have evolved a metabolic strategy different from that of other proliferative lymphocytes? One distinguishing factor of GCBCs is that they obtain energy in one focused area, as GCBCs do not migrate out of their niche during the course of the reaction40–42. The number of GCBCs, once reaching peak, remains stable or even declines over time, so the net content of metabolites does not increase. With efficient scavenging it could be that not much anabolic activity is needed. A major energy source in the GC thus might be materials released from dying cells, and these would largely be fats derived from membranes and other fat energy stores. Early GCBCs rely mostly on endogenous FA while later in the GC reaction GCBCs rely mostly on exogenous FA, consistent with the notion that in vivo energy is being obtained from nearby dying GCBCs. Non-canonical autophagy could be a method for GCBCs to get some of their energy, particularly late in the reaction43.
How GCBCs limit glycolysis and favor FAO, in contrast to other types of proliferating B cells is unknown. The expression in GCBCs of two pivotal TFs, BCL6 and FOXO1, may provide clues. In T cells, BCL6 has been shown to repress glycolysis and so it is possible that a “BLC6 on” state is inconsistent with glycolysis44. BCL6 deficiency results in dysregulation of lipid metabolism in multiple tissues, including spleen and thymus.45. FOXO1 is normally expressed and localized in the nucleus only in quiescent cells46, but it is nuclear-expressed in most GCBCs27,47,48, despite that the GCBC population is clearly actively in cell cycle. Quiescent immune cells typically rely on oxphos, and in particular FAO, to maintain themselves7, just as GCBCs do.
A remaining puzzle is how GCBCs catabolize FA via oxphos while at the same time dividing on average three to four times per day. We suggest that energy use may be gated in a cyclical fashion, with cells spending most of the time in “signal search” mode, deriving energy from FAO. These cells, despite their GC phenotype and transcriptome, may function more like NBC waiting for an activation signal. Emerging work from several labs has defined a subset of GCBCs that have recently received key positive selection signals via a combination of BCR and CD40 receptors, leading to induction of c-Myc27,49–52. As part of this program, with c-Myc playing a central role, mTORC1 is activated and cells initiate cell cycle as they migrate from the LZ to the DZ50. This “proliferative charge up”, which involves only a small minority of cells for a small period of time, may have different energy requirements. Such positively selected GCBCs may begin an anabolic and possibly glycolytic program, albeit a transient one. If GCBCs are also scavenging other metabolic precursors, such as nucleotides, from nearby dying GCBCs, the anabolic de novo requirements for each GCBC cell division might be less than otherwise anticipated and so a transient metabolic shift may be sufficient to support further cell division.
Overall this work reveals a unique metabolic approach for GCBCs, which differs from known profiles of other proliferative lymphocytes. Our findings thereby reveal flexibility in the connection between lymphocyte proliferative states and metabolic states and raise the question of why GCBCs have evolved a distinctive energy acquisition strategy. Future work will determine if this strategy is linked to key TF programs and how the unique metabolic state of GCBCs facilitates the unique biological function of cyclically selecting for high affinity variants.
METHODS
Mice, immunization and in vivo treatment
Use of B1–8i+/– and B1–8i+/− Jκ–/– genetically targeted BALB/cJ mice was as described35,36. Mice were maintained under specific-pathogen-free conditions and all animal experiments were approved by the University of Pittsburgh Institutional Animal Care and Use Committee. 6- to 12- week-old mice were immunized i.p. with 50 μg of NP-CGG precipitated in alum to induce GCBCs or NP-Ficoll (Biosearch Technologies) in PBS to induce in vivo activated B cells. Mice were i.p. injected once a day at d9 and d13 post NP-CGG immunization with 22 mg/kg bodyweight Etomoxir (Cayman Chemicals) in 5% DMSO in PBS and 11 mg/kg Thioridazine (Cayman Chemicals) in 0.9% NaCl solution. For in vivo metabolite uptake experiments mice were injected intravenously with 0.171 mg (500 nmol) 2-NBDG (in PBS) or 50 μg BODIPYTM FL C16 (in 2.5% DMSO in PBS) and sacrificed 35 or 60 min later, respectively.
Antigens, antibodies, chemicals and detection reagents
Chicken γ globulin (CGG; Sigma-Aldrich), 4-Hydroxy-3-nitrophenylacetyl (NP)-conjugates and detection reagents were as described35. All antibodies used in this study are described in detail in the Nature Research Reporting Summary and in Supplementary Table 1. DAPI was from BD Biosciences and Streptavidin (CAS no. 9013–20.1) was from Sigma-Aldrich. Ghost Dye Violet 510 was from Tonbo Biosciences. Peanut agglutinin (PNA) was purchased from Vector laboratories (lot ZD0814) and conjugated Alexa Fluor 700 in our laboratory. 2-NBDG (N13195 or Cayman #11046), BODIPYTM FL C12 (D-3822; for in vitro metabolite uptake) and BODIPYTM FL C16 (D-3821; for in vivo metabolite uptake) were from Life Technologies. (+)- Etomoxir sodium salt (CAS no. 828934-41-4) and Thioridazine hydrochloride (CAS no. 130-61-0) were from Cayman Chemicals. Sodium Palmitate (Sigma, P9767) was conjugated to ultra-fatty acid-free bovine serum albumin (BSA; Roche) following the Seahorse Bioscience protocol as described53.
Cell preparation
Spleens were disrupted either in HBSS supplemented with 45 U/ml DNAseI (Sigma) and 80 U/ml Collagenase D (Roche) using the OctoMACS™ Separator (Miltenyi Biotec) or by crushing between frosted glass slides in PBS-2%FCS-2 mM EDTA. Erythrocyte-depleted splenocytes were incubated with rat serum and anti-CD16/CD32 Abs in staining buffer (SB; 1×PBS, 2% FCS, 2 mM EDTA,) for 5 min on ice followed by addition of biotinylated antibodies (anti-CD11b, anti-Ly6G/Gr1, anti-CD49b, anti-CD43, anti-CD4, anti-CD8, anti-Ter119 for naïve and in vivo activated B cells; for GCBC purification anti-IgD, anti-CD38 and anti-CD138 were additionally added) and then washed in SB. Cell pellets were resuspended in SB containing IMag™ - Streptavidin Particles Plus (Becton Dickinson) and negative magnetic separation was performed with EasySep™ Magnets (Stemcell Technologies). Resulting cell populations were either used directly or further purified by FACSAria (BD Immunocytometry Systems) cell sorting. NBCs were identified as CD19+CD93- live singlets; in vivo- and in vitro–activated B cells as CD19+CD86+ live singlets with increased forward scatter; GCBCs were defined as CD19+CD95+CD3- live singlets (Extended Data Fig. 1). Purification led in general to over 98% purity of target cell populations. To generate in vitro activated B cells, magnetically purified NBCs (as described above) were cultured in RPMI 1640 media in the presence of 5 μg/ml CpG ODN 1826 (5′-TCCATGACGTTCCTGACGTT-3′; Invivogen) for 48 h at 37 °C. Generation of activated T cells was as described 54.
Metabolism Assays
Metabolism assays were performed essentially as described54. Cells were spun down at 1500 rpm (423 × g) for 5 min and resuspended in proper assay media. 180 μl cell suspension was transferred into Cell Tak coated Seahorse XFe96 plates and spun at 800 rpm (120 × g) for 3 min. Cells were rested in a non-CO2 incubator for 45–60 min at 37°C before Seahorse XFe96 run. Additionally, 2.0– 2.5 × 10⁵ cells were plated per well on Cell-Tak coated Seahorse culture plates and exposed to 10 mM glucose, 40 μM Etomoxir or 100–500 nM Thioridazine or palmitate-BSA conjugate for Seahorse XFe96 (Agilent) analysis. For 2-NBDG and BODIPYTM FL C12 uptake, 1–5 × 10⁶ red blood cell lysed single-cell suspensions were resuspended on ice in 100 μl RPMI 1640 media containing 2% FCS (Gemini Bio-Products) then transferred to a 37 °C incubator for 15 min. Solutions of 20–160 nM 2-NBDG and 20–80nM BOIDPYTM FL C12 were prepared in pre-warmed 37 °C RPMI 1640 media (without supplements) and 100 μl were added to the cells, and incubated 30 min at 37 °C. Cells were pelleted and washed once in metabolism staining media (MetSM; PBS with 0.5% BSA, 25 mM HEPES, 2.5 mM EDTA), and remained on ice in MetSM until analysis. Fc-receptors were blocked with unconjugated anti-CD16/CD32 Ab (3 μg/mL) followed by flow cytometric staining of surface antigens. Cells were washed and resuspended in MetSM containing 7-AAD for dead cell exclusion and samples were analyzed on an LSRII or Fortessa within 2 h after staining.
In vitro culture
4–5 × 10⁵ freshly magnetically purified GCBCs and washed 48 h in vitro activated B cells (as described above) were cultured in RPMI 1640 media containing 10% FCS without glutamine and 10 μg/ml biotinylated anti-CD40 Ab complexed with 0.3 μg/ml Streptavidin. For cell cycle analysis, 25 μM EdU was added to the cultures for 30 min and EdU detection was performed with the Click-iT® Plus EdU Alexa Fluor® 647 Flow Cytometry Assay Kit (Life Technologies). Cells were exposed to DAPI during acquisition.
For LC-HRMS analysis freshly isolated cells were cultured in glucose and glutamine free media with the addition of either stable isotope-labeled 13C-glucose ([13C6]-glucose) or glucose and [13C16]-palmitate and with 10 μg/ml anti-CD40 Ab and 0.3 μg/ml Streptavidin added. Supernatants and twice PBS washed cells were subjected to analysis by LC-HRMS.
LC-HRMS
Sample preparation: Metabolic quenching and polar metabolite extraction was performed using ice cold 80% methanol in water with 0.1% formic acid at a ratio of 500 μL per 28.2 cm2 surface area of cell monolayer. Deuterated (D4)-taurine (Sigma-Aldrich) was added to the cell lysates as an internal standard at a final concentration of 100 μM. The supernatant was cleared of protein by centrifugation at 16,000 × g, dried under N2 and resuspended in 40 μL of 1.5mM ammonium fluoride in water. 5 μL of reconstituted sample was subjected to online LC-HRMS analysis. Conditioned media metabolite extraction was performed by adding 400 μL of 100% methanol containing 100 μM (D4)-taurine to 100 μL of conditioned media. The protein content was cleared by centrifugation at 16,000 × g, and the supernatant dried to completion under N2. Following resuspension in 40 μL 1.5 mM ammonium fluoride in water, 5 μL of reconstituted sample was subjected to online LC- HRMS analysis.
Analyses were performed by untargeted LC-HRMS. Briefly, samples were injected via a Thermo Vanquish UHPLC and separated over a reversed phase Phenomenex Kinetex C18+ column (2.1 × 100 mm, 1.7 μm particle size) maintained at 40 °C. For the 20 min LC gradient, the mobile phase consisted of the following: solvent A (1.5 mM ammonium fluoride, NH4F) and solvent B (100% acetonitrile). The gradient was the following: 0–12.0 min 5% B, to 1000% B, 12.0–15.0 min hold at 100% B, 15.0–15.1100% to 5% B, 15.1–20.0 min 5%B. The Q Exactive mass spectrometer was operated in polarity switching mode, using both positive and negative ion mode, scanning in full MS mode (2 μscans) from 66.7 to 1000 m/z at 70,000 resolution with an AGC target of 3 × 10⁶. Source ionization settings were 4.5/3.0kV spray voltage respectively for positive and negative mode. Source gas parameters were 20 sheath gas, 10 auxiliary gas at 250 °C, and 4 sweep gas. Calibration was performed prior to analysis using the PierceTM Positive and Negative Ion Calibration Solutions (Thermo Fisher Scientific). Integrated peak areas were then extracted manually using Quan Browser (Thermo Fisher Xcalibur ver. 2.7). 13C enrichment and natural abundance corrections were calculated using previously established MIMOSA methodology55. All study samples were spiked with deuterated internal standards during metabolite extraction. The peak areas of the various analytes are normalized to the peak areas of the internal standard to control for extraction efficiency and instrument response. In short, the internal standard peak area from each individual sample was divided by the mean peak area of that internal standard across all samples in that experiment to create a response factor. All measured analytes within a sample were then normalized in intensity by multiplying the peak area by the response factor.
Retroviral transducrion
Retroviruses were produced by standard methods in the Platinum-E retroviral packaging cell line56. Retroviral-containing supernatant was harvested at 48 h post-transfection for spin-infection. For B cell activation, bead-purified NBC were cultured in RPMI 1640 media in the presence of 5 μg/ml CpG ODN 1826 (5′-TCCATGACGTTCCTGACGTT-3′; Invivogen) for 48 h at 37 °C. Activated B cells were spin-infected at 800 × g for 90 min at 32 °C. Polybrene was added to the viral supernatant at a final concentration of 2 μg/mL immediately prior to spin-infection. Following infection, viral supernatant was removed and B cells were again placed in CpG-containing media for another 24 h before assessment of transduction efficiency.
qRT-PCR
In brief, RNA was isolated from sorted, retrovirally transduced B cells via RNeasy Plus Mini Kit (Qiagen; Cat no. 74134) according to the manufacturer’s recommended protocol. First-strand cDNA synthesis was performed with iScript Reverse Transcription Supermix (Biorad; cat no. 1708840); 5–10 ng of cDNA was loaded as input for qPCR reactions. Cycling was performed on a Roche LightCycler 96 machine.
Primer sequences:
CPT2-forw: 5´-CCAGTTCAGGAAGACAGAAGTGT-3´;
5´-CPT2-rev: CGACAGAGTCTCGAGCAGTTAAA-3´;
GAPDH_ forw: 5´-TCCCACTCTTCCACCTTCGA-3´;
GAPDH_rev: 5´-AGTTGGGATAGGGCCTCTCTT-3´;
RPS9_forw: 5´-TTGTCGCAAAACCTATGTGACC-3´;
RPS9_rev: 5´-GCCGCCTTACGGATCTTGG-3´;
Hk2_forw: 5´-ATGATCGCCTGCTTATTCACG-3´;
Hk2_rev: 5´- CGCCTAGAAATCTCCAGAAGGG-3´;
RNA sequencing
Cells were freshly isolated, bead purified and FACS Aria sorted as described in Extended data Fig. 1. Sorted cells (1.5–3 × 10⁶ cells per sample) were washed twice in cold PBS and RNA was prepared using shredder-columns (Qiagen; QIAshredder 79656) and the RNeasy Plus Mini kit (Qiagen) following the manufacturer’s instructions. Three independent RNA libraries per cell population were prepared using Illumina TruSeq Stranded mRNA sample preparation kit. Poly-A containing mRNA molecules were first purified using poly-T oligo attached magnetic beads. Following purification, the mRNA was fragmented into small pieces using divalent cations. The cleaved RNA fragments were copied into first strand cDNA using reverse transcriptase and random primers. Strand specificity was achieved by using dUTP in the Second Strand Marking Mix, followed by second strand cDNA synthesis using DNA Polymerase I and RNase H. The products were then purified and enriched with PCR to create the final cDNA library. The cDNA libraries were validated using KAPA Biosystems primer premix kit with Illumina-compatible DNA primers and Qubit 2.0 fluorometer. Quality was examined using Agilent Tapestation 2200. The cDNA libraries were pooled at a final concentration 1.8 pM. Cluster generation and 75-bp paired-read dual- indexed sequencing was performed on Illumina NextSeq500 at the Health Sciences Sequencing Core at Children’s Hospital of Pittsburgh.
Sequences were aligned to the mm10 genome using the STAR aligner57. The number of uniquely aligned reads ranged from 3.1–7.7 × 10⁷. Gene-level counts were determined using featureCounts58, and raw counts were analyzed for differential expression using the voom method 59 in the limma R package60. All gene-set enrichments were performed using the rankSumTestWithCorrelation function in limma, which explicitly corrects for correlation among genes in the gene set being interrogated. All RNA-seq data were deposited in the NCBI’s Gene Expression Omnibus database (GEO) with accession ID GSE128710.
Flow cytometric analysis, cell sorting and imaging cytometry
Flow cytometric analysis, cell sorting and imaging cytometry were performed essentially as described27,35,36. Additionally, the CytekTM Aurora Cytometer (Cytek Biosciences) was used to acquire data presented in Figure 8. For PMP70 imaging cytometry, cells were fixed with 1.5% PFA for 10 min at 21°C and permeabilized in FACS staining buffer containing 0.1% Triton X-100. Cells were then stained in staining buffer with PNA and antibodies against PMP70 (Rabbit polyclonal, ThermoFisher Scientific), B220 (clone: RA3–6B2, BD Pharmingen), CD86 (clone: GL1, prepared in the lab) for 30 min. Cells were washed and stained with Cy3 conjugated anti-Rabbit secondary antibody (ThermoFisher Scientific) for 15 min and nuclei were stained with DAPI. For metabolite uptake experiments, cells were not fixed. Data were collected on an Amnis ImageStream®X Mark II Imaging Flow Cytometer and analyzed with IDEAS software (EMD Millipore). For flow cytometric analysis all cell populations were gated on live singlets (either 7-AAD– or fixable viability dye–) and consecutively gated as follows: GCBCs: CD19+, CD38–, CD95+; GC T follicular helper cells: B220–, TCR-beta+, CD4+, ICOS+, CXCR5+, PD-1+61; plasmablasts: CD138+, CD38+, CD44+; in vivo and in vitro activated B cells: CD19+ CD44 (or CD86)+ with increased forward-scatter; CD4 T cells: CD19 or B220–, TCR- beta–, CD4+; NBC: CD19+ of unimmunized mice. If indicated, antigen specificity was determined by NIP-PE, NIP- Alexa Fluor 700 or NIP-APC positivity.
Data analysis and statistics
Results are presented as mean +/− SEM. The legend of each figure states the statistical test used. p-values were calculated by unpaired, two tailed t-test with ns = not significant; *p ≤ 0.05; **p ≤ 0.01; ***p ≤ 0.001; ****p ≤ 0.0001. Statistical analyses were performed on GraphPad Prism software version 8.3.0. Statistical analysis of RNA sequencing data is described in the methods section.
Extended Data
Extended Data Fig. 1. Preparation of B cell populations in support of figures 1, 2, 4, 5, 6, 7 and 8.
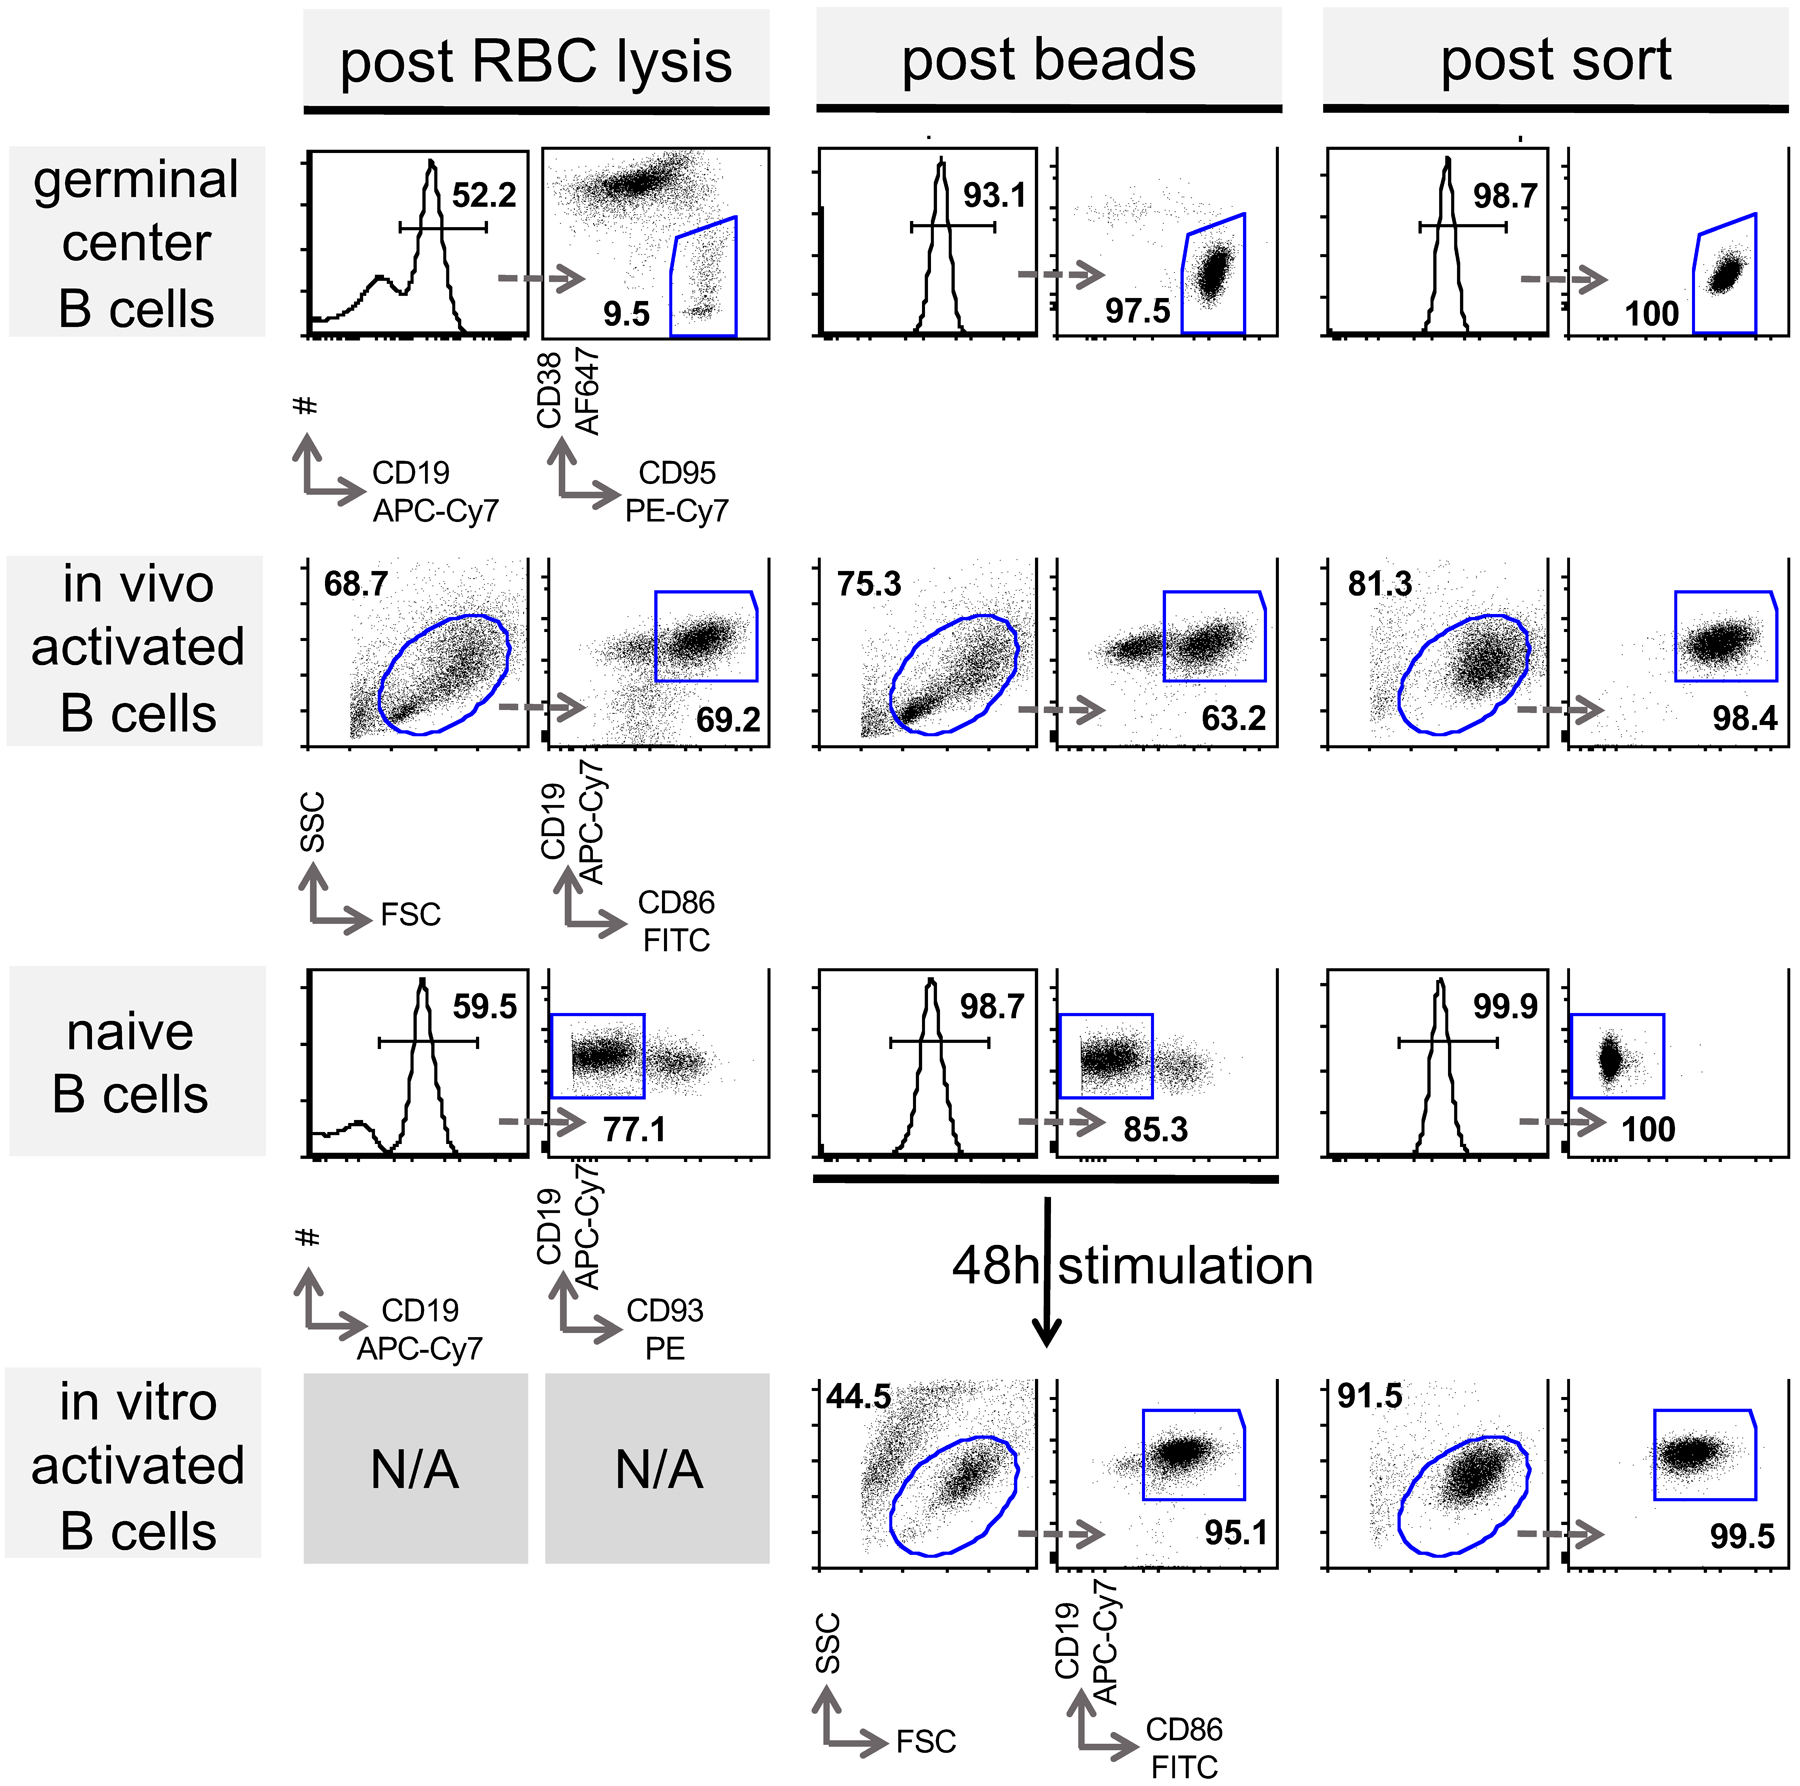
Representative FACS plots are shown to determine frequency of indicated target populations (horizontal patterns). Splenocytes were enriched for indicated target population as described in the methods section. After each purification step (columns) cells were subjected to flow cytometric analysis with indicated surface markers to determine purity. Arrows indicate subsequent gating and numbers percent gated population. (RBC; red blood cell)
Extended Data Fig. 2. GCBC show high viability in culture in support of figures 1, 2, 4, 5, 6 and 7.
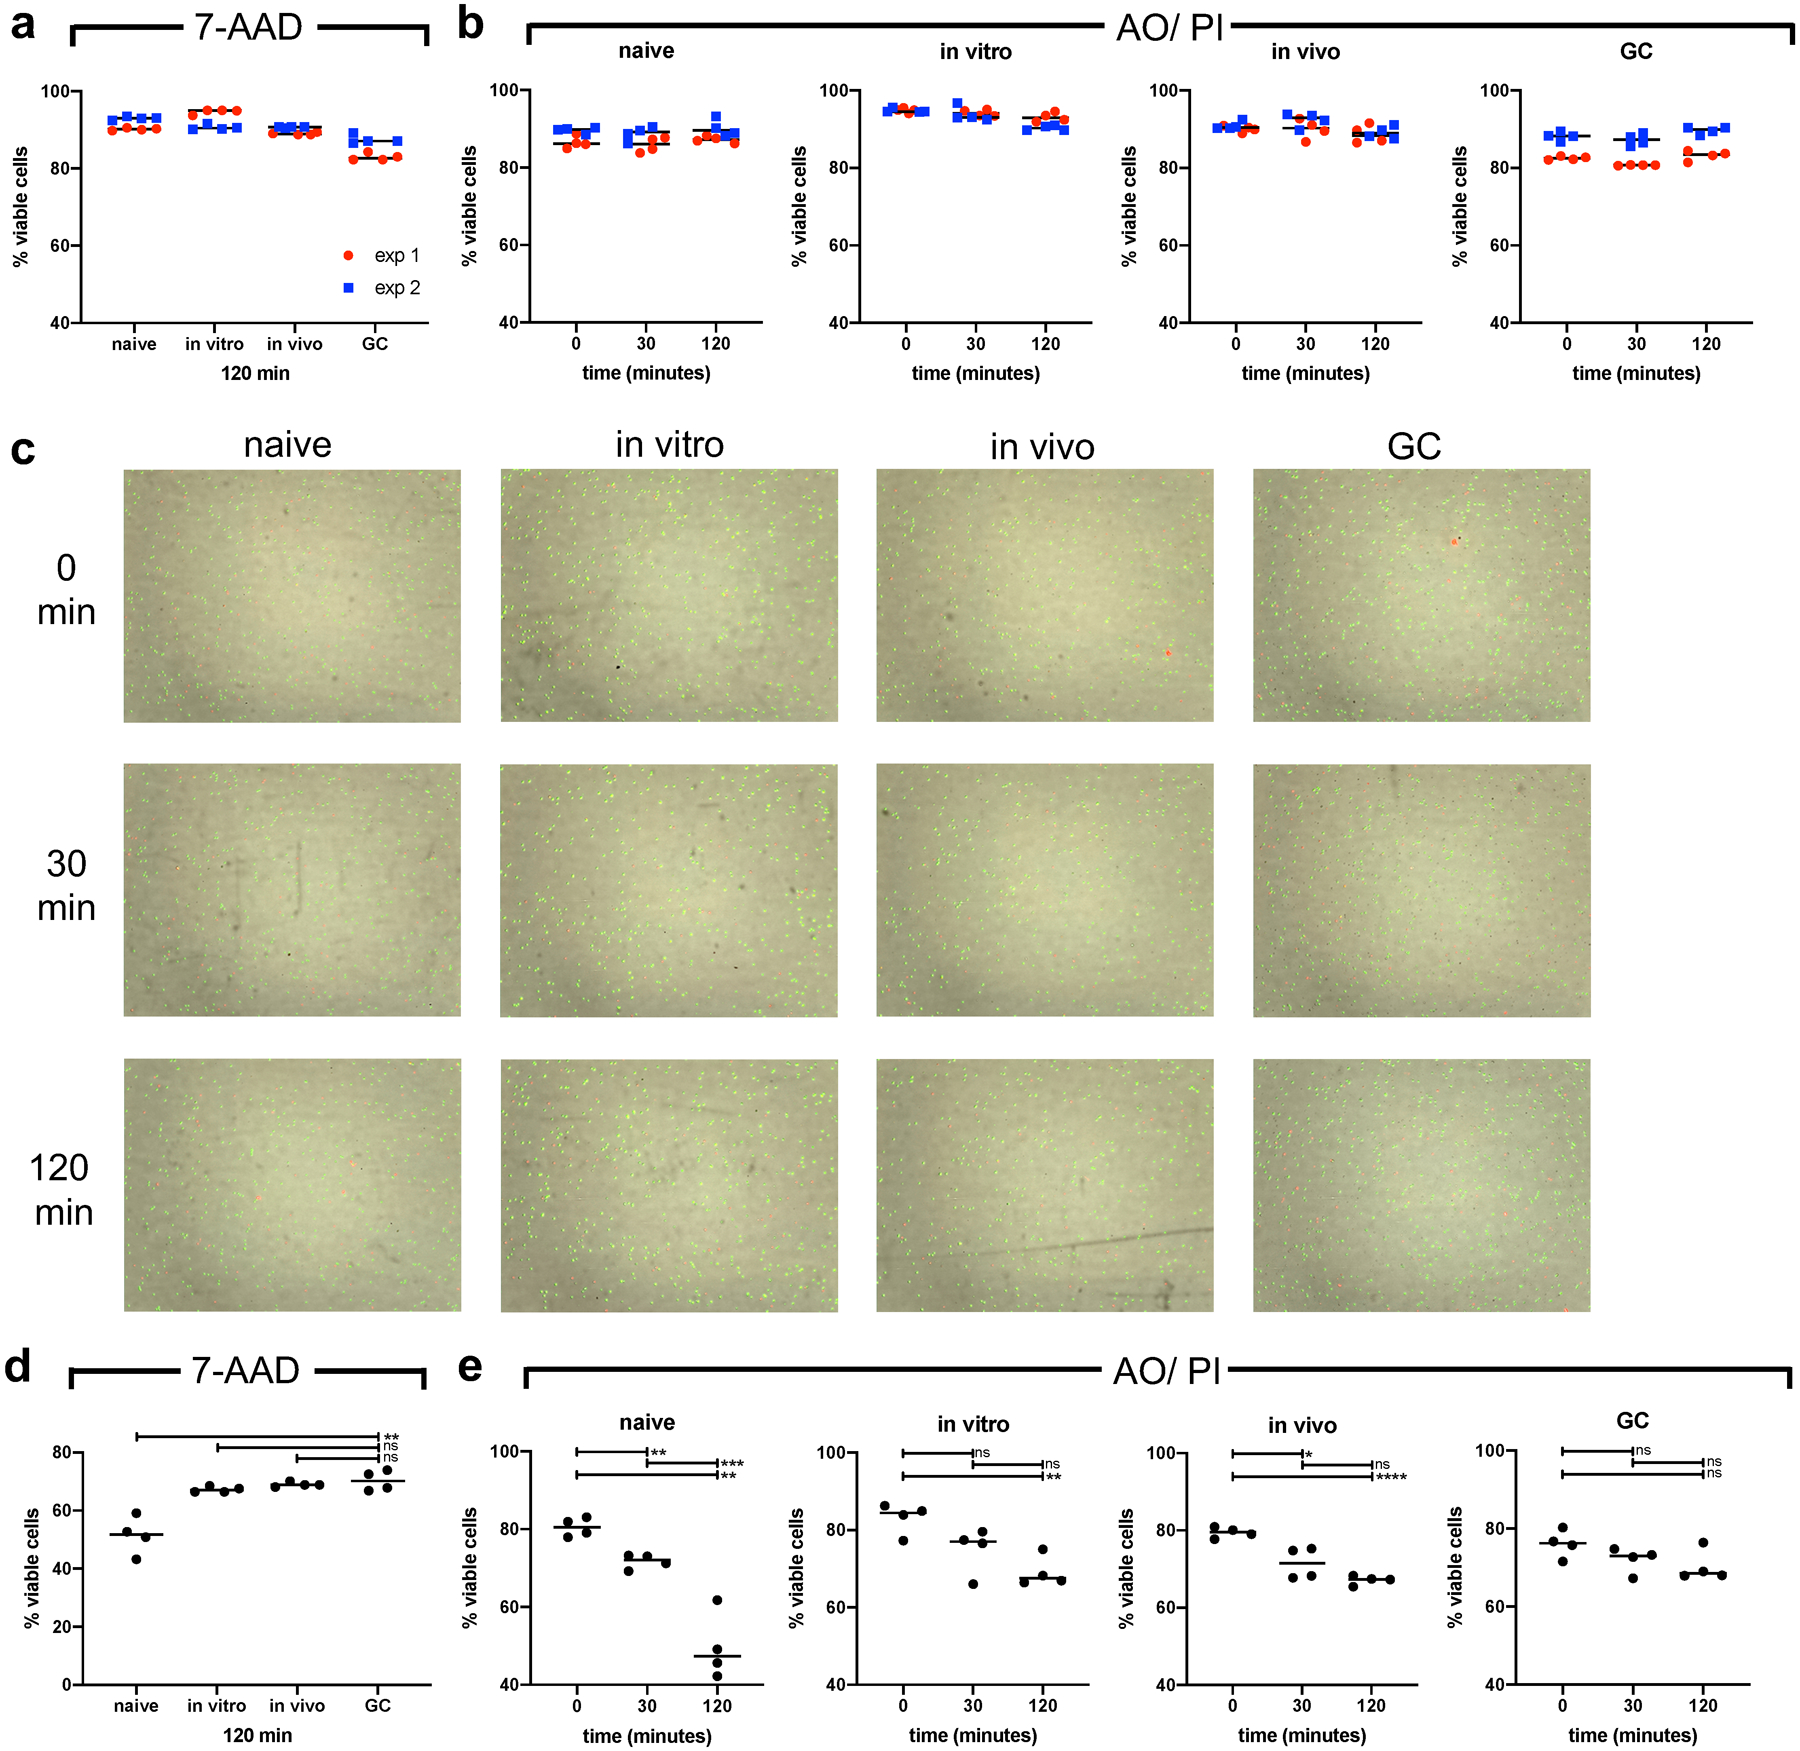
Indicated cell populations were bead purified and cultured either in RPMI media (a-c) or Seahorse XF Cell Mito Stress test media (d and e) for depicted times. Cell viability was assayed flow-cytometric staining for 7-AAD (a and d) at 120min of culture and their viability was additionally determined at 0, 30 and 60min utilizing Luna-Fl™ automated counting with dual fluorescent microscope optics. Cells were exposed to acridine orange (AO) and propidium iodide (PI) simultaneously (b, c, e). Tabulated data are presented in (a) and (b) of 2 independent experiments depicted in red and blue. (b) shows representative images of the Lina-Fl™ counter for data in (a). ns = not significant; *p ≤ 0.05; **p ≤ 0.01; ***p ≤ 0.001; ****p ≤ 0.0001 by unpaired, two-tailed t-test.
Extended Data Fig. 3. GCBC maintain key transcriptional profile during in vitro culture in support of figures 1, 2, 4, 5 and 6.
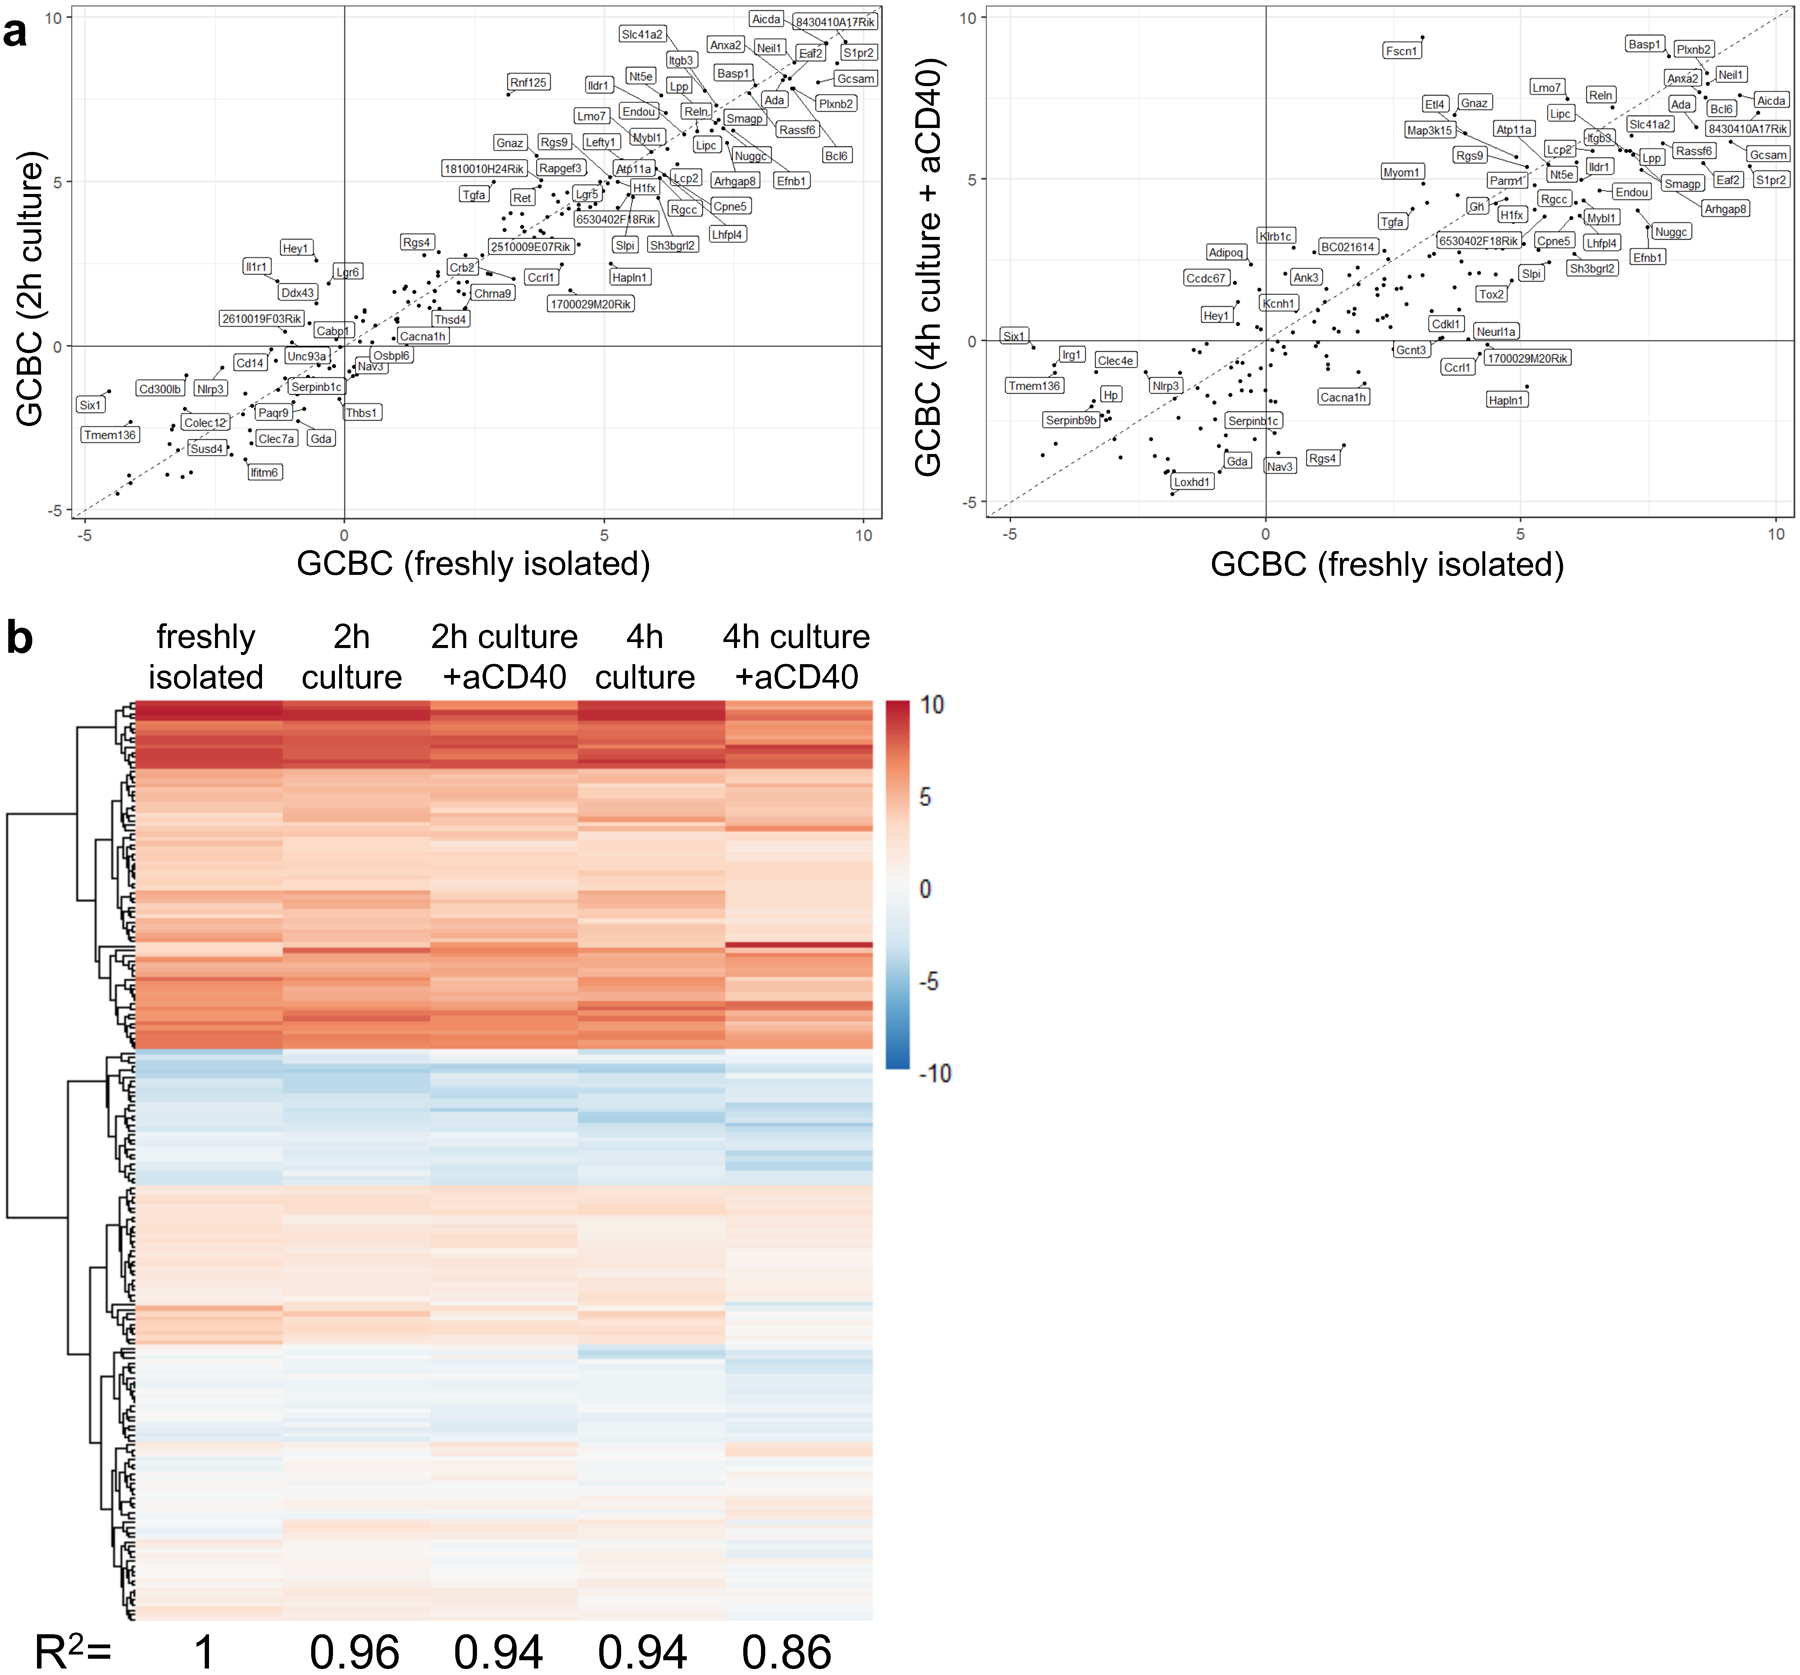
Comparison of transcriptional profile of 259 most differentially regulated GC genes. Genes shown are most differentially regulated between freshly isolated GCBC and in vivo activated B cells (FDR < 0.01; FC > 4 log2) and therefore serve as GCBC identifier geneset. a, correlation of GCBC identifier genes of freshly isolated GCBC and GCBC cultured for 2h (left; R2=0.96) which matches the conditions of seahorse experiments or GCBC cultured for 4h with aCD40 (right; R2=0.86) which matches our 13C tracing studies. b, heatmap of expression levels of 267 GCBC identifier genes in freshly isolated (left column) and cultured GCBC under depicted conditions. R-correlation of freshly isolated GCBC to all culture conditions is depicted below each column and was computed using R “cor” function with “pearson” method.
Extended Data Fig. 4. GCBC only take up minimal amounts of glucose but physiological amounts of FFA in support of figure 3.
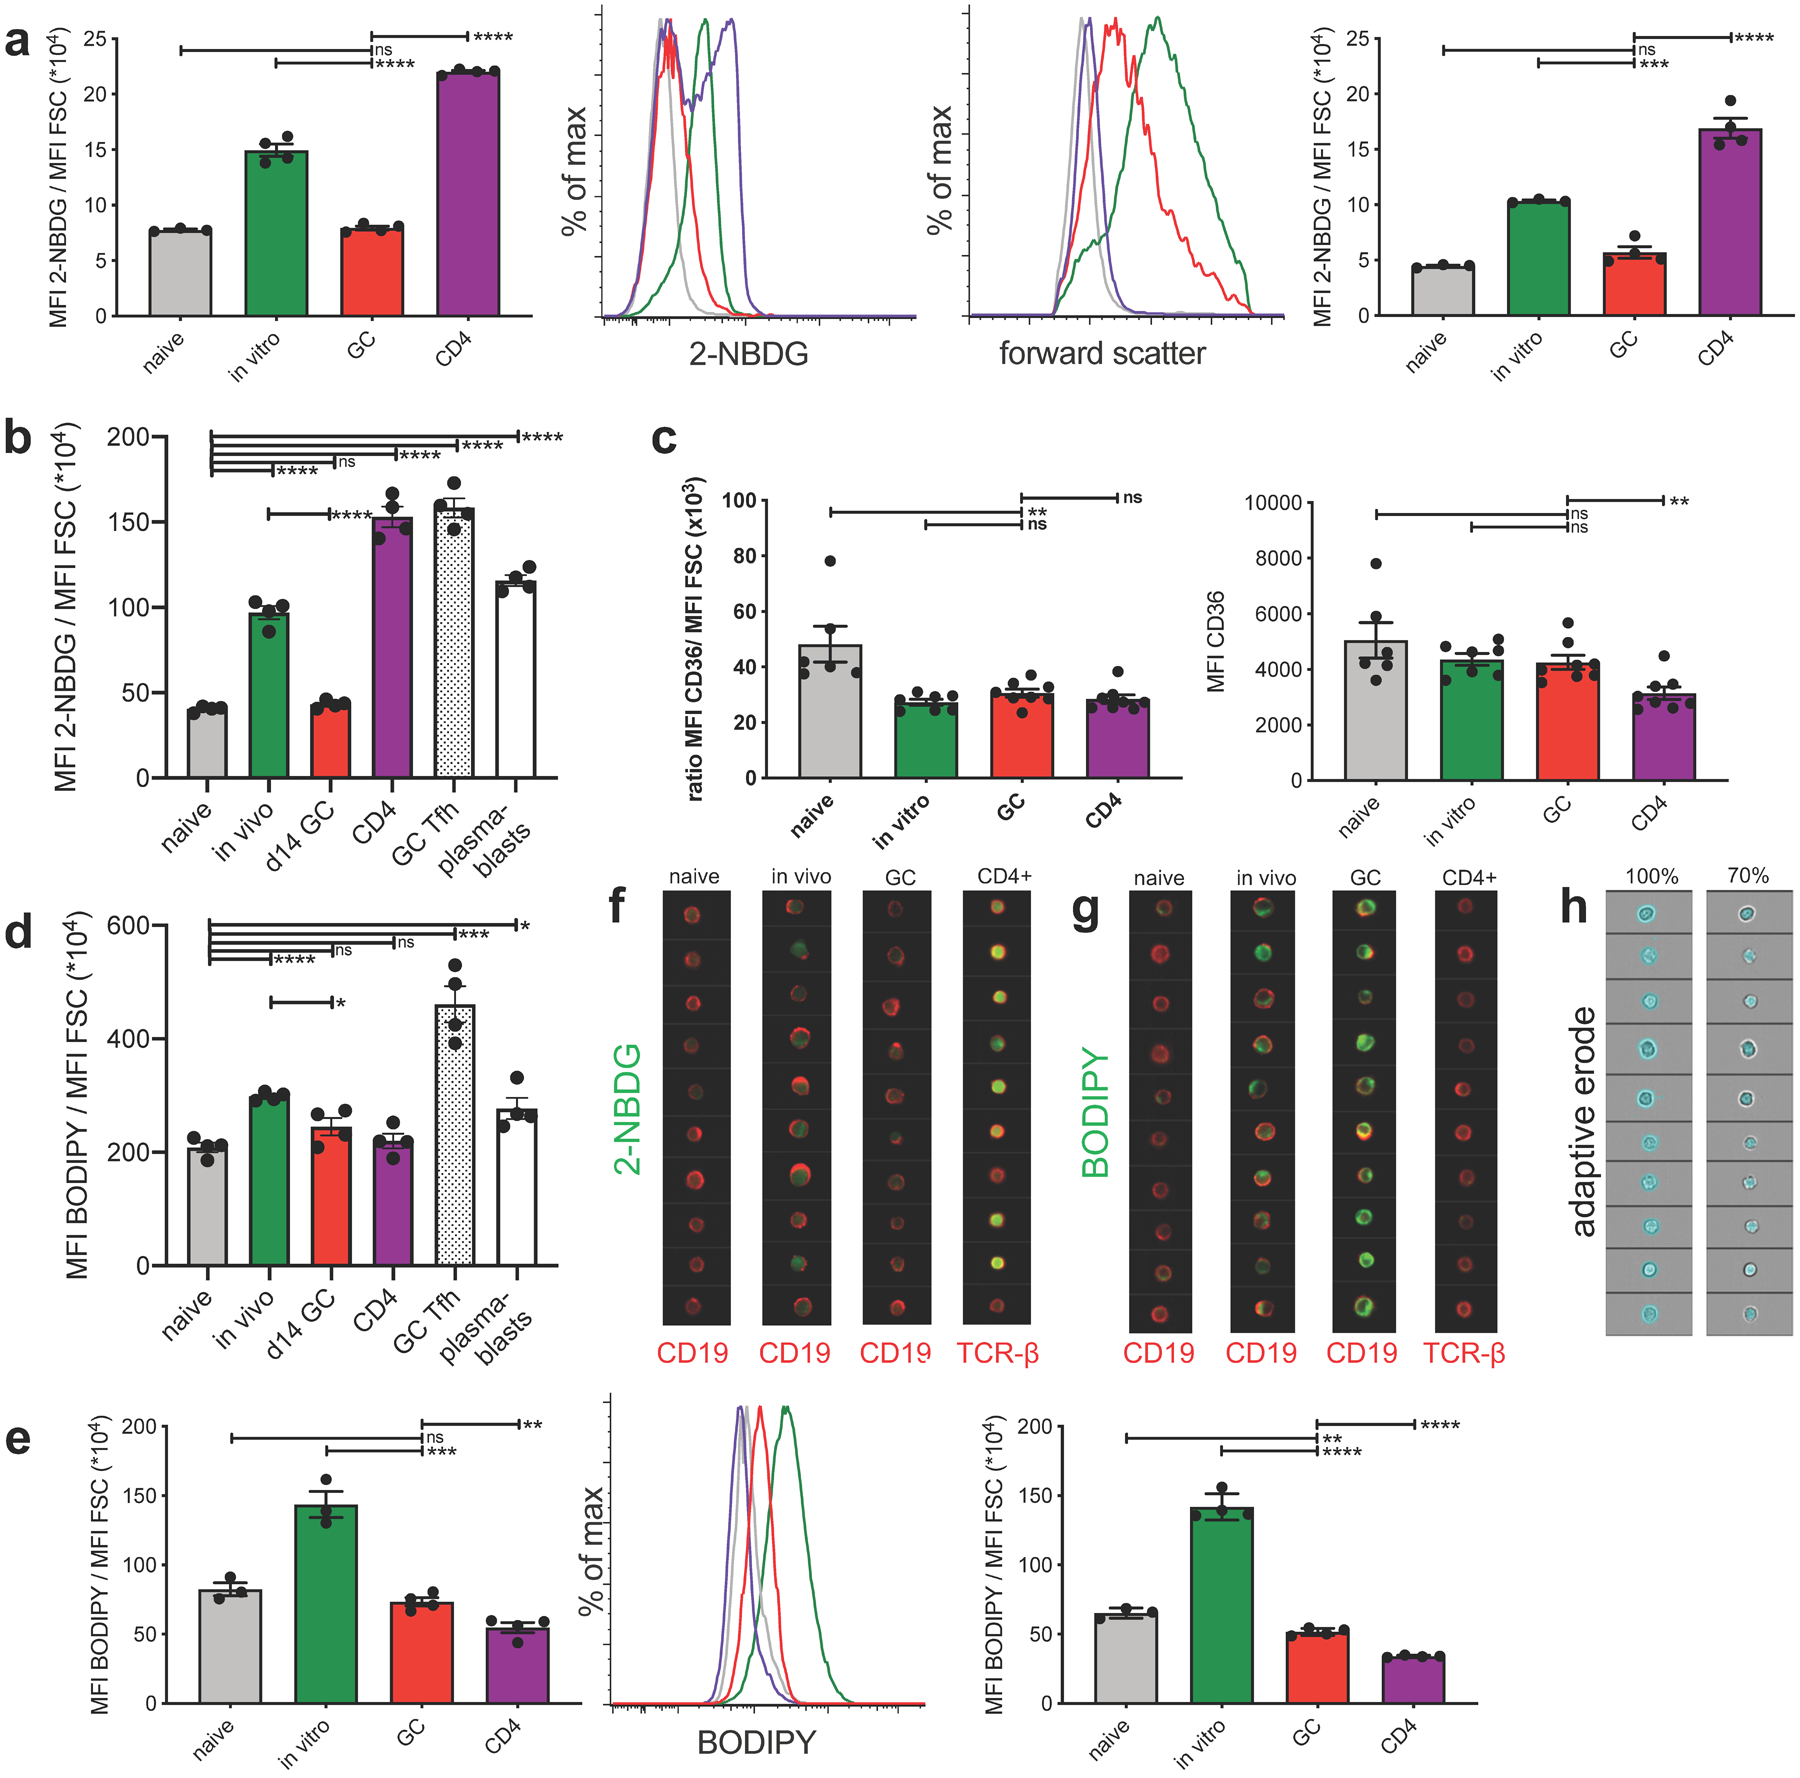
a, tabulated data of mean 2-NBDG fluorescence normalized to cell size (left) and representative flow histograms of 2-NBDG fluorescence (center left) and forward scatter (center right) of indicated cell populations pulsed in vitro for 30 min with 2-NBDG. Right shows an independent repeat of left. b, independent repeat of data presented in Figure 3a. c, tabulated data of mean CD36 fluorescence normalized to cell size (left) and mean CD36 fluorescence of indicated cell populations. Shown are combined data of 2 independent experiments. d, independent repeat of data presented in Figure 3b. e, tabulated data of mean BODIPY fluorescence normalized to cell size (left) and representative flow histograms of BODIPY fluorescence (middle) of indicated cell populations, pulsed in vitro for 30min with BODIPY. Right panel shows an independent repeat of left panel. f and g, representative Amnis ImageStream images of cells presented in Fig. 3c and 3d, respectively. h, representative images of adaptive erode function for 100% (total cell, left) and 70% (intracellular, right). Fluorescence intensity is only calculated from areas colored in blue of the same cells shown in left and right panels. Bars represent mean +/− SEM; ns= not significant; *p ≤ 0.05; **p ≤ 0.01; ***p ≤ 0.001; ****p ≤ 0.0001 by unpaired, two-tailed t-test.
Extended Data Fig. 5. Combined inhibition of mitochondrial and peroxisomal FAO with increased in vivo dosage of etomoxir and thioridazine in support of figure 5.

Absolute number of live splenic NP+ GCBC (a) and naïve NP− B cells (b) and MFI of 2-NBDG of GCBC after 30min 2-NBDG in vitro pulse (c) of mice at d14 post NP-CGG immunization and in vivo treatment at d9, d11 and d13 with 22 mg/kg etomoxir and 11mg/kg thioridazine or vehicle only as in Fig. 5c–e. Every dot represents and individual mouse and graphs are mean +/−SEM; ns = not significant; ****p<0.0001 by unpaired, two-tailed t-test.
Extended Data Fig. 6. Independent repeat of 13C carbon tracing by LC-HRMS and Hexokinase-2 mRNA expression in support of Fig. 5.
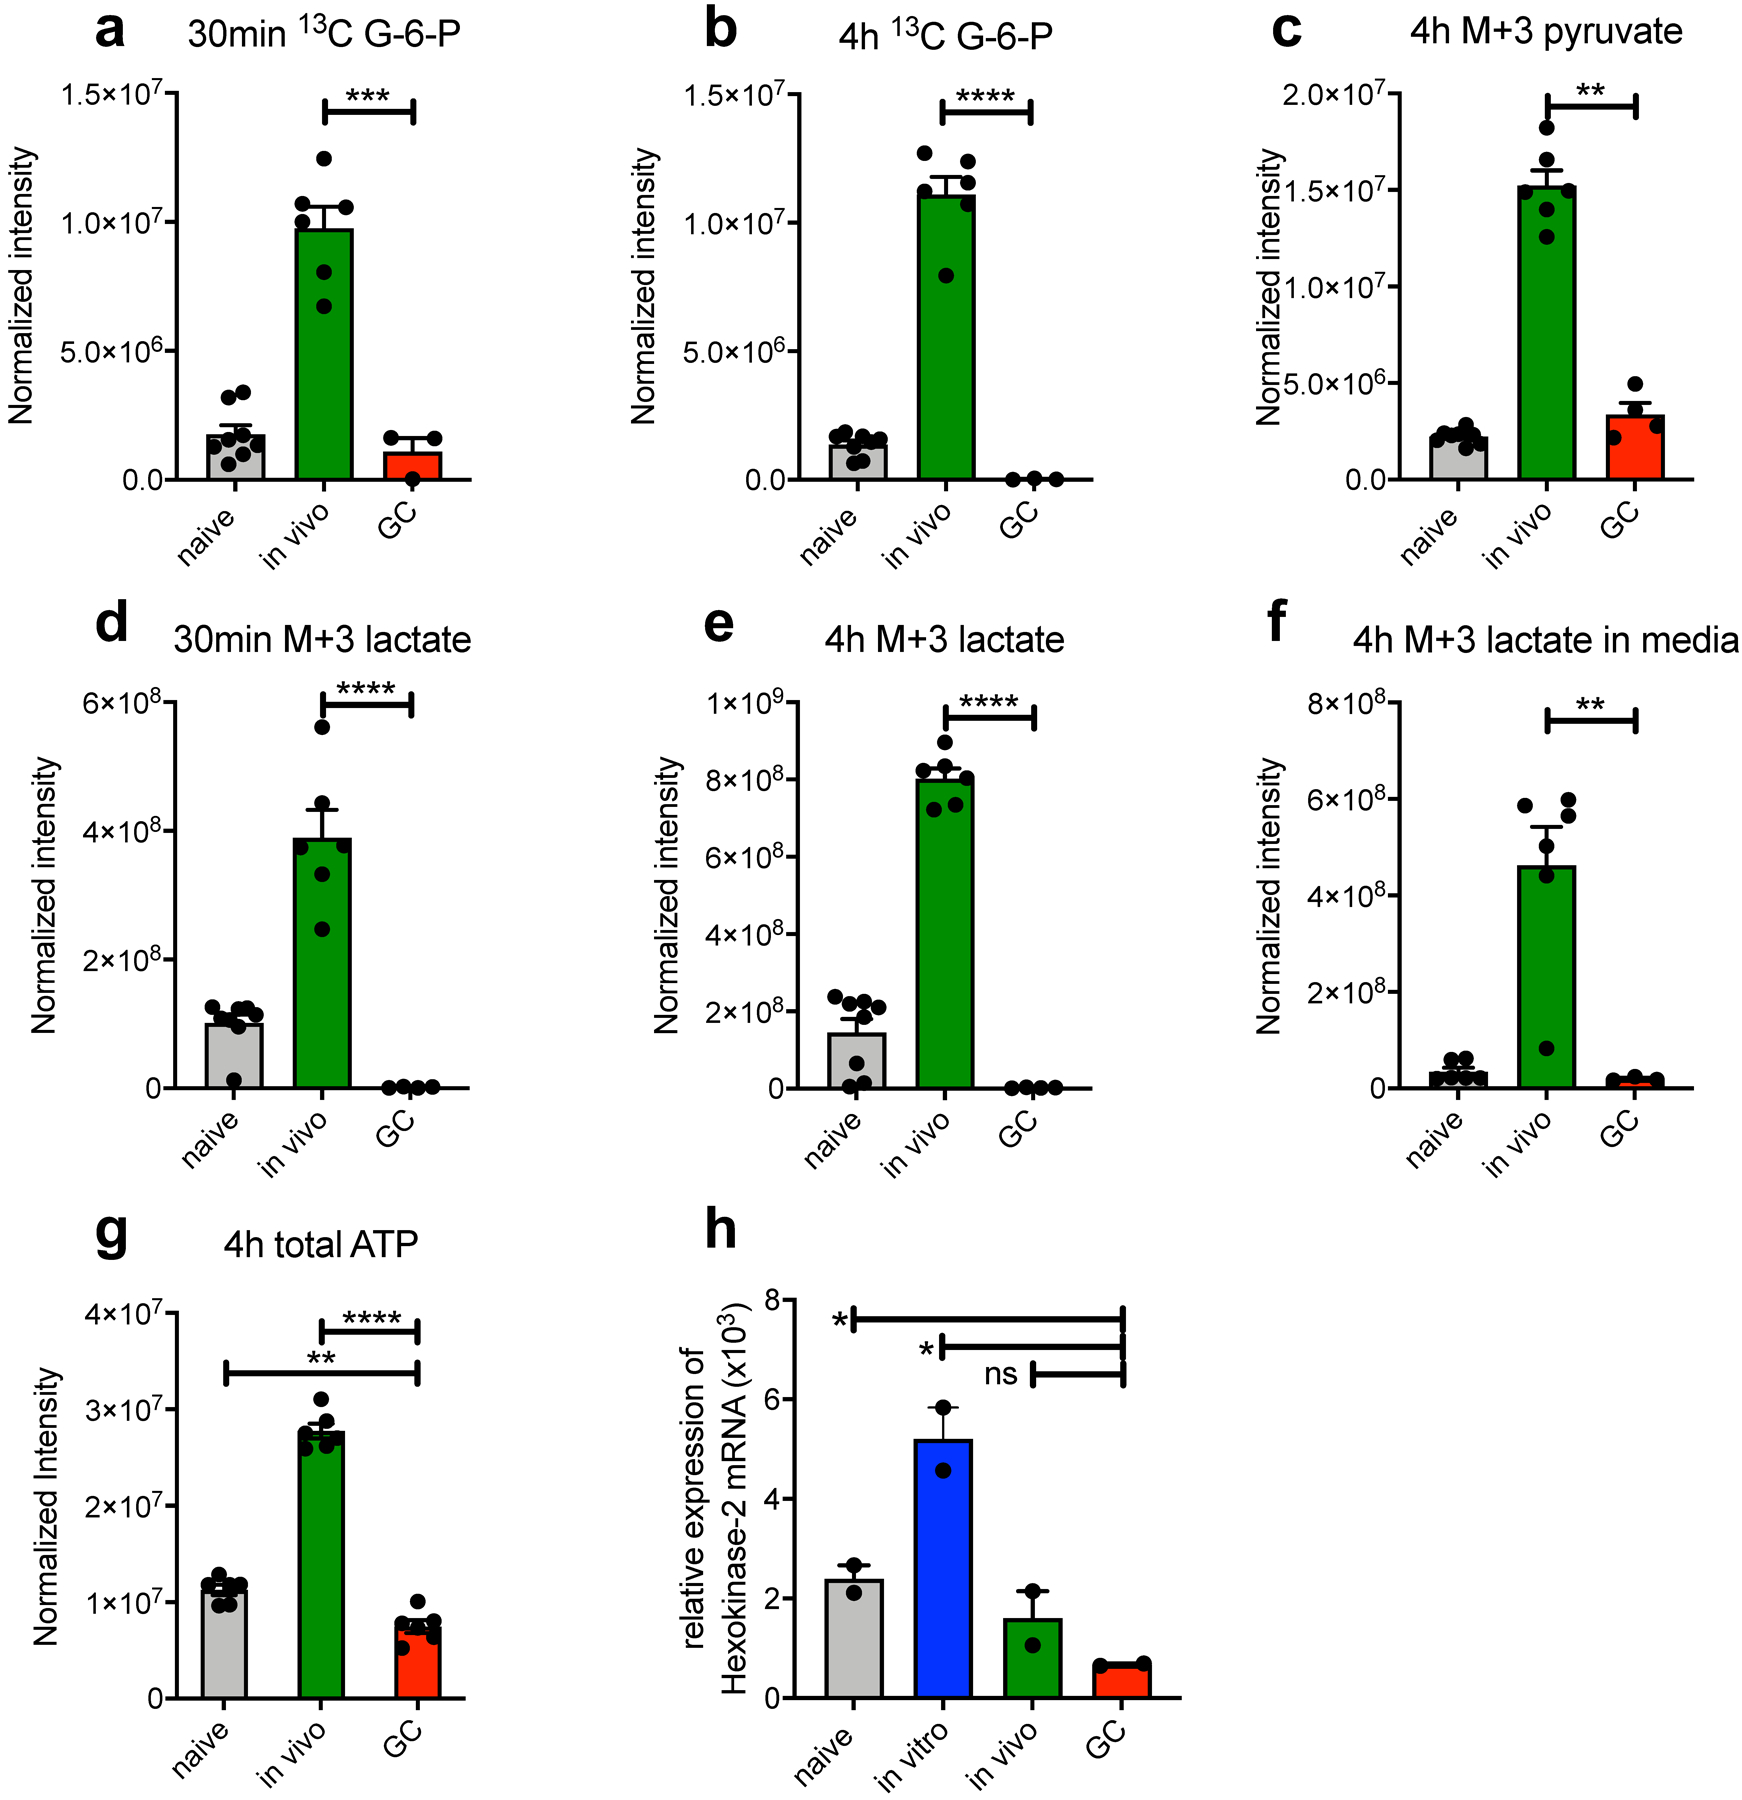
(a-g) Bead purified naive, in vivo activated and GC B cells were stimulated with anti-CD40 in glucose and glutamine free RPMI media with the addition of 2 mg/ml [13C6]-glucose for 30min or 4h. Cells (a-e, g) and supernatants (f) were then subjected to LC-HRMS. Depicted is one representative experiment with n=6 per sample. Each n represents a pool of 3 individual wells. (H) qRT-PCR for Hexokinase-2 expression from freshly isolated cell populations relative to RPS9. Bars are means +/−SEM. Normalization was performed as described in the methods section; ns = not significant; *p ≤ 0.05; **p ≤ 0.01; ***p ≤ 0.001; ****p ≤ 0.0001 by unpaired, two-tailed t-test.
Extended Data Fig. 7. In vivo 13C tracing in support of figure 6.
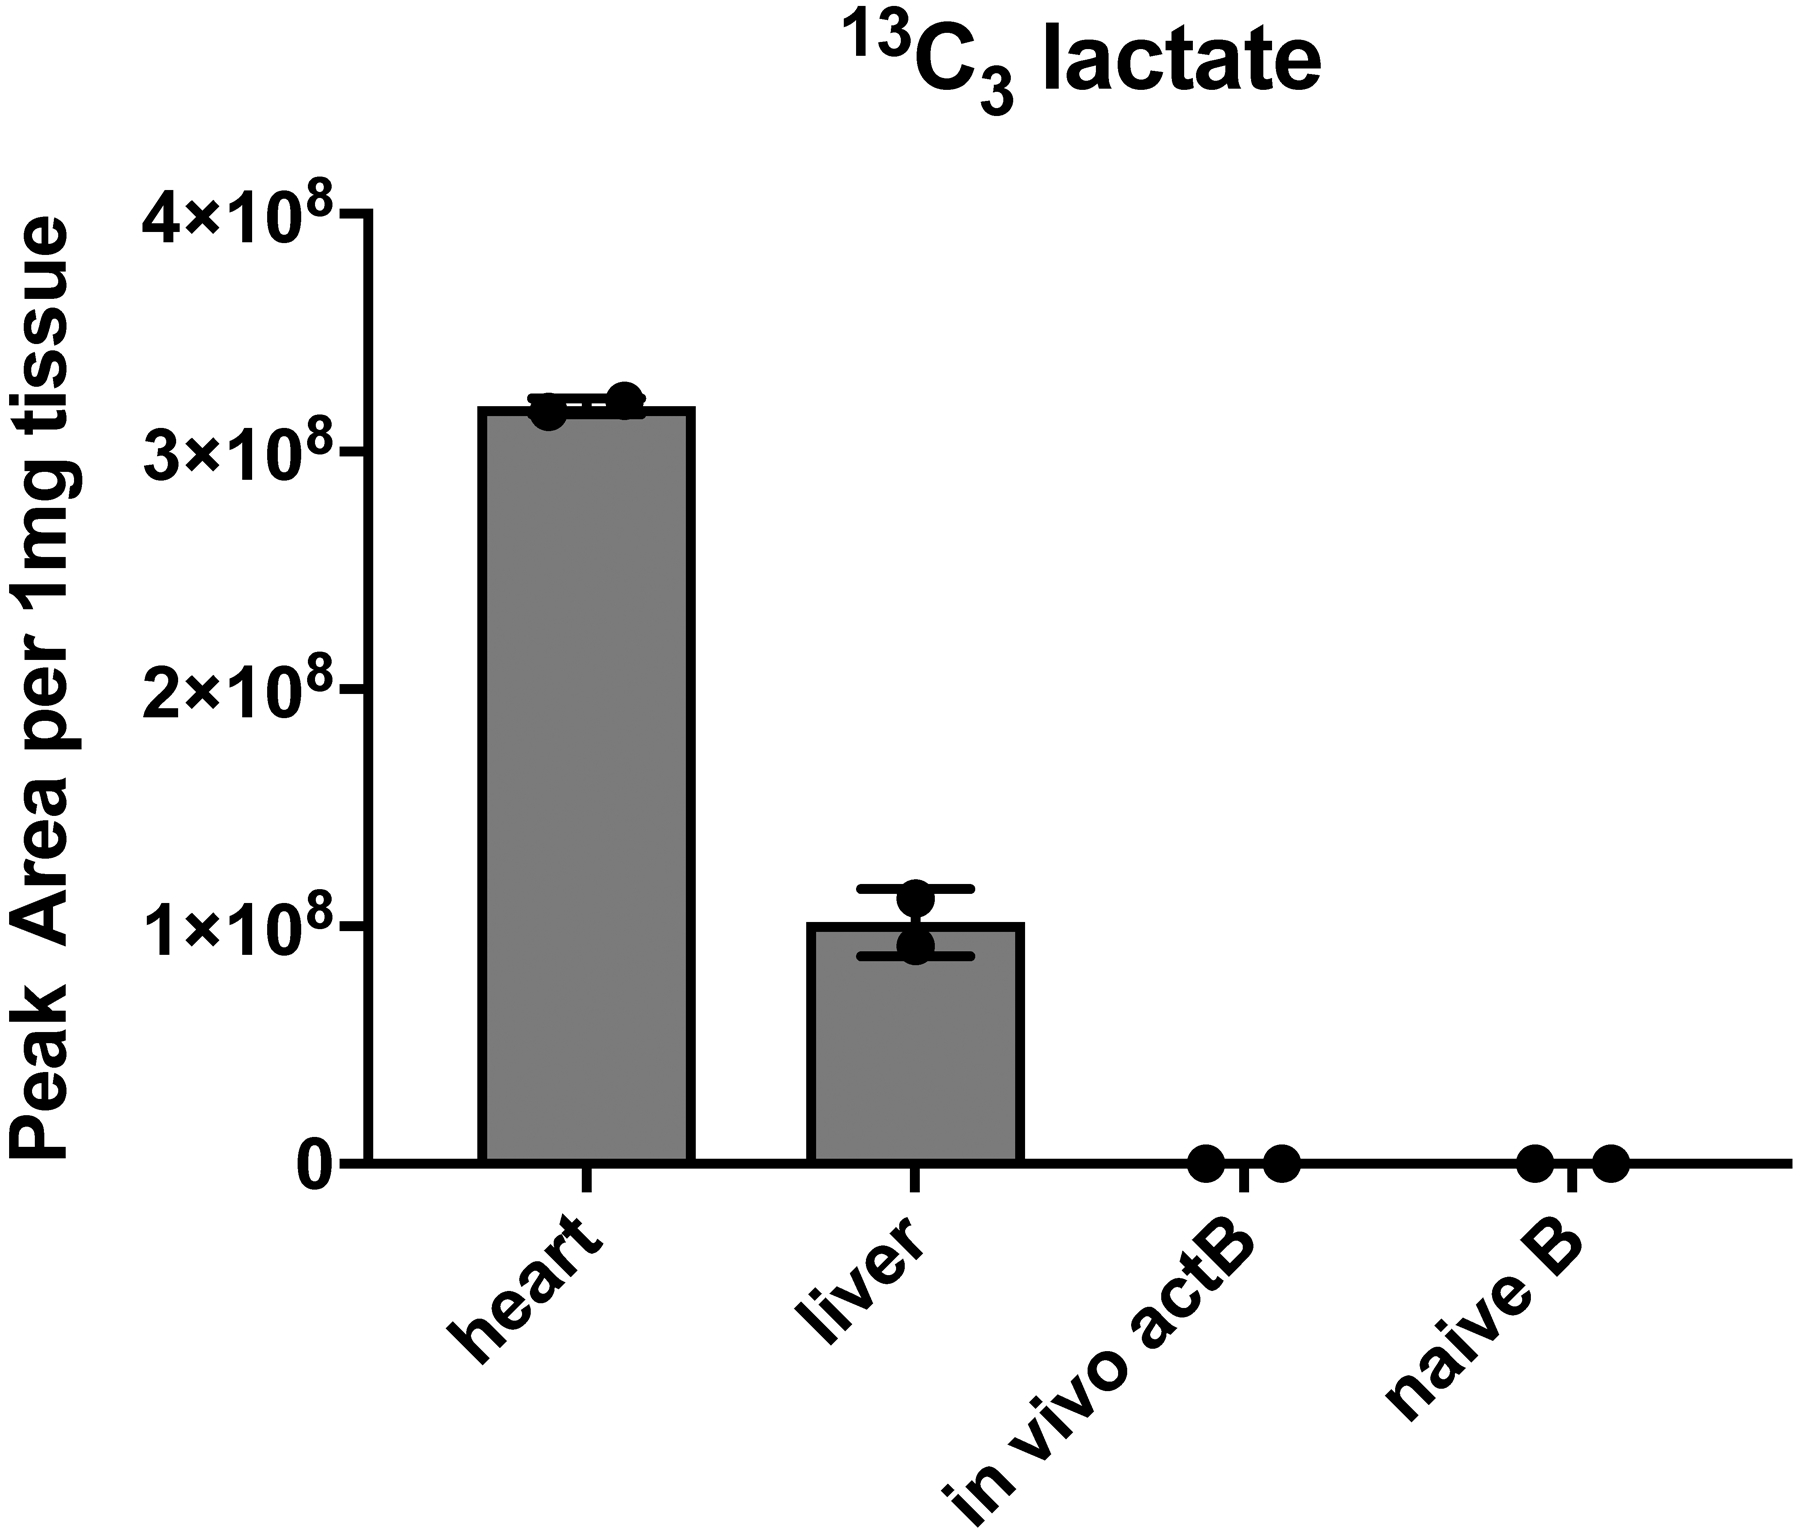
LC-HRMS analysis of 13C3 lactate generated from 8h continuous 13C6 glucose infusion using an “insulin clamp”. Mice received a primed (42.5 mU/kg)/continuous (4.5 mU/kg/min) infusion of insulin and a variable infusion of 20% glucose (50% 13C6-glucose : 50% 12C-glucose) to maintain euglycemia for 480 min. Mice were sacrificed and heart and liver were disrupted in liquid nitrogen. B cell populations were isolated as in Extended Data Fig. 1 and all samples were subjected to 13C3-lactate detection by liquid chromatography-high resolution mass spectrometry.
Extended Data Fig. 8. Absence of hypoxia-related gene signatures in the GCBC transcriptome in support of figure 7.
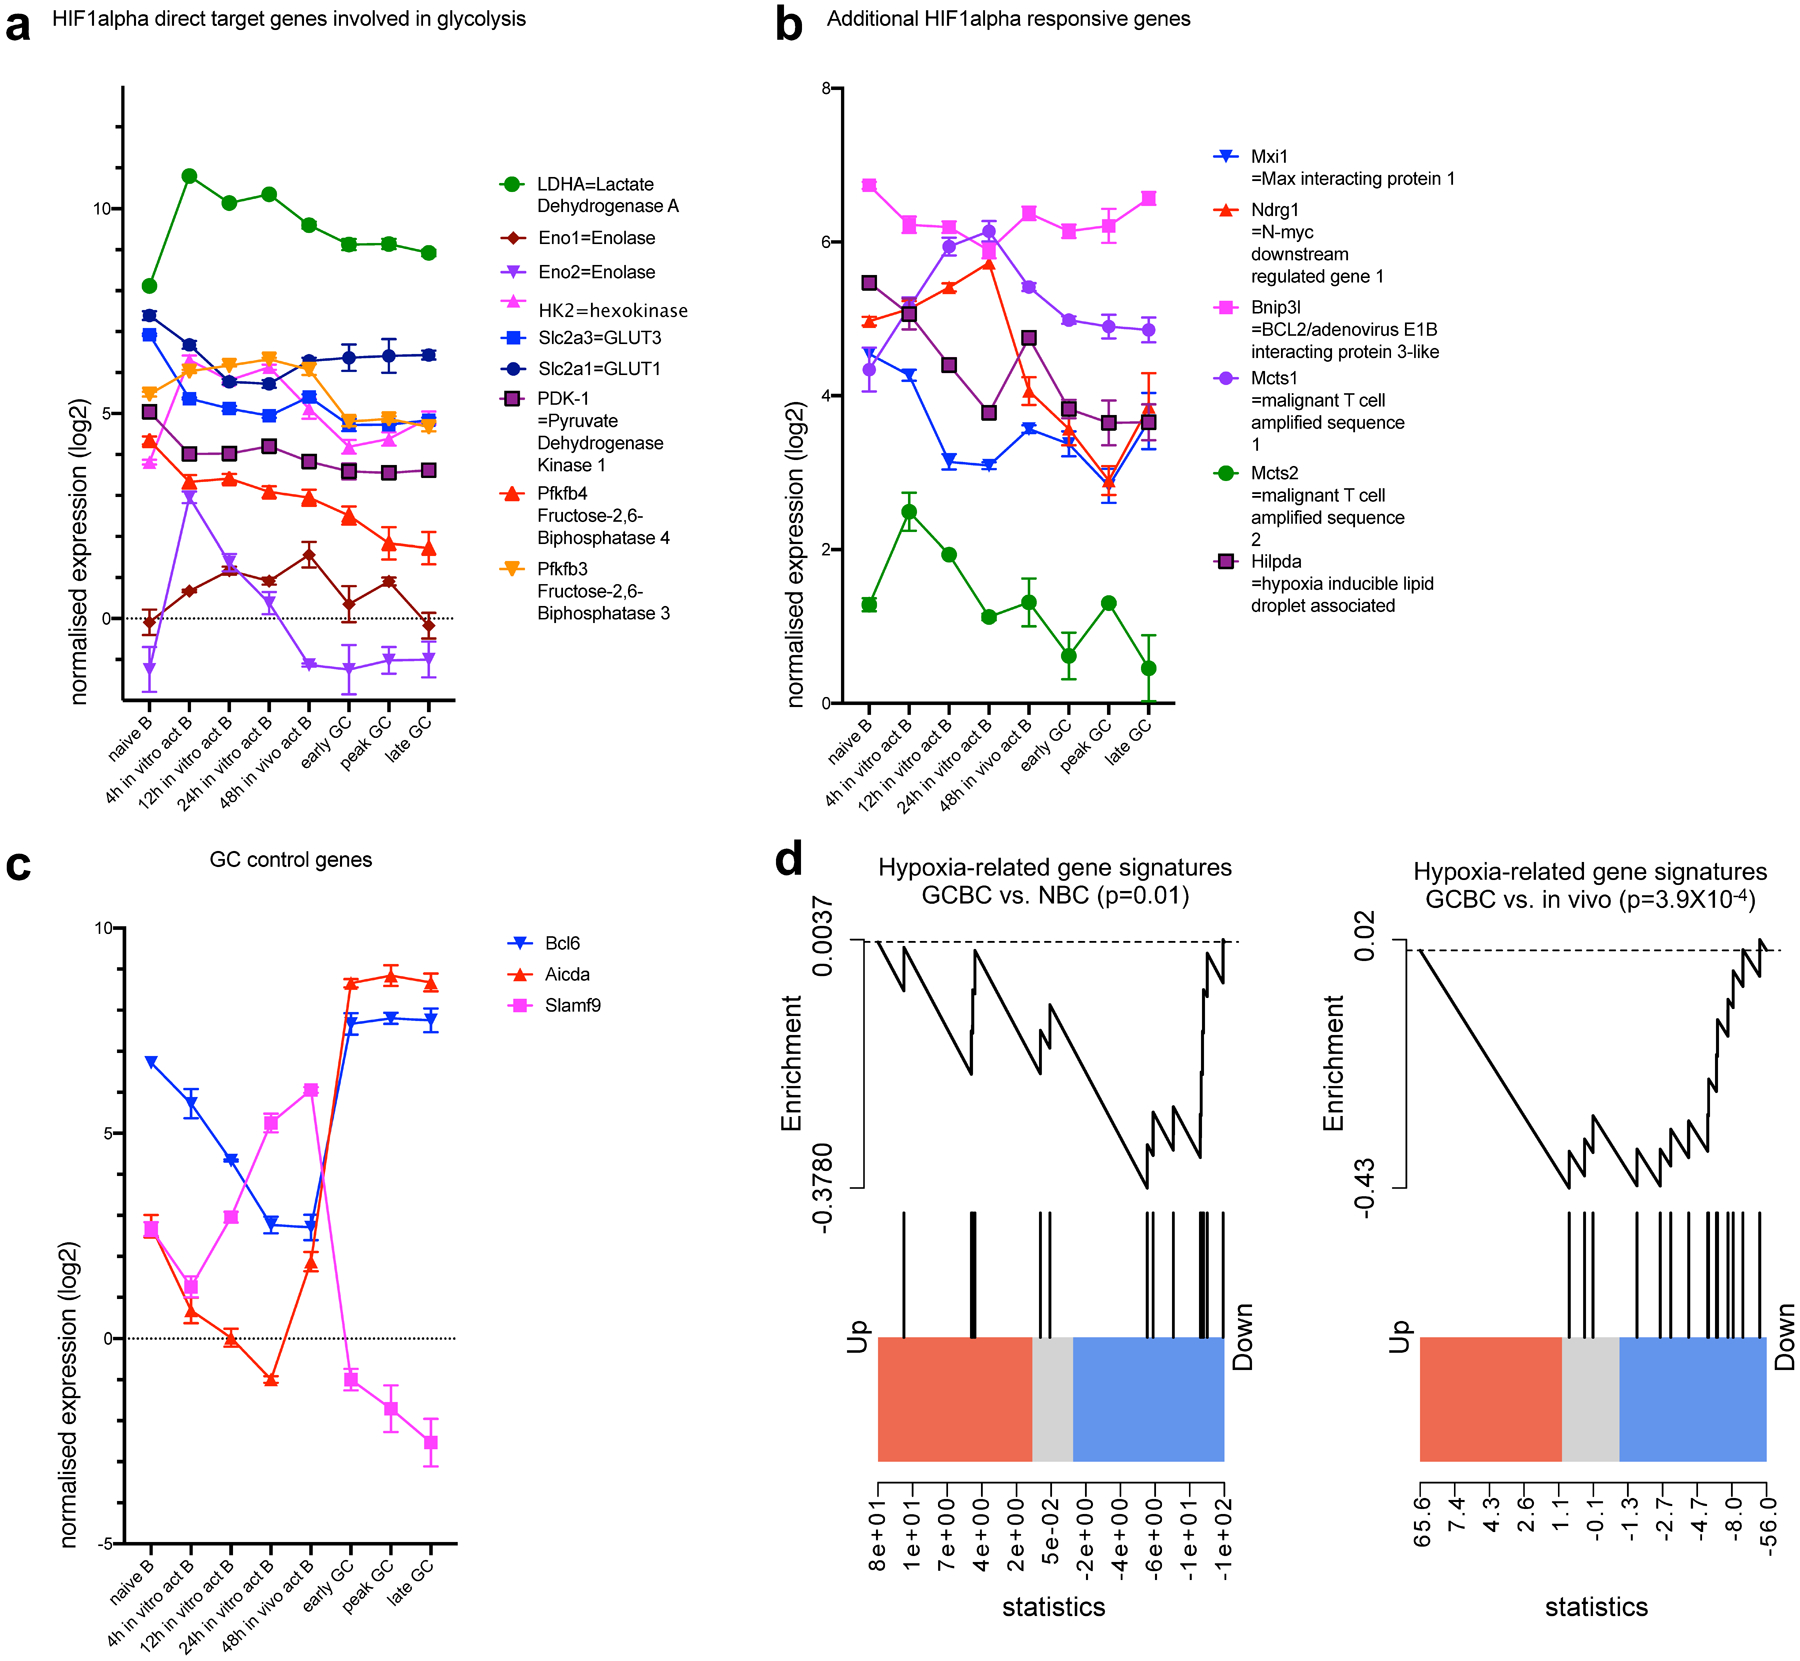
Depicted are quantile normalized expression values of HIF1alpha direct target genes that are involved in glycolysis (a) or not involved in glycolysis (b) and control genes that are known to be expressed or absent in GCBC (c). Significant down-regulation of hypoxia-related gene signatures in GCBC transcriptome compared to naïve B cells (left of d) and in vivo activated B cells (right of d). Data were obtained by RNA-sequencing of indicated cell populations as in Extended Data Fig. 1. Shown are averages of 3 independent RNA sequencing reactions per cell population with x-axis showing different cell populations as defined in the text (a-c). Genes are connected by lines for easier visualization and bars are means +/−SEM. Gene set enrichment plots illustrating differentially expressed genes in peak GCBCs compared to naive (left of d) and in vivo activated B cells (right of d; n=3 per group) with respect to genes depicted in a and b. p-values were calculated using the rankSumTestWithCorrelation function in limma with t statistics.
Supplementary Material
ACKNOWLEDGMENTS
We thank R. Moreci and M. Carter for supporting experimental procedures, D. Falkner and A. Yates for cell sorting. This work was funded by NIH R01 AI-46303 and NIH R01 AI-105018 to MJS. SKF-015-039, SU2C-IRG-016-08 and start-up funds to G.M.D. through the Tumor Microenvironment Center at the University of Pittsburgh. T.H.W. was funded by the Deutsche Forschungsgemeinschaft (TRR130) and S.G.W through S10OD023402. This work benefitted from ImageStreamX MARKII grant NIH 1S10OD019942-01.
Footnotes
Reporting Summary
Further information on research design is available in the Nature Research Reporting Summary linked to this article.
Data availability statement:
The data that support the findings of this study are available from the corresponding author upon request. RNA sequencing data have been deposited in the Gene Expression Omnibus with the accession code GSE128710.
Competing financial interest
Authors declare that they have no competing financial interest.
SUPPLEMENTARY MATERIALS
REFERENCES
- 1.Herrera E, A CM & Blasco MA Impaired germinal center reaction in mice with short telomeres. EMBO J 19, 472–481 (2000). [DOI] [PMC free article] [PubMed] [Google Scholar]
- 2.Raso F et al. αv Integrins regulate germinal center B cell responses through noncanonical autophagy. J. Clin. Invest 128, 4163–4178 (2018). [DOI] [PMC free article] [PubMed] [Google Scholar]
- 3.Allen CDC, Okada T & Cyster JG Germinal-center organization and cellular dynamics. Immunity 27, 190–202 (2007). [DOI] [PMC free article] [PubMed] [Google Scholar]
- 4.Shlomchik MJ & Weisel F B cell primary immune responses. Immunol Rev 288, 5–9 (2019). [DOI] [PubMed] [Google Scholar]
- 5.Ganeshan K & Chawla A Metabolic Regulation of Immune Responses. Annu Rev Immunol 32, 609–634 (2014). [DOI] [PMC free article] [PubMed] [Google Scholar]
- 6.Jung J, Zeng H & Horng T Metabolism as a guiding force for immunity. Nat Cell Biol 21, 85–93 (2019). [DOI] [PubMed] [Google Scholar]
- 7.Pearce EL & Pearce EJ Metabolic Pathways in Immune Cell Activation and Quiescence. Immunity 38, 633–643 (2013). [DOI] [PMC free article] [PubMed] [Google Scholar]
- 8.Jang K-J et al. Mitochondrial function provides instructive signals for activation-induced B-cell fates. Nat Commun 6, 6750 (2015). [DOI] [PMC free article] [PubMed] [Google Scholar]
- 9.Weinberg SE, Sena LA & Chandel NS Mitochondria in the Regulation of Innate and Adaptive Immunity. Immunity 42, 406–417 (2015). [DOI] [PMC free article] [PubMed] [Google Scholar]
- 10.Waters LR, Ahsan FM, Wolf DM, Shirihai O & Teitell MA Initial B Cell Activation Induces Metabolic Reprogramming and Mitochondrial Remodeling. iScience 5, 99–109 (2018). [DOI] [PMC free article] [PubMed] [Google Scholar]
- 11.Vander Heiden MG, Cantley LC & Thompson CB Understanding the Warburg Effect: The Metabolic Requirements of Cell Proliferation. Science 324, 1029–1033 (2009). [DOI] [PMC free article] [PubMed] [Google Scholar]
- 12.Fox CJ, Hammerman PS & Thompson CB Fuel feeds function: energy metabolism and the T-cell response. Nat Rev Immunol 5, 844–852 (2005). [DOI] [PubMed] [Google Scholar]
- 13.Jellusova J et al. Gsk3 is a metabolic checkpoint regulator in B cells. Nat Immunol 18, 303–312 (2017). [DOI] [PMC free article] [PubMed] [Google Scholar]
- 14.Cho SH et al. Germinal centre hypoxia and regulation of antibody qualities by a hypoxia response system. Nature 537, 234–238 (2016). [DOI] [PMC free article] [PubMed] [Google Scholar]
- 15.Eales KL, Hollinshead KER & Tennant DA Hypoxia and metabolic adaptation of cancer cells. Oncogenesis 2016 5:1 5, e190–e190 (2016). [DOI] [PMC free article] [PubMed] [Google Scholar]
- 16.Shi W et al. Transcriptional profiling of mouse B cell terminal differentiation defines a signature for antibody-secreting plasma cells. Nat Immunol 16, 663–673 (2015). [DOI] [PubMed] [Google Scholar]
- 17.Shlomchik MJ & Weisel F Germinal center selection and the development of memory B and plasma cells. Immunol Rev 247, 52–63 (2012). [DOI] [PubMed] [Google Scholar]
- 18.van Nierop K et al. Lysosomal Destabilization Contributes to Apoptosis of Germinal Center B-lymphocytes. J Histochem Cytochem 54, 1425–1435 (2006). [DOI] [PMC free article] [PubMed] [Google Scholar]
- 19.Pound JD & Gordon J Maintenance of Human Germinal Center B Cells In Vitro. Blood 89, 919–928 (1997). [PubMed] [Google Scholar]
- 20.Chang C-H et al. Posttranscriptional Control of T Cell Effector Function by Aerobic Glycolysis. Cell 153, 1239–1251 (2013). [DOI] [PMC free article] [PubMed] [Google Scholar]
- 21.Doughty CA Antigen receptor-mediated changes in glucose metabolism in B lymphocytes: role of phosphatidylinositol 3-kinase signaling in the glycolytic control of growth. Blood 107, 4458–4465 (2006). [DOI] [PMC free article] [PubMed] [Google Scholar]
- 22.Deng J et al. Homocysteine Activates B Cells via Regulating PKM2-Dependent Metabolic Reprogramming. J. Immunol 198, 170–183 (2016). [DOI] [PMC free article] [PubMed] [Google Scholar]
- 23.Wolf HP Possible new therapeutic approach in diabetes mellitus by inhibition of carnitine palmitoyltransferase 1 (CPT1). Horm. Metab. Res. Suppl 26, 62–67 (1992). [PubMed] [Google Scholar]
- 24.Yao C-H et al. Identifying off-target effects of etomoxir reveals that carnitine palmitoyltransferase I is essential for cancer cell proliferation independent of β-oxidation. PLoS Biol 16, e2003782 (2018). [DOI] [PMC free article] [PubMed] [Google Scholar]
- 25.Reddy JK & Hashimoto T Peroxisomal beta-oxidation and peroxisome proliferator-activated receptor alpha: an adaptive metabolic system. Annu. Rev. Nutr 21, 193–230 (2001). [DOI] [PubMed] [Google Scholar]
- 26.Van den Branden C & Roels F Thioridazine: a selective inhibitor of peroxisomal beta-oxidation in vivo. FEBS Lett. 187, 331–333 (1985). [DOI] [PubMed] [Google Scholar]
- 27.Luo W, Weisel F & Shlomchik MJ B Cell Receptor and CD40 Signaling Are Rewired for Synergistic Induction of the c-Myc Transcription Factor in Germinal Center B Cells. Immunity 48, 313–326.e5 (2018). [DOI] [PMC free article] [PubMed] [Google Scholar]
- 28.Sun L, Shukair S, Naik TJ, Moazed F & Ardehali H Glucose Phosphorylation and Mitochondrial Binding Are Required for the Protective Effects of Hexokinases I and II. Mol Cell Biol 28, 1007–1017 (2008). [DOI] [PMC free article] [PubMed] [Google Scholar]
- 29.Chaudhry R & Varacallo M in StatPearls 41, 325–338 (StatPearls Publishing, 2018). [Google Scholar]
- 30.Pietrocola F, Galluzzi L, Bravo-San Pedro JM, Madeo F & Kroemer G Acetyl coenzyme A: a central metabolite and second messenger. Cell Metab 21, 805–821 (2015). [DOI] [PubMed] [Google Scholar]
- 31.Thapa D et al. Adropin treatment restores cardiac glucose oxidation in pre-diabetic obese mice. J Mol Cell Cardiol. 129, 174–178 (2019). [DOI] [PMC free article] [PubMed] [Google Scholar]
- 32.Abbott RK et al. Germinal Center Hypoxia Potentiates Immunoglobulin Class Switch Recombination. J Immunol 197, 4014–4020 (2016). [DOI] [PMC free article] [PubMed] [Google Scholar]
- 33.Schodel J et al. High-resolution genome-wide mapping of HIF-binding sites by ChIP-seq. Blood 117, e207–e217 (2011). [DOI] [PMC free article] [PubMed] [Google Scholar]
- 34.Taylor CT & Colgan SP Regulation of immunity and inflammation by hypoxia in immunological niches. Nat Rev Immunol 17, 774–785 (2017). [DOI] [PMC free article] [PubMed] [Google Scholar]
- 35.Weisel FJ, Zuccarino-Catania GV, Chikina M & Shlomchik MJ A Temporal Switch in the Germinal Center Determines Differential Output of Memory B and Plasma Cells. Immunity 44, 116–130 (2016). [DOI] [PMC free article] [PubMed] [Google Scholar]
- 36.Zuccarino-Catania GV et al. CD80 and PD-L2 define functionally distinct memory B cell subsets that are independent of antibody isotype. Nat Immunol 15, 631–637 (2014). [DOI] [PMC free article] [PubMed] [Google Scholar]
- 37.Boothby M & Rickert RC Metabolic Regulation of the Immune Humoral Response. Immunity 46, 743–755 (2017). [DOI] [PMC free article] [PubMed] [Google Scholar]
- 38.Choi S-C et al. Inhibition of glucose metabolism selectively targets autoreactive follicular helper T cells. Nat Commun 9, 4369 (2018). [DOI] [PMC free article] [PubMed] [Google Scholar]
- 39.Konigsberg M et al. Effect of oxygen tension on bioenergetics and proteostasis in young and old myoblast precursor cells. Redox Biology 1, 475–482 (2013). [DOI] [PMC free article] [PubMed] [Google Scholar]
- 40.Jacob J & Kelsoe G In situ studies of the primary immune response to (4-hydroxy-3-nitrophenyl)acetyl. II. A common clonal origin for periarteriolar lymphoid sheath-associated foci and germinal centers. J Exp Med 176, 679–687 (1992). [DOI] [PMC free article] [PubMed] [Google Scholar]
- 41.Tas JM et al. Visualizing antibody affinity maturation in germinal centers. Science 351, 1048–1054 (2016). [DOI] [PMC free article] [PubMed] [Google Scholar]
- 42.Degn SE et al. Clonal Evolution of Autoreactive Germinal Centers. Cell 170, 913–926.e19 (2017). [DOI] [PMC free article] [PubMed] [Google Scholar]
- 43.Martinez-Martin N et al. A switch from canonical to noncanonical autophagy shapes B cell responses. Science 355, 641–647 (2017). [DOI] [PMC free article] [PubMed] [Google Scholar]
- 44.Oestreich KJ et al. Bcl-6 directly represses the gene program of the glycolysis pathway. Nat Immunol 15, 957–964 (2014). [DOI] [PMC free article] [PubMed] [Google Scholar]
- 45.LaPensee CR, Lin G, Dent AL & Schwartz J Deficiency of the Transcriptional Repressor B Cell Lymphoma 6 (Bcl6) Is Accompanied by Dysregulated Lipid Metabolism. PLoS ONE 9, e97090 (2014). [DOI] [PMC free article] [PubMed] [Google Scholar]
- 46.Wilhelm K et al. FOXO1 couples metabolic activity and growth state in the vascular endothelium. Nature 529, 216–220 (2016). [DOI] [PMC free article] [PubMed] [Google Scholar]
- 47.Dominguez-Sola D et al. The FOXO1 Transcription Factor Instructs the Germinal Center Dark Zone Program. Immunity 43, 1064–1074 (2015). [DOI] [PubMed] [Google Scholar]
- 48.Sander S et al. PI3 Kinase and FOXO1 Transcription Factor Activity Differentially Control B Cells in the Germinal Center Light and Dark Zones. Immunity 43, 1075–1086 (2015). [DOI] [PubMed] [Google Scholar]
- 49.Dominguez-Sola D et al. The proto-oncogene MYC is required for selection in the germinal center and cyclic reentry. Nat Immunol 13, 1083–1091 (2012). [DOI] [PMC free article] [PubMed] [Google Scholar]
- 50.Ersching J et al. Germinal Center Selection and Affinity Maturation Require Dynamic Regulation of mTORC1 Kinase. Immunity 46, 1045–1058.e6 (2017). [DOI] [PMC free article] [PubMed] [Google Scholar]
- 51.Calado DP et al. The cell-cycle regulator c-Myc is essential for the formation and maintenance of germinal centers. Nat Immunol 13, 1092–1100 (2012). [DOI] [PMC free article] [PubMed] [Google Scholar]
- 52.Shlomchik MJ, Luo W & Weisel F Linking signaling and selection in the germinal center. Immunol Rev 288, 49–63 (2019). [DOI] [PMC free article] [PubMed] [Google Scholar]
- 53.Pike LS, Smift AL, Croteau NJ, Ferrick DA & Wu M Inhibition of fatty acid oxidation by etomoxir impairs NADPH production and increases reactive oxygen species resulting in ATP depletion and cell death in human glioblastoma cells. Biochim Biophys Acta 1807, 726–734 (2011). [DOI] [PubMed] [Google Scholar]
- 54.Scharping NE et al. The Tumor Microenvironment Represses T Cell Mitochondrial Biogenesis to Drive Intratumoral T Cell Metabolic Insufficiency and Dysfunction. Immunity 45, 374–388 (2016). [DOI] [PMC free article] [PubMed] [Google Scholar]
- 55.Alves TC et al. Integrated, Step-Wise, Mass-Isotopomeric Flux Analysis of the TCA Cycle. Cell Metab. 22, 936–947 (2015). [DOI] [PMC free article] [PubMed] [Google Scholar]
- 56.Chen R et al. In vivo RNA interference screens identify regulators of antiviral CD4(+) and CD8(+) T cell differentiation. Immunity 41, 325–338 (2014). [DOI] [PMC free article] [PubMed] [Google Scholar]
- 57.Dobin A et al. STAR: ultrafast universal RNA-seq aligner. Bioinformatics 29, 15–21 (2013). [DOI] [PMC free article] [PubMed] [Google Scholar]
- 58.Liao Y, Smyth GK & Shi W featureCounts: an efficient general purpose program for assigning sequence reads to genomic features. Bioinformatics 30, 923–930 (2014). [DOI] [PubMed] [Google Scholar]
- 59.Law CW, Chen Y, Shi W & Smyth GK voom: precision weights unlock linear model analysis tools for RNA-seq read counts. Genome Biol. 15, R29 (2014). [DOI] [PMC free article] [PubMed] [Google Scholar]
- 60.Ritchie ME et al. limma powers differential expression analyses for RNA-sequencing and microarray studies. Nucleic Acids Res 43, e47–e47 (2015). [DOI] [PMC free article] [PubMed] [Google Scholar]
- 61.Haynes NM et al. Role of CXCR5 and CCR7 in Follicular Th Cell Positioning and Appearance of a Programmed Cell Death Gene-1High Germinal Center-Associated Subpopulation. J. Immunol 179, 5099–5108 (2007). [DOI] [PubMed] [Google Scholar]
Associated Data
This section collects any data citations, data availability statements, or supplementary materials included in this article.


