

Abstract
Disruptions in circadian rhythms are risk factors for excessive alcohol drinking. The ethanol-sensitive adenosine equilibrative nucleoside transporter type 1 (ENT1, slc29a1) regulates ethanol-related behaviors, sleep, and entrainment of circadian rhythms. However, the mechanism underlying the increased ethanol consumption in ENT1 knockout (KO) mice in constant light (LL) and whether there are sex differences in ethanol consumption in ENT1 mice are less studied. Here, we investigated the effects of loss of ENT1, LL and sex on ethanol drinking using two-bottle choice. In addition, we monitored the locomotor activity rhythms. We found that LL increased ethanol drinking, reduced accumbal ENT1 expression and adenosine levels in male, but not female mice, compared to control mice. Interestingly, only LL-exposed male, not female, ENT1 KO mice exhibited higher ethanol drinking and a longer circadian period with a higher amplitude compared to wildtype (WT) mice. Furthermore, viral-mediated rescue of ENT1 expression in the NAc of ENT1 KO mice reduced ethanol drinking, demonstrating a possible causal link between ENT1 expression and ethanol drinking in males. Together, our findings indicate that deficiency of ENT1 expression contributes to excessive ethanol drinking in a sex-dependent manner.
Keywords: Adenosine, constant light, ethanol drinking, ENT1, sex, nucleus accumbens
Introduction
Increasing evidence suggests that circadian rhythm disruptions including irregular work schedules or light at night contribute to alcohol use disorder (AUD) in humans1,2 and animal models3,4. At the cellular level, the oscillating transcription-translation feedback loops of circadian genes regulate circadian rhythms5,6. Genetic studies in humans and animals have implicated circadian genes in alcohol use7–9. Furthermore, preclinical studies have shown that circadian genes regulate midbrain dopaminergic activity and subsequently, drug intake and reward10.
Adenosine, an inhibitory neurotransmitter and neuromodulator, is implicated in several aspects of circadian rhythms and AUD11–13. In humans, a genetic variant of the adenosine transporter 1 (ENT1, SLC29A1) is associated with AUD and circadian sleep disruption14. Chronic ethanol exposure downregulates ENT1 expression in cultured neuronal cells15. Our previous work suggests that a downregulation of ENT1 decreases extracellular adenosine levels as mice lacking ENT1 exhibit reduced extracellular adenosine levels in the striatum as measured from tissue lysate16 as well as from in vivo microdialysis17. Mice lacking ENT1 also display increased tolerance to ethanol intoxication and a high preference for ethanol18. Congruent with our previous findings, several recent animal studies illustrate that ENT1 expression is inversely correlated with ethanol drinking19–21.
Adenosine regulates both sleep homeostasis and circadian rhythms22,23. Adenosine levels progressively increase during wakefulness and peak prior to sleep24,25. Mice lacking ENT1 show decreased non-rapid eye movement sleep during the light period26, which may be associated with increased ethanol consumption. Studies also suggest that ENT1 regulates circadian rhythms entrainment27–29. Moreover, we previously found that ENT1 knockout (KO) mice exhibit down-regulated striatal Per1 and Per2 expression, as well as differences in home cage activity rhythms while housed under a 12 h light /12 h dark schedule (LD)4. Interestingly, constant light (LL) further escalated ethanol consumption in ENT1 KO mice suggesting that impaired adenosine signaling may increase vulnerability to circadian disruption-mediated increases in ethanol consumption4. However, the mechanisms underlying the effects of LL on ethanol consumption in ENT1 KO mice are unclear. We hypothesize that LL disrupts adenosine signaling which may explain the effects of LL on ethanol consumption. In addition, we expect that ENT1 KO mice are more susceptible to LL-induced circadian disruption, which may also contribute to their increased ethanol consumption.
Recently, it has become apparent that sex hormones such as testosterone and estrogen play a major role in circadian activity patterns and alcohol consumption30–32. Interestingly, similar to male ENT1 KO mice, female ENT1 KO mice exhibit increased ethanol drinking compared to WT mice33. However, whether there are sex differences in ethanol-related behaviors in response to LL in ENT1 KO mice has not been addressed yet. Thus, in this study, we included both male and female WT and ENT1 KO mice and hypothesize that we will observe sex differences in the effects of LL on circadian rhythms and ethanol consumption.
Materials and methods
Mice
Both male and female C57BL/6J mice (Jackson Laboratories, Bar Harbor, ME) aged 7–9 weeks old were used in this study. ENT1 KO mice18were generated from our lab by crossing F2 hybrid ENT1 KO and WT littermates when they reached 8 weeks old, with a C57BL/6J;129X1/SvJ background18. Mice were group-housed (4–5 animals per cage) in standard Plexiglas cages in a temperature (22–24°C) and humidity (50%) regulated environment with access to standard lab food and water ad libitum. Mice were housed on a 12-hour/12-hour light (500 lux)/dark (<0.5 lux) cycle (LD) except for during the LL experiment, as described below. Investigators who performed the behavioral experiments and data analysis were blinded from the mouse genotypes and treatments. All animal care, handling procedures and experimental protocols were approved by the Mayo Clinic Institutional Animal Care and Use Committee (IACUC) in accordance with the guidelines set forth by the National Institutes of Health.
Two-bottle choice drinking experiment
Ethanol self-administration was examined by a two-bottle choice drinking paradigm34,35 during which mice had access to a bottle of tap water and a bottle of ethanol diluted with tap water. The ethanol concentration was raised every fourth day from 3% to 6% and finally to 10% (v/v). Fluid intake and body weight were measured every 48 h to calculate average ethanol consumption (g/kg/day) and preference (%).
Quantitative real-time PCR (qRT-PCR)
Mice were euthanized by CO2 asphyxiation and rapidly decapitated. The nucleus accumbens (NAc), medium prefrontal cortex (mPFC), and hippocampus were immediately isolated under a surgical microscope. Total RNA was isolated using the RNeasy Plus Mini kit (Qiagen; Cat No. 74134) and then reverse transcribed by the Life Technologies Superscript III First-Strand Synthesis SuperMix kit (Cat No. 18080400) to obtain cDNA. The thermal cycling protocol for reverse transcription was 30 min at 50 °C followed by 15 min at 95 °C. Quantitative RT-PCR was performed on CFX 96 Touch™ Real-Time System, C1000 Touch Thermal Cycler (Bio-Rad) using QuantiTect SYBR Green RT-PCR Kit (Qiagen; Cat No. 204143) and gene-specific primers (ENT1, A1R, A2AR, Per1, Per2, GAPDH; Qiagen). The thermal cycling protocol for qRT-PCR was 45 amplification quantification cycles of 15 s at 94 °C, followed by 10 s at 55 °C, and then 30 s at 72 °C. The targeted gene mRNA expression was normalized to GAPDH. Percentage changes were calculated by subtracting GAPDH Ct values from Ct values for the gene of interest using the 2−ΔΔCt method36.
Circadian activity
The circadian locomotor rhythms were monitored by infrared sensors interfaced with Clocklab (Actimetrics, Wilmette, IL) while the mice were individually caged. The circadian period (tau) under LL was determined by chi-square periodogram analysis in Clocklab. During LL, tau was typically greater than 24 h. After approximately two weeks of LL exposure, the circadian activity became arrhythmic37,38. The percentages of mice that were arrhythmic or had a tau greater than 24 h were calculated in each group. We used the amplitude (in AU) as the circadian power that of the circadian rhythm, which is the peak amplitude of the chi-square periodogram from the maximum amplitude value of the power spectrum. AU indicates arbitrary unit37,38.
Stereotaxic viral injection
Mice were anesthetized with a mixture of ketamine (100 mg/kg) and xylazine (10 mg/kg) and positioned in a stereotaxic instrument (KOPF Instruments). Either the ENT1 virus (AAV9-D2R-ENT1/eGFP; 1.4 × 10¹³ GC/ml, 1.0 μl, Vector Biolabs) or control virus (AAV9-D2R-eGFP; 1.4 × 10¹³ GC/ml, 1.0 μl, Vector Biolabs) was delivered by 35-gauge syringe needles (World Precision Instruments) to the NAc bilaterally (AP: +1.3 mm, ML: ± 1.0 mm, DV: −4.25 mm) at a rate of 0.1 μl/min for 10 min. At the end of injection, needles remained in place for 5 min to ensure complete delivery of the viral bolus and were then slowly retracted to minimize trauma and viral spreading. The scalp was sutured with 5–0 polyviolene sutures (Sharpoint). Behavioral tesing began 3 weeks after surgery to allow for sufficient viral expression.
Immunohistochemistry
Mice were euthanized by CO2 asphyxiation followed by rapid brain removal. Brains were fixed in 4% paraformaldehyde (Sigma Aldrich) for 24 h and then immersed in 30% (w/v) sucrose in 0.1M PBS at 4 °C for 48 h until the tissue sunk. Coronal free-floating sections (40 μm) were cut by a cryostat and incubated in 0.5% Triton-PBS for 15 min and then in 5% (w/v) bovine serum albumin (BSA)-PBS for 1 h at room temperature. Sections were then incubated with rabbit anti-c-Fos primary antibody (1:100, Cat No.: sc-52, Santa Cruz Biotechnology), rabbit anti-D2R (1:100, Cat No.: sc-9113, Santa Cruz Biotechnology), or mouse anti-NeuN (1:1000, Cat No.: Ab10424, Abcam) at 4 °C overnight. After washing with PBS, slices were incubated with secondary antibody (1:500, Alexa 594-conjugated goat anti-rabbit or Alexa 405-conjugated goat anti-mouse; Abcam) for 3 h at room temperature. Images from the brain region of interest (NAc) were obtained on a LSM 510 confocal laser scanning microscope (Carl Zeiss) with a 20X objective. Quantification of c-Fos positive cells in the NAc per mm2 was carried out using 3–5 coronal sections per mouse, using a minimum of 3 mice per group. The total number of c-Fos positive cells present in the NAc from all sections of each mouse was averaged.
Microdialysis
Animals were anesthetized with a mixture of ketamine (100 mg/kg) and xylazine (10 mg/kg) and placed in a stereotaxic instrument (KOPF Instruments). A guide cannula was implanted into the NAc (AP: 1.3 mm; ML: 0.5 mm; DV: −3.5 mm), and mice were allowed to recover for 7 days recovery as previously described (Chen et al., 2010; Nam et al., 2011). At the time of collection, a microdialysis probe with a 2.0 mm cellulose membrane (Eicom, MW cut off: 50,000 Da) that connected to a microsyringe pump (Eicom) was inserted and secured to the guide cannula. Ringer’s solution (145 mM NaCl, 2.7 mM KCl, 1.2 mM CaCl2, 1.0 mM MgCl2, pH 7.4) was delivered to the probe from the pump at a 0.5 μl/min flow rate. Samples were collected for a continuous 2 h twice daily during the daytime (9–11 AM) and nighttime (7–9 PM), respectively. Microdialysates were immediately frozen after each collection and stored at −80 °C until analyzed. Adenosine level was measured by liquid chromatograph mass spectrometry using a similar method as previously described39. Microdialysate samples were spiked with internal standards, deproteinized with cold methanol and followed by centrifugation at 10,000 g for 5 minutes. The supernatant was immediately derivatized with 6-aminoquinolyl-N-hydroxysuccinimidyl carbamate according to Waters’ MassTrak kit. An 11-point calibration curve (0, 0.025, 0.050, 0.250, 1.0, 3.0, 5.0, 15.0, 30.0, 40.0, 80.0 μM) made up of purchased adenosine standards underwent a similar derivatization procedure after the addition of the same internal standards. The derivatized standards and samples were analyzed on a triple quadrupole mass spectrometer (Thermo TSQ Quantum Ultra) coupled with an Ultra Pressure Liquid Chromatography system (Waters Acquity UPLC). Data acquisition was done using a select ion monitor (SRM). Concentrations of each unknown were calculated against their perspective calibration curves.
ENT1 binding assay
To assess the functional ENT1 level, we use nitrobenzylthioinosine (NBTI) to do ENT1 binding assay. For [3H] NBTI binding, mice were deeply anesthetized in CO2 and then the brain tissues were rapidly removed on ice. The samples were homogenized in 10% sucrose solution and centrifuged at 1,000 g for 4 min. The supernatant was carefully collected and centrifuged again at 10,000 g for another 10 min, and then the pellet was resuspended in the 50 mM Tris-HCl buffer with protease inhibitor. [3H] NBTI saturation binding assays were performed at 37 °C in 10 mM Tris-HCl with non-specific binding determined in the presence of 10 μM Dilazep. Binding reactions were terminated by filtration with ice-cold Tris-HCl buffer through Whatman GF/B paper using a cell harvester (Inotech). Filters were dried and incubated in scintillant, and then the membrane-bound radioligand was measured using scintillation spectrometry. Specific binding was determined by substituting nonspecific binding from total binding values18,40.
Statistical analysis
All data are expressed as mean ± SEM (standard error of the mean). Fisher’s exact test was used to compare categorical distributions between groups. Two-tailed Student’s t-test was used to compare the difference between two groups. One-way ANOVA was used to compare the differences for one factor (treatment or genotype), followed by Tukey post hoc test for pairwise comparisons. Two-way repeated measures ANOVA was used to detect the effects of treatment and genotypes on ethanol consumption and ethanol preference. ANOVA were followed by Tukey post hoc tests where interactions were found. Statistical significance was set at P < 0.05. All statistical calculations were performed using Graphpad Prism 7 (La Jolla CA, USA).
Results
Constant light increased ethanol drinking and reduced the ENT1 mRNA expression in the nucleus accumbens of male, but not female mice
To investigate the effects of disruption of circadian rhythms in the modulation of ethanol drinking and neuronal activities, as shown in Fig. 1A, C57BL/6J mice were exposed to constant light (LL) or LD for two weeks, which is a simple and straightforward method to disrupt circadian rhythms41,42. After two weeks of LL or LD, mice consumed ethanol in a two-bottle choice drinking paradigm under LL or LD (days 14–26, Fig.1A). Male mice exposed to LL exhibited increased ethanol consumption (Fig. 1B) and ethanol preference (Fig. 1C) compared to the control group in a normal LD cycle. Two-way ANOVA indicated a main effect of ethanol concentration and lighting condition on ethanol intake (consumption: lighting condition: F(1,19) = 6.136, P = 0.023, Fig. 1B; preference: lighting condition: F(1,19) = 5.018, P = 0.037, Fig. 1C). Interestingly, in female mice, we found no effect of constant light on ethanol consumption (two-way ANOVA, group effect: F(1,18) = 3.088, P = 0.096; Fig. 1D) or preference (two-way ANOVA, group effect: F(1,18) = 0.273, P = 0.607; Fig. 1E).
Figure 1.
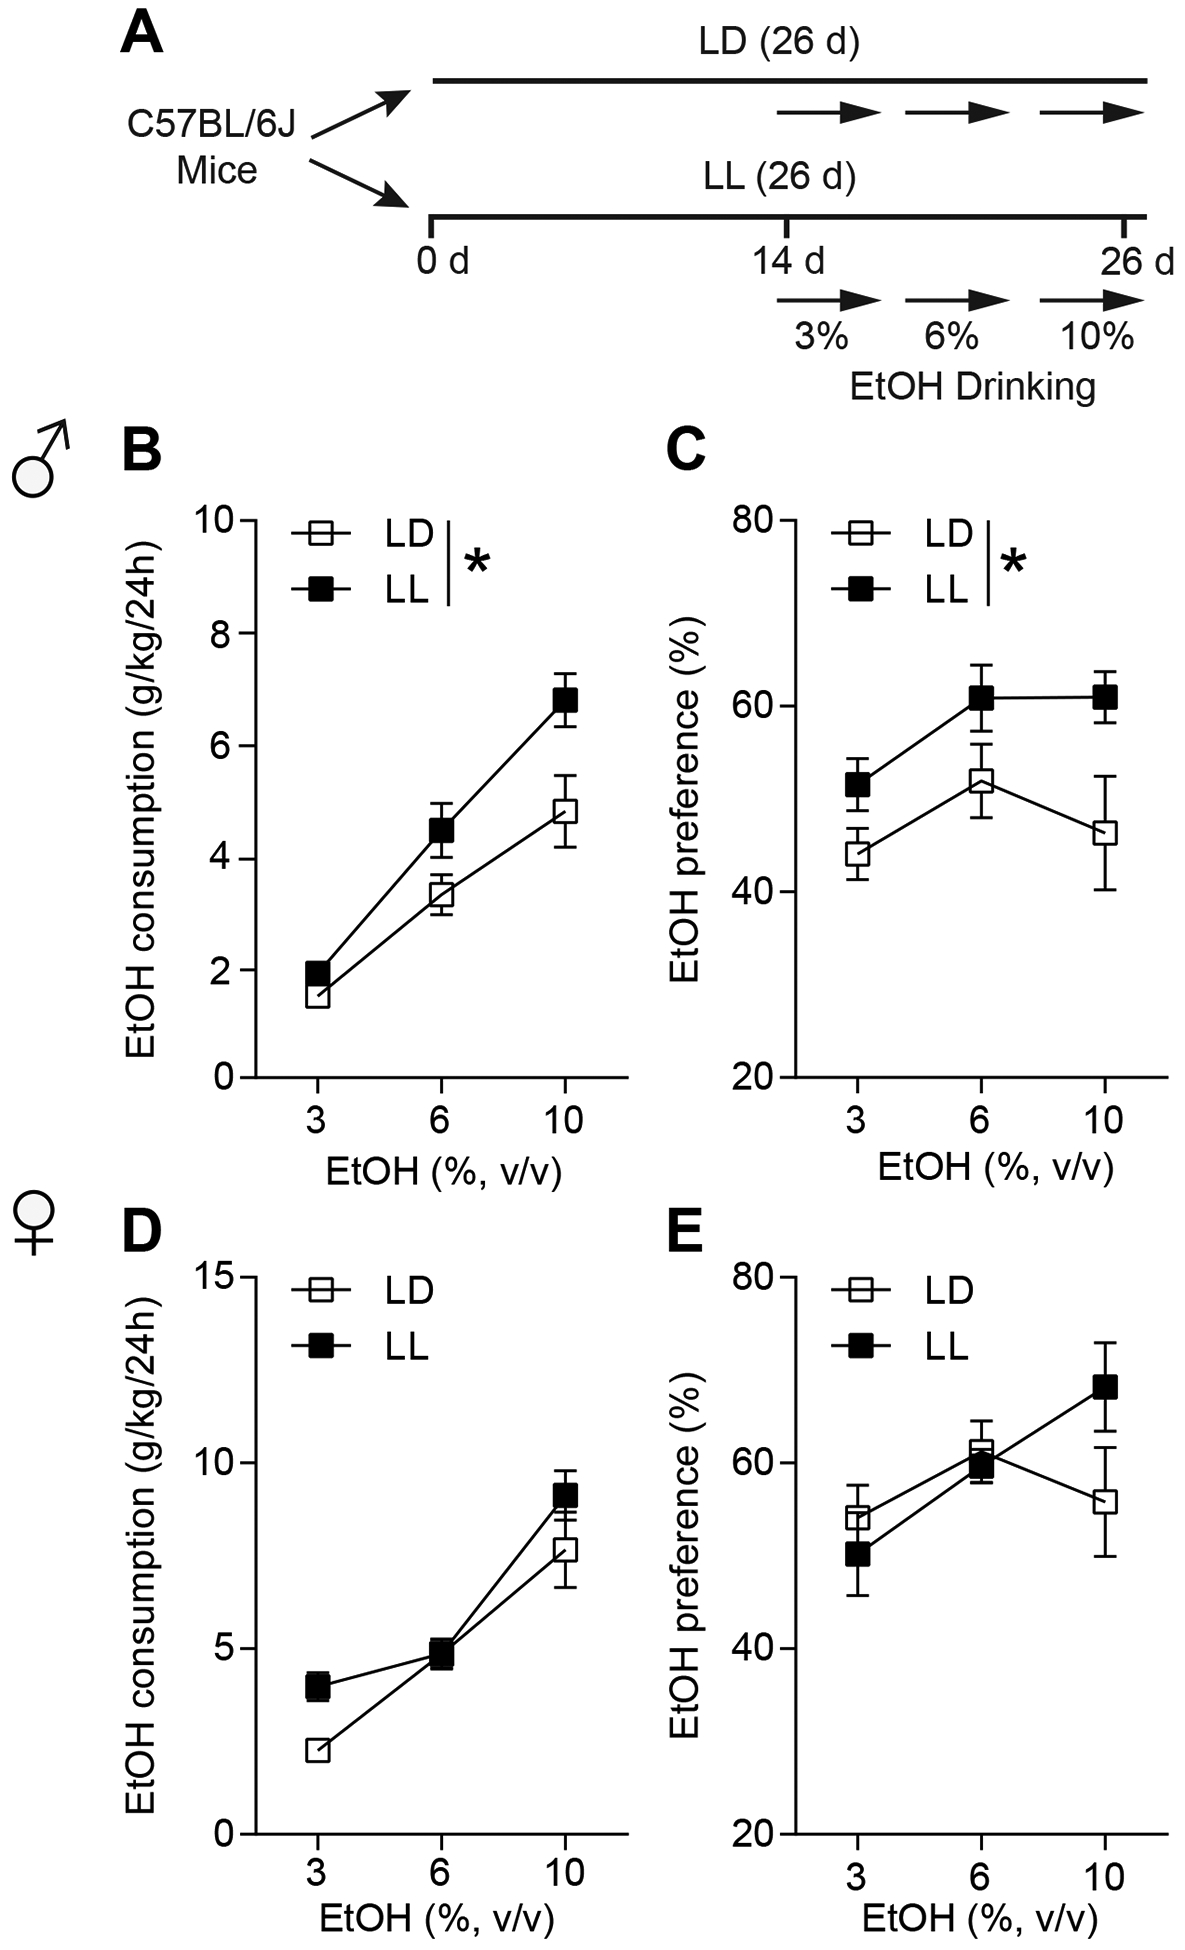
Constant light (LL) increased ethanol drinking in the male, not female mice. (A) The experimental schedule for panels b to e. (B) Ethanol consumption per 24 h of 3%, 6%, and 10% EtOH during either light-dark cycle (LD) or LL in the male mice (n = 9–12 per group; *P < 0.05). (C) Ethanol preference per 24 h of 3%, 6%, and 10% EtOH during either light-dark cycle (LD) or LL in the male mice (n = 9–12 per group; *P < 0.05). (D) Ethanol consumption per 24 h of 3%, 6%, and 10% EtOH during either light-dark cycle (LD) or LL in the female mice (n = 10 per group). (E) Ethanol preference per 24 h of 3%, 6%, and 10% EtOH during either light-dark cycle (LD) or LL in the female mice (n = 10 per group).
Using a separate cohort of mice, we found that two weeks of LL exposure (Fig. 2A) significantly reduced ENT1 mRNA expression in the NAc of male mice (two-tailed unpaired t-test, t(14) = 2.711, P = 0.017; Fig. 2B), but not in the mPFC (two-tailed unpaired t-test, t(10) = 0.008, P = 0.994; Fig. S1A and B) or hippocampus (two-tailed unpaired t-test, t(10) = 1.769, P = 0.107; Fig. S1A and D) compared to that of LD group, suggesting that reduced accumbal ENT1 is involved in LL-mediated increases in ethanol drinking. In the female mice, LL didn’t have an effect on ENT1 mRNA expression in the NAc compared to the LD group (two-tailed unpaired t-test, t(16) = 1.202, P = 0.246; Fig. 2C), but reduced ENT1 mRNA expression in the mPFC (two-tailed unpaired t-test, t(9) = 3.848, P = 0.004; Fig. S1A and C) and had no effect in the hippocampus (two-tailed unpaired t-test, t(10) = 0.885, P = 0.397; Fig. S1A and E).
Figure 2.
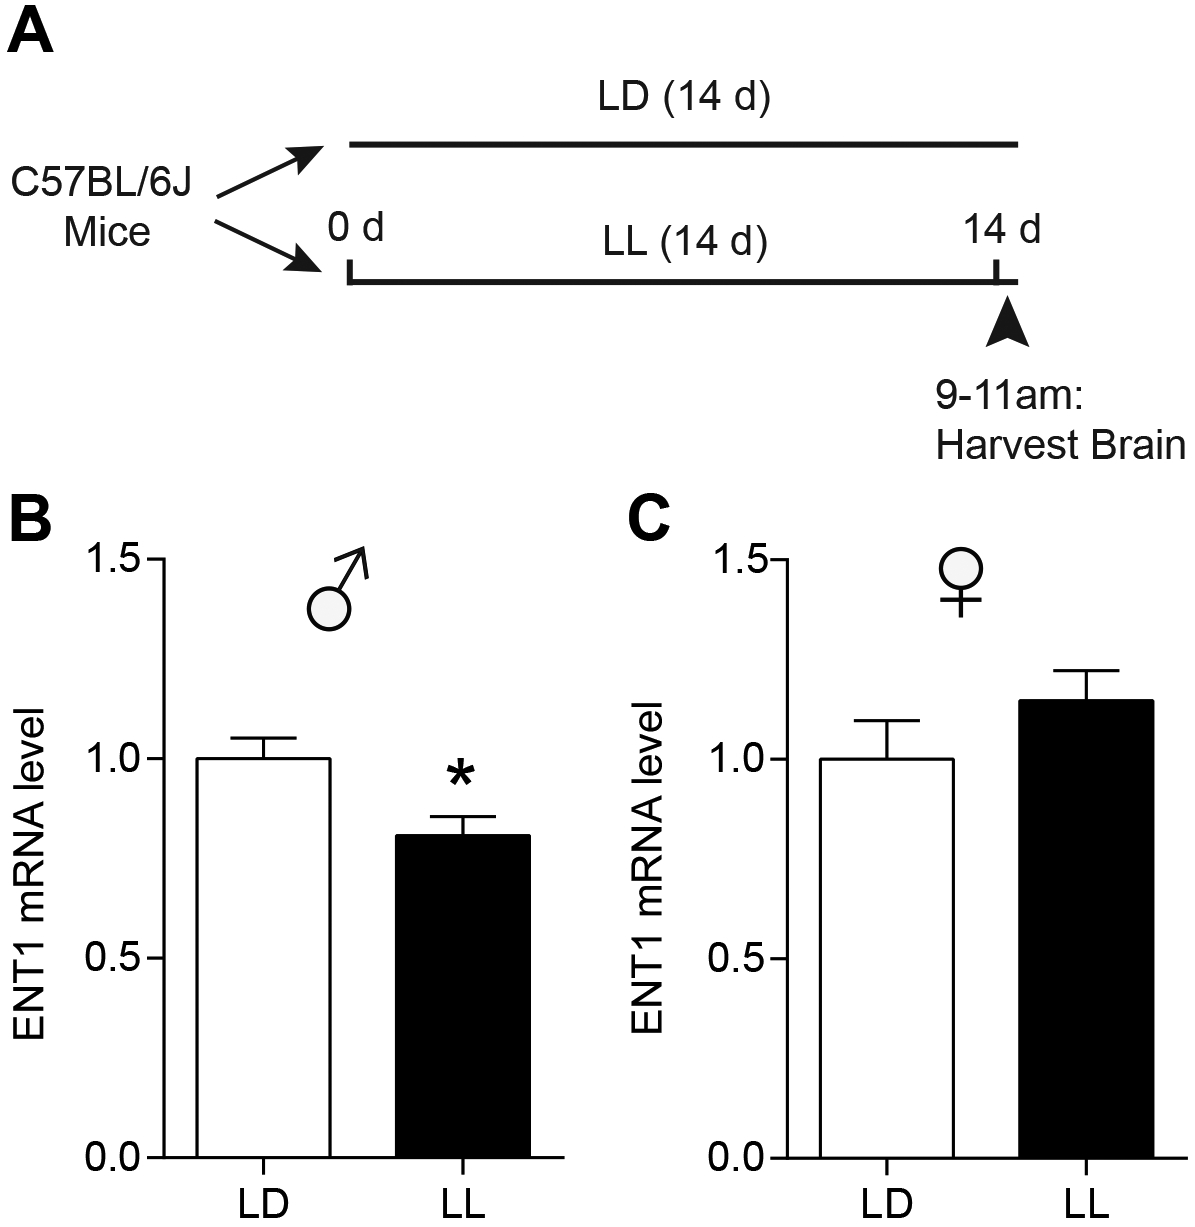
Constant light (LL) reduced ENT1 mRNA expression in the nucleus accumbens (NAc) of male, not female mice. (A) The experimental schedule for panels b and c. (B) After exposure of either two weeks of LD or LL, relative mRNA level of ENT1 in the NAc of male mice were examined and shown in the graph (n = 8 per group; *P < 0.05). (C) After exposure of either two weeks of LD or LL, relative mRNA level of ENT1 in the NAc of female mice were shown in the graph (n = 9 per group). Data represent mean ± SEM.
Constant light decreased adenosine levels and adenosine receptors in the nucleus accumbens of male, but not female mice
We investigated the effect of LL on adenosine levels in the NAc during the daytime (9 AM → 11 AM) and nighttime (7 PM → 9 PM) by in vivo microdialysis (Fig. 3A). During the daytime, adenosine levels were significantly lower in LL than in LD groups in the NAc of male mice. However, during nighttime, adenosine levels were not changed between the LL and LD groups in male mice (two-tailed unpaired t-test; Daytime: t(20) = 2.577, P = 0.018; Nighttime: t(15) = 1.222, P = 0.241; Fig. 3B). Interestingly, in female mice, adenosine levels were similar between the LL and LD groups during both the daytime and nighttime (two-tailed unpaired t-test; Daytime: t(16) = 0.518, P = 0.611; Nighttime: t(13) = 1.146, P = 0.273; Fig. 3C).
Figure 3.
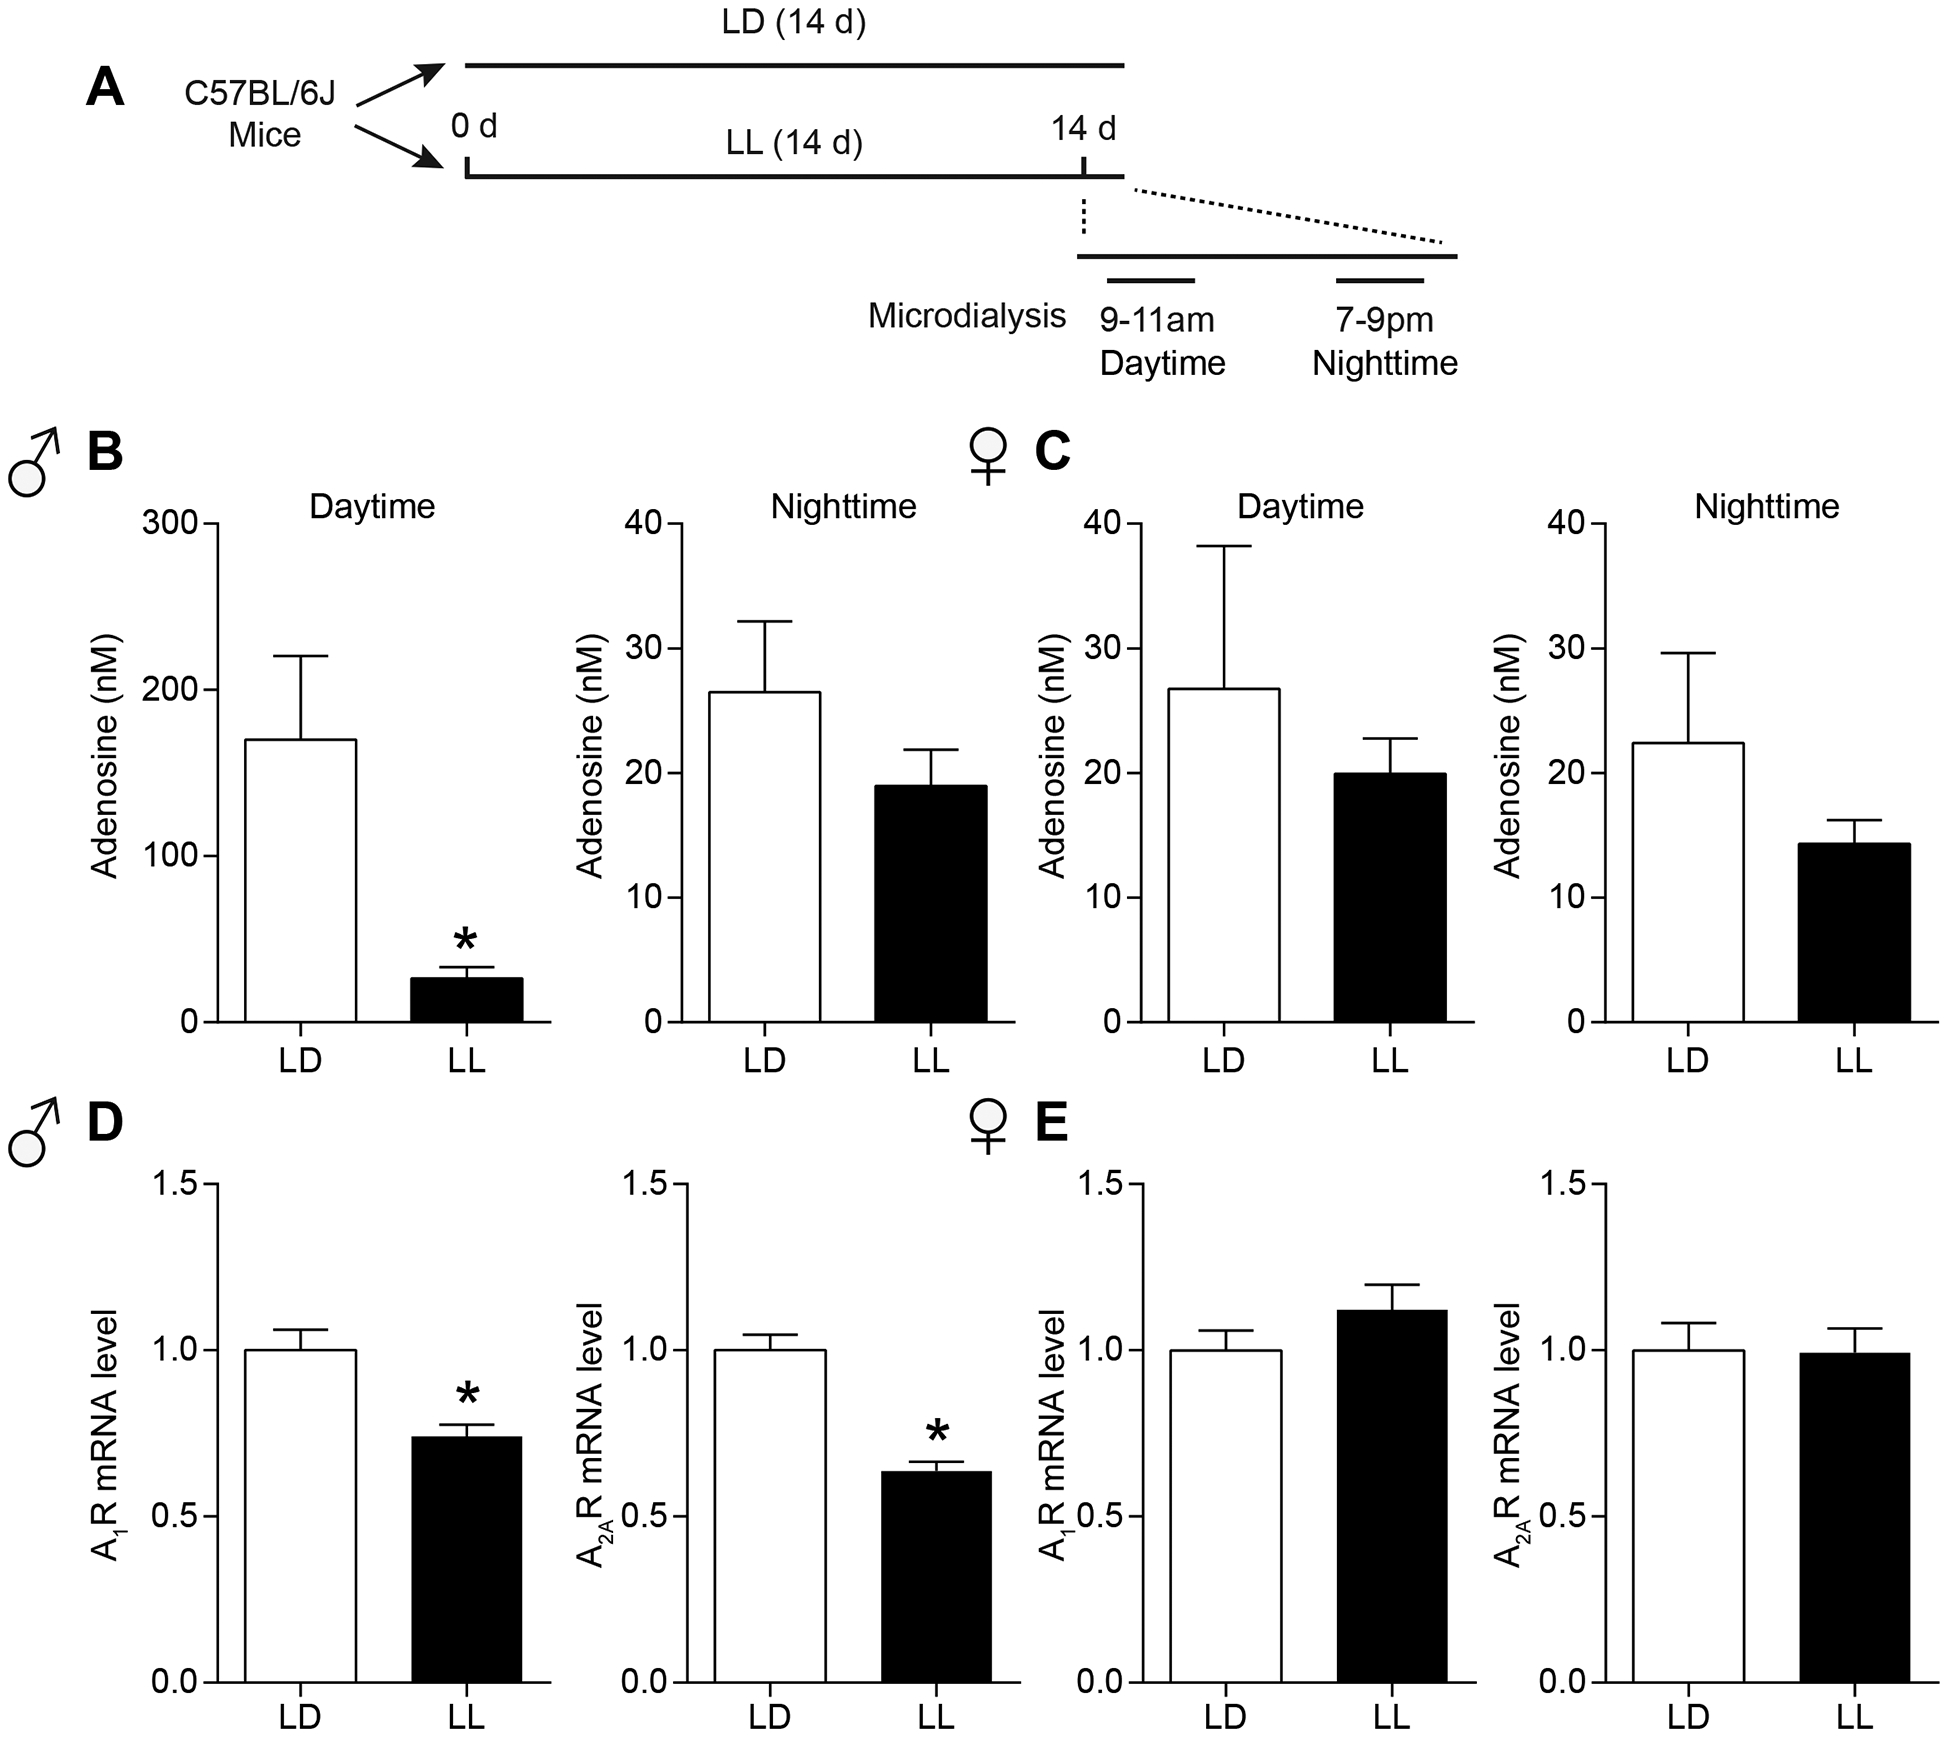
The effects of constant light on adenosine levels during daytime and nighttime and adenosine receptors in the NAc. (A) The experimental schedule of microdialysis for panels b and c. (B) Measurement of adenosine levels in the NAc dialysates of male mice during either LD or LL at daytime (n = 10–12 per group; *P < 0.05) or nighttime (n = 8–9 per group). (C) Measurement of adenosine levels in the NAc dialysates of female mice during either LD or LL at daytime (n = 8–10 per group) or nighttime (n = 7–8 per group). (D) After exposure of either two weeks of LD or LL, relative mRNA level of A1R and A2AR in male mice were detected and shown in the graph (n = 9 per group; *P < 0.05). (E) After exposure of either two weeks of LD or LL, relative mRNA level of A1R and A2AR in female mice were detected and shown in the graph (n = 9 per group). Data represent mean ± SEM.
In addition, we examined the effects of LL on the expression of adenosine receptor genes in the NAc specifically in the daytime since the adenosine levels were decreased by LL only in the daytime. In male mice, adenosine A1 receptor (A1R) and adenosine A2A receptor (A2AR) mRNA levels were significantly reduced in two weeks of LL exposure (two-tailed unpaired t-test; A1R: t(16) = 3.623, P = 0.002; A2AR: t(16) = 6.741, P < 0.0001; Fig. 3D). In female mice, LL showed no effect on A1R or A2AR genes expression in the NAc (two-tailed unpaired t-test; A1R: t(16) = 1.266, P = 0.224; A2AR: t(16) = 0.068, P = 0.946; Fig. 3E). These results suggest that LL-induced decreases in adenosine levels in the NAc during daytime, which may be accompanied by reduction of A1R and A2ARs expression levels only in male mice.
Constant light increased ethanol drinking and period of activity rhythms in male, but not in female ENT1 KO mice
In LD, ENT1 KO consumed more ethanol compared to WT mice17,18. Here, we examined whether LL alters ethanol drinking in ENT1 KO mice in a sex-dependent manner (Fig. 4A). Male ENT1 KO mice showed higher ethanol consumption (Fig. 4B) and preference (Fig. 4C) than WT mice. Two-way ANOVA indicated a main effect of genotype (Consumption: F(1,19) = 16.24, P = 0.001, Fig. 4B; Preference: F(1,19) = 8.582, P = 0.009, Fig. 4C), suggesting that ablation of ENT1 further exacerbates ethanol drinking under LL condition. We then examined the effects in female ENT1 KO mice. No significant difference was found between WT and ENT1 KO female mice in their ethanol consumption (two-way ANOVA, group effect: F(1,18) = 2.045, P = 0.169, Fig. 4D) or preference (two-way ANOVA, group effect: F(1,24) = 0.657, P = 0.428; Fig. 4E).
Figure 4.
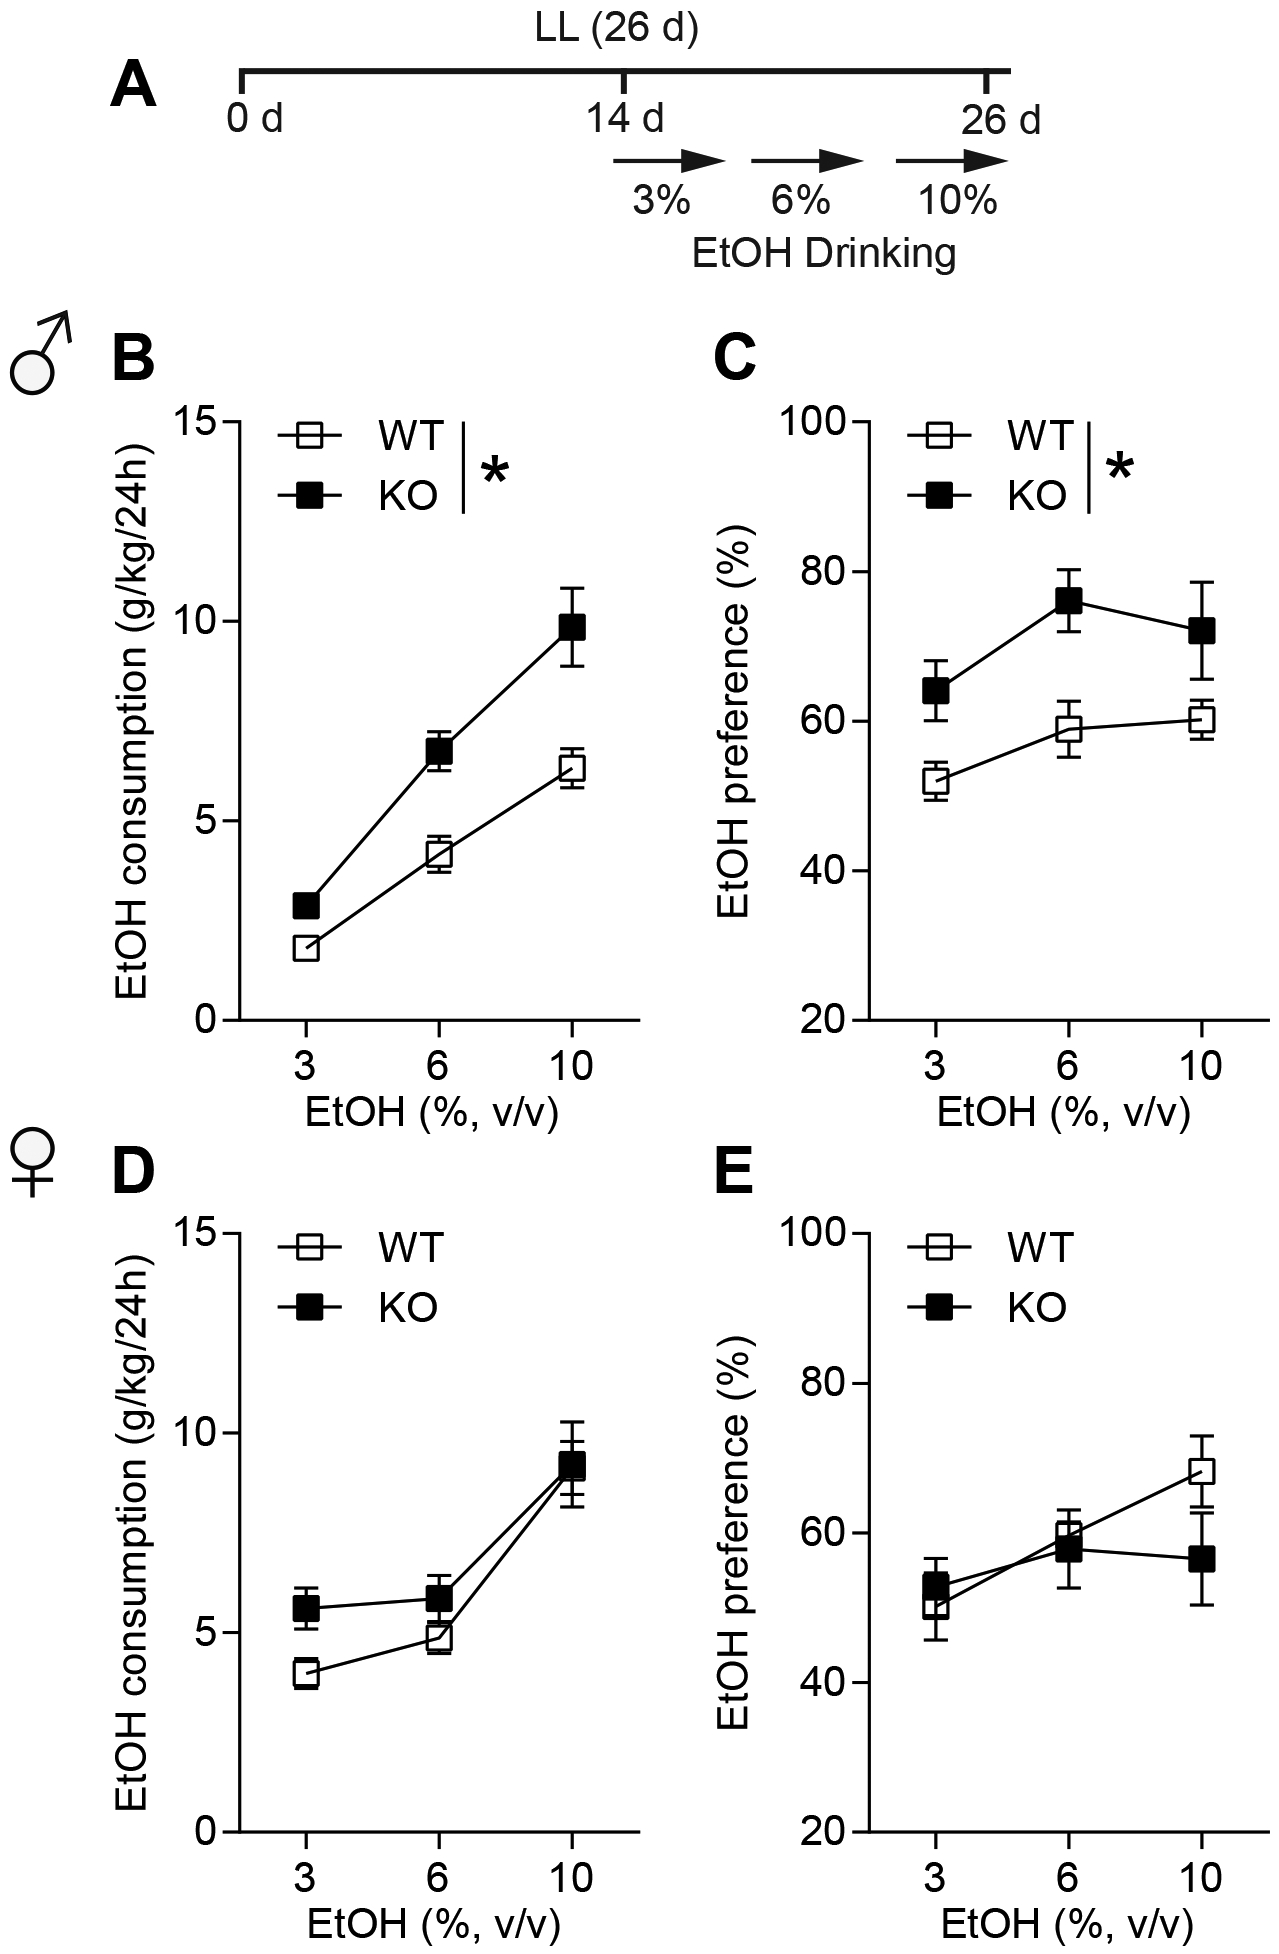
Male ENT1 KO mice showed increased ethanol drinking not in female. (A) The experimental schedule for panels b to e. (B) Ethanol consumption per 24 h of 3%, 6%, and 10% EtOH in male WT and ENT1 KO mice during LL (n = 10–11 per group; *P < 0.05). (C) Ethanol preference per 24 h of 3%, 6%, and 10% EtOH in male WT and ENT1 KO mice during LL (n = 10–11 per group; *P < 0.05). (D) Ethanol consumption per 24 h of 3%, 6%, and 10% EtOH in female WT and ENT1 KO mice during LL (n = 10 per group). (E) Ethanol preference per 24 h of 3%, 6%, and 10% EtOH in female WT and ENT1 KO mice during LL (n = 10 per group). Data represent mean ± SEM.
Next, as shown in Fig. 5A, we examined the LL-induced free running pattern in male and female mice since LL generates a typical free-running period longer than 24 hours and eventually causes the mice to become arrhythmic38,43. As expected, LL disrupted circadian rhythms by decreasing the amplitude and total activity in both genotypes of male and female mice (Supplementary Table S1; Fig. S2A–D). Interestingly, while male WT mice showed an arrhythmic periodogram after approximately two weeks of LL exposure, ENT1 KO mice exhibited a long period throughout the LL (Fig. 5B). Thus, a higher percentage of ENT1 KO mice had a long circadian period relative to WT mice (WT: 30% vs KO: 80% respectively, Fisher’s exact test, P < 0.0001; Fig. 5C). In addition, the ENT1 KO mice showed higher amplitude rhythms than WT in LL (two-tailed Mann-Whitney t-test, P = 0.045; Fig. 5D), suggesting that male ENT1 KO mice are less disrupted by LL compared to WT mice. In female mice, however, a similar percentage of ENT1 and WT mice number exhibited a long tau or arrhythmic activity (Fisher’s exact test, P = 0.200; Fig. 5E and F). Also, the amplitude was similar between female ENT1 KO and WT mice in LL (two-tailed Mann-Whitney t-test, P = 0.986; Fig. 5G).
Figure 5.
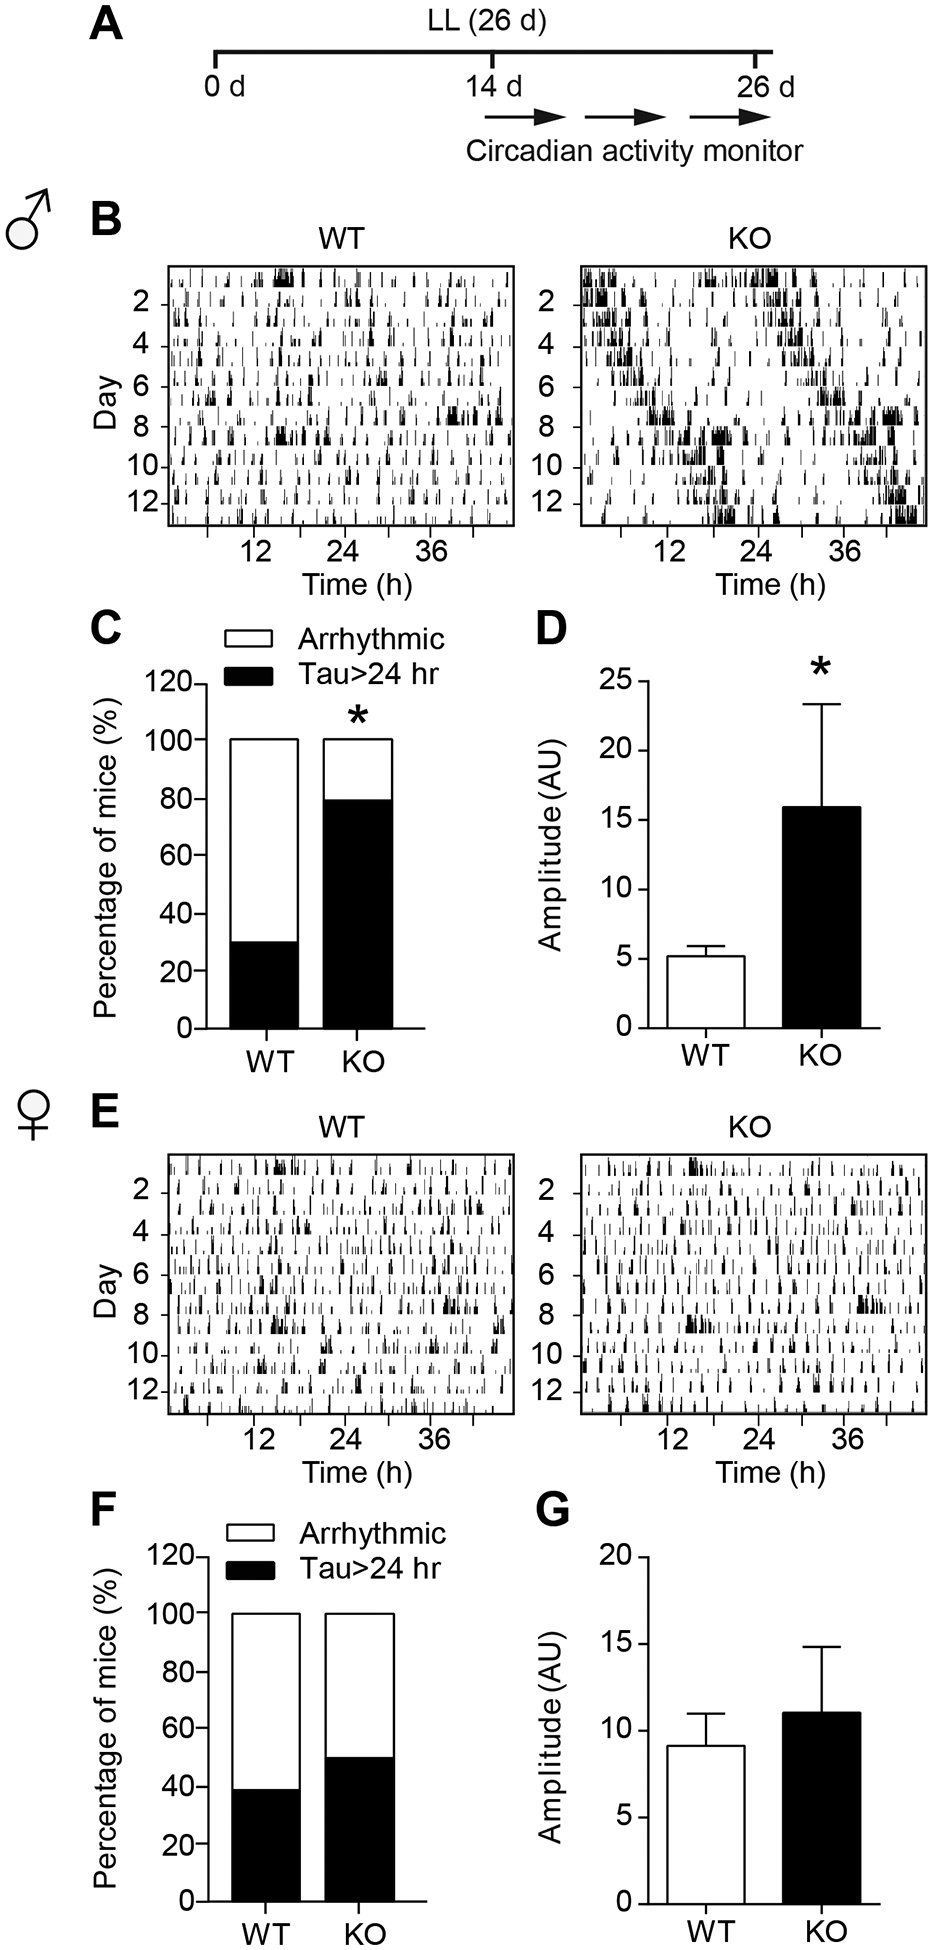
Male ENT1 KO mice showed longer period and amplitude of circadian activity during constant light not female. (A) The experimental schedule for panels b to g. (B) The representative image for circadian activity pattern of male WT and KO mice during LL. (C) The percentage of mice number in male WT or ENT1 KO group showing either clear peak or arrhythmic during LL (n = 10 per group; *P < 0.05). (D) The amplitude of male WT and KO mice during LL (n = 10 per group; *P < 0.05). (E) The representative image for circadian activity pattern of female WT and KO mice during LL. (F) The percentage of mice number in female WT or ENT1 KO group of showing either clear peak or arrhythmic during LL (n = 10 per group). (G) The amplitude of female WT and KO mice during LL (n = 10 per group). Amplitude was measured by arbitrary unit (AU). Data represent mean ± SEM.
Restoring accumbal ENT1 expression rescued LL-dependent ethanol drinking in ENT1 KO mice
To examine the causal relationship between ENT1 expression and LL-dependent ethanol drinking, we determined the effects of viral-mediated ENT1 expression in the NAc of ENT1 KO mice (Fig. 6A). Using the [3H] NBTI binding assays we showed that functional ENT1 levels were increased in the NAc compared to the control virus injected into WT mice (two-way ANOVA, group effect: F(1,10) = 9.529, P = 0.011; Fig. 6B). The co-localization of eGFP, D2R, and NeuN demonstrated the specificity of virus expression which was exclusively expressed in D2R-positive neurons in the NAc (Fig. 6C). Additionally, the administration of ENT1 virus (vENT1) into WT mice increased ENT1 mRNA levels, and resulted in similar ENT1 expression levels as WT mice when administration into the ENT1 KO mice (one-way ANOVA, F(2,13) = 9.792, P = 0.003; Tukey post hoc for KO+vENT1 vs WT, P = 0.209, WT+vENT1 vs WT, P = 0.038, KO+vENT1 vs WT+vENT1, P = 0.002; Fig. 6D). Importantly, restoring striatal ENT1 expression in ENT1 KO mice significantly suppressed the increased ethanol consumption compared to the ENT1 KO mice in LL. Two-way ANOVA indicated a main effect of group (F(2,36) = 11.65, P = 0.0001; followed by Tukey’s multiple comparisons test, for WT vs KO, P < 0.0001; for KO vs KO+vENT1, P = 0.031; for WT vs KO+vENT1, P = 0.091; Fig. 6E). The post-hoc analysis of the two-way ANOVA showed significance between WT and KO under 6% (WT vs KO, P = 0.008) and 10% (WT vs KO, P = 0.001) of ethanol concentration respectively, and a difference between KO and KO+vENT1 under the 10% EtOH concentration (KO vs KO+vENT1, P = 0.028). These results suggest that restoring ENT1 in the NAc reversed the effects of constant light on increased ethanol drinking in ENT1 KO mice. However, the administration of ENT1 virus into WT mice had no significant effect on the circadian activity and both groups showed arrhythmic homecage activity after approximately two weeks LL exposure (Fig. S3A). The amplitude and total daily activity of the vENT1 group didn’t differ from that of the control group (two-tailed Mann-Whitney t-test, amplitude: P = 0.618; activity: P = 0.618; Fig. S3B and C).
Figure 6.
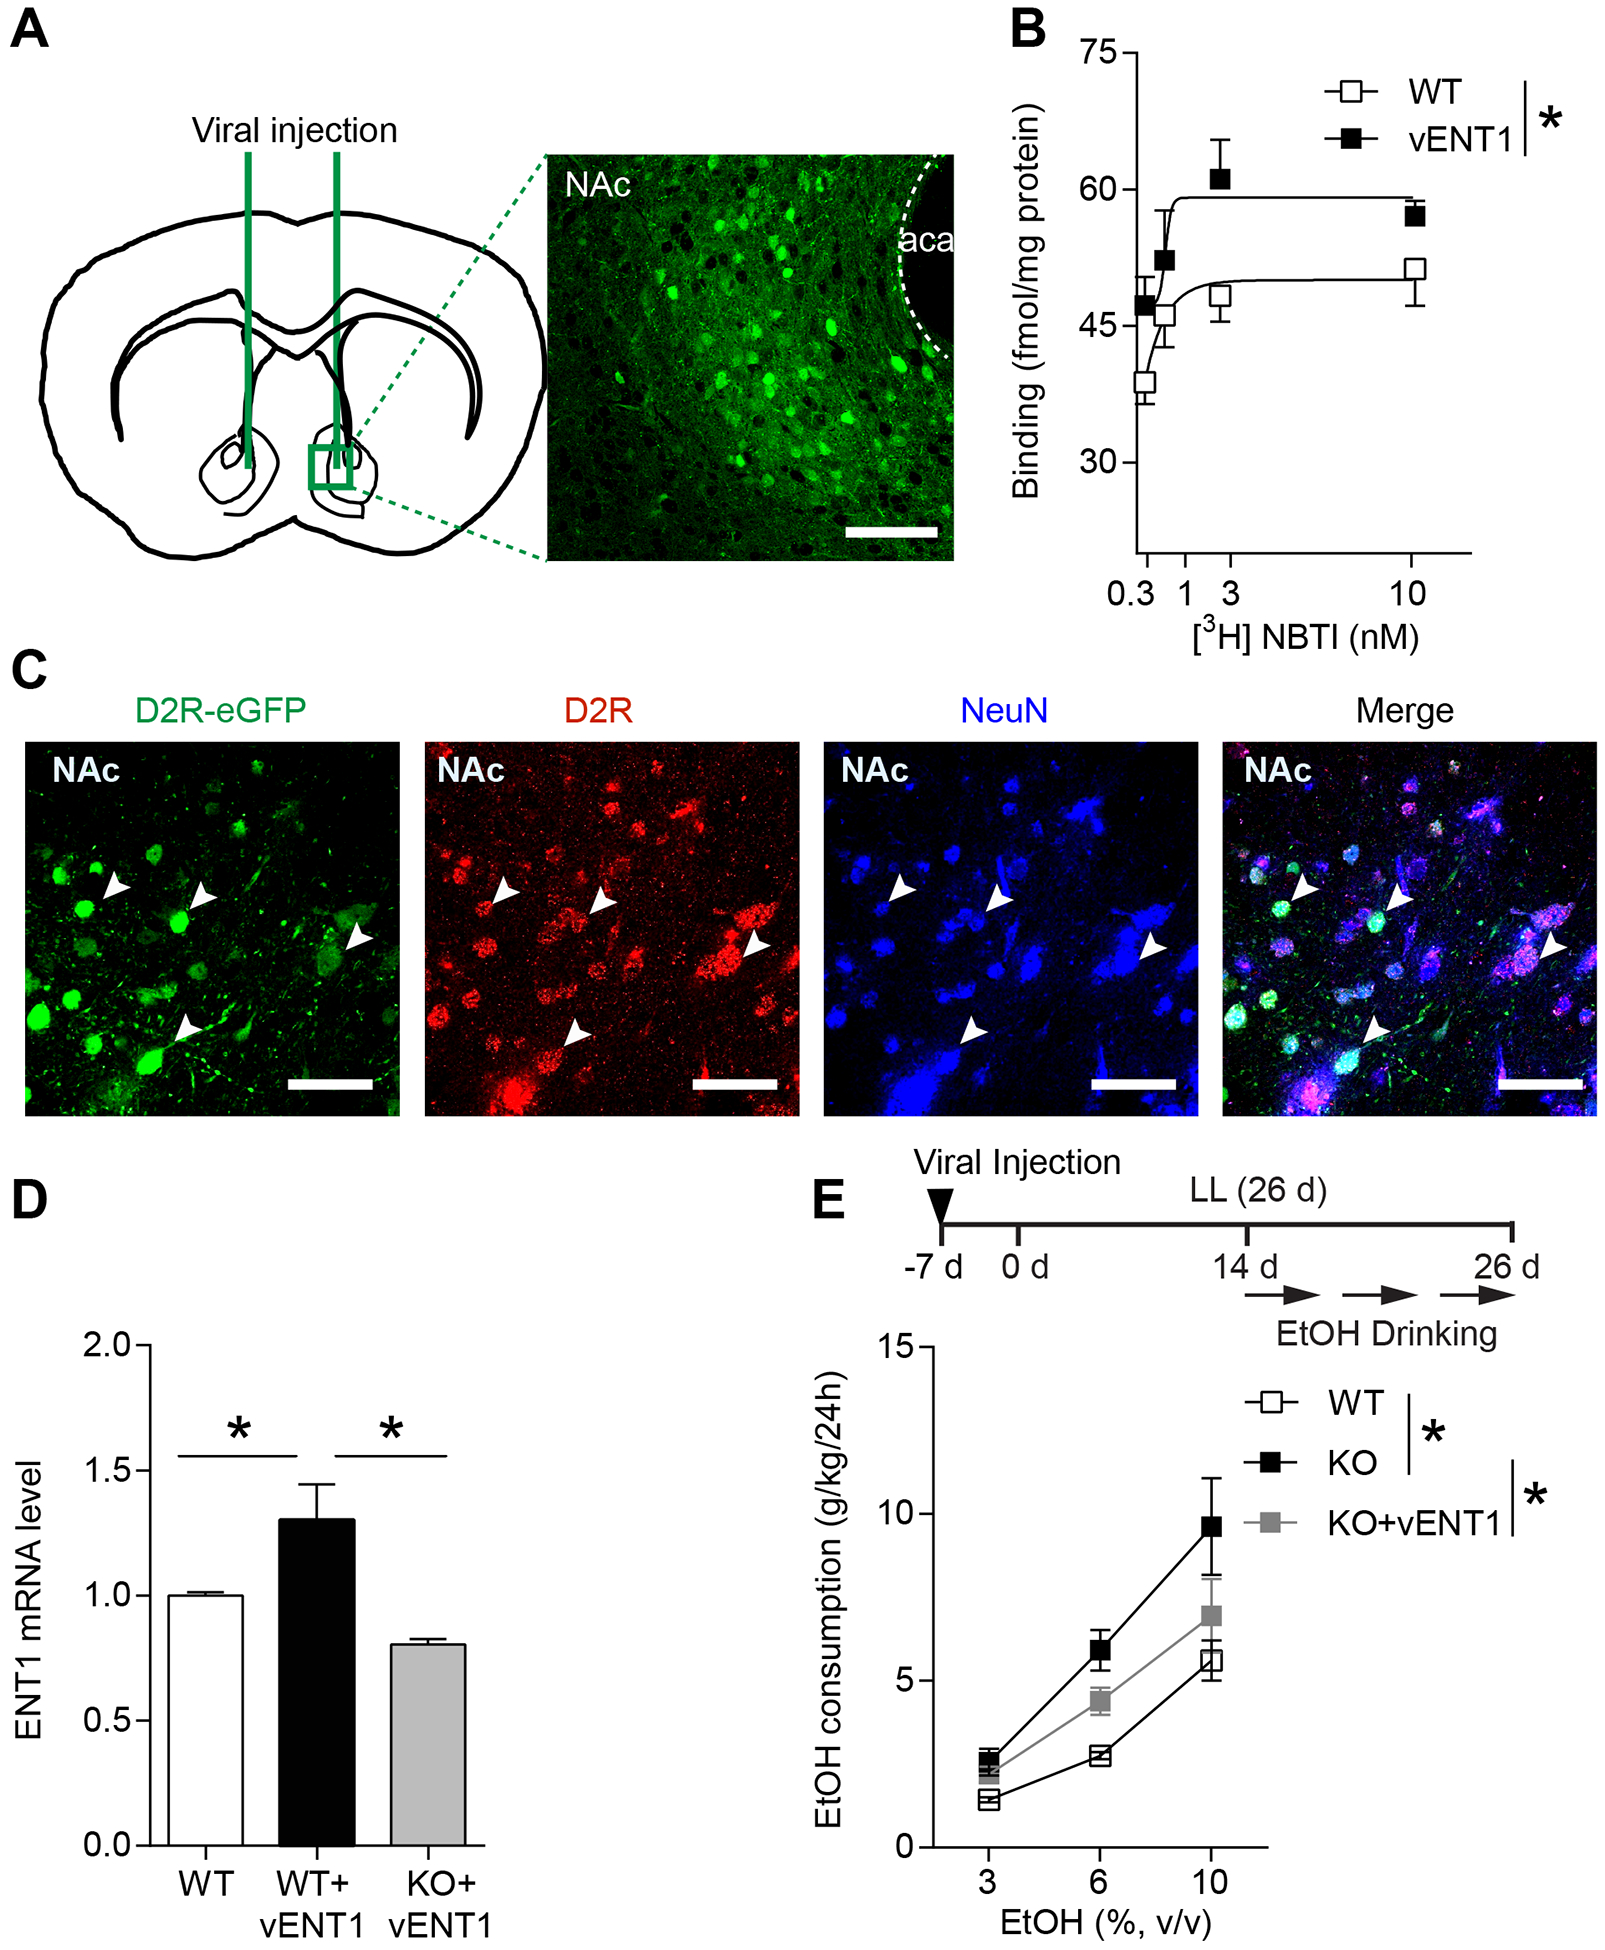
Restoring accumbens ENT1 suppressed the high ethanol drinking in ENT1 KO mice during constant light. (A) The location of viral injection into the NAc of ENT1 KO/WT mice. Representative fluorescence image was shown at x20 magnification. Scale bar=100 μm. (B) Binding of [3H] NBTI to the NAc membranes, showing increased binding sites in ENT1 virus injected WT mice (vENT1) compared to control (WT) group (n = 6 per group; *P < 0.05). (C) The confocal images showing co-localization of eGFP virus, D2R, and NeuN (white arrows) indicated that D2R-eGFP virus was specifically expressed in D2R-positive neurons. Scale bar=50 μm. (D) Relative mRNA level of ENT1 in the NAc of WT mice, ENT1 virus injected into WT mice (WT+vENT1), and ENT1 virus injected into ENT1 KO mice (KO+vENT1; n = 5–6 per group; *P < 0.05). (E) Ethanol consumption per 24 h of 3%, 6%, and 10% EtOH in WT, KO, and KO+vENT1 group during LL (n = 5 per group; *P < 0.05). Data represent mean ± SEM.
We used c-Fos labeling to study the effects of loss of ENT1 on neuronal activity in the NAc according to the schematic illustration (Fig. S4A). ENT1 KO mice that had increased ethanol drinking during LL, showed significantly decreased c-Fos levels in the NAc compared to WT mice. Whereas, administrating ENT1 virus into the NAc of ENT1 KO mice prevented the decreased c-Fos levels in ENT1 KO mice (one-way ANOVA, F(3,8) = 14.69, P = 0.001; followed by Tukey post hoc tests, for WT vs KO, P = 0.048; for KO vs KO+vENT1, P = 0.001; Fig. S4B and C). Taken together with the results of the previous ethanol drinking experiments, our findings demonstrate that decreased c-Fos levels in the NAc may be related to higher ethanol intake in ENT1 KO mice during LL, which can be partially reversed by restoring ENT1 expression in the NAc of male mice.
Discussion
Our findings highlight that hypo-adenosinergic signaling in the NAc promotes ethanol intake. We found that constant light exposure reduces adenosine levels along with adenosine receptors and ENT1, which is attributed to excessive ethanol drinking in male mice, but not in female mice. Alcohol disrupts sleep homeostasis while sleep disruption also worsen alcohol intake44. Since ethanol intake promotes sleep, it has been suggested that alcohol use disorder (AUD) patients self-medicate with alcohol to fall asleep, which exacerbates alcohol drinking and existing sleep disturbances45. Interestingly, microinjection of a selective adenosine A1R antagonist significantly attenuated the sleep inducing effects of ethanol45, suggesting that adenosinergic signaling plays a critical role in mediating the sleep promoting effects of ethanol46. Additionally, our current study showed that LL reduced adenosine levels while increasing ethanol drinking. In future studies it will be interesting to determine whether LL-mediated reductions in adenosine levels may cause higher ethanol intake by reducing the hypnotic effects of ethanol. It is interesting that both total activity and adenosine levels are decreased in LL. Although decreased adenosine in the mice would have increased activity, the decrease in total activity could be due to the masking effects of light and may not be related to changes in adenosine signaling. In nocturnal animals, light inhibits activity and in diurnal animals, light stimulates activity. Given that circadian-related disruptions are associated with augmented alcohol drinking, LL-induced disruption of circadian activity would be expected to increase ethanol intake. In hamsters, LL increased ethanol consumption compared to LD47, which was consistent with our finding that LL significantly increased ethanol drinking in male mice. However, this finding differs from that of rats, where LL has a suppressive effect on ethanol intake48. We postulate that the difference may be due to prior constant dark (DD) exposure, which could suppress the effects of LL on ethanol intake48.
In general, mice typically become arrhythmic after approximately two weeks exposure to LL38. Surprisingly, we found that male ENT1 KO mice appeared to be protected from LL-induced circadian arrhythmicity. However, loss of ENT1 and LL increased ethanol drinking. ENT1 KO mice had lower adenosine levels in the striatum which may underlie the higher ethanol intake17. LL also decreased adenosine levels in the NAc which may contribute to higher ethanol intake in this study. It is possible that the effects of LL on adenosine levels and gene expression rhythms in the NAc underlie the increased ethanol consumption, independent of the effects of LL on the suprachiasmatic nucleus (SCN). Light sensitive retinal ganglion cells relay light information to various brain regions through both SCN-dependent and independent mechanisms49. Exploring differences in the NAc and SCN at the cellular and molecular levels in mice with a long circadian period compared to arrhythmic mice will be useful to understand the neurophysiological mechanisms underlying the role of the circadian system in modulating ethanol intake in future studies.
We chose dopamine D2 receptor (D2R) gene promoter to express ENT1 based on vector and virus availability for overexpression. Although we are using A2AR promoter driven Cre mice for other experiments, A2AR promotor driven overexpressing system is not well characterized. Thus, we decided to use well-characterized overexpression system. Notably, A2AR is co-expressed with D2R in the NAc and shown to play key roles in striatal neuronal function50. Previous in situ hybridization studies reveal that 93% of D2R cells contain A2AR mRNA, and 95% of A2AR cells contain D2R mRNA in striatum51–53. Thus, D2R driven overexpression of ENT1 would be appropriate to restore striatal ENT1 function in the overlapping A2AR and D2R neurons in the NAc. Restoration of ENT1 expression in the NAc of ENT1 KO mice reduced the effect of LL on ethanol drinking in ENT1 KO mice, which strongly suggests a direct role for ENT1 expression in the NAc in the effect of light on ethanol consumption. However, we cannot exclude the contributions from other brain regions which are believed to regulate ethanol drinking. Our finding revealed that both LL and loss of ENT1 increase ethanol intake. Interestingly, rescuing ENT1 by viral injection into the NAc appeared to partially reverse the increased ethanol intake in ENT1 KO mice under LL, suggesting that other effects of LL may contribute to the increase in ethanol consumption. Since both LL and lacking of ENT1 independently increased ethanol intake, it is possible that rescuing ENT1 by viral injection into the NAc would partially reverse the increased ethanol intake in ENT1 KO mice under LL condition. Additionally, rescuing ENT1 in the NAc had no significant effect on circadian activity. Since viral-mediated expression of ENT1 in the NAc did not completely restore ethanol consumption to WT levels, it is not surprising that viral-mediated expression of ENT1 in the NAc did not result in WT-like circadian activity in LL. In addition, the differences in homecage activity rhythms between WT and ENT1 KO mice may be related to differences in adenosine signaling in other brain regions involved in regulating rhythmic locomotor activity, such as the SCN.
In humans, males are known to consume more alcohol than females in general31,32. Paradoxically, in rodents, female mice consume more alcohol compared to male littermates54,55. Sex differences and ovarian hormones affect sleep, circadian rhythms56, as well as alcohol intake57. Interestingly, the estrous cycle can influence Per2 expression58. Since deficiency of PER2 increases ethanol intake59, the estrous cycle may influence ethanol drinking through altering Per2 or other clock genes. In humans, older women with menopause are more vulnerable to AUD60,61. Thus, female mice might be more sensitive to stress or hormone-induced changes of ethanol drinking compared to impact of LL. Notably, LL decreased adenosine levels in the NAc only in male mice during the daytime, which might be correlated with the reduction of A1R and A2AR levels, and were only observed in male, not in female mice. Furthermore, it is also important to confirm whether sex hormones, LL-induced stress, the stages of estrous cycle, x chromosome-specific genetic factors, or developmental effects of gonadal hormones influence ethanol intake and circadian rhythms. Nonetheless, our findings provide a novel sex-dependent role of ENT1 in regulating circadian rhythms and ethanol drinking.
Considering classical perspectives on the interactions between neurotransmitter levels and GPCRs surface expression62–64, our finding is unexpected. We revealed that adenosine levels were decreased in the striatum, and both A1 and A2A receptors were also reduced. We have not examined whether A1R or A2AR are transiently increased to compensate the loss of adenosine levels. However, LL-induced reduction of adenosine levels may also dampen the A1R and A2AR, although additional experiments are required to clarify the impact of LL on adenosine levels and receptors in the future. Since mice lacking ENT1 have reduced adenosine levels in the striatum17, hypo-adenosine and reduced adenosine A1 and or A2ARs-mediated signaling may contribute to LL-dependent excessive ethanol drinking. Previously, we reported that an A2AR antagonist promoted excessive ethanol drinking in WT, but not ENT1 KO mice65, suggesting that ENT1 regulates ethanol-related behaviors through A2AR. In addition, we previously found that activation of adenosine A1R reduced ethanol consumption in ENT1 KO mice18. Therefore, the lower level of both A1R and A2AR observed in ENT1 KO mice, may contribute to the increased ethanol drinking of ENT1 KO mice. A1R and A2AR are expressed in the different neurons populations in the NAc that have opposing functional roles66. A1R is mainly expressed in the dMSNs while A2AR is expressed in the indirect MSNs (iMSNs). Considering the opposing effects of the two receptors on GPCR signaling (Gi for A1R and Gs for A2AR), it is understandable that downregulation of both A1R and A2AR could promote ethanol consumption64.
In conclusion, our study demonstrates that striatal adenosine and ENT1 contribute to the effects of LL on ethanol drinking in male mice, but not female mice. We also revealed that LL lengthened circadian period in the absence of ENT1, which may correlate with the excessive ethanol intake of ENT1 KO mice. Our study supports a role of ENT1 in maintaining circadian rhythms and regulating ethanol drinking.
Supplementary Material
Acknowledgements
We thank all members of the DSC.’s laboratory for interest, help and comments. We thank summer undergraduate students, Nicoli Carneiro and Joyce Yang. This work was funded by the Samuel C. Johnson for Genomics of Addiction Program at Mayo Clinic, the Ulm Foundation, the Godby Foundation, the David Lehr Research Award from American Society for Pharmacology and Experimental Therapeutics, and National Institute on Alcohol Abuse and Alcoholism (AA018779), the Mayo Clinic Metabolomics Core and its supporting grants, U24DK100469 and UL1TR000135.
Footnotes
Supplementary Material
Refer to Web version on PubMed Central for supplementary material.
Conflict of interest
Dr. DS Choi is a scientific advisory board member to Peptron Inc. and the Peptron had no role in preparation, review, or approval of the manuscript; nor decision to submit the manuscript for publication. All the other authors declare no biomedical financial interests or potential conflicts of interest.
References
- 1.Trinkoff AM, Storr CL. Work schedule characteristics and substance use in nurses. Am J Ind Med. 1998;34(3):266–271. [DOI] [PubMed] [Google Scholar]
- 2.Hasler BP, Soehner AM, Clark DB. Circadian rhythms and risk for substance use disorders in adolescence. Curr Opin Psychiatr. 2014;27(6):460–466. [DOI] [PMC free article] [PubMed] [Google Scholar]
- 3.Gauvin DV, Baird TJ, Vanecek SA, Briscoe RJ, Vallett M, Holloway FA. Effects of time-of-day and photoperiod phase shifts on voluntary ethanol consumption in rats. Alcohol Clin Exp Res. 1997;21(5):817–825. [PubMed] [Google Scholar]
- 4.Ruby CL, Vadnie CA, Hinton DJ, et al. Adenosinergic regulation of striatal clock gene expression and ethanol intake during constant light. Neuropsychopharmacol. 2014;39(10):2432–2440. [DOI] [PMC free article] [PubMed] [Google Scholar]
- 5.Takahashi JS, Hong HK, Ko CH, McDearmon EL. The genetics of mammalian circadian order and disorder: implications for physiology and disease. Nat Rev Genet. 2008;9(10):764–775. [DOI] [PMC free article] [PubMed] [Google Scholar]
- 6.Takahashi JS, Shimomura K, Kumar V. Searching for genes underlying behavior: lessons from circadian rhythms. Science. 2008;322(5903):909–912. [DOI] [PMC free article] [PubMed] [Google Scholar]
- 7.Comasco E, Hallberg G, Helander A, Oreland L, Sundelin-Wahlsten V. Alcohol consumption among pregnant women in a swedish sample and its effects on the newborn outcomes. Alcohol Clin Exp Res. 2012;36(10):1779–1786. [DOI] [PubMed] [Google Scholar]
- 8.Kovanen L, Saarikoski ST, Haukka J, et al. Circadian clock gene polymorphisms in alcohol use disorders and alcohol consumption. Alcohol Alcoholism. 2010;45(4):303–311. [DOI] [PubMed] [Google Scholar]
- 9.Spanagel R, Rosenwasser AM, Schumann G, Sarkar DK. Alcohol consumption and the body’s biological clock. Alcohol Clin Exp Res. 2005;29(8):1550–1557. [DOI] [PubMed] [Google Scholar]
- 10.Parekh PK, Ozburn AR, McClung CA. Circadian clock genes: Effects on dopamine, reward and addiction. Alcohol. 2015;49(4):341–349. [DOI] [PMC free article] [PubMed] [Google Scholar]
- 11.Asatryan L, Nam HW, Lee MR, et al. Implication of the purinergic system in alcohol use disorders. Alcohol Clin Exp Res. 2011;35(4):584–594. [DOI] [PMC free article] [PubMed] [Google Scholar]
- 12.Dunwiddie TV, Masino SA. The role and regulation of adenosine in the central nervous system. Annu Rev Neurosci. 2001;24:31–55. [DOI] [PubMed] [Google Scholar]
- 13.Ruby CL, Adams CA, Knight EJ, Nam HW, Choi DS. An essential role for adenosine signaling in alcohol abuse. Curr Drug Abuse Rev. 2010;3(3):163–174. [DOI] [PMC free article] [PubMed] [Google Scholar]
- 14.Gass N, Ollila HM, Utge S, et al. Contribution of adenosine related genes to the risk of depression with disturbed sleep. J Affect Disorders. 2010;126(1–2):134–139. [DOI] [PubMed] [Google Scholar]
- 15.Nagy LE, Diamond I, Casso DJ, Franklin C, Gordon AS. Ethanol increases extracellular adenosine by inhibiting adenosine uptake via the nucleoside transporter. J Biol Chem. 1990;265(4):1946–1951. [PubMed] [Google Scholar]
- 16.Kim JH, Karpyak VM, Biernacka JM, et al. Functional role of the polymorphic 647 T/C variant of ENT1 (SLC29A1) and its association with alcohol withdrawal seizures. PLoS One. 2011;6(1):16331. [DOI] [PMC free article] [PubMed] [Google Scholar]
- 17.Nam HW, Lee MR, Zhu Y, et al. Type 1 equilibrative nucleoside transporter regulates ethanol drinking through accumbal N-Methyl-D-Aspartate receptor signaling. Biol Psychiatry. 2011;69(11):1043–1051. [DOI] [PMC free article] [PubMed] [Google Scholar]
- 18.Choi DS, Cascini MG, Mailliard W, et al. The type 1 equilibrative nucleoside transporter regulates ethanol intoxication and preference. Nat Neurosci. 2004;7(8):855–861. [DOI] [PubMed] [Google Scholar]
- 19.Bell RL, Kimpel MW, McClintick JN, et al. Gene expression changes in the nucleus accumbens of alcohol-preferring rats following chronic ethanol consumption. Pharmacol Biochem Be. 2009;94(1):131–147. [DOI] [PMC free article] [PubMed] [Google Scholar]
- 20.Sharma R, Engemann S, Sahota P, Thakkar MM. Role of adenosine and wake-promoting basal forebrain in insomnia and associated sleep disruptions caused by ethanol dependence. J Neurochem. 2010;115(3):782–794. [DOI] [PMC free article] [PubMed] [Google Scholar]
- 21.Short JL, Ledent C, Borrelli E, Drago J, Lawrence AJ. Genetic interdependence of adenosine and dopamine receptors: Evidence from receptor knockout mice. Neuroscience. 2006;139(2):661–670. [DOI] [PubMed] [Google Scholar]
- 22.Cheffer A, Castillo ARG, Correa-Velloso J, et al. Purinergic system in psychiatric diseases. Mol Psychiatry. 2018;23(1):94–106. [DOI] [PubMed] [Google Scholar]
- 23.Lindberg DM, Andres-Beck L, Jia YF, Kang SW, Choi DS. Puringergic signaling in neuron-astrocyte interactions, circadian rhythms, and alcohol use disorder. Fron. Physiol 2018; 9(9). [DOI] [PMC free article] [PubMed] [Google Scholar]
- 24.Porkka-Heiskanen T, Strecker RE, McCarley RW. Brain site-specificity of extracellular adenosine concentration changes during sleep deprivation and spontaneous sleep: an in vivo microdialysis study. Neuroscience. 2000;99(3):507–517. [DOI] [PubMed] [Google Scholar]
- 25.Porkka-Heiskanen T, Strecker RE, Thakkar M, Bjorkum AA, Greene RW, McCarley RW. Adenosine: A mediator of the sleep-inducing effects of prolonged wakefulness. Science. 1997;276(5316):1265–1268. [DOI] [PMC free article] [PubMed] [Google Scholar]
- 26.Kim T, Ramesh V, Dworak M, et al. Disrupted sleep-wake regulation in type 1 equilibrative nucleoside transporter knockout mice. Neuroscience. 2015;303:211–219. [DOI] [PMC free article] [PubMed] [Google Scholar]
- 27.Antle MC, Steen NM, Mistlberger RE. Adenosine and caffeine modulate circadian rhythms in the Syrian hamster. Neuroreport. 2001;12(13):2901–2905. [DOI] [PubMed] [Google Scholar]
- 28.Hallworth R, Cato M, Colbert C, Rea MA. Presynaptic adenosine A1 receptors regulate retinohypothalamic neurotransmission in the hamster suprachiasmatic nucleus. J Neurobiol. 2002;52(3):230–240. [DOI] [PMC free article] [PubMed] [Google Scholar]
- 29.Sigworth LA, Rea MA. Adenosine A1 receptors regulate the response of the mouse circadian clock to light. Brain Res. 2003;960(1–2):246–251. [DOI] [PubMed] [Google Scholar]
- 30.Krizo JA, Mintz EM. Sex differences in behavioral circadian rhythms in laboratory rodents. Front Endocrinol (Lausanne). 2014;5:234. [DOI] [PMC free article] [PubMed] [Google Scholar]
- 31.Nolen-Hoeksema S Gender differences in risk factors and consequences for alcohol use and problems. Clin Psychol Rev. 2004;24(8):981–1010. [DOI] [PubMed] [Google Scholar]
- 32.Schulte MT, Ramo D, Brown SA. Gender differences in factors influencing alcohol use and drinking progression among adolescents. Clin Psychol Rev. 2009;29(6):535–547. [DOI] [PMC free article] [PubMed] [Google Scholar]
- 33.Ruby CL, Walker DL, An J, Kim J, Choi DS. Sex-specific regulation of depression, anxiety-like behaviors and alcohol drinking in mice lacking ENT1. J Addict Res Ther. 2011;S4. [DOI] [PMC free article] [PubMed] [Google Scholar]
- 34.Lee MR, Ruby CL, Hinton DJ, et al. Striatal adenosine signaling regulates EAAT2 and astrocytic AQP4 expression and alcohol drinking in mice. Neuropsychopharmacol. 2013;38(3):437–445. [DOI] [PMC free article] [PubMed] [Google Scholar]
- 35.Ho AM, Qiu Y, Jia YF, et al. Combined effects of acamprosate and escitalopram on ethanol consumption in mice. Alcohol Clin Exp Res. 2016;40(7):1531–1539. [DOI] [PMC free article] [PubMed] [Google Scholar]
- 36.Livak KJ, Schmittgen TD. Analysis of relative gene expression data using real-time quantitative PCR and the 2(T)(-Delta Delta C) method. Methods. 2001;25(4):402–408. [DOI] [PubMed] [Google Scholar]
- 37.Pendergast JS, Friday RC, Yamazaki S. Photic entrainment of period mutant mice is predicted from their phase response curves. J Neurosci. 2010;30(36):12179–12184. [DOI] [PMC free article] [PubMed] [Google Scholar]
- 38.Verwey M, Robinson B, Amir S. Recording and analysis of circadian rhythms in running-wheel activity in rodents. J Vis Exp. 2013(71):50186. [DOI] [PMC free article] [PubMed] [Google Scholar]
- 39.Lanza IR, Zhang S, Ward LE, Karakelides H, Raftery D, Nair KS. Quantitative metabolomics by H-NMR and LC-MS/MS confirms altered metabolic pathways in diabetes. PLoS One. 2010;5(5):10538. [DOI] [PMC free article] [PubMed] [Google Scholar]
- 40.Kaplan GB, Bharmal NH, Leite-Morris KA, Adams WR. Role of adenosine A1 and A2A receptors in the alcohol withdrawal syndrome. Alcohol. 1999;19(2):157–162. [DOI] [PubMed] [Google Scholar]
- 41.Aschoff J, Wever R. Human circadian rhythms: a multioscillatory system. Fed Proc. 1976;35(12):236–232. [PubMed] [Google Scholar]
- 42.Ohta H, Yamazaki S, McMahon DG. Constant light desynchronizes mammalian clock neurons. Nat Neurosci. 2005;8(3):267–269. [DOI] [PubMed] [Google Scholar]
- 43.LeGates TA, Altimus CM. Measuring circadian and acute light responses in mice using wheel running activity. Jove-J Vis Exp. 2011(48):2463. [DOI] [PMC free article] [PubMed] [Google Scholar] [Retracted]
- 44.Thakkar MM, Sharma R, Sahota P. Alcohol disrupts sleep homeostasis. Alcohol. 2015;49(4):299–310. [DOI] [PMC free article] [PubMed] [Google Scholar]
- 45.Thakkar MM, Engemann SC, Sharma R, Mohan RR, Sahota P. Sleep-wakefulness in alcohol preferring and non-preferring rats following binge alcohol administration. Neuroscience. 29 2010;170(1):22–27. [DOI] [PMC free article] [PubMed] [Google Scholar]
- 46.Thakkar MM, Engemann SC, Sharma R, Sahota P. Role of wake-promoting basal forebrain and adenosinergic mechanisms in sleep-promoting effects of ethanol. Alcohol Clin Exp Res. 2010;34(6):997–1005. [DOI] [PMC free article] [PubMed] [Google Scholar]
- 47.Hammer SB, Ruby CL, Brager AJ, Prosser RA, Glass JD. Environmental modulation of alcohol intake in hamsters: effects of wheel running and constant light exposure. Alcohol Clin Exp Res. 2010;34(9):1651–1658. [DOI] [PMC free article] [PubMed] [Google Scholar]
- 48.Geller I Ethanol preference in the rat as a function of photoperiod. Science. 1971;173(3995):456–459. [DOI] [PubMed] [Google Scholar]
- 49.Schmidt TM, Chen SK, Hattar S. Intrinsically photosensitive retinal ganglion cells: many subtypes, diverse functions. Trends Neurosci. 2011;34(11):572–580. [DOI] [PMC free article] [PubMed] [Google Scholar]
- 50.Bonaventura J, Navarro G, Casado-Anguera V, et al. Allosteric interactions between agonists and antagonists within the adenosine A(2A) receptor-dopamine D-2 receptor heterotetramer. P Natl Acad Sci USA. 2015;112(27):3609–3618. [DOI] [PMC free article] [PubMed] [Google Scholar]
- 51.Chen JF, Xu K, Petzer JP, et al. Neuroprotection by caffeine and A(2A) adenosine receptor inactivation in a model of Parkinson’s disease. J Neurosci. 2001;21(10):RC143. [DOI] [PMC free article] [PubMed] [Google Scholar]
- 52.Fink JS, Weaver DR, Rivkees SA, et al. Molecular cloning of the rat A2 adenosine receptor: selective co-expression with D2 dopamine receptors in rat striatum. Brain Res Mol Brain Res. 1992;14(3):186–195. [DOI] [PubMed] [Google Scholar]
- 53.Schiffmann SN, Vanderhaeghen JJ. Adenosine A2 receptors regulate the gene expression of striatopallidal and striatonigral neurons. J Neurosci. 1993;13(3):1080–1087. [DOI] [PMC free article] [PubMed] [Google Scholar]
- 54.Middaugh LD, Kelley BM. Operant ethanol reward in C57BL/6 mice: influence of gender and procedural variables. Alcohol. 1999;17(3):185–194. [DOI] [PubMed] [Google Scholar]
- 55.Middaugh LD, Kelley BM, Bandy AL, McGroarty KK. Ethanol consumption by C57BL/6 mice: influence of gender and procedural variables. Alcohol. 1999;17(3):175–183. [DOI] [PubMed] [Google Scholar]
- 56.Mong JA, Baker FC, Mahoney MM, et al. Sleep, rhythms, and the endocrine brain: influence of sex and gonadal hormones. J Neurosci. 2011;31(45):16107–16116. [DOI] [PMC free article] [PubMed] [Google Scholar]
- 57.Lenz B, Muller CP, Stoessel C, et al. Sex hormone activity in alcohol addiction: integrating organizational and activational effects. Prog Neurobiol. 2012;96(1):136–163. [DOI] [PubMed] [Google Scholar]
- 58.Perrin JS, Segall LA, Harbour VL, Woodside B, Amir S. The expression of the clock protein PER2 in the limbic forebrain is modulated by the estrous cycle. P Natl Acad Sci USA. 2006;103(14):5591–5596. [DOI] [PMC free article] [PubMed] [Google Scholar]
- 59.Spanagel R, Pendyala G, Abarca C, et al. The clock gene Per2 influences the glutamatergic system and modulates alcohol consumption. Nat Med. 2005;11(1):35–42. [DOI] [PubMed] [Google Scholar]
- 60.Ahlström S Alcohol use and problems among older women and men: A review. Nordic Studies on Alcohol and Drugs. 2008;25(2):154–161. [Google Scholar]
- 61.Blow FC, Barry KL. Use and misuse of alcohol among older women. Alcohol Res Health. 2002;26(4):308–315. [PMC free article] [PubMed] [Google Scholar]
- 62.Ciruela F, Casado V, Rodrigues RJ, et al. Presynaptic control of striatal glutamatergic neurotransmission by adenosine A1-A2A receptor heteromers. J Neurosci. 2006;26(7):2080–2087. [DOI] [PMC free article] [PubMed] [Google Scholar]
- 63.Ferre S, Fredholm BB, Morelli M, Popoli P, Fuxe K. Adenosine-dopamine receptor-receptor interactions as an integrative mechanism in the basal ganglia. Trends Neurosci. 1997;20(10):482–487. [DOI] [PubMed] [Google Scholar]
- 64.Fredholm BB, IJ AP, Jacobson KA, Linden J, Muller CE. International union of basic and clinical pharmacology. LXXXI. Nomenclature and classification of adenosine receptors--an update. Pharmacol Rev. 2011;63(1):1–34. [DOI] [PMC free article] [PubMed] [Google Scholar]
- 65.Nam HW, Hinton DJ, Kang NY, et al. Adenosine transporter ENT1 regulates the acquisition of goal-directed behavior and ethanol drinking through A(2A) receptor in the dorsomedial striatum. J Neurosci. 2013;33(10):4329–4338. [DOI] [PMC free article] [PubMed] [Google Scholar]
- 66.Chen JF. The adenosine receptor: A homeostatic neuromodulator for fine-tuning control of cognition. In: Borea P, Varani K, Gessi S, Merighi S, Vincenzi F (eds) Humana Press, Cham. The adenosine receptors. The receptors, 2018; vol 34. [Google Scholar]
Associated Data
This section collects any data citations, data availability statements, or supplementary materials included in this article.