

Abstract
We critically evaluate the usefulness of different nanostructures described as labels, nanoscaffolds or separation media in immunoassays and nucleic-acid hybridization assays. Many of the great number of publications describe only theoretical aspects of using these nanostructures or nanoparticles, but do not verify their applicability in the presence of potential interferents that can be present in the sample matrix. We attempt a systematic study of the advantages and the limitations of using these new reagents in bioassays, the different assay formats for individual and multiplexed detection, and the capability of these assays in analyzing real samples.
Keywords: Immunoassay, Individual assay, Multiplexed assay, Nanoparticle, Nucleic acid
1. Introduction
The integration of nanotechnology into bioassays is having a great impact with the development of new nanostructures, nanodevices, nanomaterials or, in general, nanoparticles (NPs), such as nanoshells, nanowires, nanotubes and nanobarcodes, of a variety of shapes, sizes and composition [1], [2], [3], [4]. These NPs, which exhibit new structural, electronic, optical and catalytic properties that are not shown by the bulk matter, are being considered as alternatives to conventional reagents, such as enzymes or organic molecules, often used in bioassays.
Many bioassays use fluorescent dyes that show relatively low signals. However, the signals obtained using fluorescent NPs are much higher than those using individual fluorescent molecules, because of the presence of a larger number of fluorescent centers in one NP. Also, for the display of receptors, NPs present a larger surface area than flat surfaces and the reactions are faster and more sensitive.
Some of the success of NPs can be ascribed to their ability to improve the features of bioassays, allowing miniaturization and speed, reducing reagent and sample consumption, and facilitating the performance of heterogeneous formats. The use of NPs therefore allows miniaturization of biosensors, development of microfluidic systems and increase in the sensitivity of bioassays.
Although the use of NPs in bioanalysis is a recent area of research, there are many publications on their use as immobilization platforms or labels for detecting numerous analytes, such as proteins and nucleic acids, using immunoassays and hybridization assays, respectively. These new reagents have opened new opportunities in several fields, such as gene-expression studies, high-throughput screening and medical diagnostics. However, a relatively high percentage of reported analytical bioassays describe only the basis of the method but lack the corresponding application to the analysis of real samples. The suitability of these assays in the presence of sample matrices has not been established, because there are still several limiting factors, such as non-specific adsorption or binding, size variation, aggregation, and lack of stability and solubility. Also, although some NPs can be ideal labels for use in multiplexed immunoassays, the inherent cross-reactivity of antibodies remains a major shortcoming.
This article presents a critical overview of the most recent developments and trends in the use of NPs for detecting individual and simultaneous target molecules using immunoassays and nucleic-acid-hybridization assays. The study includes discussion comparing limits of detection (LODs) reported for a given analyte, using different NPs and detection systems, and evaluation of the practical usefulness of these bioassays.
2. Nanoparticles and bioassays
The composition of NPs determines the compatibility and the suitability of the probes with analytes and what assays are possible. Table 1 shows some of the NPs that have been more frequently described in analytical bioassays, together with the detection systems used. Fig. 1 summarizes the distribution of publications using different NPs in these bioassays. As can be seen, noble-metal NPs have been the most extensively used for this purpose. Fig. 1 shows the number of references for each year for every kind of NP, from which it can be seen there is an exponential growth of publications that will continue after 2007. Because of the large amount of information available, we give below only a brief summary of the main features and the limitations of these NPs, together with some chosen examples of the different assay formats.
Table 1.
Nanoparticles and detection systems commonly used in analytical bioassays
| Nanoparticles | Detection systems |
|---|---|
| Noble metals (Au, Ag, Pt) | Photometry, Fluorimetry, Rayleigh and Raman scattering, Surface-plasmon resonance, Potentiometry, Amperometry, Conductimetry, Stripping voltammetry, Quartz-crystal microbalance |
| Quantum dots (QDs) | Photometry, Fluorimetry, FRETa, Stripping voltammetry |
| Silica or polystyrene | |
| Dye-doped | Fluorimetry, Phosphorimetry |
| Lanthanide chelate-doped | Fluorimetry, FRETa |
| Ruthenium chelate-doped | Electrogenerated chemiluminescence |
| Carbon nanotubes | Electrochemical |
| Dendrimers | Fluorimetry |
FRET: Fluorescence resonance energy transfer.
Figure 1.
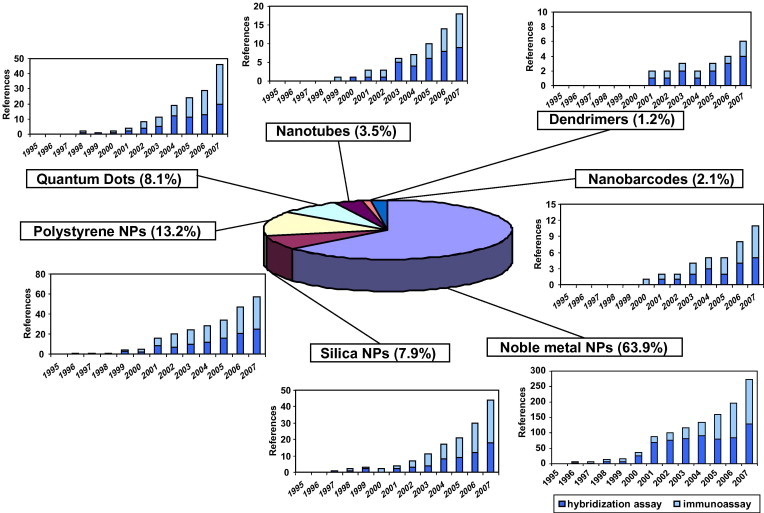
Distribution and number of publications per year involving the use of different nanoparticles (NPs) in immunoassays and hybridization assays. (Period: 1995–2007; Source: Scifinder Scholar).
Noble-metal NPs, mainly gold (AuNPs), have been widely used in numerous bioassays involving optical or electrochemical detection. They exhibit bright colors due to the presence of a plasmon-absorption band that is not present in the spectrum of the bulk metal, which is a result of the resonance of the incident photon frequency with the collective excitation of the conductive electrons of the particle. This effect is termed localized surface-plasmon resonance (LSPR) and depends on the size, shape and composition of the NPs, the distance between NPs and the refractive index of the environmental medium [2], [3]. Another feature of these NPs is their capability to produce surface-enhanced Raman scattering (SERS) effects [5]. Also, the redox properties of AuNPs have led to their widespread use as electrochemical labels in protein and nucleic-acid detection, with numerous configurations being explored [3], [4], [6]. The different and interesting properties of AuNPs have been widely explored in bioassays using a variety of detection systems, which are summarized in Table 1. These bioassays usually utilize AuNPs as optical or electrochemical labels to detect the target molecule, using direct, competitive or sandwich formats, as described below, although, in some instances, they act only as nanoscaffolds to increase the sensitivity of the assay, as is the case for many electrochemical sensors [4], [6], [7], [8].
Quantum dots (QDs) are inorganic semiconductor nanocrystals with interesting luminescent and electrochemical properties extensively used in numerous bioassays, as can be seen in several reviews that give a great deal of information about synthesis, properties and applications of QDs [2], [9], [10], [11], [12], [13], [14]. Briefly, these NPs show broad excitation profiles and narrow emission peaks and can emit in a range of wavelengths by changing their size and composition. Also, they lack photobleaching and have long fluorescence lifetimes. However, QDs can show blinking characteristics when they are excited with high-intensity light, which could be a limiting factor for fast-scan systems, such as flow cytometry. Other limitations are toxicity, size variation, agglomeration and non-specific binding. Surface oxidation of QDs can occur under combined exposure to aqueous/UV-light excitation, which can lead (e.g., in CdSe-based QDs) to the release of cadmium ions, so that these NPs are inadequate for in vivo applications, such as in vivo drug-delivery assays. However, they offer better imaging results than those achieved by organic dyes in cell-based or tissue-based drug studies [9], [13].
Capping the surface of the core QD with a protective shell of an insulating material or a wide-bandgap semiconductor can reduce the toxicity and increase the photostability of QDs [9]. One of the most commonly used QDs is therefore formed by an inner semiconductor core of CdSe coated with a ZnS shell, which gives rise to the formation of nanoshells. The emission of these NPs increases with increasing thickness of the shell. The different detection systems described for bioassays using QDs are summarized in Table 1, which shows that they are less versatile than AuNPs.
A variety of bioassays has been described with numerous configurations (see below), but their application to the analysis of real samples has been shown in some instances only. Other nanoshells have been formed by depositing a thin coating on the core of other NPs, which also show different properties from their single-component counterpart. For example, the SPR of metal nanoshells formed by depositing a metal shell around a dielectric core shifts according to the topological dimensions of core and shell [2], [15].
A large number of bioassays have used dye-doped silica NPs, which consist of luminescent organic or inorganic species dispersed inside a silica matrix [16], [17], [18], [19]. These NPs enable significant amplification of the analytical signal due to the numerous dye molecules inside each NP. Also, the interest in using these NPs in bioanalysis lies in the versatility of silica in synthesis and surface modification. Compared with polymer-based NPs, silica NPs show less aggregation and little leakage. Also, the silica surface favors the dispersion of the NPs in aqueous solution. For example, silica-based NPs functionalized for coupling and containing stable lanthanide chelates have been widely used in bioassays [2], [17], [20], since they are photostable, present sharp emission spectra, wide Stokes shifts, long fluorescence lifetimes and lack inner-filter quenching. Also, the surface of these NPs can be easily modified without altering their properties significantly. These lanthanide-doped silica NPs have been usually used for the development of fluorescence resonance energy transfer (FRET)-based assays, in which near-infrared acceptors are used to avoid background signals. Silica NPs containing ruthenium(II) chelates, mainly tris(2,2′-bipyridyl)dichlororuthenium(II) (RuBpy), have also been used in several bioassays with fluorescence or chemiluminescence (CL) detection [18], [21].
Carbon nanotubes (CNTs) represent an important group of nanomaterials with attractive geometrical, electronic and chemical properties [6], [22]. The structure of CNTs comprises concentric cylinders, with a diameter of few nm and up to hundreds of μm in length, which have interlinked hexagonal carbon rings. In addition to favorable electronic properties, they show a large surface area and an electrocatalytic effect that have been used in constructing electrochemical biosensors [6].
There are other NPs that have so far found fewer applications in bioassays. This is the case for dendrimers, which are hyperbranched, tree-like structures that have three different regions (i.e. core, branches and surface). They have been used in some bioassays as reagents by adsorbing, caging or covalently-binding active molecules, such as fluorescent dyes, inside or onto their surface [9], [23], [24].
The use of magnetic NPs is having a great impact in bioassays for separation and preconcentration. They comprise a metal or metallic oxide core, encapsulated in an inorganic or polymeric coating that renders the NPs biocompatible and stable and that may serve as a support for biomolecules [9], [17], [19]. Also, the development of hybrid NPs, such as magnetic-AuNPs or magnetic-QDs, which combine sample manipulation and sensitive detection, is a very promising recent field of research.
There is a clear trend towards developing multiplexed bioassays using nanobarcodes, which are based on the synthesis of particles that contain a mixture of NPs functionalized with the corresponding recognition agents. These agents can be antibodies or oligonucleotide sequences that recognize the targets of interest in protein or nucleic-acid detection, respectively [25]. Two main types of nanobarcodes have been described (microsphere based and metal nanowire) (Fig. 2 ). These systems show an encoded signal, which can be done internally or externally in the case of microspheres.
Figure 2.
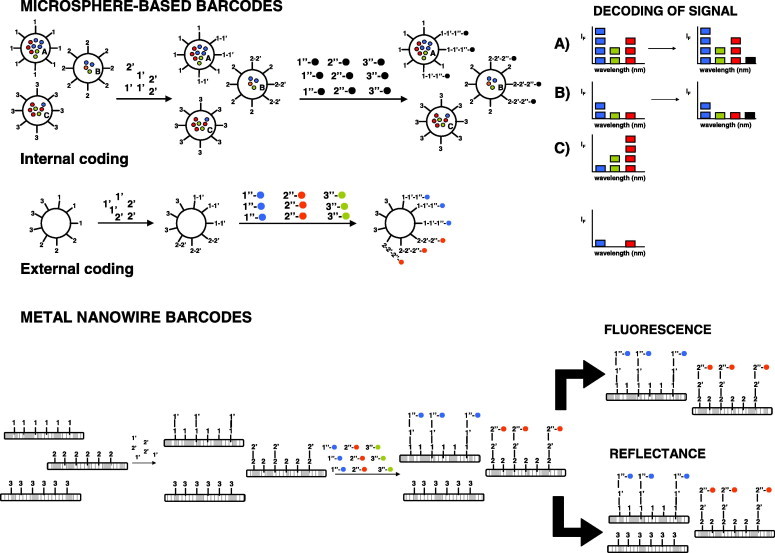
General scheme of microsphere-based and metal-nanowire barcodes. A,B and C correspond to different encoded microspheres. 1, 2, 3: molecular recognition elements, such as capture antibody or nucleic-acid strand. 1′, 3′: analytes. 1″-•, 2″-• and 3″-•, and 1″-•, 2″-• and 3″-• are NP-labeled antibodies or labeled complementary nucleic-acid strands.
An example of the first type uses QDs embedded into polymer or silica microbeads [9]. The encapsulated QDs are present in a large distribution of different wavelengths and intensities, and each species reacts to its corresponding encoded microsphere (A, B and C). It is possible to decode the signal, thanks to the absence of spectral overlap between the coded microsphere and the signal in the presence of the analyte. This is possible because of its reaction with the labeled recognition element, after washing the medium to remove unbound labeled elements.
The second option, with external coding, involves immobilizing molecular recognition elements for different species onto the same microsphere. The signal encoding will arise from the presence of the analytes in the sample and, if applicable, their further reaction with an NP-labeled recognition element.
Metal-nanowire barcodes are synthesized by encoding sub-μm metallic nanowires, which are manufactured by electroplating inert metals, such as gold and silver, into templates and then releasing the resulting striped NPs. The particles are intrinsically encoded by the different reflectivity of adjacent metal stripes, enabling the generation of many thousands of uniquely encoded substrates [26], [27]. The presence of the analytes is monitored by measuring the fluorescence from the labeled molecular recognition element.
3. Bioanalytical applications
Although some recent articles still report the potential usefulness of NPs in bioanalytical applications, there are numerous bioassays already yielding very promising results. Thus, even though some limitations still require to be overcome, the immunoassays and hybridization assays that we describe below show that the implementation of nanotechnology in bioanalysis is in its youth more than its infancy.
3.1. Immunoassays
Many immunoassays in recent years have used different NPs as labels [1], [2], [28], and have given rise to the return of interest in metalloimmunoassays, taking into account the metallic character of most of these NPs. There is a trend to develop multiplexed assays but, so far, most of the immunoassays described only allow individual determinations, partly because of the cross-reactivity limitations of the antibodies. However, there are some recent examples that show NPs useful for simultaneous determinations, which are described below.
3.1.1. Individual determinations
The great number of immunoassays described using NPs has made it necessary to choose only some methods. We based this selection mainly taking into account the applicability of the assays described for a low number of analytes, such as some tumor markers and other clinical parameters, in the presence of potential interferences from the sample matrix. Although other methods have been reported, the assays selected can give an overview of the usefulness, the versatility and the applicability of NPs in immunoassays.
3.1.1.1. Tumor-marker determination
Tumor markers are important targets for clinical diagnosis of cancer that are usually determined using different immunoassay technologies [29]. However, only brief information about the use of nanotechnology in this interesting area appeared in that review, so that we discuss in this section the usefulness of NPs for immunochemical determination in serum samples of three of the most commonly controlled tumor markers (i.e. human prostate-specific antigen (PSA), α-fetoprotein (AFP), and carcinoembryonic antigen (CEA) (Table 2 )).
Table 2.
Immunoassays for tumor-marker determination in serum
| Tumor marker | Nanoparticles (NPs) | Assay format | Detection system | Limit of detection (LOD) | Ref. |
|---|---|---|---|---|---|
| PSA | Eu(III)–chelate/polystyrene | Sandwich | Time-resolved fluorimetry | 0.21 pg/ml | [30] |
| Eu(III)–chelate/polystyrene | Sandwich | Time-resolved fluorimetry | 0.83 pg/ml | [31] | |
| QDs | Sandwich | Fluorescence microscopy | 0.25 ng/ml | [32] | |
| Au | Sandwich | SERSa | 1 pg/ml | [33] | |
| Au | Sandwich | Surface-plasmon resonance | 10 ng/ml | [34] | |
| Au | Sandwich | Surface-plasmon resonance | 0.2 ng/ml | [35] | |
| AFP | Ag/silica Magnetic/silica | Sandwich | SERSa | 11.5 pg/ml | [36] |
| FITC/silica | Sandwich | SSRTPb | 17 pg/ml | [37] | |
| Tb(III)-chelate/silica | Sandwich | Time-resolved fluorimetry | 0.1 ng/ml | [38] | |
| Au/magnetic | Sandwich | Fluorimetry | 12 ng/ml | [39] | |
| Ag | Direct | Potentiometry | 0.8 ng/ml | [40] | |
| Au/magnetic | Direct | Amperometry or Potentiometry | 0.5 ng/ml | [41] | |
| Au | Sandwich | Amperometry | 5 ng/ml | [42] | |
| CEA | Eu(III)-chelate/silica | Sandwich | Time-resolved fluorimetry | 1.9 pg/ml | [43] |
| Silica/titania | Direct | Potentiometry | 0.5 ng/ml | [44] | |
| Au/titania | Direct | Amperometry | 0.2 ng/ml | [45] | |
| Au/titania | Direct | Amperometry | 0.07 ng/ml | [46] | |
| Au | Direct | Amperometry | 0.1 ng/ml | [47] | |
| Magnetic/silica | Direct | Electrochemical resistance | 0.5 ng/ml | [48] | |
| CoFe2O4/silica | Direct | Quartz-crystal microbalance | 0.5 ng/ml | [49] | |
| Au | Direct | Quartz-crystal microbalance | 1.5 ng/ml | [50] |
SERS: Surface-enhanced Raman scattering.
SSRTP: Solid substrate room temperature phosphorimetry.
PSA is an intracellular glycoprotein (34 kDa) used for the diagnosis of prostate cancer, which can exist in serum as free PSA and complexed with various proteinase inhibitors, such as α-1-antichymotrypsin. Many immunoassays involving the use of NPs have been used for determination of free or total PSA. Table 2 shows some of the methods that have been applied to the analysis of serum samples [30], [31], [32], [33], [34], [35], all of them based on the use of sandwich format, in which the secondary antibody is immobilized on the NPs. The lowest LOD was obtained using polystyrene NPs containing europium(III) β-diketone chelates and time-resolved fluorimetry as the detection system to determine free [30] and total [31] PSA. The usefulness of QDs for total PSA detection was shown using fluorescence microscopy and a carbon substrate, in which the primary antibody-protein A complex was covalently bound [32]. After reaction of the primary antibody with PSA, the substrate was exposed to the biotinylated secondary antibodies, and, finally, QD streptavidin conjugates were captured on the substrate surface by the strong biotin-streptavidin affinity.
Several methods based on the use of AuNPs and SERS [33] or SPR [34], [35] have also been used for PSA determination, obtaining a better LOD in the first instance [33]. One of the methods involving SPR measurements utilized a commercially-available biosensor [34], single-domain antigen-binding fragments derived from dromedary heavy-chain antibodies (IgY), mouse monoclonal antibodies (MAbs) modified with biotin, and streptavidin conjugated to AuNPs. Although the smaller size of the IgY fragments compared to conventional antibodies allowed higher receptor densities to be obtained, the LOD of this assay was higher than that obtained using immunochromatography [35], in which the primary antibody was immobilized in a thin zone of a nitrocellulose membrane.
Alpha-fetoprotein (AFP) is an oncofetal protein (70 kDa) widely used as a tumor marker for diagnosis and management of hepatocellular carcinoma. Several types of NPs have been used for the immunochemical determination of AFP in serum samples using optical [36], [37], [38], [39] and electrochemical [40], [41], [42] detection systems (Table 2). The lowest LOD was obtained using SERS measurements in a sandwich-type immunoassay, which involved the use of polyclonal antibody functionalized Ag/silica NP-based Raman tags and MAb-modified, silica-coated magnetic NPs [36]. The magnetic NPs acted as immobilization matrix and separation tool, avoiding pre-treatment and washing steps. Also, a low LOD was obtained using silica NPs containing fluorescein isothiocyanate as luminescent label, and solid-substrate room-temperature phosphorescence as detection system [37].
Several electrochemical immunosensors involving direct [40], [41] and sandwich [42] formats have been used for the determination of AFP. The main function of NPs in these assays was to enlarge the valid electrode-surface area for immobilizing the antibodies. Thus, AgNPs were used to develop a potentiometric sensor, in which a gelatine-silver film was used to immobilize the antibody onto the surface of a platinum-disk electrode [40]. Another sensor used Fe2O3/Au-magnetic NPs [41], in which the antibody was covalently immobilized, and the NPs were attached to the surface of a carbon-paste electrode with the aid of a permanent magnet. AFP was directly determined by the change in current or potential before and after the immunochemical reaction. A higher LOD was obtained with an amperometric sensor using AuNPs in a sandwich format and enzyme-amplified immunoassay [42].
CEA is a 180–200 kDa glycoprotein widely used in the clinical diagnosis of neoplastic diseases, such as colorectal, gastric, pancreatic, hepatic, and cervical carcinomas. The features of some immunoassays recently used for CEA determination in serum using NPs. The lowest LOD reported was obtained in a sandwich format using silica-based fluorescent europium NPs and time-resolved fluorescence measurements [43].
Table 2 also shows several direct electrochemical immunoassays using different NPs [44], [45], [46], [47], [48]. The surface of a gold electrode was modified by adsorbing the antibodies onto the surface of silica NPs, which were entrapped into a titania sol-gel composite membrane [44]. Detection was based on the change in the potentiometric response before and after the immunochemical reaction.
AuNPs were utilized in developing several amperometric immunosensors for CEA determination using enzyme-amplified immunoassay [45], [46], [47]. Two of these sensors were prepared with titania NP/AuNP-bilayer films as the immobilization matrix on an Au electrode [45], [46], while the other was developed using AuNPs and a DNA-modified Au electrode for immobilizing the antibodies [47].
A direct flow-injection electrochemical method used epoxysilane-modified core-shell magnetic Fe3O4/silica NPs, which act as carriers for the antibodies and as electrode linkers [48]. The detection principle was based on the difference between resistances measured before and after the formation of the immunocomplex.
Quartz-crystal microbalance (QCB) immunosensors were developed for direct CEA determination, immobilizing magnetic CoFe2O4/silica composite NPs [49] or AuNPs [50] on the crystal surface. CEA antibodies were attached to the NPs, obtaining a frequency change in the presence of the analyte. The LODs obtained with these sensors were not very different from those reported for the sensors described above.
3.1.1.2. Other individual determinations
Table 3 shows some immunoassays proposed for the determination of hepatitis B surface antigen (HBsAg) in serum samples [43], [51], [52], [53], [54]. The sandwich assay based on the use of time-resolved fluorimetry and europium(III) chelate-doped silica NPs has the lowest LOD [43]. Another sandwich assay, with photometric detection, was developed by immobilizing one of the two antibodies on magnetic Fe3O4/AuNPs, which allowed separation of the immunocomplex using a magnetic field [51]. Similar LODs were obtained using direct potentiometric and amperometric immunosensors [52], [53], [54], based on using AuNPs attached to a platinum or a gold electrode and coating the antibodies on the NPs.
Table 3.
Immunoassay methods for hepatitis B surface antigen (HBAg) and interleukin-6 (IL-6) determination in serum samples using NPs
| Analyte | NPs | Assay format | Detection system | Limit of detection (LOD) | Ref. |
|---|---|---|---|---|---|
| HBAg | Eu(III)-chelate/silica | Sandwich | Time-resolved fluorimetry | 23 pg/ml | [43] |
| Au/magnetic | Sandwich | Photometry | – | [51] | |
| Au | Direct | Potentiometry | 1.3 ng/ml | [52] | |
| Au | Direct | Potentiometry | 15 ng/ml | [53] | |
| Amperometry | 5 ng/ml | ||||
| Au | Direct | Amperometry | 0.2 ng/ml | [54] | |
| IL-6 | Au | Sandwich | Chemiluminescence | 0.5 pg/ml | [55] |
| Au | Direct | Conductivity | 10 pg/ml | [56] | |
| Au | Direct | Amperometry | 1 ng/ml | [57] |
Interleukin-6 (IL-6) is a pleiotropic cytokine implicated in the pathogenesis of inflammatory processes, such as rheumatoid arthritis, psoriasis and cardiovascular disease. Table 3 shows very low LODs for the immunochemical determination of IL-6 in serum using AuNPs [55], [56], [57]. One of these methods was a sandwich assay with CL detection, in which the NPs were coated on the wells of microtiter plates to increase the loading capability for immobilizing the primary antibodies [55]. The other two assays involved developing electrochemical immunosensors with enzyme amplification for the direct determination of IL-6 by immobilizing enzyme-labeled IL-6 antibody onto the electrode by using composite membranes that contained the NPs [56], [57].
Some new immunoassays involving NPs have used human immunoglobulin G (IgG) as an analyte model, and showed their practical usefulness in the analysis of serum samples. For example, CdTe nanocrystals and dextran-Fe3O4 magnetic NPs were used in a fluorimetric sandwich assay, in which the primary antibody was immobilized on the magnetic NPs, which acted as a solid support, and the secondary antibody was attached to the surface of the CdTe nanocrystals via electrostatic interaction [58].
Another sandwich assay involved the catalytic precipitation of silver on the surface of Au NPs, which were used as the labels of the secondary antibodies [59], followed by the oxidation of the silver metal and the catalytic effect of silver ions on the CL reaction of luminol.
Silver enhancement was also used in electrochemical stripping detection of silver [60], but the LOD obtained was about 200-fold higher than that using CL detection.
QDs were recently used in capillary electrophoresis immunoassay for the direct determination of IgM in serum [61]. The method involved the conjugation of QDs with the antibody and the electrophoretic separation of the immunocomplex from the free antibody. QDs acted as fluorescent labels and as mobility modifiers of both the free antibody and the complex.
3.1.2. Multiplexed determinations
Different approaches have been reported for simultaneous determinations using multiplexing technologies, which combine the advantages of NPs with those of microarray and microfluidics. Table 4 shows some of these methods, which are briefly described below [5], [26], [62], [63], [64], [65], [66], [67], [68], [69], [70]. As can be seen, only a few methods have been applied to the analysis of real samples [68], [69], [70], because they are mainly concerned with development of new methodologies. Some improvements may still be required to avoid technical or selectivity problems.
Table 4.
Simultaneous multiplexed immunoassays using nanoparticles (NPs)
| NPs | Analytes | Assay format | Detection system | Samples | Ref. |
|---|---|---|---|---|---|
| QDs | Bacteria | Sandwich | Fluorimetry | – | [62] |
| QDs | Toxins | Sandwich | Fluorimetry | – | [63] |
| QDs | Proteins | Sandwich | Fluorimetry | – | [64] |
| QDs | Proteins | Sandwich | Stripping voltammetry | – | [65] |
| Dye-doped silica | Bacteria | Direct | FRET | – | [67] |
| Au-Ag | Proteins | Sandwich | SERS | – | [5] |
| Magnetic nanoshell | Proteins | Sandwich | Fluorimetry | – | [66] |
| Magnetic nanowires | Biowarfare agent simulants | Sandwich | Fluorimetry | – | [26] |
| Magnetic | Allergens | Sandwich | Magnetophoretic velocities | Serum | [68] |
| Magnetic silica | Tumor markers | Direct | Potentiometry | Serum | [69] |
| Magnetic | Proteins | Direct | Mass spectrometry | Plasma | [70] |
Two types of QDs with different emission wavelengths were used as fluorescent labels in a sandwich immunoassay for the simultaneous detection of two species of food-borne pathogenic bacteria, Escherichia coli and Salmonella typhimurium [62]. Target bacteria were separated from samples by using specific antibody-coated magnetic beads, and each QD type was labeled to the corresponding secondary antibody to obtain the tracers, which were attached to the bead-cell complexes.
A similar multiplexed sandwich immunoassay used QD-antibody conjugates for the simultaneous detection of cholera toxin, ricin, shiga-like toxin and staphylococcal enterotoxin B [63]. In this case, primary antibodies against all four toxins were adsorbed on the wells of 96-well plates, exposed to a mixture of all four toxins, and, after reaction with the tracers, the toxins were detected by measuring the fluorescence of the different QDs.
Multicolor QD-encoded polystyrene microspheres with two different antibodies, anti-human IgG and anti-rabbit IgG, have been used in a microfluidic on-chip device to detect fluorimetrically the corresponding antigens using a sandwich format [64].
The electrochemical properties of QDs were used in an immunoassay for the simultaneous determination of β2-microglobulin, IgG, bovine serum albumin and C-reactive protein, using four different QDs (ZnS, CdS, PbS and CuS), which yielded different voltammetric peaks [65]. The sandwich immunoassay used antibody-modified magnetic beads, which bound to the corresponding antigens, and used the corresponding QD-labeled secondary antibodies. Finally, the QDs were dissolved and the corresponding heavy metal quantified using stripping voltammetry.
The multiplexed direct monitoring of bacterial pathogens has used multicolored FRET silica NPs [67]. The NPs were synthesized by varying the ratio of three tandem dyes co-encapsulated into the NPs, so that they emitted unique colors upon excitation with a single wavelength. The NPs were conjugated to MAbs specific for E. coli, S. typhimurium and Staphylococcus aureus, and then incubated with the bacteria for their simultaneous detection.
Raman-reporter-labeled NPs were prepared using Au, Ag and Au-Ag NPs labeled with thiophenol, 4,4’-bipyridine and p-aminothiophenol, and used in a sandwich format for the simultaneous determination of mouse and human IgGs as protein models [5].
A simultaneous sandwich immunoassay for three model proteins (human, rabbit and mouse IgGs) used magnetic Co:Nd:Fe2O3/luminescent Eu:Gd2O3 core/shell NPs as a carrier [66]. The magnetic properties allowed their manipulation by an external magnetic field in the separation and washing steps in the assay, and the luminescent properties allowed the internal calibration of the detection system. The NPs were functionalized with the capture antibodies, while the secondary antibodies were labeled with different organic dyes.
Magnetic nanowires were used as multiplexed immunoassay platforms in a suspended format for the biowarfare-agent simulants (i.e. Bacillus globigii spores, RNA MS2 bacteriophage and ovalbumin) [26]. These simulants were chosen to reflect the variation in target sizes, ranging from large bacterial spores to small protein molecules. In addition to gold and silver, the nanowires contained nickel, which enabled the NPs to be manipulated by using magnetic fields. Antibody-conjugated nanowires were added to the antigen sample, incubated with a secondary reporter biotin-labeled antibody solution and, finally, with streptavidin-AlexaFluor647 fluorescent solution.
Two types of house-dust mites, Dermatophagoides farinae and Dermatophagoides pteronyssinus, were used as model allergens to develop a magnetophoretic immunoassay of allergen-specific IgE using enhanced magnetic field gradient [68]. Polystyrene microbeads were conjugated with each mite, followed by incubation with serum samples. The mixture was then reacted with magnetic NP-conjugated anti-human IgE using the sandwich format. The magnetophoretic velocities of the microbeads were measured in a microchannel under an applied magnetic field and the averaged velocity was correlated with the concentration of allergen-specific IgE in serum.
A multiple direct immunoassay was used for the simultaneous determination of four tumor markers (AFP, CEA, carcinoma antigen 125 and breast-cancer antigen 15-3) in serum samples using an electrochemical microfluidic device with magnetic control [69]. Each analyte was determined in a working electrode that contained the corresponding antibody immobilized on the surface of magnetic NiFe2O4/silica NPs.
Immunoassay and mass spectrometry were combined for multiple-antigen screening and characterization of antigen variants [70]. Antibody-conjugated magnetic NPs simultaneously preconcentrated and isolated targeted antigens from human plasma. Comparative protein profiling of patients with gastric cancer and healthy individuals showed differential protein-expression levels associated with the disease.
3.2. Nucleic acids
This section describes some of the most recent methods for the individual and multiplex detection of nucleic acids, mainly DNA, using NPs. These methods are hybridization assays, which allow the identification of one or several target-gene sequences by a DNA probe that forms a double-stranded hybrid with its complementary nucleic acid with high efficiency and selectivity.
3.2.1. Individual detection
The use of NPs for the electrochemical detection of DNA has been widely reported in several reviews [6], [8]. Also, a recent review gave an overview of colorimetric biosensors based on DNA-NP conjugates [71].
Table 5 summarizes some homogeneous [72], [73], [74] and heterogeneous [75], [76], [77], [78], [79] DNA hybridization assays, involving the use of AuNPs, including the different detection systems used and the corresponding LODs obtained. As can be seen, the best LODs reported involve the use of light-scattering [72], [73] and CL [75] detection.
Table 5.
DNA hybridization assays using nanoparticles (NPs)
| NPs | Detection system | Limit of detection (LOD) | Ref. |
|---|---|---|---|
| Au | Light scattering | 0.1 pM | [72] |
| 10 fM | [73] | ||
| Au | Fluorescence quenching of a rhodamine derivative | 2 nM | [74] |
| Au | Chemiluminescence | 0.1 pM | [75] |
| Au | Optical scanner | 0.1 μM | [76] |
| Au | Surface-plasmon resonance | 4.8 pM | [77] |
| Au | Quartz-crystal microbalance | 1 pM | [78] |
| Au | Electrochemical | 0.1 nM | [79] |
| Ag | Fluorimetry | 50 nM | [80] |
| Pt | Electrochemical | 1 nM | [81] |
| Tb-chelate silica | FRETa | 0.1 pM | [82] |
| Ru-chelate silica | Electrogenerated chemiluminescence | 0.1 pM | [83] |
| Quantum dots (QDs) | FRETa | – | [84] |
| Quantum dots (QDs) | FRETa | – | [85] |
| Quantum dots (QDs) | Fluorimetry | – | [87] |
FRET: Fluorescence resonance energy transfer.
The most sensitive light-scattering method [73] utilized DNA-functionalized magnetic particle probes that acted as scavengers for target DNA and were collected via a magnetic field. Once the DNA targets were isolated from the sample, they were sandwiched via hybridization with AuNPs modified with DNA complementary to a different target. AuNPs were dispersed in solution by dehybridization and silver was deposited on the surface of the AuNPs, which gave rise to the particle growth, increasing their scattering efficiency that was monitored as a function of time and correlated with target concentration.
The CL assay [75] relied on the hybridization of target DNA with the AuNP-labeled oligonucleotide probe, followed by the release of from the AuNPs anchored on the DNA hybrids using aqua regia, and the catalytic effect of on the luminol-hydrogen peroxide reaction.
In addition to AuNPs, other DNA hybridization assays have used NPs with silver [80], platinum [81] and silica containing terbium [82] or ruthenium chelates [83].
The potential usefulness of QDs in hybridization assays involving FRET and using QDs as donors and a fluorescent organic dye as acceptor has been also reported [84], [85], [86].
In one of these assays [84], nucleic-acid-functionalized QDs were hybridized with the complementary Texas-Red functionalized nucleic acid. However, recovery of the fluorescence was only partial, and that was attributed to the non-specific adsorption of the dye onto the QDs.
FRET, with the energy transfer pair QDs-Cy5, was also applied to study the stability and the composition of polymeric DNA nanocomplexes and their intracellular fate for gene delivery [85].
Fluorescence in situ hybridization (FISH) is a widely used nucleic acid-based technique for direct visualization of microorganisms. Although organic dyes are commonly used to obtain DNA probes, QDs have a better photostability, which was shown for FISH in E. coli [87].
A microfluidic device for the detection of microbial cells (Giardia lamblia), through dual staining of RNA hybridization, used FISH and a QD-labeled immunofluorescence assay (IFA) [88]. Cy3 was selected as the fluorescent dye for FISH, and combined with QDs for IFA to minimize possible signal interference between IFA and FISH.
Hybridization probes using QDs and FRET were also used for preliminary screening of small-interfering RNA (siRNA) sequences in mammalian cells [86]. In this case, a single-stranded siRNA was conjugated with QDs and Cy5-mRNA was used as a hybridization sample. The FRET signal was observed only when there was high accessibility between an antisense siRNA and a sense mRNA, and did not appear in the case of mismatch siRNAs.
3.2.2. Multiplexed detection
A useful application of NPs is the simultaneous detection of multiple DNA sequences using hybridization assays and microfluidic or microarray systems. These approaches are important in different areas, such as gene-expression profiling, detection of single-nucleotide polymorphism and diagnosis of common infectious diseases. Although several limitations, such as cross-reactivity and non-specific binding, have hindered the development of these determinations, Table 6 shows some interesting assays, which are briefly described below.
Table 6.
Multiplexed detection of DNA sequences using nanoparticles (NPs)
| NPs | Detection system | Samples | Ref. |
|---|---|---|---|
| Quantum dots (QDs) | Fluorimetry | – | [89] |
| Quantum dots (QDs) | Fluorimetry | Anthrax | [90] |
| Quantum dots (QDs) | FRET | – | [91] |
| Quantum dots (QDs) | Stripping voltammetry | BCRA 1 breast-cancer gene | [92] |
| Carbon nanotubes (CNTs) | Constant-current chronopotentiometry | BCRA 1 breast-cancer gene | [22] |
| Encoded nanowires | Fluorescence image | Genotypes | [27] |
| Encoded nanowires | Fluorimetry | Virus | [93] |
| Au nanobarcodes | Light scattering | Virus | [25] |
| Fluorescence-dye nanobarcodes | Fluorimetry | Pathogens | [24] |
| Quantum dot (QD)-encoded polystyrene beads | Fluorimetry | – | [94] |
| Au-Ag NPs | Photometry | Agents of sexually-transmitted diseases | [95] |
Different nucleic acid sequences were identified in two separation-free fluorimetric methods, which involved the measurement of the samples inside a microflow channel by a confocal spectroscopic system [89]. This approach minimized the time that individual analytes were exposed to the illumination region, avoiding potential photobleaching. One of these methods was based on a cross-linking system that utilized two streptavidin-conjugated QDs with distinct emission wavelengths, which were coupled to two biotinylated single-stranded DNA probes designed to hybridize at different binding sites of the same target DNA strand. The other method utilized only one type of streptavidin-conjugate QD and two single-stranded DNA probes, one biotinylated and the other conjugated to the organic fluorophore Oregon Green 488. The two probes were first mixed with a single-stranded target to form sandwich structures in solution, and QDs were added at the last step to capture the biotinylated sandwich structures, forming QD-sandwich nanoassemblies. In this instance, QDs acted as both fluorescent tags and nanoscaffolds that captured multiple fluorescently-labeled hybridization products, resulting in amplified target signals.
Multicolor oligonucleotide-functionalized QDs were used for genetic analysis for anthrax pathogenicity through simultaneous detection of multiple relevant sequences [90]. Discernible sequence-specific spectral codings were generated, obtaining combinatorial self-assembly of the nanoprobes in the presence of various target sequences via independent hybridization reactions.
The potential for simultaneous detection of DNA sequences by hybridization, based on FRET between two QD donors and two acceptor fluorophore (Cy3 and Alexa647)-labeled oligonucleotides, has also been studied [91]. Each QD-fluorophore FRET pair utilized a DNA sequence, using ethidium bromide as an intercalating dye to minimize non-specific adsorption.
Three encoding QDs (zinc sulfide, cadmium sulfide and lead sulfide) were used to differentiate the signals of three DNA targets in connection with a sandwich DNA hybridization assay and stripping-voltammetric measurements of the heavy-metal dissolution products [92]. The method was applied to the simultaneous detection of three DNA sequences related to the BCRA1 breast-cancer gene in a single sample using magnetic beads bearing the corresponding oligonucleotide probes.
The detection of nucleic-acid sequences related to the BRCA1 breast-cancer gene used CNT-modified electrodes for improving enzyme-based electrochemical detection of DNA hybridization [22]. Phenolic products of alkaline phosphatase strongly accumulate onto CNT-modified electrodes to allow detection of extremely low levels of the target DNA. Constant-current chronopotentiometry was used for detecting the α-naphthol product of the enzymatic reaction.
Nanobarcode particle technology was applied to multiplexed single-nucleotide polymorphism genotyping using encoded metallic nanowires [27]. Numerous genotypes were determined from multiplex PCR products from 20 genomic DNA samples.
Encoded nanowires were also used for multiplexed detection of DNA using a molecular beacon format assay [93]. The conjugation of several encoded nanowires to different oligonucleotide sequences allowed the detection of five viral pathogens (i.e. hepatitis A, hepatitis C, West Nile, human immunodeficiency and severe acute respiratory syndrome).
The biobarcode approach also detected multiple oligonucleotide targets simultaneously by using oligonucleotide sequences associated with hepatitis B virus surface-antigen gene, variola virus, Ebola virus and human immunodeficiency virus as model systems [25]. The detection was carried out using four sets of Au-NP probes loaded with barcode DNA sequences specific to a given target. Magnetic-microparticle probes were also used, being functionalized with oligonucleotides that were complementary to a nucleotide region within the target of interest and different from the region recognized by the NP probes. The assay used a microarray format in which the DNA targets were captured in solution by a sandwich process involving the AuNP and magnetic-microparticle probes, which were isolated with a magnetic field. The DNA strands were identified by using scanometric detection of the scattered light from the spots.
Dendrimer-like DNA-based, fluorescence-intensity-coded nanobarcodes, containing two oligonucleotides labeled with Alexa Fluor or BODIPY, were used for multiplexed DNA detection [24]. These nanobarcodes detected the DNA of four pathogens (Bacillus anthracis, Francisella tularensis, Ebola virus and SARS coronavirus) using fluorescence microscopy, dot blotting and flow cytometry.
Flow cytometry was also applied to multiplexed hybridization DNA analysis using carboxyl-functionalized polystyrene beads encoded with two types of QD [94].
A DNA microarray method was used for the simultaneous detection in clinical samples of Ureaplasma urealyticum and Chlamydia trachomatis, two common agents of sexually transmitted diseases, such as non-gonococcal urethritis [95]. The method combined chip technology, gold label, silver strain and multiplex asymmetrical PCR, and showed a sensitivity two orders of magnitude higher than that based on the conventional PCR.
Multiplexed FISH using QD-labeled oligonucleotide probes and imaging analysis was applied to multiplex detection of messenger RNA targets [96], [97]. The assays were carried out by labeling streptavidin-conjugated QDs to biotinylated oligonucleotide probes, using biocytin to reduce the multiple sites of streptavidin on the QD core, which gave rise to oligonucleotide cross-linking [97]. These assays were applied to samples with acute leukemia and follicular lymphoma [96] and to histological studies [97].
Two oligonucleotide microarray methods for micro RNA expression analysis used QDs or AuNPs [98]. One was based on measuring the fluorescence of QDs labeled with streptavidin bound to RNA. The method was used to profile 11 RNAs from the leaf and the root of rice seedlings. The other method involved colorimetric detection using AuNPs and silver enhancement, which avoided the high cost of detection equipment for the fluorescent method and reached a similar LOD.
4. Conclusions
The first conclusion that we can draw from this review is that nanotechnology is opening up numerous, attractive possibilities in bioanalysis in developing new approaches for diagnosis of cancer and other diseases, proteomics, genomics, drug-development and other screening assays with simultaneous, high-throughput measurements. There is no doubt that many theoretical and technical problems have to be solved, such as chemical-surface modifications of NPs to improve the selectivity of the bioassays, but NPs have a promising future in bioanalysis.
The success of NPs in routine bioassays will depend on how they compare with conventional assays in terms of sensitivity, selectivity, simplicity, reliability and applicability. So far, of the different NPs utilized in bioassays, AuNPs are the most versatile and extensively studied, followed by QDs, whereas it seems that lanthanide-doped NPs have the best LODs. The success of AuNPs in bioassays can be ascribed to their special photophysical properties, which include SPR and enhanced light scattering, together with easy synthesis in a wide range of sizes and shapes, facile surface conjugation to a variety of chemical and biomolecular ligands, desirable biocompatibility and high chemical photostability. Some of these properties also justify AuNPs being the most extensively NPs used so far in applications of electrochemical biosensors.
Although many of the assays described for individual analyte detection have shown their usefulness by their application to the analysis of real samples, the practical application of several multiplexed bioassays, mainly immunoassays, has not been shown, and is a basic requirement for the wholesale implementation of these assays. In this context, biobarcoding technology with nanowires or QDs is a very promising approach.
Acknowledgements
The authors gratefully acknowledge financial support from the Spanish MCyT (Ministerio de Ciencia y Tecnologı´a) (Grant No. CTQ2006-03263/BQU) and the Junta de Andalucia (Grant No. P06-FQM-01356).
References
- 1.Magliulo M., Michelini E., Simoni P., Guardigli M., Roda A. Anal. Bioanal. Chem. 2006;384:27. doi: 10.1007/s00216-006-0308-6. [DOI] [PubMed] [Google Scholar]
- 2.Seydack M. Biosens. Bioelectron. 2005;20:2454. doi: 10.1016/j.bios.2004.11.003. [DOI] [PubMed] [Google Scholar]
- 3.Tansil N.C., Gao Z. Nanotoday. 2006;1:28. [Google Scholar]
- 4.Merkoçi A. FEBS J. 2007;274:310. doi: 10.1111/j.1742-4658.2006.05603.x. [DOI] [PubMed] [Google Scholar]
- 5.Cui Y., Ren B., Yao J.L., Gu R.A., Tian Z.Q. J. Raman Spectrosc. 2007;38:896. [Google Scholar]
- 6.Pumera M., Sanchez S., Ichinose I., Tang J. Sens. Actuators, B. 2007;123:1195. [Google Scholar]
- 7.Wang J. Electroanalysis (N.Y.) 2007;19:769. [Google Scholar]
- 8.Castañeda M.T., Alegret S., Merkoçi A. Electroanalysis (N.Y.) 2007;19:743. [Google Scholar]
- 9.Ozkan M. Drug Discov. Today. 2004;9:1065. doi: 10.1016/S1359-6446(04)03291-X. [DOI] [PubMed] [Google Scholar]
- 10.Sapsford K.E., Pons T., Medintz I.L., Mattoussi H. Sensors. 2006;6:925. [Google Scholar]
- 11.Costa-Fernandez J.M., Pereiro R., Sanz Medel A. Trends Anal. Chem. 2006;25:207. [Google Scholar]
- 12.Costa-Fernandez J.M. Anal. Bioanal. Chem. 2006;384:37. doi: 10.1007/s00216-005-0189-0. [DOI] [PubMed] [Google Scholar]
- 13.Pinaud F., Michalet X., Bentolila L.A., Tsay J.M., Doose S., Li J.J., Iyer G., Weiss S. Biomaterials. 2006;27:1679. doi: 10.1016/j.biomaterials.2005.11.018. [DOI] [PMC free article] [PubMed] [Google Scholar]
- 14.Goldman E.R., Medintz I.L., Mattoussi H. Anal. Bioanal. Chem. 2006;384:560. doi: 10.1007/s00216-005-0212-5. [DOI] [PubMed] [Google Scholar]
- 15.Willner I., Basnar B., Willner B. FEBS J. 2007;274:302. doi: 10.1111/j.1742-4658.2006.05602.x. [DOI] [PubMed] [Google Scholar]
- 16.Liu G., Wang J., Wu H., Lin Y., Lin Y. Electroanalysis (N.Y.) 2007;19:777. [Google Scholar]
- 17.Yan J., Estevez M.C., Smith J.E., Wang K., He X., Wang L., Tan W. Nanotoday. 2007;2:44. [Google Scholar]
- 18.Lian W., Litherland S.A., Badrane H., Tan W., Wu D., Baker H.V., Gulig P.A., Lim D.V., Jin S. Anal. Biochem. 2004;334:135. doi: 10.1016/j.ab.2004.08.005. [DOI] [PubMed] [Google Scholar]
- 19.Smith J.E., Wang L., Tan W. Trends Anal. Chem. 2006;25:848. [Google Scholar]
- 20.Hemmilä I., Laitala V. J. Fluoresc. 2005;15:529. doi: 10.1007/s10895-005-2826-6. [DOI] [PubMed] [Google Scholar]
- 21.Hempen C., Karst U. Anal. Bioanal. Chem. 2006;384:572. doi: 10.1007/s00216-005-3392-0. [DOI] [PubMed] [Google Scholar]
- 22.Wang J., Kawde A.N., Jan M.R. Biosens. Bioelectron. 2004;20:995. doi: 10.1016/j.bios.2004.06.016. [DOI] [PubMed] [Google Scholar]
- 23.Bauer R.E., Grimsdale A.C., Müllen K. Top. Curr. Chem. 2005;245:253. [Google Scholar]
- 24.Li Y., Cu Y.T.H., Luo D. Nat. Biotechnol. 2005;23:885. doi: 10.1038/nbt1106. [DOI] [PMC free article] [PubMed] [Google Scholar]
- 25.Stoeva S.I., Lee J.S., Thaxton C.S., Mirkin C.A. Angew. Chem., Int. Ed. Engl. 2006;45:3303. doi: 10.1002/anie.200600124. [DOI] [PubMed] [Google Scholar]
- 26.Tok J.B.H., Chuang F.Y.S., Kao M.C., Rose K.A., Pannu S.S., Sha M.Y., Chakarova G., Penn S.G., Dougherty G.M. Angew. Chem., Int. Ed. Engl. 2006;45:6900. doi: 10.1002/anie.200601104. [DOI] [PubMed] [Google Scholar]
- 27.Sha M.Y., Walton I.D., Norton S.M., Taylor M., Yamanaka M., Natan M.J., Xu C., Drmanac S., Huang S., Borcherding A., Drmanac R., Penn S.G. Anal. Bioanal. Chem. 2006;384:658. doi: 10.1007/s00216-005-0225-0. [DOI] [PubMed] [Google Scholar]
- 28.Lechuga L.M. Anal. Bioanal. Chem. 2006;384:44. doi: 10.1007/s00216-005-0180-9. [DOI] [PubMed] [Google Scholar]
- 29.Wu J., Fu Z., Yan F., Ju H. Trends Anal. Chem. 2007;26:679. [Google Scholar]
- 30.Soukka T., Antonen K., Härmä H., Pelkkikangas A.M., Huhtinen P., Lövgren T. Clin. Chim. Acta. 2003;328:45. doi: 10.1016/s0009-8981(02)00376-5. [DOI] [PubMed] [Google Scholar]
- 31.Huhtinen P., Soukka T., Lövgren T., Härmä H. J. Immunol. Methods. 2004;294:111. doi: 10.1016/j.jim.2004.09.002. [DOI] [PubMed] [Google Scholar]
- 32.Kerman K., Endo T., Tsukamoto M., Chikae M., Takamura Y., Tamiya E. Talanta. 2007;71:1494. doi: 10.1016/j.talanta.2006.07.027. [DOI] [PubMed] [Google Scholar]
- 33.Grubisha D.S., Lipert R.J., Park H.Y., Driskell J., Porter M.D. Anal. Chem. 2003;75:5936. doi: 10.1021/ac034356f. [DOI] [PubMed] [Google Scholar]
- 34.Huang L., Reekmans G., Saerens D., Friedt J.M., Frederix F., Francis L., Muyldermans S., Campitelli A., Van Hoof C. Biosens. Bioelectron. 2005;21:483. doi: 10.1016/j.bios.2004.11.016. [DOI] [PubMed] [Google Scholar]
- 35.Tanaka R., Yuhi T., Nagatani N., Endo T., Kerman K., Takamura Y., Tamiya E. Anal. Bioanal. Chem. 2006;385:1414. doi: 10.1007/s00216-006-0549-4. [DOI] [PubMed] [Google Scholar]
- 36.Gong J.L., Liang Y., Huang Y., Chen J.W., Jiang J.H., Shen G.L., Yu R.Q. Biosens. Bioelectron. 2007;22:1501. doi: 10.1016/j.bios.2006.07.004. [DOI] [PubMed] [Google Scholar]
- 37.Hu S.R., Liu J.M., Yang T.L., Lui H.Z., Huang J.L., Lin Q.W., Zhu G.H., Huang X.M. Microchim. Acta. 2005;152:53. [Google Scholar]
- 38.Ye Z., Tan M., Wang G., Yuan J. Talanta. 2005;65:206. doi: 10.1016/j.talanta.2004.06.008. [DOI] [PubMed] [Google Scholar]
- 39.Ao L., Gao F., Pan B., He R., Cui D. Anal. Chem. 2006;78:1104. doi: 10.1021/ac051323m. [DOI] [PubMed] [Google Scholar]
- 40.Qiang Z., Yuan R., Chai Y., Wang N., Zhuo Y., Zhang Y., Li X. Electrochim. Acta. 2006;51:3763. [Google Scholar]
- 41.Tang D., Yuan R., Chai Y. Biotechnol. Lett. 2006;28:559. doi: 10.1007/s10529-006-0017-4. [DOI] [PubMed] [Google Scholar]
- 42.Xu Y.Y., Bian C., Chen S., Xia S. Anal. Chim. Acta. 2006;561:48. [Google Scholar]
- 43.Tan M., Wang G., Hai X., Ye Z., Yuan J. J. Mater. Chem. 2004;14:2896. [Google Scholar]
- 44.Liu Y., Jiang H. Electroanalysis (N.Y.) 2006;18:1007. [Google Scholar]
- 45.Shi Y.T., Yuan R., Chai Y.Q., He X.L. Electrochim. Acta. 2007;52:3518. [Google Scholar]
- 46.Shi Y.T., Yuan R., Chai Y.Q., Tang M.Y., He X.L. J. Electroanal. Chem. 2007;604:9. [Google Scholar]
- 47.Tang D.Q., Zhang D.J., Tang D.Y., Ai H. Electroanalysis (N.Y.) 2006;18:2194. [Google Scholar]
- 48.Pan J., Yang Q. Anal. Bioanal. Chem. 2007;388:279. doi: 10.1007/s00216-007-1224-0. [DOI] [PubMed] [Google Scholar]
- 49.Chen Z.G., Tang D.Y. Bioproc. Biosyst. Eng. 2007;30:243. doi: 10.1007/s00449-007-0120-5. [DOI] [PubMed] [Google Scholar]
- 50.Tang D.Q., Zhang D.J., Tang D.Y., Ai H. J. Immunol. Methods. 2006;316:144. doi: 10.1016/j.jim.2006.08.012. [DOI] [PubMed] [Google Scholar]
- 51.Yu A., Geng T., Fu Q., Chen C., Cui Y. J. Magn. Magn. Mater. 2007;311:421. [Google Scholar]
- 52.Tan D.P., Yuan R., Chai Y.Q., Zhong X., Liu Y., Dai J.Y., Zhang L.Y. Anal. Biochem. 2004;333:345. doi: 10.1016/j.ab.2004.06.035. [DOI] [PubMed] [Google Scholar]
- 53.Tang D., Yuan R., Chai Y., Fu Y., Dai J., Liu Y., Zhong X. Biosens. Bioelectron. 2005;21:539. doi: 10.1016/j.bios.2004.11.024. [DOI] [PubMed] [Google Scholar]
- 54.Liang R., Qiu J., Cai P. Anal. Chim. Acta. 2005;534:223. [Google Scholar]
- 55.Luo L., Zhang Z., Hou L. Anal. Chim. Acta. 2007;584:106. doi: 10.1016/j.aca.2006.10.047. [DOI] [PubMed] [Google Scholar]
- 56.Liang K., Mu W., Huang M., Yu Z., Lai Q. Electroanalysis (N.Y.) 2006;18:1505. [Google Scholar]
- 57.Liang K.Z., Mu W.J. Anal. Chim. Acta. 2006;580:128. doi: 10.1016/j.aca.2006.07.068. [DOI] [PubMed] [Google Scholar]
- 58.Li X., Wang L., Zhou C., Guan T., Li J., Zhang Y. Clin. Chim. Acta. 2007;378:168. doi: 10.1016/j.cca.2006.11.013. [DOI] [PubMed] [Google Scholar]
- 59.Li Z.P., Liu C.H., Fan Y.S., Wang Y.C., Duan X.R. Anal. Biochem. 2006;359:247. doi: 10.1016/j.ab.2006.09.030. [DOI] [PubMed] [Google Scholar]
- 60.Chu X., Fu X., Chen K., Shen G.L., Yu R.Q. Biosens. Bioelectron. 2005;20:1805. doi: 10.1016/j.bios.2004.07.012. [DOI] [PubMed] [Google Scholar]
- 61.Feng H.T., Law W.S., Yun L.J., Li S.F.Y. J. Chromatogr., A. 2007;1156:75. doi: 10.1016/j.chroma.2006.12.077. [DOI] [PubMed] [Google Scholar]
- 62.Yang L., Li Y. Analyst (Cambridge, U.K.) 2006;131:394. doi: 10.1039/b510888h. [DOI] [PubMed] [Google Scholar]
- 63.Goldman E.R., Clapp A.R., Anderson G.P., Uyeda H.T., Mauro J.M., Medintz I.L., Mattoussi H. Anal. Chem. 2004;76:684. doi: 10.1021/ac035083r. [DOI] [PubMed] [Google Scholar]
- 64.Ma Q., Wang X., Li Y., Shi Y., Su X. Talanta. 2007;72:1446. doi: 10.1016/j.talanta.2007.01.058. [DOI] [PubMed] [Google Scholar]
- 65.Liu G., Wang J., Kim J., Jan M.R., Collins G.E. Anal. Chem. 2004;76:7126. doi: 10.1021/ac049107l. [DOI] [PubMed] [Google Scholar]
- 66.Nichkova M., Dosev D., Gee S.J., Hammock B.D., Kennedy I.M. Anal. Biochem. 2007;369:34. doi: 10.1016/j.ab.2007.06.035. [DOI] [PMC free article] [PubMed] [Google Scholar]
- 67.Wang L., Zhao W., O’Donoghue M.B., Tan W. Bioconjugate Chem. 2007;18:297. doi: 10.1021/bc060255n. [DOI] [PubMed] [Google Scholar]
- 68.Hahn Y.K., Jin Z., Kang J.H., Oh E., Han M.K., Kim H.S., Jang J.T., Lee J.H., Cheon J., Kim S.H., Park H.S., Park J.K. Anal. Chem. 2007;79:2214. doi: 10.1021/ac061522l. [DOI] [PubMed] [Google Scholar]
- 69.Tang D., Yuan R., Chai Y. Clin. Chem. 2007;53:1323. doi: 10.1373/clinchem.2006.085126. [DOI] [PubMed] [Google Scholar]
- 70.Chou P.H., Chen S.H., Liao H.K., Lin P.C., Her G.R., Lai A.C.Y., Chen J.H., Lin C.C., Chen Y.J. Anal. Chem. 2005;77:5990. doi: 10.1021/ac050655o. [DOI] [PubMed] [Google Scholar]
- 71.Sato K., Hosokawa K., Maeda M. Anal. Sci. 2007;23:17. doi: 10.2116/analsci.23.17. [DOI] [PubMed] [Google Scholar]
- 72.Du B.A., Li Z.P., Liu C.H. Angew. Chem., Int. Ed. Engl. 2006;45:8022. doi: 10.1002/anie.200603331. [DOI] [PubMed] [Google Scholar]
- 73.Xu X., Georganopoulou D.G., Hill H.D., Mirkin C.A. Anal. Chem. 2007;79:6650. doi: 10.1021/ac070867g. [DOI] [PubMed] [Google Scholar]
- 74.Wu Z.S., Jiang J.H., Fu L., Shen G.L., Yu R.Q. Anal. Biochem. 2006;353:22. doi: 10.1016/j.ab.2006.01.018. [DOI] [PubMed] [Google Scholar]
- 75.Li Z.P., Liu C.H., Fan Y.S., Duan X.R. Anal. Bioanal. Chem. 2007;387:613. doi: 10.1007/s00216-006-0914-3. [DOI] [PubMed] [Google Scholar]
- 76.Sun Y., Jacobson K.B., Golovlev V. Anal. Biochem. 2007;361:244. doi: 10.1016/j.ab.2006.11.002. [DOI] [PMC free article] [PubMed] [Google Scholar]
- 77.Yang X., Wang Q., Wang K., Tan W., Li H. Biosens. Bioelectron. 2007;22:1106. doi: 10.1016/j.bios.2006.04.004. [DOI] [PubMed] [Google Scholar]
- 78.Lu W., Lin L., Jiang L. Biosens. Bioelectron. 2007;22:1101. doi: 10.1016/j.bios.2006.03.024. [DOI] [PubMed] [Google Scholar]
- 79.Cheng Y.T., Tsai C.Y., Chen P.H. Sens. Actuators B. 2007;120:758. [Google Scholar]
- 80.Aslan K., Malyn S.N., Geddes C.D. Biochem. Biophys. Res. Commun. 2006;348:612. doi: 10.1016/j.bbrc.2006.07.093. [DOI] [PubMed] [Google Scholar]
- 81.Polsky R., Gill R., Kaganovsky L., Willner I. Anal. Chem. 2006;78:2268. doi: 10.1021/ac0519864. [DOI] [PubMed] [Google Scholar]
- 82.Chen Y., Chi Y., Wen H., Lu Z. Anal. Chem. 2007;79:960. doi: 10.1021/ac061477h. [DOI] [PubMed] [Google Scholar]
- 83.Chang Z., Zhou J., Zhao K., Zhu N., He P., Fang Y. Electrochim. Acta. 2006;52:575. [Google Scholar]
- 84.Gill R., Willner I., Shweky I., Banin U. J. Phys. Chem. B. 2005;109:23715. doi: 10.1021/jp054874p. [DOI] [PubMed] [Google Scholar]
- 85.Ho Y.P., Chen H.H., Leong K.W., Wang T.H. J. Control. Release. 2006;116:83. doi: 10.1016/j.jconrel.2006.09.005. [DOI] [PMC free article] [PubMed] [Google Scholar]
- 86.Bakalova R., Zhelev Z., Ohba H., Baba Y. J. Am. Chem. Soc. 2005;127:11328. doi: 10.1021/ja051089h. [DOI] [PubMed] [Google Scholar]
- 87.Wu S.M., Zhao X., Zhang Z.L., Xie H.Y., Tian Z.Q., Peng J., Lu Z.X., Pang D.W., Xie Z.X. Chem. Phys. Chem. 2006;7:1062. doi: 10.1002/cphc.200500608. [DOI] [PubMed] [Google Scholar]
- 88.Zhang Q., Zhu L., Feng H., Ang S., Chau F.S., Liu W.T. Anal. Chim. Acta. 2006;556:171. doi: 10.1016/j.aca.2005.07.003. [DOI] [PubMed] [Google Scholar]
- 89.Yeh H.C., Ho Y.P., Wang T.H. Nanomed. Nanotechnol. Biol. Med. 2005;1:115. [Google Scholar]
- 90.Ho Y.P., Kung M.C., Yang S., Wang T.H. Nano Lett. 2005;5:1693. doi: 10.1021/nl050888v. [DOI] [PubMed] [Google Scholar]
- 91.Algar W.R., Krull U.J. Anal. Chim. Acta. 2007;581:193. doi: 10.1016/j.aca.2006.08.026. [DOI] [PubMed] [Google Scholar]
- 92.Wang J., Liu G., Merkoci A. J. Am. Chem. Soc. 2003;125:3214. doi: 10.1021/ja029668z. [DOI] [PubMed] [Google Scholar]
- 93.Sha M.Y., Yamanaka M., Walton I.D., Scott S.M., Stoermer R.L., Keating C.D., Natan M.J., Penn S.G. Nanobiotechnol. 2005;1:327. doi: 10.1385/NBT:1:4:327. [DOI] [PMC free article] [PubMed] [Google Scholar]
- 94.Wang H.Q., Liu T.C., Cao Y.C., Huang Z.L., Wang J.H., Li X.Q., Zhao Y.D. Anal. Chim. Acta. 2006;580:18. doi: 10.1016/j.aca.2006.07.048. [DOI] [PubMed] [Google Scholar]
- 95.Cao X., Wang Y.F., Zhang C.F., Gao W.J. Biosens. Bioelectron. 2006;22:393. doi: 10.1016/j.bios.2006.05.011. [DOI] [PubMed] [Google Scholar]
- 96.Tholouli E., Hoyland J.A., Di Vizio D., O’Connell F., MacDermott S.A., Twomey D., Levenson R., Yin J.A.L., Golub T.R., Loda M., Byers R. Biochem. Biophys. Res. Commun. 2006;348:628. doi: 10.1016/j.bbrc.2006.07.122. [DOI] [PubMed] [Google Scholar]
- 97.Chan P.M., Yuen T., Ruf F., Gonzalez-Maeso J., Sealfon S.C. Nucleic Acids Res. 2005;33:e161. doi: 10.1093/nar/gni162. [DOI] [PMC free article] [PubMed] [Google Scholar]
- 98.Liang R.Q., Li W., Tan C., Li J.X., Jin Y.X., Ruan K.C. Nucleic Acids Res. 2005;33:e17. doi: 10.1093/nar/gni019. [DOI] [PMC free article] [PubMed] [Google Scholar]