. 2020 Mar 18;9:e52779. doi: 10.7554/eLife.52779

Figure 10. GSK3 inhibitor BIO partially rescued the bone development defects in the Piezo1/2 mutants.

(a) Representative cross section images and quantification of μCT scans of the femurs from P21 mice. N = 4. *p<0.05, **p<0.01, ***p<0.001, two-tailed unpaired Student’s t-test and one-way ANOVA followed by Tukey’s multiple comparisons tests when ANOVA was significant. Data are shown as means ± SD (Figure 10—source data 1). (b) Immunostaining of humerus sections from P0 mouse pups. (c) Representative immunofluorecent images of Yap1 and Ctnnb1 staining of humerus sections from P0 mouse pups with the indicated genotypes. All scale bars: 100 μm. DAPI (blue) stained the nucleus.

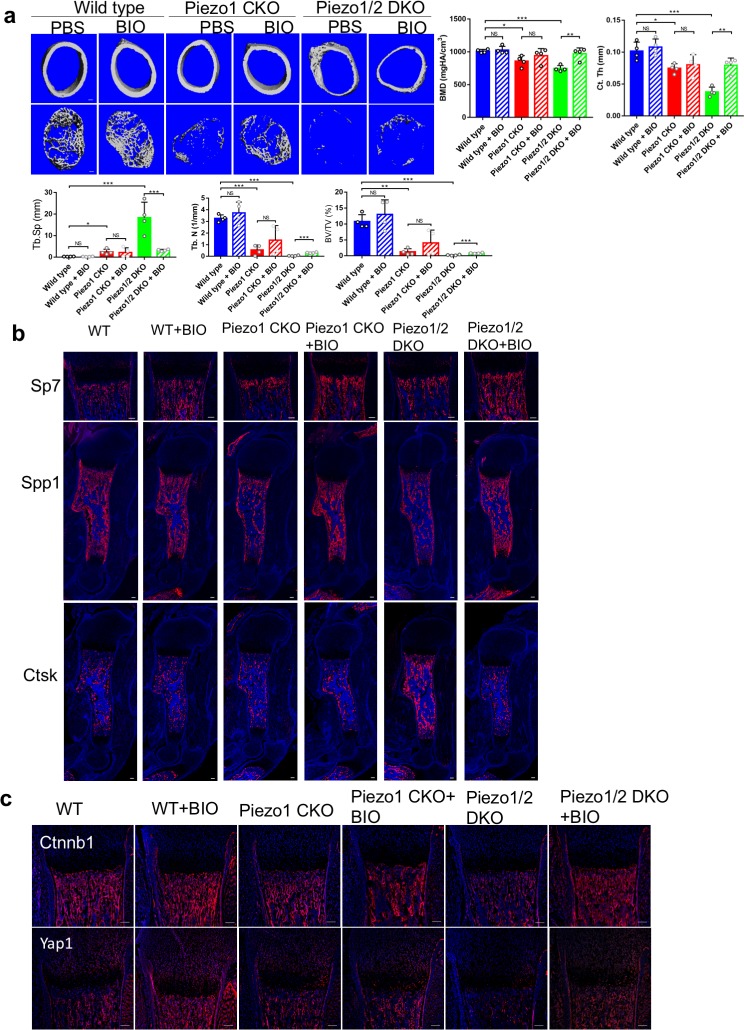
Figure 10—source data 1. Original data for quantification.

Figure 10.

Figure 10—figure supplement 1. BIO injection partially rescued the reduced bone mass phenotypes in Piezo mutants.

Figure 10—figure supplement 1.

(a) Alizarin red and alcine blue staining of the limbs from P21 mice with the indicated genotypes after PBS or BIO injection. The injection procedure is schematically shown on the top. The bone fracture numbers and femur length were quantified (n = 4). Scale bar: 1 cm. (b) von Kossa staining of humerus sections from P0 mice. Scale bar, 100 μm. BIO treatment increased mineralization of Piezo1/2 mutants. (c) Western blot analyses of lysates from primary BMSC cultured with indicated treatment. BIO (500 nM), Verteporfin (VP) (200 μg/μL), and XMU-MP-1 (2 μM), Cells were collected 3 hr after treatment. Protein bands in the blot were quantified by densitometry and analyzed using ImageJ. The first number indicated relative grayscale values to DMSO treated samples. The second number indicated the ratio of each protein level to β-actin. (d) Alkaline phosphatase staining and qPCR analyses of Ad-GFP or Ad-Cre infected Piezo1/2 conditional mutant BMSCs that had been treated with PBS or BIO in vitro. N = 3, data are shown as means ± SD. *p<0.05, **p<0.01, ***p<0.001, two-tailed unpaired Student’s t-test and one-way ANOVA followed by Tukey’s multiple comparisons tests when ANOVA was significant (a, b, c, d; Source data 1).