

Abstract
Background
Lung cancer is the most common cause of cancer‐related death among all human cancers and the five‐year survival rates are only 23%. The precise molecular mechanisms of non‐small cell lung cancer (NSCLC) are still unknown. The aim of this study was to identify and validate the key genes with prognostic value in lung tumorigenesis.
Methods
Four GEO datasets were obtained from the Gene Expression Omnibus (GEO) database. Common differentially expressed genes (DEGs) were selected for Kyoto Encyclopedia of Genes and Genomes pathway analysis and Gene Ontology enrichment analysis. Protein‐protein interaction (PPI) networks were constructed using the STRING database and visualized by Cytoscape software and Molecular Complex Detection (MCODE) were utilized to PPI network to pick out meaningful DEGs. Hub genes, filtered from the CytoHubba, were validated using the Gene Expression Profiling Interactive Analysis database. The expressions and prognostic values of hub genes were carried out through Gene Expression Profiling Interactive Analysis (GEPIA) and Kaplan‐Meier plotter. Finally, quantitative PCR and the Oncomine database were used to verify the differences in the expression of hub genes in lung cancer cells and tissues.
Results
A total of 121 DEGs (49 upregulated and 72 downregulated) were identified from four datasets. The PPI network was established with 121 nodes and 588 protein pairs. Finally, AURKA, KIAA0101, CDC20, MKI67, CHEK1, HJURP, and OIP5 were selected by Cytohubba, and they all correlated with worse overall survival (OS) in NSCLC.
Conclusion
The results showed that AURKA, KIAA0101, CDC20, MKI67, CHEK1, HJURP, and OIP5 may be critical genes in the development and prognosis of NSCLC.
Key points
Our results indicated that AURKA, KIAA0101, CDC20, MKI67, CHEK1, HJURP, and OIP5 may be critical genes in the development and prognosis of NSCLC. Our methods showed a new way to explore the key genes in cancer development.
Keywords: Bioinformatics analysis, differentially expressed gene, gene expression omnibus, non‐small‐cell lung cancer, prognosis
Introduction
Lung cancer is the most common cause of cancer‐related death among all human cancers. It is estimated that there are 571 340 men and women living in the United States with a history of lung cancer, and the number of estimated new cases with lung cancer will be 228 150 in 2019.1 Compared with histological classification, genes play an increasingly important role in the diagnosis, treatment, and prognosis of non‐small cell lung cancer (NSCLC). The mutations of targeted driver genes EGFR, BRAF and HER2, or the rearrangements of ALK or ROS1 only exist in less than half of lung adenocarcinoma cases, but in other cases of NSCLC without targeted molecular abnormalities the only therapeutic option is conventional platinum‐based doublet therapy maintenance for nonsquamous NSCLC.2, 3 Despite the fact that great progress has been made in chemotherapy, radiation therapy, surgery, and immunotherapy in lung cancer, the five‐year survival rates for NSCLC are only 23%.1 Since the precise molecular mechanisms of NSCLC remains unknown, it is extremely important to investigate molecular mechanisms and to develop effective therapeutic strategies in NSCLC.
With the rapid development of bioinformatics such as microarray technology, some high throughput platforms for analysis of gene expression are commonly used to find the differentially expressed genes (DEGs) during tumorigenesis.4 Now, through gene expression profiling studies using microarray technology, more and more DEGs associated with NSCLC have been identified. However, the DEGs identified with microarray technology depend on the sample size, tumor TMN, gender, ethnic group and other factors. A better option might be for DEGs to be obtained from different microarrays.
In this study, four microarray datasets (GSE18842,5 GSE33532,6 GSE62113,7 and GSE747068) were downloaded from the GEO database, and key genes identified by combining bioinformatics analyses in NSCLC. Gene ontology (GO) terms and Kyoto Encyclopedia of Genes and Genomes (KEGG) pathways associated with NSCLC were investigated, and the key genes associated with NSCLC were identified by network construction. Subsequently, we validated the expression of key genes related to NSCLC. Furthermore, we investigated the potential candidate biomarkers for their utility in diagnosis, prognosis, and drug targeting in NSCLC.
Methods
Gene expression profile data
In this study, four gene expression profiles (GSE18842, GSE33532, GSE62113 and GSE74706) were downloaded from the GEO database (http://www.ncbi.nlm.nih.gov/geo). GSE18842 included 46 NSCLC tissue samples and 45 paired nontumor samples. GSE33532 consisted of four different sites (A, B, C, D) of individual primary tumors and matched distant normal lung tissue from 20 patients. GSE62113 was total RNAs from xenografts, primary tumor, and normal adjacent tissues. GSE74706 included 18 NSCLC tissue samples and 18 paired nontumor samples. All the datasets included met the following criteria: (i) the tissue samples were gathered from NSCLC patients and corresponding adjacent or normal tissues; (ii) the tissue samples were tested by authority agency that recognized by Food and Drug Administration (FDA); (iii) a total of 15 samples or more were included; (iv) all the studies chosen had been previously published in the English language.
Data preprocessing and identification of DEGs
GEO2R is an interactive web tool used to compare two groups of samples and is capable of analyzing most of the GEO series.9 In this study, GEO2R was used to find DEGs between lung cancer and normal tissue samples. The cutoff criteria were adjusted P‐value (adj. P) <0.05 and |logFC| ≥2. FunRich, a stand‐alone software tool used mainly for functional enrichment and interaction network analysis of genes and proteins,10 was used to plot Venn diagrams from four datasets.
Functional and pathway enrichment analysis
The GO (http://www.geneontology.org) database mainly includes three categories: biological process (BP), cellular component (CC), and molecular function (MF).11 The KEGG (http://www.genome.ad.jp/kegg/) database collects genomic, chemical, and systematic functional information.12 The ClusterProfiler package implements methods to analyze and visualize functional profiles of gene and gene clusters.13 In this study, GO terms and KEGG pathways were analyzed using the ClusterProfiler package with the enrichment threshold of P < 0.05.
PPI network construction and analysis of modules
The STRING database (http://string-db.org/) provides a significant association of protein‐protein interactions (PPIs).14 Cytoscape is used for the visual exploration of interaction networks.15 In this study, DEG PPI networks were analyzed by the STRING database and subsequently visualized by using Cytoscape. The cutoff criterion was set as a combined score >0.4. The Cytoscape plugin CytoHubba16 was used to identify the hub genes by finding the intersection of the top 30 genes from 12 topological analysis methods. Molecular Complex Detection (MCODE) was then used to screen out modules of PPI networks, and the degree cutoff = 2, node score cutoff = 0.2, k‐core = 2, and max depth = 100.17
Hub gene validation by GEPIA
The Gene Expression Profiling Interactive Analysis (GEPIA) database (http://gepia.cancer-pku.cn/) is a web‐based tool to deliver fast and customizable functionalities based on The Cancer Genome Atlas (TCGA) and Genotype‐Tissue Expression (GTEx) data.18 In this study, the GEPIA database was used to validate the expression of hub genes identified in the module, and analyze the association of their expression levels with NSCLC TNM stage. We selected P < 0.05 and fold change >2 as a threshold.
Exploring cancer genomics data by cBioportal
The cBioPortal for Cancer Genomics (http://cbioportal.org) provides a resource for visualization and analyzing multidimensional cancer genomics data.19 In this study, alteration frequencies of hub genes were performed based on mutation and DNA copy‐number alterations in four selected lung cancer subtypes: Lung Adenocarcinoma‐TCGA, Provisional; Pan‐Lung Cancer‐TCGA, Nat Genet 2016; Small‐Cell Lung Cancer, U Cologne, Nature 2015; Lung Squamous Cell Carcinoma‐TCGA, Provisional.
Survival analysis of hub genes
A Kaplan‐Meier plotter (http://www.kmplot.com) was used to assess the effect of 54 675 genes on survival using 10 461 samples including 5143 breast, 1816 ovarian, 2437 lung, and 1065 gastric cancer patients.20 The relapse‐free and overall survival (OS) information was based on the GEO, EGA and TCGA database. The hazard ratio (HR) with 95% confidence intervals and log rank P‐value were calculated and indicated on the plot.21
Cell culture
The human lung adenocarcinoma H2935, H4006 cells and lung squamous cell carcinoma H226 cells were purchased from the American Type Culture Collection (ATCC, Manassas, VA, USA). Human bronchial epithelial BEAS‐2B cells were purchased from MssBio Co., Ltd. (Guangzhou, China). H2935, H4006, H226 and BEAS‐2B cells were cultured at Roswell Park Memorial Institute (RPMI); 1640 medium (GIBCO, Los Angeles, CA, USA), which contained 10% fetal bovine serum (FBS) and 100 U/mL penicillin‐streptomycin sulfate. All cell lines were grown in a humidified incubator at 37°C (5% CO2) environment.
Detection of hub gene expression level
Total RNA was extracted from the cells using TRIzol reagent (Thermo Fisher Scientific, Waltham, MA, USA). Single‐strand cDNA was synthesized from 1 mg of total RNA using the PrimeScript RT reagent Kit with gDNA Eraser (Takara Biotechnology Co. Ltd., Dalian, China). Reverse transcription quantitative PCR was used to detect the expression of mRNA of hub genes by 7500 PCR system (Thermo Fisher Scientific). The primers were as follows in the Table 1. The following cycling conditions: 95 minutes or five minutes, followed by 40 cycles of 95°C for 20 seconds and 60°C for 30 seconds. qPCR assays were conducted in triplicate in a 10 mL reaction volume each sample. And calculate the relative expression of AURKA, KIAA0101, CDC20, MKI67, CHEK1, HJURP and OIP5 mRNA by 2‐Ct method.
Table 1.
The primer of hub genes
| Primer name | Sense | Antisense |
|---|---|---|
| AURKA | CATTCCTTTGCAAGCACAAAAG | ATTTCAAAGTCTTCCAAAGCCC |
| KIAA0101 | AGGTTGTCCCCTAAAGATTCTG | ATCATTTGTGTGATCAGGTTGC |
| CDC20 | AGCAGCAGATGAGACCCTGAGG | CAGCGGATGCCTTGGTGGATG |
| MKI67 | CAGACATCAGGAGAGACTACAC | GTTAGACTTGCTGCTGAGTCTA |
| CHEK1 | CTCAAGTTTTGGCGGGAAAAG | AAGTTGAACTTCTCCATAGGCA |
| HJURP | AAAGACCCAGGCTATCAGAAC | TGTTCTCTCCTCTCTCTTCTGA |
| OIP5 | GTGGTCTTCTCCAGAGTTACAA | GAATACAGATGGAAACCAACGG |
Analysis of hub gene expression in the Oncomine database
The Oncomine database (http://www.oncomine.org) was applied for differential expression classification of common cancer types, and their respective normal tissues, as well as clinical and pathological analyses. In this study, the Oncomine database was used to further analyze the expression of hub genes in other lung adenocarcinoma datasets.
Results
Identification of DEGs
A total of 49 upregulated and 72 downregulated DEGs were identified from four datasets. The DEGs at the intersection of the four databases were selected for further investigation by Venn's diagram (Table 2 and Fig 1a–c).
Table 2.
The gene expression profile data characteristics
| Record | Tissue | Platform | Normal | Tumor | Reference |
|---|---|---|---|---|---|
| GSE18842 | NSCLC | GPL570[HG‐U133_Plus_2] Affymetrix Human Genome U133 Plus 2.0 Array | 45 | 46 | Sanchez‐Palencia et al.5 |
| GSE33532 | NSCLC | GPL570[HG‐U133_Plus_2] Affymetrix Human Genome U133 Plus 2.0 Array | 20 | 80 | Meister et al.6 |
| GSE62113 | NSCLC | GPL14951Illumina HumanHT‐12 WG‐DASL V4.0 R2 expression beadchip | 9 | 10 | Li et al.7 |
| GSE74706 | NSCLC | GPL13497Agilent‐026652 Whole Human Genome Microarray 4x44K v2 (Probe Name version) | 18 | 18 | Marwitz et al.8 |
Figure 1.

Identification of DEGs in profiling datasets. (a) Venn's diagram of upregulated DEGs; (b) Venn's diagram of downregulated DEGs; (c) Heatmap plot of the DEGs in the GSE33532 dataset. Red, higher expression; green, lower expression.
Enrichment analyses
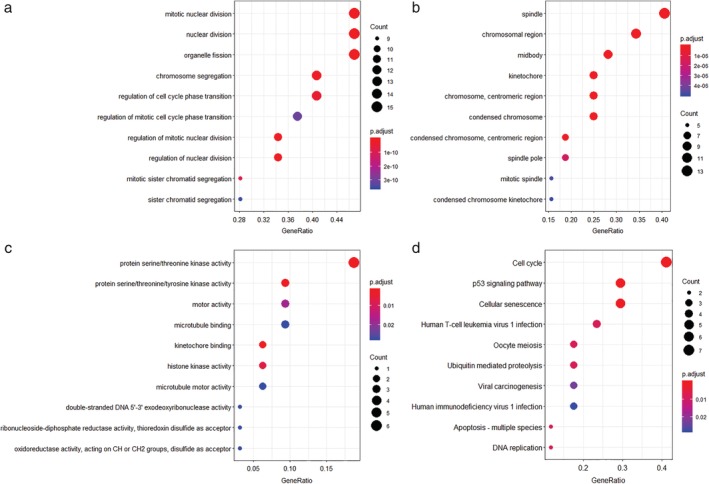
To further understand the function and mechanism of the identified DEGs, GO and KEGG enrichment analyses were performed using the ClusterProfiler package. The upregulated DEGs were mainly associated with the BP terms mitotic nuclear division, nuclear division, organelle fission, chromosome segregation and regulation of cell cycle phase transition (Fig 2a). Additionally, CC analysis showed that the upregulated genes were associated with spindle, chromosomal region, midbody and centrosome, and the downregulated genes were mainly found in apical part of cell, apical plasma membrane, cell projection membrane, lamellar body and multivesicular body (Figs 2b and 3a). Moreover, for upregulated genes, MF terms were mainly protein serine/threonine kinase activity, protein serine/threonine/tyrosine kinase activity, kinetochore binding and histone kinase activity (Fig 2c).
Figure 2.

Functional and pathway enrichment analysis of upregulated genes. (a) Enrichment of biological process. (b) Enrichment of cellular component. (c) Enrichment of molecular function. (d) Enrichment of Kyoto Encyclopedia of Genes and Genomes. The y‐axis shows significantly enriched pathways, and the x‐axis shows the Rich factor. Rich factor stands for the ratio of the number of target genes belonging to a pathway to the number of all the annotated genes located in the pathway. The higher Rich factor represents the higher level of enrichment. The size of the dot indicates the number of target genes in the pathway, and the color of the dot reflects the different P‐value range.
Figure 3.

Functional and pathway enrichment analysis of downregulated genes. (a) Enrichment of cellular component. (b) Enrichment of Kyoto Encyclopedia of Genes and Genomes.
The main three pathways that were particularly enriched by upregulated DEGs were P53 signaling pathway, cell cycle and cellular senescence (Fig 2d). Similarly, downregulated DEGs were notably enriched in ECM‐receptor interaction, AGE‐RAGE signaling pathway in diabetic complications, hypertrophic cardiomyopathy and dilated cardiomyopathy (Fig 3b).
PPI network construction
The DEG PPI network consisted of 121 nodes and 588 edges, including 49 upregulated genes and 72 downregulated genes (Fig 4a). A total of 10 hub genes were selected by the CytoHubba, including CLDN5, CHEK1, MKI67, AURKA, KIAA0101, HJURP, CDC20, OIP5, C4BPA and CA4. A significant module was obtained from the DEG PPI network by using MCODE, including 33 nodes and 523 edges (Fig 4b). Functional and KEGG pathway enrichment analyses revealed that genes in this module were mainly associated with cell cycle, p53 signaling pathway and cellular senescence (Fig 5a–d). Furthermore, we found that AURKA, KIAA0101, CDC20, MKI67, CHEK1, HJURP and OIP5 were involved in the GO, KEGG, and module analyses (Table 3).
Figure 4.

PPI network and module analysis. (a) PPI network of DEGs. (b) A significant module selected from PPI network. Red nodes, upregulated genes; yellow nodes, downregulated genes; red lines, strong interaction relationship between nodes; green lines, weak interaction relationship between nodes.
Figure 5.
Functional and pathway enrichment analysis of module. (a) Enrichment of biological process. (b) Enrichment of cellular component. (c) Enrichment of molecular function. (d) Enrichment of Kyoto Encyclopedia of Genes and Genomes.
Table 3.
Hub genes with high degree of connectivity
| Gene | Degree | Type | MCODE cluster |
|---|---|---|---|
| AURKA | 34 | up | Cluster 1 |
| KIAA0101 | 33 | up | Cluster 1 |
| CDC20 | 33 | up | Cluster 1 |
| MKI67 | 33 | up | Cluster 1 |
| CHEK1 | 33 | up | Cluster 1 |
| HJURP | 32 | up | Cluster 1 |
| OIP5 | 31 | up | Cluster 1 |
Hub gene validation
GEPIA, the online tool with data sourced from TCGA and GTEx, was used to validate the expression of these hub genes in lung cancer. GEPIA provides box plots, violin plots based on pathological stages, dot plots, and matrix plots. Consistent with the GEO analysis, GEPIA box plots of key gene expression levels showed that seven hub genes were overexpressed in lung cancer samples compared with normal tissues (Fig 6a–g). In addition, GEPIA violin plots of gene expression by pathological stages based on the TCGA clinical annotation revealed their high expression levels significantly associated with advanced TNM stage (P‐value <0.05) (Fig 7a–g).
Figure 6.

The expression level of hub genes in NSCLC. (a) AURKA; (b) CDC20; (c) CHEK1; (d) HJURP; (e) KIAA0101; (f) MKI67 and (g) OIP5. The red and gray boxes represent cancer and normal tissues, respectively. LUAD, lung adenocarcinoma; LUSC, lung squamous cell carcinoma.
Figure 7.

Violin plots of hub genes in NSCLC. (a) AURKA; (b) CDC20; (c) CHEK1; (d) HJURP; (e) KIAA0101; (f) MKI67 and (g) OIP5.
Genomic alterations of hub genes
We explored the specific alterations of hub genes using the cBioportal tool in four selected lung cancer datasets with 1662 samples. Cancer type summary analysis showed that the ratio of alteration of seven genes varied from 11.46% to 17.5%, with the lowest to highest level as lung squamous cell carcinoma, small‐cell lung cancer, and LAC in four lung cancer datasets (Fig 8a–h).
Figure 8.

Matrix heatmap of hub genes in four selected lung datasets. (a) All hub genes; (b) AURKA; (c) CDC20; (d) CHEK1; (e) HJURP; (f) KIAA0101; (g) MKI67 and (h) OIP5. Each row represents a gene and each column a tumor sample. Red bars, gene amplifications. Blue bars, deep deletion. Green squares, missense mutation.
Overall survival analyses
Overall survival analysis of hub genes was performed using the Kaplan‐Meier plotter. It was found that high expression of AURKA (HR 1.52 [1.33–1.72], log‐rank P = 1.2e–10), CDC20 (HR 1.82 [1.6–2.07], log‐rank P < 1e–16), CHEK1 (HR 1.9 [1.6–2.25], log‐rank P = 3.2e–14), HJURP (HR 1.89 [1.66–2.15], log‐rank P < 1e–16), KIAA0101 (HR 1.56 [1.37–1.77], log‐rank P < 5.1e–12), MKI67 (HR 1.6 [1.41–1.82], log‐rank P < 2.6e–13), and OIP5 (HR 1.79 [1.57–2.03], log‐rank P = 1e–16) was associated with worse OS for lung cancer patients (Fig 9a–g).
Figure 9.

Prognostic value of hub genes in lung cancer patients. (a) OIP5; (b) MKI67; (c) KIAA0101; (d) HJURP; (e) CHEK1; (f) CDC20 and (g) AURKA.
Gene expression levels of seven genes in lung cancer cells
The RT‐qPCR results showed that the gene expression level of AURKA, KIAA0101, CDC20, MKI67, CHEK1, HJURP and OIP5 in H2935, H4006 and H226 cell lines was significantly higher than BEAS‐2B cells lines. Finally, we analyzed the expression of AURKA, KIAA0101, CDC20, MKI67, CHEK1, HJURP and OIP5 in lung adenocarcinoma using the Oncomine database, and the results showed that hub genes were upregulated in lung cancer tissues and downregulated in normal tissues (Fig 10a–n).
Figure 10.

Histogram of the difference between expression of hub genes in lung cancer cells and the Oncomine database. (a,b) AURKA; (c,d) CDC20; (e,f) CHEK1; (g,h) HJURP; (i,j) KIAA0101; (k,l) MKI67 and (m,n) OIP5. **Compared to normal groups, P < 0.05, ***P < 0.001. ****P < 0.0001.
Discussion
In this study, we performed a series of bioinformatics analysis to screen key genes and pathways. The expression profiles found that 49 upregulated genes and 72 downregulated genes overlap DEGs (Intersection area of each dataset) were identified in lung cancer tissues compared to adjacent lung tissues. The upregulated genes were mainly enriched in P53 signaling pathway, cell cycle and cellular senescence, and closely related to tumorigenesis or metastasis. The downregulated genes were mainly enriched in ECM‐receptor interaction, AGE‐RAGE signaling pathway in diabetic complications, hypertrophic cardiomyopathy and dilated cardiomyopathy. Among the DEGs, the top 10 hub genes selected in the PPI network were all overexpressed. Functional and pathway enrichment analyses revealed that the significant modules were mainly enriched in cell cycle, p53 signaling pathway and cellular senescence.
Based on these findings, DEGs including AURKA, KIAA0101, CDC20, MKI67, CHEK1, HJURP and OIP5 were identified in these functions. These genes were also hub nodes in PPI networks. We then found the expression of seven key genes in NSCLC were higher than the control group. Furthermore, we researched the genomic alterations of hub genes in lung cancer cases from TCGA databases using the cBioPortal tool. We found hub gene mutation frequencies were highest in LUAD. Compared with other hub genes in lung cancer samples, MKI67 and CHEK1 had a higher alteration frequency of 6% and 2.7%, respectively. Survival analysis of the seven key genes showed that these genes were significantly associated with lung cancer.
Our bioinformatics analysis results predicted that AURKA, KIAA0101, CDC20, MKI67, CHEK1, HJURP and OIP5 gene markers may be closely related to the development of NSCLC. Finally, the verification results in cells showed that the expression of the hub genes was higher in lung cancer cells than normal cells, indicating that seven genes may play a significant role in the occurrence and development of lung cancer.
Aurora kinase A (AURKA) is a protein coding gene which plays a critical role in regulating many of the processes that are pivotal to mitosis. AURKA has many functions including regulation of cell cycle progression and the p53 /TP53 pathway.22 This gene may play a role in tumor development and progression. Diseases associated with AURKA include breast, colorectal, gastric, and liver cancers.23, 24, 25, 26 Previous studies have confirmed that AURKA expression is associated with lung cancer progression. A study by Zheng et al. showed that AURKA‐mediated phosphorylation of LKB1 may compromise the LKB1/AMPK signaling axis to facilitate NSCLC growth and migration.27 Additionally, Schneider et al.28 demonstrated that that the expression of the mitosis‐associated genes AURKA is associated with the prognosis of NSCLC patients. Therefore, our results suggest that AURKA may play an important role in future diagnostic and therapeutic targets in the treatment of lung cancer.
PCNA Clamp Associated Factor (PCLAF/KIAA0101) is a 15‐kDa protein containing a conserved proliferating cell nuclear antigen (PCNA)‐binding motif, a key factor in DNA repair and/or apoptosis and cell cycle regulation, which has been observed in a variety of human malignancies.29 The functions of KIAA0101 mainly include cellular response to DNA damage stimulus, DNA replication and, regulation of cell cycle.30, 31, 32 Several studies have revealed that KIAA0101 overexpression is associated with the progression and recurrence in prostate cancer, gastric cancer, breast cancer, liver cancer and other malignancies.33, 34, 35, 36 A study showed that KIAA0101 overexpression was an independent prognostic factor, and associated with high‐grade tumor, high‐stage tumor, and early tumor recurrence in hepatocellular carcinoma.36 However, there is insufficient evidence to support the role of KIAA0101 in lung cancer. Kato et al. reported that overexpression of KIAA0101 may predict a poor prognosis in primary lung cancer patients.29 Cell cycle regulatory factors play an important role in cancer development, and this study suggested that KIAA0101 may be a cell cycle regulatory factor with therapeutic potential for the treatment of lung cancer.
Cell division cycle 20 (CDC20) is an important spindle assembly checkpoint protein and activates APC/C to initiate anaphase.37, 38 Previous studies have already reported overexpression of CDC20 in various tumors such as gastric, breast, prostate, colorectal tumors and others.39, 40, 41, 42 Currently, the overexpression of CDC20 has been reported in human NSCLC43 and the overexpression of CDC20 has been shown to predict a poor prognosis in primary NSCLC patients.44 In our study, we found that CDC20 was enriched in cell cycle pathway and oocyte meiosis, and involved in the GO BP terms cell cycle phase, M phase, mitotic cell cycle and nuclear division. Cell cycle dysregulation underlies the aberrant cell proliferation which characterizes cancer, and the loss of cell cycle checkpoint control promotes genetic instability. CDC20 was highly expressed in NSCLC samples compared with normal samples in our study. Thus, our findings suggest that CDC20 may be a promising diagnostic and therapeutic target in NSCLC.
Marker of proliferation Ki‐67 (MKI67) is a protein coding gene which is expressed in proliferating cells. Due to being strongly expressed in proliferating cells, the MKI67 has been considered as an established prognostic indicator for the assessment of cell proliferation in biopsies from cancer patients.45, 46 Ki‐67 is primarily expressed during the active phases of the cell cycle, cell population proliferation, regulation of mitotic nuclear division and regulation of mitotic nuclear division.47, 48 Accumulating evidence has shown that MKI67 overexpression is associated with cancer progression and prognosis in prostate cancer, breast cancer, gastric cancer and nasopharyngeal carcinoma.49, 50, 51, 52 A study reported that E‐cadherin and Ki‐67 together play a key role in the development, invasion and metastasis of NSCLC.53 Our results further revealed that MKI67 might play an important role in lung cancer development and could be used as a therapeutic target for NSCLC cancer patients.
Checkpoint kinase 1 (CHEK1) encodes serine/threonine kinases which is a central component of DNA damage response and is involved in the control of the cell cycle. The function of CHEK1 is to regulate cell cycle checkpoints, and coordinate cellular activities involving DNA repair and cell cycle arrest.54 More and more research has indicated that CHEK1 is widely associated with carcinoma, such as breast, ovarian and colorectal cancers.55, 56, 57 There is a lack of evidence in determining the relationship between CHEK1 and NSCLC, with a study by Liu et al. reporting that miR‐195 interacted with CHEK1 mRNA and suppressed its protein expression in NSCLC, indicating that CHEK1 expression may be associated with patient survival.58 Our results demonstrated that CHEK1 might contribute to NSCLC and be used as a novel therapeutic target in NSCLC.
The Holliday junction recognition protein (HJURP) is an exclusive companion for the centromere CENP‐A deposition during the early G1 phase.59 In the human being, HJURP has been identified to be an important regulator of DNA binding and phosphorylation involved in the regulation of chromosomal segregation and cell division.60, 61 Recently, the biological effects of HJURP attracted growing attention in several tumors such as hepatocellular carcinoma, breast cancer, and glioblastoma.62, 63, 64 A study by Zhou et al. reported that HJURP was found to be overexpressed in lung cancer65 and promoted NSCLC cell proliferation and metastasis by inactivating the Wnt/β‐catenin pathway in the report by Wei et al.66 Our observations suggest that HJURP abnormalities may contribute to the risk of developing lung cancer.
Opa Interacting Protein 5 (OIP5) is a protein coding gene. The protein encoded by this gene localizes to centromeres where it is essential for recruitment of CENP‐A through the mediator Holliday junction recognition protein.67 Expression of this gene is upregulated in several cancers including bladder cancer, gastric cancer, colorectal cancer, breast cancer and hepatocellular carcinoma.68, 69, 70, 71 In lung cancer, OIP5 might play an important role in the growth of lung cancers by interacting with Raf1.72 Furthermore, in our study, we were able to demonstrate that OIP5 was a key gene in tumor development in NSCLC.
Compared with previous work, our study has several advantages. First, this study had a large sample size obtained from multiple GEO datasets. Second, we further analyzed and visualized the functional and pathway enrichment of the main DEGs. Third, the hub genes were cross‐validated using different databases such as GEO, TCGA, Oncomine and GTEx. Finally, we determined the expression level of hub genes in different cell lines by quantitative reverse transcription PCR.
However, there are some limitations to our study. First, the quality of data from the GEO database could not be appraised. Second, our results did not include characteristics such as sex, age, smoke, tumor classification, and staging in detail. We are therefore of the opinion that there should be more clinical research in order to confirm our results.
In conclusion, in this study, we determined that AURKA, KIAA0101, CDC20, MKI67, CHEK1, HJURP and OIP5 may be critical genes in the development and prognosis of lung cancer through bioinformatics analysis combined with quantitative reverse transcription PCR. However, it is essential that further experiments are carried out and clinical data made available to confirm the results of our study and guide the discovery of future gene therapies against NSCLC.
Disclosure
The authors report no conflicts of interest in this work.
Acknowledgments
I would like to thank my tutor for academic guidance and my family for their support. This study was supported by the Taishan Scholar foundation (No. tshw201502061).
Contributor Information
Li Wang, Email: 931993081@qq.com.
Xiaochun Zhang, Email: zxc9670@qdu.edu.cn.
References
- 1. Miller KD, Nogueira L, Mariotto AB et al Cancer treatment and survivorship statistics, 2019. CA Cancer J Clin 2019; 69 (5): 363–85. [DOI] [PubMed] [Google Scholar]
- 2. Hanna N, Johnson D, Temin S et al Systemic therapy for stage IV non–small‐cell lung cancer: American Society of Clinical Oncology clinical practice guideline update. J Clin Oncol 2017; 35 (30): 3484–515. [DOI] [PubMed] [Google Scholar]
- 3. Barlesi F, Mazieres J, Merlio JP et al Routine molecular profiling of patients with advanced non‐small‐cell lung cancer: Results of a 1‐year nationwide programme of the French Cooperative Thoracic Intergroup (IFCT). Lancet 2016; 387 (10026): 1415–26. [DOI] [PubMed] [Google Scholar]
- 4. Russo G, Zegar C, Giordano A. Advantages and limitations of microarray technology in human cancer. Oncogene 2003; 22 (42): 6497–507. [DOI] [PubMed] [Google Scholar]
- 5. Sanchez‐Palencia A, Gomez‐Morales M, Gomez‐Capilla JA et al Gene expression profiling reveals novel biomarkers in nonsmall cell lung cancer. Int J Cancer 2011; 129 (2): 355–64. [DOI] [PubMed] [Google Scholar]
- 6. Meister M, Belousov A, Xu EC et al Intra‐tumor heterogeneity of gene expression profiles in early stage non‐small cell. Lung Cancer 2014; 1: 1. [Google Scholar]
- 7. Li L, Wei Y, To C et al Integrated omic analysis of lung cancer reveals metabolism proteome signatures with prognostic impact. Nat Commun 2014; 5: 5469. [DOI] [PubMed] [Google Scholar]
- 8. Marwitz S, Depner S, Dvornikov D et al Downregulation of the TGFβ pseudoreceptor BAMBI in non–small cell lung cancer enhances TGFβ signaling and invasion. Cancer Res 2016; 76 (13): 3785–801. [DOI] [PubMed] [Google Scholar]
- 9. Barrett T, Wilhite SE, Ledoux P et al NCBI GEO: Archive for functional genomics data sets—Update. Nucleic Acids Res 2012; 41 (D1): D991–5. [DOI] [PMC free article] [PubMed] [Google Scholar]
- 10. Pathan M, Keerthikumar S, Chisanga D et al A novel community driven software for functional enrichment analysis of extracellular vesicles data. J Extracell Vesicles 2017; 6 (1): 1321455. [DOI] [PMC free article] [PubMed] [Google Scholar]
- 11. Ashburner M, Ball CA, Blake JA et al Gene ontology: Tool for the unification of biology. Nat Genet 2000; 25 (1): 25–9. [DOI] [PMC free article] [PubMed] [Google Scholar]
- 12. Kanehisa M, Sato Y, Kawashima M, Furumichi M, Tanabe M. KEGG as a reference resource for gene and protein annotation. Nucleic Acids Res 2015; 44 (D1): D457–62. [DOI] [PMC free article] [PubMed] [Google Scholar]
- 13. Yu G, Wang LG, He QY. clusterProfiler: An R package for comparing biological themes among gene clusters. OMICS 2012; 16 (5): 284–7. [DOI] [PMC free article] [PubMed] [Google Scholar]
- 14. Szklarczyk D, Franceschini A, Kuhn M et al The STRING database in 2011: Functional interaction networks of proteins, globally integrated and scored. Nucleic Acids Res 2010; 39 (Suppl_1): D561–8. [DOI] [PMC free article] [PubMed] [Google Scholar]
- 15. Smoot ME, Ono K, Ruscheinski J, Wang PL, Ideker T. Cytoscape 2.8: New features for data integration and network visualization. Bioinformatics 2010; 27 (3): 431–2. [DOI] [PMC free article] [PubMed] [Google Scholar]
- 16. Chin CH, Chen SH, Wu HH, Ho CW, Ko MT, Lin CY. cytoHubba: identifying hub objects and sub‐networks from complex interactome. BMC Syst Biol 2014; 8 (Suppl. 4): S11. [DOI] [PMC free article] [PubMed] [Google Scholar]
- 17. Bader GD, Hogue CWV. An automated method for finding molecular complexes in large protein interaction networks. BMC Bioinformatics 2003; 4 (1): 2. [DOI] [PMC free article] [PubMed] [Google Scholar]
- 18. Gao J, Aksoy BA, Dogrusoz U et al Integrative analysis of complex cancer genomics and clinical profiles using the cBioPortal. Sci Signal 2013; 6 (269): l1. [DOI] [PMC free article] [PubMed] [Google Scholar]
- 19. Tang Z, Li C, Kang B, Gao G, Li C, Zhang Z. GEPIA: A web server for cancer and normal gene expression profiling and interactive analyses. Nucleic Acids Res 2017; 45 (W1): W98–W102. [DOI] [PMC free article] [PubMed] [Google Scholar]
- 20. Győrffy B, Lánczky A, Szállási Z. Implementing an online tool for genome‐wide validation of survival‐associated biomarkers in ovarian‐cancer using microarray data from 1287 patients. Endocr Relat Cancer 2012; 19 (2): 197–208. [DOI] [PubMed] [Google Scholar]
- 21. Sun C, Yuan Q, Wu D, Meng X, Wang B. Identification of core genes and outcome in gastric cancer using bioinformatics analysis. Oncotarget 2017; 8 (41): 70271. [DOI] [PMC free article] [PubMed] [Google Scholar]
- 22. Carvalhal S, Ribeiro SA, Arocena M et al The nucleoporin ALADIN regulates Aurora A localization to ensure robust mitotic spindle formation. Mol Biol Cell 2015; 26 (19): 3424–38. [DOI] [PMC free article] [PubMed] [Google Scholar]
- 23. Orenay‐Boyacioglu S, Kasap E, Gerceker E et al Expression profiles of histone modification genes in gastric cancer progression. Mol Biol Rep 2018; 45 (6): 2275–82. [DOI] [PubMed] [Google Scholar]
- 24. Carvalho B, Postma C, Mongera S et al Multiple putative oncogenes at the chromosome 20q amplicon contribute to colorectal adenoma to carcinoma progression. Gut 2009; 58 (1): 79–89. [DOI] [PubMed] [Google Scholar]
- 25. Caruso S, Calatayud AL, Pilet J. Analysis of liver cancer cell lines identifies agents with likely efficacy against hepatocellular carcinoma and markers of response. Gastroenterology 2019; 157 (3): 760–76. [DOI] [PubMed] [Google Scholar]
- 26. Lykkesfeldt AE, Iversen BR, Jensen MB et al Aurora kinase A as a possible marker for endocrine resistance in early estrogen receptor positive breast cancer. Acta Oncol 2018; 57 (1): 67–73. [DOI] [PubMed] [Google Scholar]
- 27. Zheng X, Chi J, Zhi J et al Aurora‐A‐mediated phosphorylation of LKB1 compromises LKB1/AMPK signaling axis to facilitate NSCLC growth and migration. Oncogene 2017; 37: 502. [DOI] [PubMed] [Google Scholar]
- 28. Schneider MA, Christopoulos P, Muley T et al AURKA, DLGAP5, TPX2, KIF11 and CKAP5: Five specific mitosis‐associated genes correlate with poor prognosis for non‐small cell lung cancer patients. Int J Oncol 2017; 50 (2): 365–72. [DOI] [PMC free article] [PubMed] [Google Scholar]
- 29. Kato T, Daigo Y, Aragaki M, Ishikawa K, Sato M, Kaji M. Overexpression of KIAA0101 predicts poor prognosis in primary lung cancer patients. Lung Cancer 2012; 75 (1): 110–8. [DOI] [PubMed] [Google Scholar]
- 30. Emanuele MJ, Ciccia A, Elia AEH, Elledge SJ. Proliferating cell nuclear antigen (PCNA)‐associated KIAA0101/PAF15 protein is a cell cycle‐regulated anaphase‐promoting complex/cyclosome substrate. Proc Natl Acad Sci U S A 2011; 108 (24): 9845–50. [DOI] [PMC free article] [PubMed] [Google Scholar]
- 31. Kais Z, Barsky SH, Mathsyaraja H et al KIAA0101 interacts with BRCA1 and regulates centrosome number. Mol Cancer Res 2011; 9 (8): 1091–9. [DOI] [PMC free article] [PubMed] [Google Scholar]
- 32. Povlsen LK, Beli P, Wagner SA et al Systems‐wide analysis of ubiquitylation dynamics reveals a key role for PAF15 ubiquitylation in DNA‐damage bypass. Nat Cell Biol 2012; 14: 1089–98. [DOI] [PubMed] [Google Scholar]
- 33. Lv W, Su B, Li Y, Geng C, Chen N. KIAA0101 inhibition suppresses cell proliferation and cell cycle progression by promoting the interaction between p53 and Sp1 in breast cancer. Biochem Biophys Res Commun 2018; 503 (2): 600–6. [DOI] [PubMed] [Google Scholar]
- 34. Zhu K, Diao D, Dang C et al Elevated KIAA0101 expression is a marker of recurrence in human gastric cancer. Cancer Sci 2013; 104 (3): 353–9. [DOI] [PMC free article] [PubMed] [Google Scholar]
- 35. Shaw GL, Whitaker H, Corcoran M et al The early effects of rapid androgen deprivation on human prostate cancer. Eur Urol 2016; 70 (2): 214–8. [DOI] [PMC free article] [PubMed] [Google Scholar]
- 36. Yuan RH, Jeng YM, Pan HW et al Overexpression of KIAA0101 predicts high stage, early tumor recurrence, and poor prognosis of hepatocellular carcinoma. Clin Cancer Res 2007; 13 (18): 5368–76. [DOI] [PubMed] [Google Scholar]
- 37. Wäsch R, Engelbert D. Anaphase‐promoting complex‐dependent proteolysis of cell cycle regulators and genomic instability of cancer cells. Oncogene 2005; 24 (1): 1–10. [DOI] [PubMed] [Google Scholar]
- 38. Bharadwaj R, Yu H. The spindle checkpoint, aneuploidy, and cancer. Oncogene 2004; 23 (11): 2016–27. [DOI] [PubMed] [Google Scholar]
- 39. Ki JM, Sohn HY, Yoon SY et al Identification of gastric cancer–related genes using a cDNA microarray containing novel expressed sequence tags expressed in gastric cancer cells. Clin Cancer Res 2005; 11 (2): 473. [PubMed] [Google Scholar]
- 40. Karra H, Repo H, Ahonen I et al Cdc20 and securin overexpression predict short‐term breast cancer survival. Br J Cancer 2014; 110 (12): 2905–13. [DOI] [PMC free article] [PubMed] [Google Scholar]
- 41. Zhang Q, Huang H, Liu A et al Cell division cycle 20 (CDC20) drives prostate cancer progression via stabilization of β‐catenin in cancer stem‐like cells. EBioMedicine 2019; 42: 397–407. [DOI] [PMC free article] [PubMed] [Google Scholar]
- 42. Wu WJ, Hu KS, Wang DS et al CDC20 overexpression predicts a poor prognosis for patients with colorectal cancer. J Transl Med 2013; 11: 142–2. [DOI] [PMC free article] [PubMed] [Google Scholar]
- 43. Singhal S, Amin KM, Kruklitis R et al Alterations in cell cycle genes in early stage lung adenocarcinoma identified by expression profiling. Cancer Biol Ther 2003; 2 (3): 291–8. [DOI] [PubMed] [Google Scholar]
- 44. Kato T, Daigo Y, Aragaki M, Ishikawa K, Sato M, Kaji M. Overexpression of CDC20 predicts poor prognosis in primary non‐small cell lung cancer patients. J Surg Oncol 2012; 106 (4): 423–30. [DOI] [PubMed] [Google Scholar]
- 45. Du Y, Zhang H, Jiang Z, Huang G, Lu W, Wang H. Expression of L1 protein correlates with cluster of differentiation 24 and integrin β1 expression in gastrointestinal stromal tumors. Oncol Lett 2015; 9 (6): 2595–602. [DOI] [PMC free article] [PubMed] [Google Scholar]
- 46. Dowsett M, Nielsen TO, A'Hern R et al Assessment of Ki67 in breast cancer: Recommendations from the International Ki67 in Breast Cancer working group. J Natl Cancer Inst 2011; 103 (22): 1656–64. [DOI] [PMC free article] [PubMed] [Google Scholar]
- 47. Cuylen S, Blaukopf C, Politi AZ et al Ki‐67 acts as a biological surfactant to disperse mitotic chromosomes. Nature 2016; 535: 308–12. [DOI] [PMC free article] [PubMed] [Google Scholar]
- 48. Miele A, Medina R, van Wijnen AJ, Stein GS, Stein JL. The interactome of the histone gene regulatory factor HiNF‐P suggests novel cell cycle related roles in transcriptional control and RNA processing. J Cell Biochem 2007; 102 (1): 136–48. [DOI] [PubMed] [Google Scholar]
- 49. Kim SH, Park WS, Park BR et al PSCA, Cox‐2, and Ki‐67 are independent, predictive markers of biochemical recurrence in clinically localized prostate cancer: A retrospective study. Asian J Androl 2017; 19 (4): 458–62. [DOI] [PMC free article] [PubMed] [Google Scholar]
- 50. Penault‐Llorca F, Radosevic‐Robin N. Ki67 assessment in breast cancer: An update. Pathology 2017; 49 (2): 166–71. [DOI] [PubMed] [Google Scholar]
- 51. Abdel‐Aziz A, Ahmed RA, Ibrahiem AT. Expression of pRb, Ki67 and HER 2/neu in gastric carcinomas: Relation to different histopathological grades and stages. Ann Diagn Pathol 2017; 30: 1–7. [DOI] [PubMed] [Google Scholar]
- 52. He QY, Jin F, Li YY et al Prognostic significance of downregulated BMAL1 and upregulated Ki‐67 proteins in nasopharyngeal carcinoma. Chronobiol Int 2018; 35 (3): 348–57. [DOI] [PubMed] [Google Scholar]
- 53. He LY, Zhang H, Wang ZK, Zhang HZ. Diagnostic and prognostic significance of E‐cadherin and Ki‐67 expression in non‐small cell lung cancer patients. Eur Rev Med Pharmacol Sci 2016; 20 (18): 3812–7. [PubMed] [Google Scholar]
- 54. Cole KA, Huggins J, Laquaglia M et al RNAi screen of the protein kinome identifies checkpoint kinase 1 (CHK1) as a therapeutic target in neuroblastoma. Proc Natl Acad Sci U S A 2011; 108 (8): 3336–41. [DOI] [PMC free article] [PubMed] [Google Scholar]
- 55. Ebili HO, Iyawe VO, Adeleke KR et al Checkpoint kinase 1 expression predicts poor prognosis in Nigerian breast cancer patients. Mol Diagn Ther 2018; 22 (1): 79–90. [DOI] [PubMed] [Google Scholar]
- 56. Alcaraz‐Sanabria A, Nieto‐Jiménez C, Corrales‐Sánchez V et al Synthetic lethality interaction between aurora kinases and CHEK1 inhibitors in ovarian cancer. Mol Cancer Ther 2017; 16 (11): 2552–62. [DOI] [PubMed] [Google Scholar]
- 57. Gali‐Muhtasib H, Kuester D, Mawrin C et al Thymoquinone triggers inactivation of the stress response pathway sensor CHEK1 and contributes to apoptosis in colorectal cancer cells. Cancer Res 2008; 68 (14): 5609–18. [DOI] [PubMed] [Google Scholar]
- 58. Liu B, Qu J, Xu F et al MiR‐195 suppresses non‐small cell lung cancer by targeting CHEK1. Oncotarget 2015; 6 (11): 9445–56. [DOI] [PMC free article] [PubMed] [Google Scholar]
- 59. Perpelescu M, Hori T, Toyoda A et al HJURP is involved in the expansion of centromeric chromatin. Mol Biol Cell 2015; 26 (15): 2742–54. [DOI] [PMC free article] [PubMed] [Google Scholar]
- 60. Müller S, Montes de Oca R, Lacoste N, Dingli F, Loew D, Almouzni G. Phosphorylation and DNA binding of HJURP determine its centromeric recruitment and function in CenH3(CENP‐A) loading. Cell Rep 2014; 8 (1): 190–203. [DOI] [PubMed] [Google Scholar]
- 61. Dunleavy EM, Roche D, Tagami H et al HJURP is a cell‐cycle‐dependent maintenance and deposition factor of CENP‐A at centromeres. Cell 2009; 137 (3): 485–97. [DOI] [PubMed] [Google Scholar]
- 62. Huang W, Zhang H, Hao Y et al A non‐synonymous single nucleotide polymorphism in the HJURP gene associated with susceptibility to hepatocellular carcinoma among Chinese. PLOS One 2016; 11 (2): e0148618. [DOI] [PMC free article] [PubMed] [Google Scholar]
- 63. Montes de Oc R, Gurard‐Levin ZA, Berger F et al The histone chaperone HJURP is a new independent prognostic marker for luminal A breast carcinoma. Mol Oncol 2015; 9 (3): 657–74. [DOI] [PMC free article] [PubMed] [Google Scholar]
- 64. Valente V, Serafim RB, de Oliveira LC et al Modulation of HJURP (Holliday junction‐recognizing protein) levels is correlated with glioblastoma cells survival. PLOS One 2013; 8 (4): e62200. [DOI] [PMC free article] [PubMed] [Google Scholar]
- 65. Zhou D, Tang W, Liu X, An HX, Zhang Y. Clinical verification of plasma messenger RNA as novel noninvasive biomarker identified through bioinformatics analysis for lung cancer. Oncotarget 2017; 8 (27): 43978–89. [DOI] [PMC free article] [PubMed] [Google Scholar]
- 66. Wei Y, Ouyang GL, Yao WX et al Knockdown of HJURP inhibits non‐small cell lung cancer cell proliferation, migration, and invasion by repressing Wnt/β‐catenin signaling. Eur Rev Med Pharmacol Sci 2019; 23 (9): 3847–56. [DOI] [PubMed] [Google Scholar]
- 67. Fujita Y, Hayashi T, Kiyomitsu T et al Priming of centromere for CENP‐A recruitment by human hMis18α, hMis18β, and M18BP1. Dev Cell 2007; 12 (1): 17–30. [DOI] [PubMed] [Google Scholar]
- 68. He X, Hou J, Ping J, Wen D, He J. Opa interacting protein 5 acts as an oncogene in bladder cancer. J Cancer Res Clin Oncol 2017; 143 (11): 2221–33. [DOI] [PMC free article] [PubMed] [Google Scholar]
- 69. Chun HK, Chung KS, Kim HC et al OIP5 is a highly expressed potential therapeutic target for colorectal and gastric cancers. BMB Rep 2010; 43 (5): 349–54. [DOI] [PubMed] [Google Scholar]
- 70. Li HC, Chen YF, Feng W et al Loss of the Opa interacting protein 5 inhibits breast cancer proliferation through miR‐139‐5p/NOTCH1 pathway. Gene 2017; 603: 1–8. [DOI] [PubMed] [Google Scholar]
- 71. Li H, Zhang J, Lee MJ, Yu GR, Han X, Kim DG. OIP5, a target of miR‐15b‐5p, regulates hepatocellular carcinoma growth and metastasis through the AKT/mTORC1 and β‐catenin signaling pathways. Oncotarget 2017; 8 (11): 18129–44. [DOI] [PMC free article] [PubMed] [Google Scholar]
- 72. Koinuma J, Akiyama H, Fujita M et al Characterization of an Opa interacting protein 5 involved in lung and esophageal carcinogenesis. Cancer Sci 2012; 103 (3): 577–86. [DOI] [PMC free article] [PubMed] [Google Scholar]