Abstract
Preclinical imaging, especially of rodent models, plays a major role in experimental ophthalmology. Our aim was to determine if ultrasound can be used to visualize and measure flow dynamics in the retrobulbar vessels supplying and draining the eye and the potential of contrast microbubbles to provide image and measurement enhancement. To accomplish this, we used a 128-element, 18 MHz linear array ultrasound probe and performed plane-wave imaging of the eyes of Sprague Dawley rats. Compound images were acquired by emitting unfocused wavefronts at multiple angles and combining echo data from all angles to form individual B-scans. Multiple imaging sequences were utilized, compounding up to six angles, with imaging rate of up to 3,000 compound B-scans per second and sequence durations from 1.5 to 180 seconds. Data were acquired before and after intravenous introduction of contrast microbubbles. We found the total power of the Doppler signal in the image plane to increase approximately 20 fold after injection of contrast, followed by an exponential decay to baseline in about 90 seconds, The best-fit time constant of the decay averaged 41 sec. While major vessels and the retinal/choroidal complex were evident pre-contrast, they were dramatically enhanced with contrast present, with details such as choroidal arterioles seen only with contrast. Ocular arteriovenous transit time determined from comparative enhancement curves in arteries and veins was approximately 0.2 sec. In conclusion, plane wave ultrasound, especially with enhancement by contrast microbubbles, offers a means for the study of ocular hemodynamics using the rat eye as a model.
Keywords: Ultrasound, contrast agent, plane-wave, microbubble, ocular blood flow, rat eye
1.0. Introduction
Hemodynamics plays a crucial role in many ocular diseases, including diabetes, age-related macular degeneration and glaucoma. Experimental studies involving human subjects, however, are necessarily limited. Animal models of human eye disease provide an opportunity for such experimental studies, albeit to the extent that the animal model is a fair representation of the disease entity as it manifests in humans. Choosing an animal model must take into account several factors, including how well the model anatomically and physiologically matches the human eye, cost, ethical issues (especially with primates) and the size of the eye. Rodents have been widely used as ophthalmic animal models because of their low cost and easy upkeep, allowing large numbers of experimental animals per study. In this report, we demonstrate ultrasound methods for visualizing and measuring blood flow in the retrobulbar vessels supplying the rat eye.
While mice are the dominant experimental rodent model in ophthalmology, in the context of ultrasound imaging, the rat is preferred to the mouse, because of its larger eye (about 7 mm axial length), about twice that of the mouse eye. At a frequency of 18 MHz used in our studies, wavelength is approximately 85 μm, which is modest with respect to OCT resolution (<10μm). Ultrasound, however, is advantageous in allowing imaging of tissues that are optically opaque or highly scattering, such as the retrobulbar space. Thus, ultrasound offers a means for studying ocular hemodynamics using the rat model, which has been widely used for study of diabetic retinopathy induced by intravenous injection of streptozotocin (Rakietin, et al. 1963), in glaucoma where ischemic optic neuropathy can be induced by laser coagulation of vessels as they emerge from the optic nerve head (Mosinger and Olney, 1989; Bernstein, et al. 2003; Danylkova et al., 2006) or outflow impeded by retrograde injection of hypertonic saline into the episcleral veins (Morrison, et al., 2018). Although rats, like mice, do not have a macula, they have been used to model certain aspects of age-related macular degeneration, particularly using the OXYS rat model, which exhibits early senescence. (Stevanova et al., 2014; Markovetset al., 2011)
Most of the rat eye’s blood supply comes from the ophthalmic artery, which lies in the inferonasal quadrant of the optic nerve sheath as it enters the globe. Soon after the ophthalmic artery enters the sclera, it branches off the central retinal and ciliary arteries. There are usually six symmetrically arranged retinal arteries radiating to the equator. The choroid, which from ultrahigh resolution OCT appears to be ~50 μm thick in the rat in vivo (Hariri, et al., 2013), is supplied by 2–4 ‘short branches’ (Sugiyama et al., 1999) or short ciliary arteries (Janes and Bounds, 1955) from the two long posterior ciliary arteries which lie on the temporal and nasal sides of the eye.
Venous drainage from the choroid is complex. The central retinal vein originates from the confluence of the major retinal veins at the optic nerve head and travels posteriorly with the central retinal artery. The larger choroidal venules unite to form four vortex veins (located on the dorsal, ventral, nasal and temporal sides) which pierce the sclera just posterior to the equator (Janes and Bounds, 1955; Morrison et al., 1999). The central retinal and long posterior ciliary arteries of the of the rat eye were reported to be ~125 μm in diameter and the vortex vein to be ~300 μm in diameter by scanning electron microscopy of corrosion casts (Bhutto and Amemiya, 2001).
While single-element, mechanically scanned transducers are the dominant technology for clinical ophthalmic ultrasound, including ultrasound biomicroscopy, linear arrays have almost entirely displaced this technology in other clinical specialties. Linear arrays, unlike single-element probes, are suitable for color-flow Doppler imaging of blood flow. A recent advance is the development of ultrafast plane-wave methods (Tanter and Fink, 2014), which allow color-flow depiction of the entire B-scan at significantly lower acoustic intensity than is the case with conventionally scanned linear arrays (Urs et al., 2016).
Ultrasound visualization of flow, normally based on backscatter from moving erythrocytes, is somewhat limited, especially in smaller vessels, due to the modest difference in reflectivity of blood cells versus the vascular lumen and parenchymal tissues. Introduction of acoustic contrast agents, typically encapsulated microbubbles, offers a means to significantly enhance depiction of the vasculature.
This report will describe imaging of retinal/choroidal and retrobulbar flow in the rat eye using plane-wave ultrasound methods alone and with contrast-enhanced ultrasound.
2.0. Materials and Methods
2.1. Instrumentation:
We acquired all data with a Vantage 128 (Verasonics, Inc., Kirkland, WA) ultrasound engine, which is a programmable ultrasound research platform. We used a Verasonics L22–14vX linear array transducer, which has 128 elements in a 12.8 mm aperture, a nominal center frequency of 18 MHz and elevation focal length of 6 mm. We developed MATLAB (The MathWorks, Inc., Natick, MA) programs to emit plane-waves at multiple angles and to beamform echo data to produce compound images. Phase-resolved echo data received by the linear-array transducer elements were quadrature sampled at 62.5 MHz at 14-bits per sample.
Calibration:
Acoustic output at 10 and 15 volts excitation was measured at incremental 1-mm depth intervals centered on the elevation focus using a calibrated needle hydrophone (Precision Acoustics, Inc., Dorset, UK) with a 40-μm diameter sensor.
2.2. Contrast agent:
USphere Prime contrast agent (Trust Bio-sonics, Taiwan, ROC) was used. USphere Prime consists of perfluorcarbon gas-filled, phospholipid-shelled microbubbles averaging approximately 1 μm in diameter. The high acoustic impedance difference of the gas with respect to solid tissues or blood-cells makes the microbubbles highly echoic, and their small diameter makes this formulation especially effective with higher frequency transducers such as the 18 MHz probe used in this study. In all experiments, we injected a 0.1 ml bolus of 1:50 normal-saline diluted contrast agent into the tail vein.
2.3. Experimental Setup:
Experimental procedures were performed in adherence to the ARVO Statement for the Use of Animals in Ophthalmic and Vision Research and under a protocol approved by the Columbia’s Institutional Animal Care and Use Committee.
Imaging was performed on 10 Sprague-Dawley rats (6M, 4F) weighing approximately 400g. Anesthesia was induced by intraperitoneal injection of ketamine (75 mg/kg) plus xylazine (5 mg/kg). A 26-guage cannula was established in the tail vein for introduction of contrast.
For scanning, the rat was positioned with one eye facing upwards. We used an adhesive drape (Steri-drape #1021, 3M Health Care, St. Paul, MN) with a central aperture to form a water-tight seal with the periocular skin surface. With the drape supported by a ringstand, warmed sterile normal saline solution was introduced into the drape to a depth of about 1 cm. The ultrasound probe, held by a clamp, was then lowered into the fluid to establish acoustic coupling between the probe and the eye. The scan plane was oriented horizontally, i.e., from lateral to medial canthi. Probe position could then be interactively adjusted in 3 axes using manual precision linear stages and the probe angle adjusted to obtain the best quality color-flow image.
B-mode images with color-flow Doppler superimposed were then displayed in real-time to facilitate interactive positioning of the scan plane in the region of the optic nerve head. The probe was positioned so that the region of the optic nerve head was centered and in the elevation focal zone. The orientation of the scanned region with respect to the rat eye anatomy is illustrated schematically in Fig 1.
Figure 1.
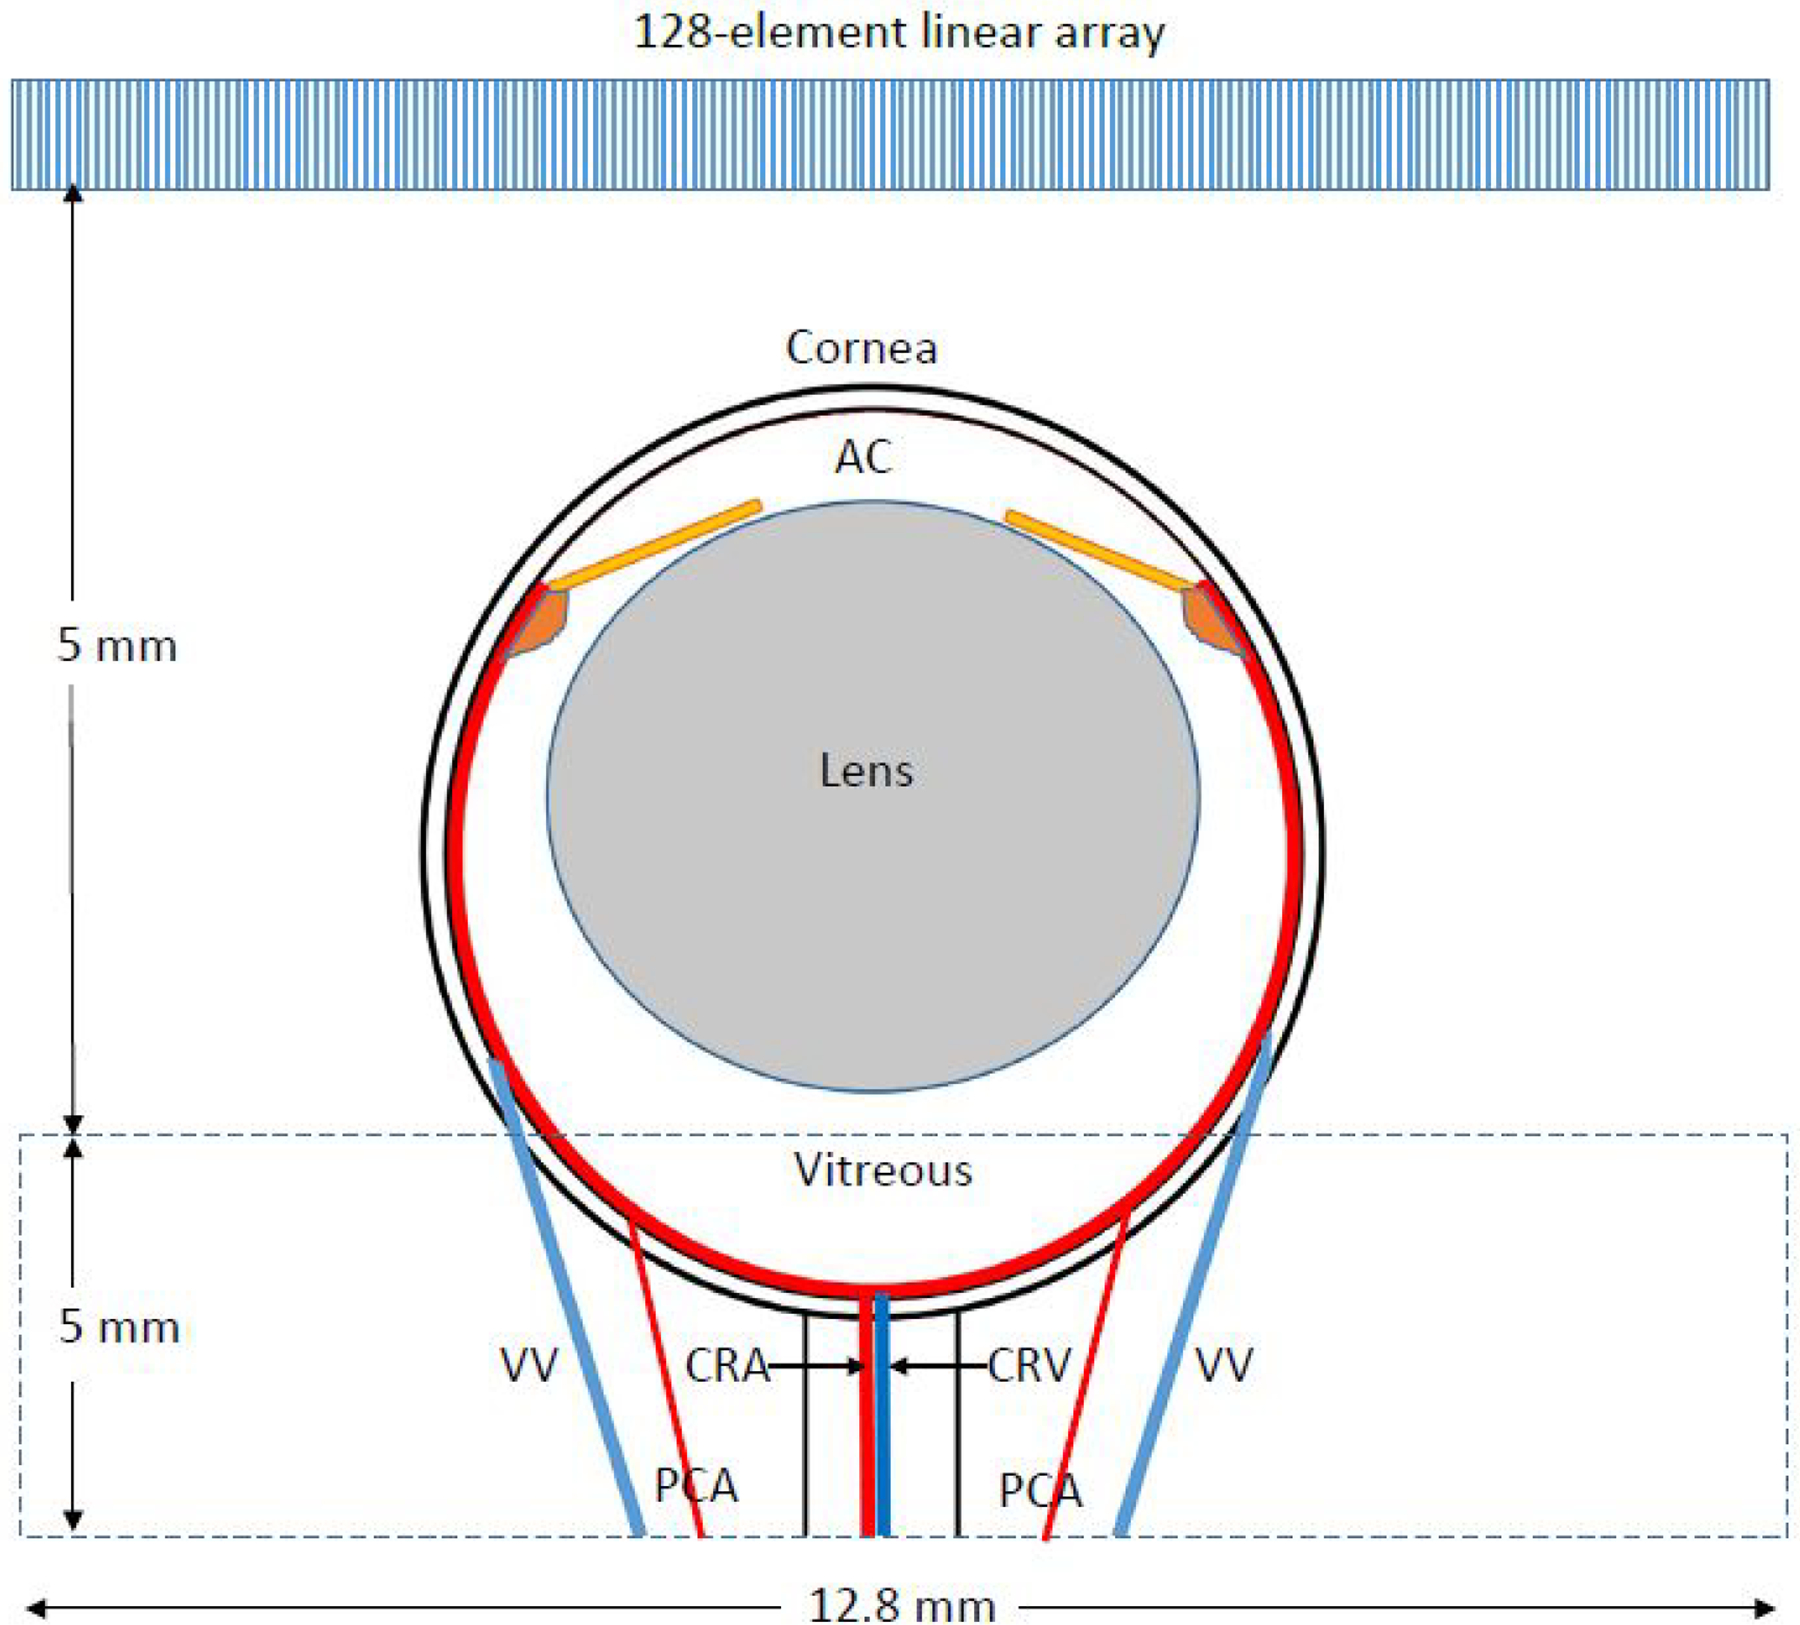
The scan plane was approximately axisymmetric with the eye as depicted in the drawing. The scanned region was in the array’s elevation focal zone, 12.8 mm in width (the lateral dimension of the array) and typically 5 mm in axial dimension. AC=anterior chamber, CRA= central retinal artery, CRV=central retinal vein, VV=vortex vein, PCA=long posterior ciliary artery.
2.4. Data acquisition Setup:
We used three different modes: a fast mode for measurement of flow velocities, a slow mode for measurement of contrast enhancement and falloff, and an intermediate mode for measurement of arteriovenous transit time.
2.4.1. Fast mode:
To image blood-flow and measure flow velocities, sets of 6 plane-waves were transmitted at equal angular increments over ±6° at a rate of 34 kHz, the fastest possible rate given the two-way acoustic transit time (Podkowa et al., 2018). Sets were transmitted at 0.33-msec intervals (3 kHz) for 1.5 seconds and echo data stored for post-processing. At this acquisition rate, velocities of up to 64 mm/sec could be determined without aliasing. Fast-mode data were acquired immediately before contrast was injected, as contrast became evident on the real-time scan display, and at 45 second intervals for 3 minutes thereafter. Scans performed with contrast agent present used a 10V excitation voltage, which reduces microbubble destruction compared to the higher voltage used pre-contrast.
2.4.2. Intermediate mode:
To characterize ocular blood-flow transit time from introduction of contrast into the tail vein and arteriovenous ocular transit time we compounded just two angles (±6°) and acquired 500 compound images/sec for 30 seconds beginning simultaneously with contrast injection. At this rate, aliasing would occur for velocities above 10.7 mm/sec, and hence this mode was not used for velocity determinations.
2.4.3. Slow-mode:
To characterize the time-course of enhancement and falloff following introduction of contrast, we acquired data continuously at 50 Hz for 3 minutes. Although this slow acquisition rate precluded measurement of flow velocities due to aliasing, it allowed generation of power Doppler images and assessment of vascular echogenicity continuously over this time period.
2.5. Data processing:
2.5.1. Digital filtering:
The first stage of processing consisted of beamforming and coherent addition of each batch of angled plane-waves to form one compound image. The data were subsequently processed using a singular value decomposition (SVD) filter (Demene et al., 2015) followed by a 10-Hz high-pass filter. The SVD filter exploits the different spatial coherence characteristics of bulk tissue motion caused by movement of the eye or the hand-held probe versus blood flow, even when their velocities are comparable. The 10-Hz high-pass filter sets a threshold of ~0.5 mm/sec for minimum detectable velocity and acts to improve distinction of flow from noise.
2.5.2. Image time series:
A 64-msec long spatiotemporal sliding-window was used to produce a time-series of images from each scan set, demonstrating flow variation over the period of data acquisition. Power-Doppler images were then produced by summing the intensities from the blood-flow signal.
2.5.3. Spectrogram processing:
In fast-mode data, spectrograms representing flow velocity as a function of time were generated from user-selected regions of interest. After application of phase unwrapping to the spectrogram to compensate for potential aliasing, the envelope of the spectrogram was automatically detected (Kathpalia, et al., 2015). The peak systolic velocity (PSV), end diastolic velocity (EDV) and average velocity (VMEAN) in two successive cardiac cycles were measured and the resistive index (RI) calculated as RI = (PSV-EDV)/PSV.
2.5.4. Contrast curve analysis:
To determine the overall contrast rise and decay curves from slow-mode data, we calculated the mean power Doppler signal from the image as a whole over time.
To determine transit times from intermediate-mode data, we analyzed a 30-second long sequence of SVD-filtered data beginning with contrast bolus injection. This captured the initial rise in backscatter as contrast enters the ocular vasculature and the beginning of the subsequent decline.
2.5.5. Transit time determination:
Based on indicator dilution theory (Axel, 1980; Mischi, et al., 2014), the peak time (tp) of the contrast signal for an area of interest may be estimated from the first moment of the time-intensity curve,
| (1) |
where t represents time and I(t) represents mean power Doppler intensity in a demarcated area-of-interest at each time-point. For transit time from the tail vein to the eye, t1 represents injection time (t=0) and t2 represents the cutoff time before contrast recirculation is expected. Given the roughly 5 sec interval between injection and peak contrast, we treated t2 to be 10 sec post-injection. For arteriovenous transit time, t1 and t2 are derived from a prominent artery and vein visualized simultaneously in the image sequence.
3.0. Results
3.1. Calibration:
At the elevation focus, the 12-dB beamwidth was determined to be 0.7 mm. At 10 volts excitation, peak negative pressure (Pr) was 1.00 MPa and mechanical index (MI) was 0.18. At 15 volts, Pr was 1.58 MPa and MI was 0.30.
3.2. Imaging:
Figure 2 demonstrates a grey-scale B-scan and a directionally coded power Doppler image from fast-mode data before injection of contrast. Note that the B-scan and Doppler images are derived from the same data. The Doppler image depicts the central retinal and a vortex vein as well as retinal/choroidal flow and possibly a long posterior ciliary artery. Figure 3 depicts the same eye immediately following injection of contrast and 45 seconds later.
Figure 2.
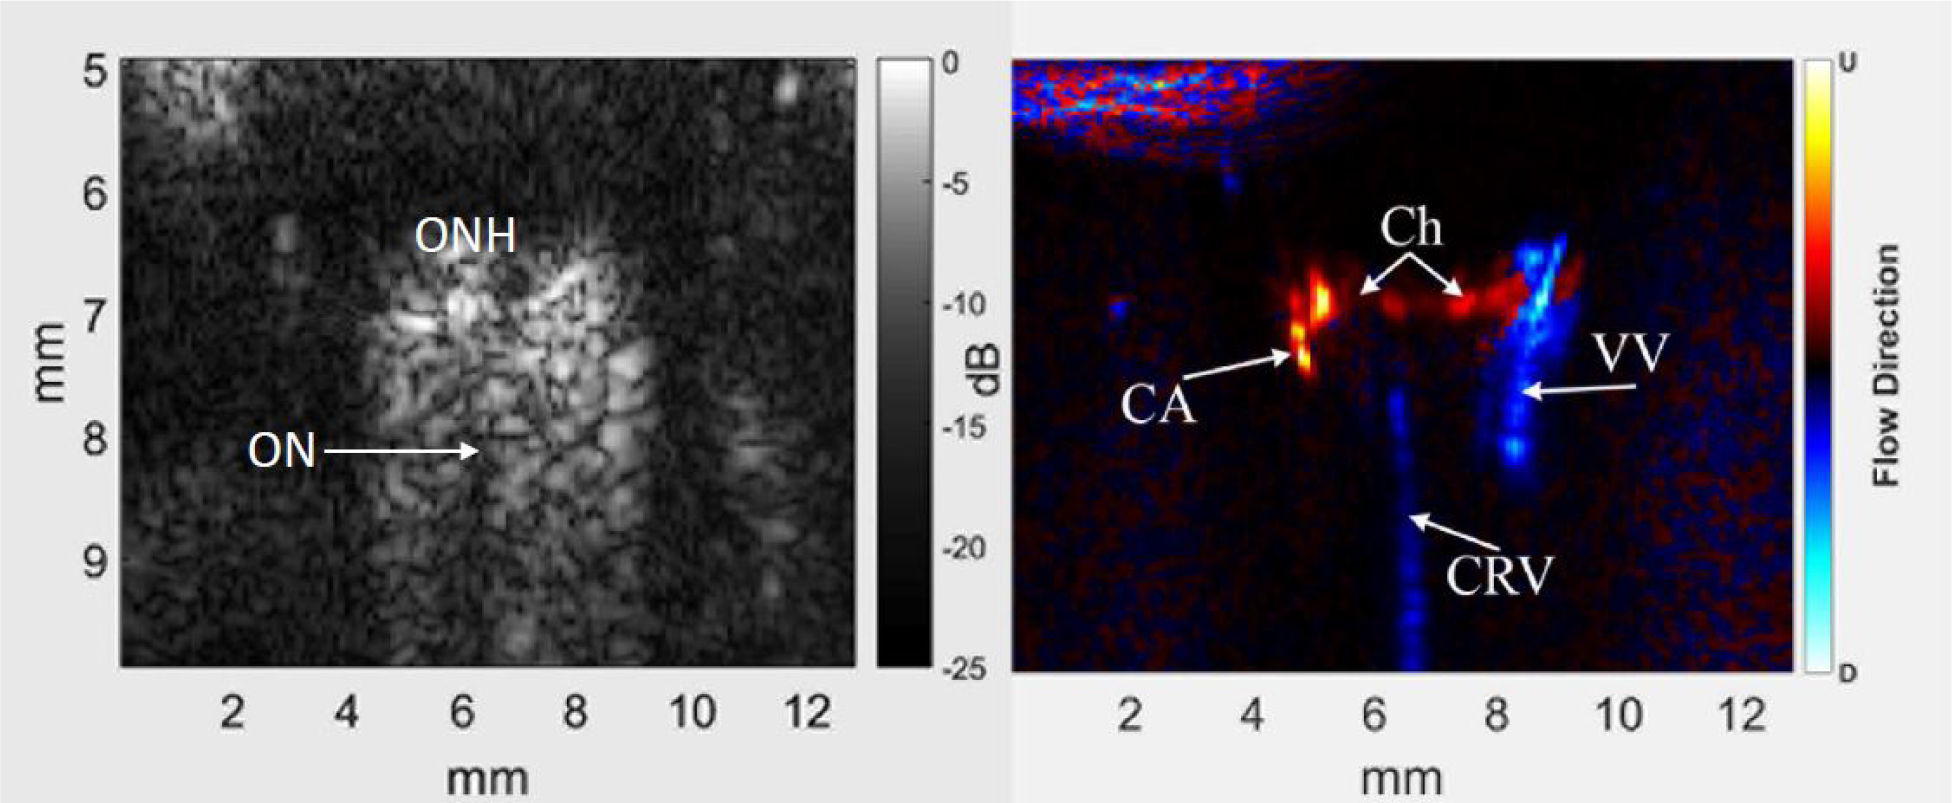
Representative B-scan (left) and power Doppler image (right) of the posterior pole and retrobulbar region of a rat eye before injection of contrast. The optic nerve (ON) appears as a non-reflective region extending posteriorly from the optic nerve head (ONH) into the orbital tissue. Colors in the power Doppler image depict flow direction: red towards the probe and blue away, usually indicative of arterial and venous flow, respectively. In the power Doppler image, the central retinal vein (CRV) and a vortex vein (VV) are evident, as is choroidal flow (Ch) and a long posterior ciliary artery (CA). Note that images are ‘stretched’ axially.
Figure 3.
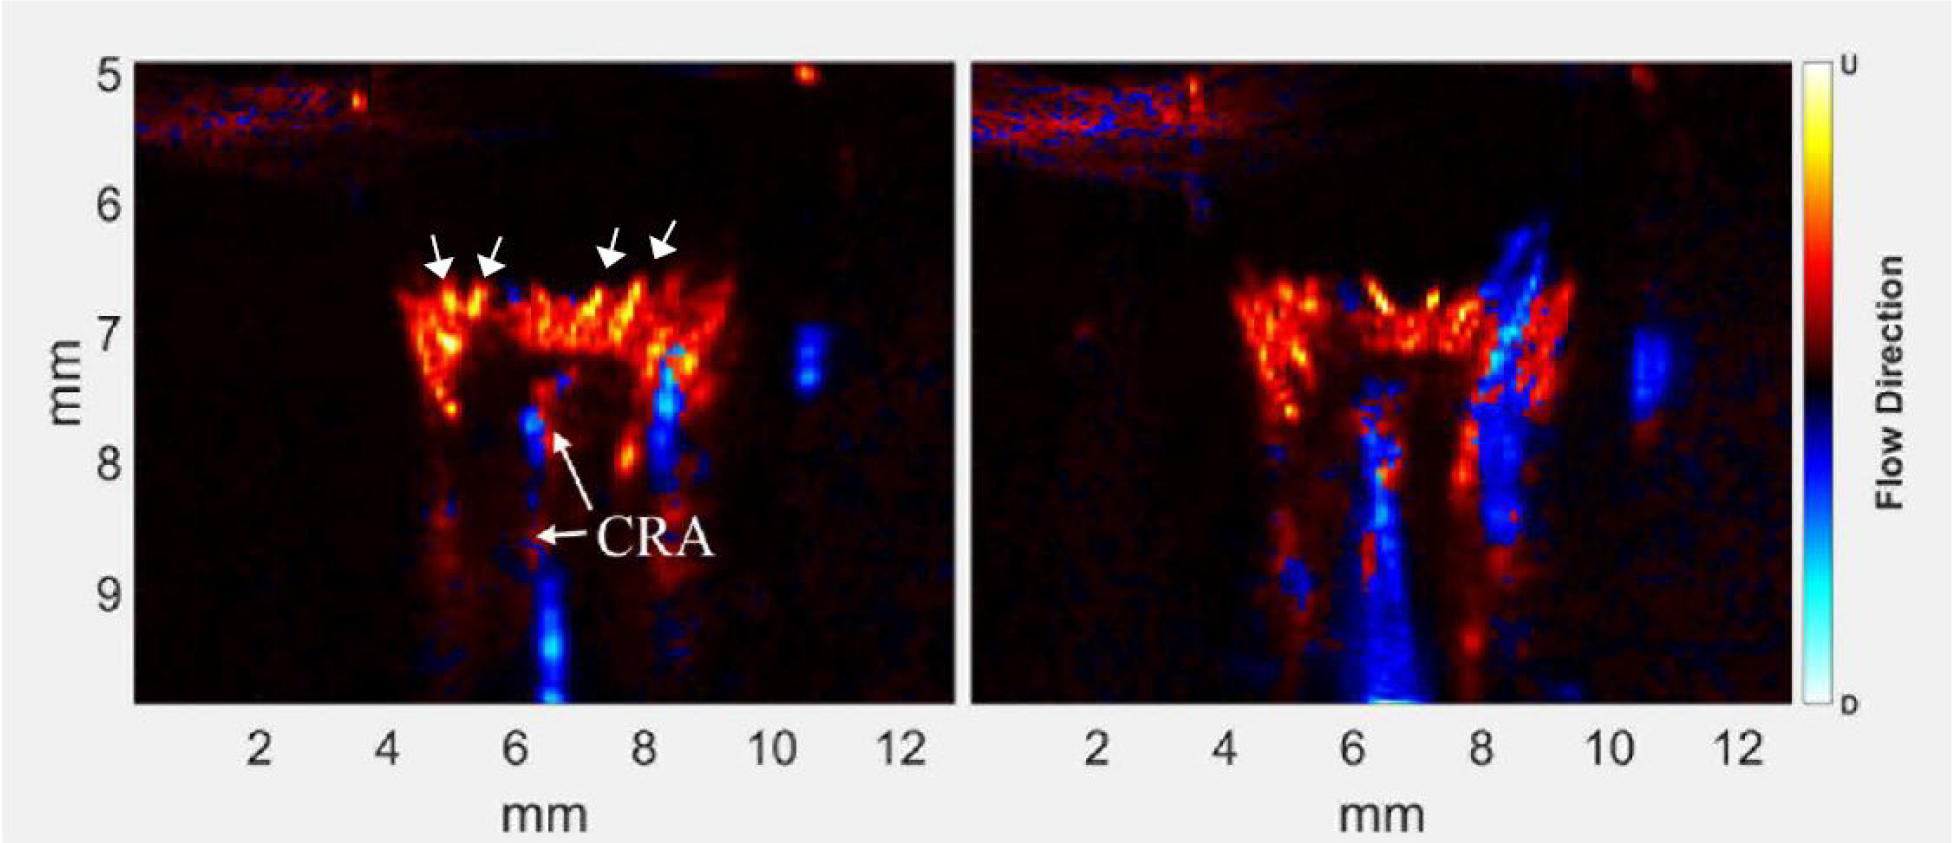
Power Doppler images of the same eye shown in Fig 2 at peak Doppler signal (left) and 45 seconds after peak. With contrast, the central retinal artery (CRA), intertwined with the CRV, is more evident and the retinal/choroidal complex is much brighter, with numerous individual arterioles (small arrows) and ciliary arteries evident. 45 seconds later, the retinal/choroidal complex is still very bright, and there is a noticeable increase in the relative brightness of the central and vortex veins with respect to arterial flow.
Immediately following contrast injection, the retinal/choroidal complex became far more evident, with individual vessels identified as choroidal arterioles visualized. A posterior ciliary artery also became evident. 45 seconds later, the veins appear more prominent, consistent with immediate arterial inflow of contrast with subsequent venous wash-out and perhaps perfusion of contrast into smaller vessels.
3.3. Flow velocities:
Over 18 pre-contrast fast-mode scans, arterial peak systolic velocity (Vs) averaged 45.2 ±14.3 mm/sec and end-diastolic velocity (Vd) averaged 25.3 ±10.6 mm/sec. Venous Vs and Vd averaged 15.0±7.8 mm/sec and 12.0±4.9 mm/sec, respectively. Pulse rate averaged 269±35 beats/minute (BPM).
3.4. Enhancement time-course and velocities:
A video depicting power Doppler as contrast enters the eye is provided.  Figure 4 shows comparative spectrograms of arterial flow pre-contrast, at peak signal following contrast injection, and 90 seconds later. In this representative case, pre-contrast, the spectrogram showed a Vs of 45 mm/sec, Vd of 18 mm/sec and a pulse rate of 231 BPM. The spectrogram at peak contrast is quite noisy, due to the irregular mixing of the contrast bolus with blood. 45 seconds later, the spectrogram was well-defined, with Vs of 39 mm/sec, Vd of 25 mm/sec and pulse rate of 272 BPM. At 90 sec, Vs was 34 mm/sec, Vd was 24 mm/sec and pulse rate of 250 BPM.
Figure 4.
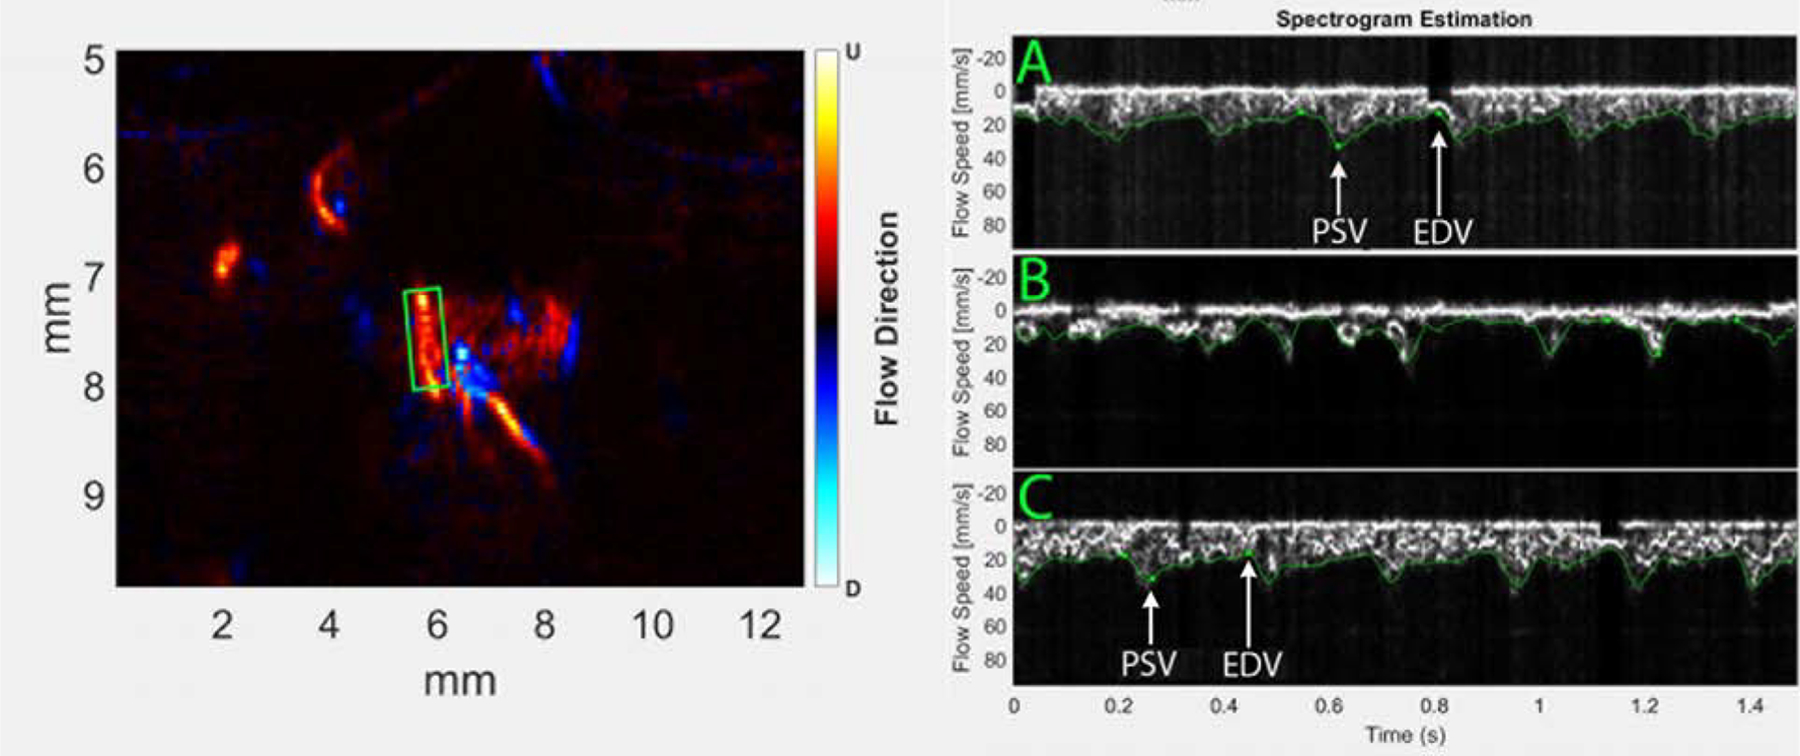
Spectrograms of a long posterior ciliary artery obtained pre-contrast (A), at peak contrast immediately after contrast entered the eye (B) and 90 seconds later (C). Positions used for measurement of peak systolic (PSV) and end diastolic (EDV) velocities are indicated in the pre- and 90-second post-contrast spectrograms. Immediately upon contrast entering the eye, however, the spectrogram is too irregular to evaluate quantitatively.
The microbubble population in the blood-stream declines upon passing through capillary beds, with the inert gas becoming cleared from the bloodstream via the lungs and the degraded encasing shell material engulfed by macrophages in the reticuloendothelial system in the liver and spleen (Baun, 2017). Figure 5 is a representative plot of the total power Doppler signal from slow-mode data over 3 minutes. Upon entering the eye, the Doppler signal, integrated over the entire imaged area, rapidly increased by a factor of about 20 with respect to the pre-contrast signal. Thereafter, the signal declined, returning to baseline about 90 seconds later. The decrease is approximately exponential, with best fit to the decay from peak to baseline having time- constants (i.e., decay to 1/e or ~63% of peak) of 38 sec and 44 sec (mean=41 sec) in two trials.
Figure 5.
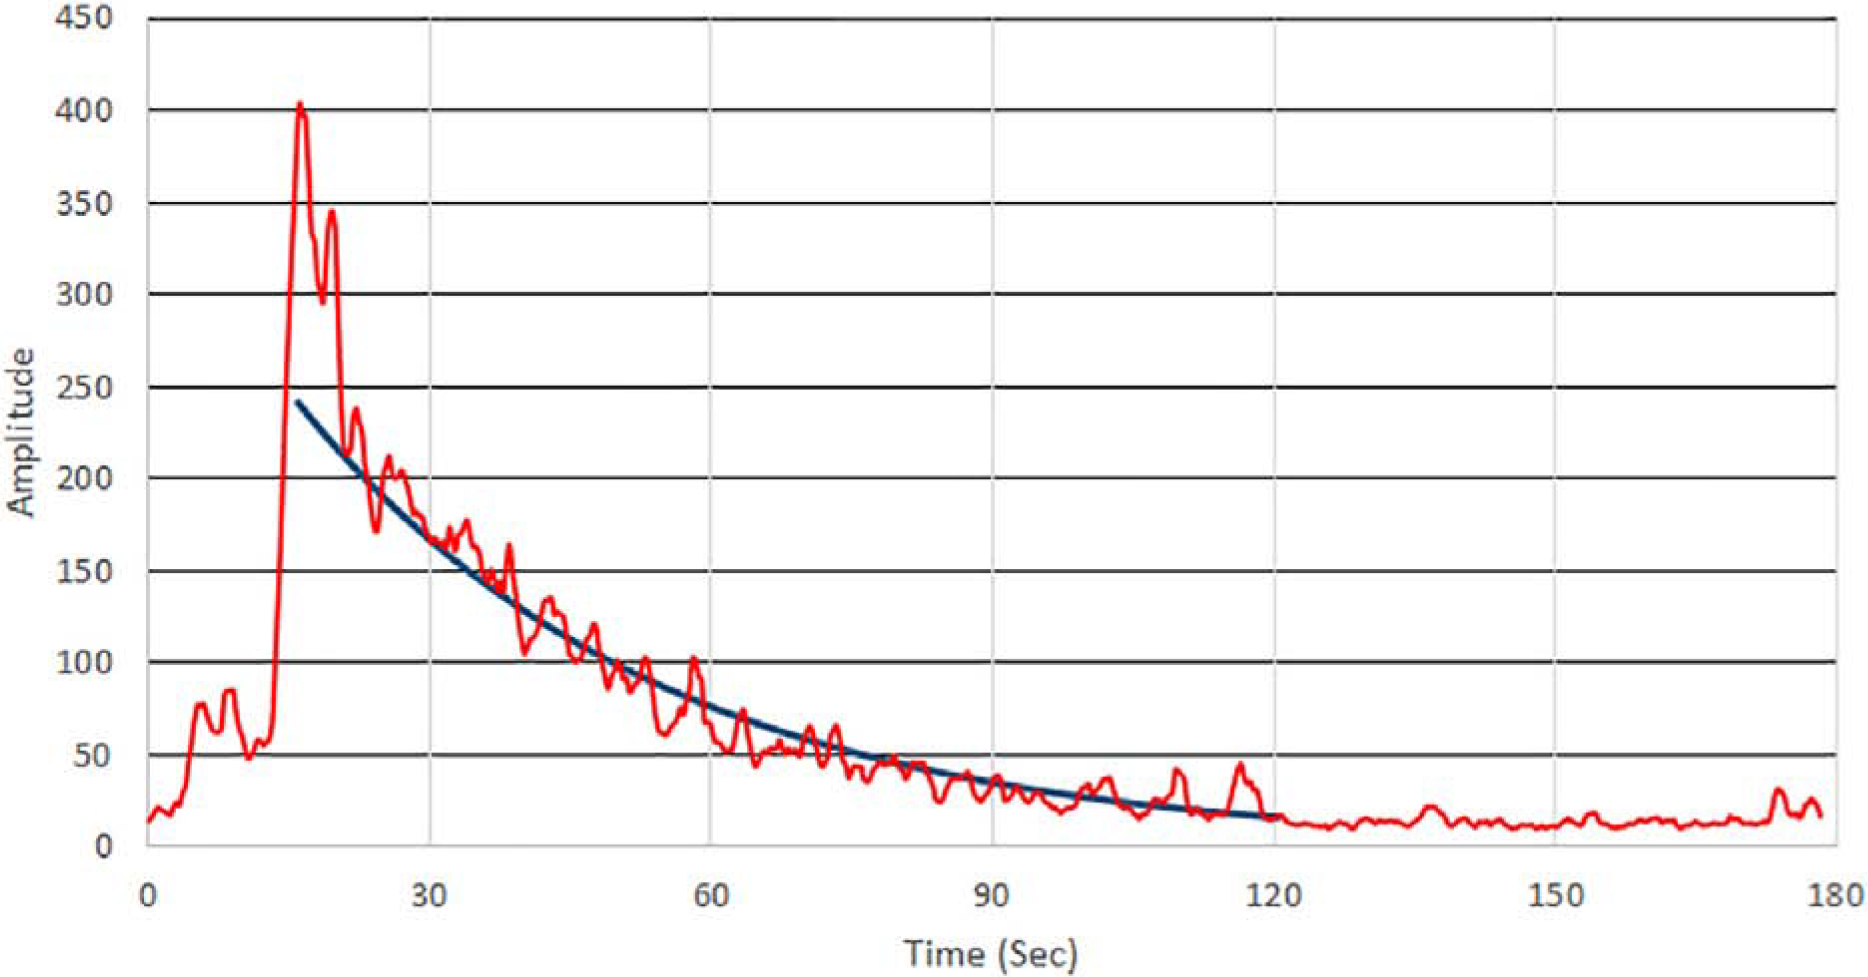
Total power Doppler intensity in the image plane pre/post contrast injection. The best-fit exponential from peak contrast is superimposed, indicting a time-constant of 38 seconds for the decay curve in this representative experiment.
3.5. Transit time:
Figure 6 plots mean power Doppler pixel intensity in an artery and vein derived from intermediate-mode data for 1 sec immediately after contrast reaches the eye and their normalized running sums, , where I(1) represents intensity at 1 sec after peak. Note the suggestion of cyclic brightening (roughly 6 cycles/sec) in the artery, which may result from the pulsatility of arterial versus venous flow, but also irregular mixing of the contrast bolus with blood as it first enters the eye. The integral plots show that the rise in accumulated power Doppler in the artery rises before that of the vein. On average from six trials, the transit time from the tail vein to the eye was 5.1±2.5 sec and arteriovenous ocular transit time as calculated by equation 1 averaged 0.23±0.07 sec.
Figure 6.
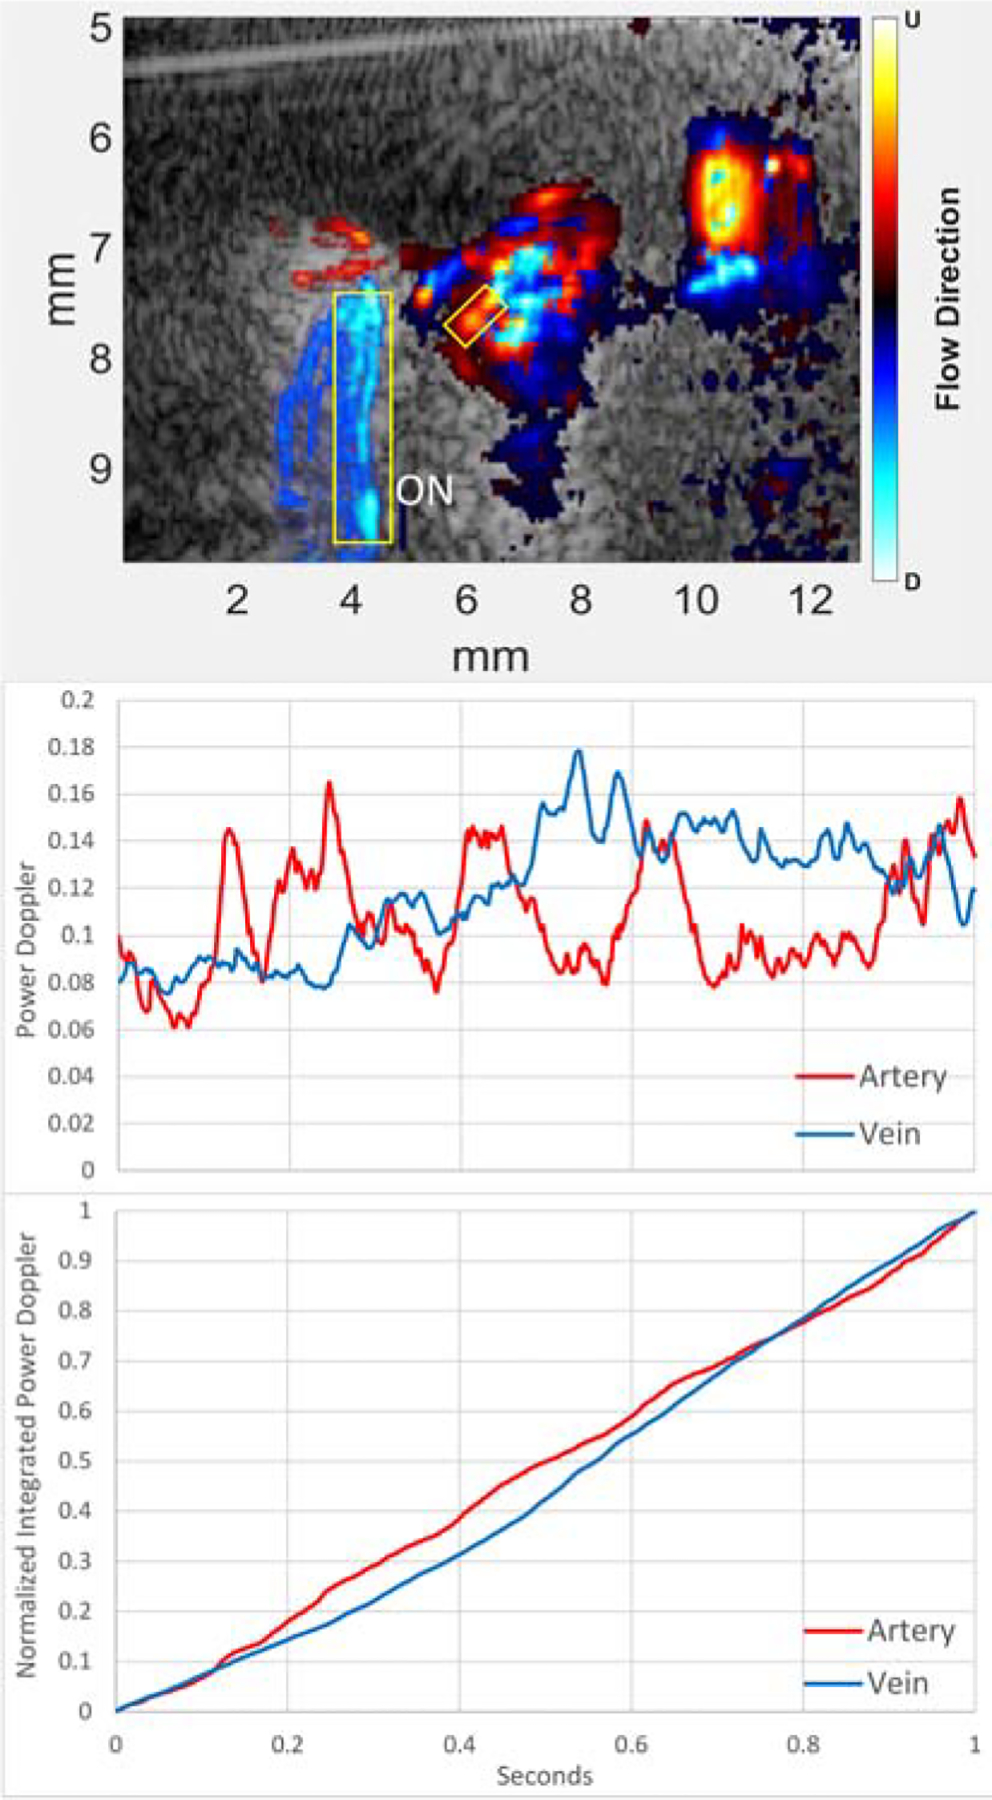
(Top) Representative B-mode directional power Doppler image with contrast. The analyzed regions in the plots below are indicated by boxes over an artery (red) and vein (blue) in the image. As the vessels are outside the optic nerve (ON), we identify them as a long posterior ciliary artery and a vortex vein. Middle: Plot of arterial and venous mean power Doppler intensity with time for 1 second immediately after contrast reaches the eye. Note the suggestion of pulsatility in the power Doppler in the artery versus the relatively smooth venous plot. Bottom: Normalized running sums of Doppler power. The arterial curve increases faster than that of the vein, indicative of contrast entering the artery before the vein. (Note that, by definition, the normalized integrated plots merge at t=0 and t=1 sec.)
4.0. Discussion
We have previously described our methods for 18 MHz plane-wave ultrasound for imaging and measurement of blood-flow, with validation using flow channel and rotating phantoms (Ketterling et al., 2016) and application to the human eye in vivo (Urs et al., 2016, 2018). In this report, we explored the feasibility of plane-wave ultrasound imaging of the retrobulbar vessels supplying the rat eye with and without contrast. The introduction of contrast microbubbles into the general circulation provided a major increase in the Doppler signal with consequent improvement in visualization of the retrobulbar vessels as well as the retina/choroid. The capacity of these ultrasound methods to image blood-flow through optically opaque media is advantageous with respect to OCT, although spatial resolution is an order of magnitude poorer.
Contrast agent introducing into the tail vein will enter the right heart, the pulmonary circulation, return to the left heart and from there to the aorta, brachycephalic and the carotid arteries before entering the eye. We observed a time-delay of ~5 seconds between injection into the tail-vein and appearance of contrast in the eye. Upon entering the eye, the contrast signal reaches a peak in ~3 seconds, but spectrograms obtained at this point are irregular, possibly due to incomplete mixing. By 45 seconds (at which point extensive recirculation will have occurred) the signal is still significantly enhanced and the spectrogram more regular. While velocities can be readily measured in prominent vessels without contrast, the introduction of contrast will enable imaging and assessment of flow dynamics in smaller vessels.
Using fluorescein in humans, transit time from the point of injection in the cephalic arm vein to the eye (~ 15 seconds) and arteriovenous ocular transit time (~2 seconds) have been shown to be increased in coronary slow-flow disease (Taha, et al., 2018); Koc, et al., 2013). In the rat, we found these to measure approximately 5 and 0.2 seconds, respectively. Prolonged ocular transit time might be a useful indicator of microvascular changes which might occur in ocular hypertension, glaucoma, diabetes and other conditions.
There are several limitations of our technique: The rat orbital vasculature is quite complex and variable in its 3D anatomy. At present, images are solely cross-sectional, which limits our ability to capture orbital vascular anatomy since vessels cannot be tracked outside the imaged plane. Furthermore, unlike OCT, the ultrasound technique does not offer a co-registered fundus image, making interpretation and reproducibility of flow in specific vessels challenging. Although ultrasound offers visualization of retrobulbar tissues, resolution at 18 MHz is an order of magnitude poorer than that of OCT. The relatively large lens of the rat eye both absorbs (attenuating) and refracts (defocusing) ultrasound, reducing image quality. Lastly, it should be noted that while our methods allow measurement of flow velocity, volumetric flow cannot be determined because vessel lumens are unresolved.
We are now developing more advanced methods to further exploit this methodology and to achieve higher resolution. Higher frequency probes can improve resolution: at 18 MHz, wavelength is approximately 80 μm, whereas wavelength would be 50 μm at 30 MHz. Another approach, ‘super-resolution’, can improve spatial resolution by an order of magnitude in depiction of flow by tracking the centroids of individual microbubbles as they move through the microvasculature (Errico, et al., 2015). The use of non-linear (harmonic) ultrasound methods would allow improved distinction of contrast microbubbles from normal tissues, as resonances at double and half the transmission frequency are readily produced as the bubbles interact with the acoustic field (Ketterling and Silverman, 2019).
While this report focused on the use of contrast in experimental preclinical models, it should be noted that microbubble contrast agents are commonly used in clinical specialties other than ophthalmology, especially in cardiovascular imaging (Bloomley, et al., 2001; Mehta, et al., 2017). Given its advantages, contrast-enhanced plane-wave ultrasound may ultimately find clinical application in ophthalmology as well.
Supplementary Material
Highlights.
Blood-flow in the retrobulbar vessels of the rat eye was visualized using plane-wave ultrasound
Spectrograms allowed determination of arterial and venous velocities over the cardiac cycle
Intravenous contrast microbubbles enhanced visualization of blood-flow
After initial peak, contrast enhancement declined exponentially.
Tail-vein to eye and arteriovenous ocular transit time were measured.
Grant Support:
Supported by National Institutes of Health Grants EY028550, HD097485, EB022950, and P30 EY019007 (Core Facilities for Vision Research) and an unrestricted grant to the Department of Ophthalmology of Columbia University from Research to Prevent Blindness.
Footnotes
Publisher's Disclaimer: This is a PDF file of an unedited manuscript that has been accepted for publication. As a service to our customers we are providing this early version of the manuscript. The manuscript will undergo copyediting, typesetting, and review of the resulting proof before it is published in its final form. Please note that during the production process errors may be discovered which could affect the content, and all legal disclaimers that apply to the journal pertain.
References:
- Axel L 1980. Cerebral blood flow determination by rapid-sequence computed tomography: theoretical analysis. Radiology. 137(3):679–86. [DOI] [PubMed] [Google Scholar]
- Baun J 2017. Contrast-enhanced ultrasound: a technology primer. J. Diag. Med. Sonog 33(6) 446–452. [Google Scholar]
- Bernstein SL, Guo Y, Kelman SE, et al. 2003. Functional and cellular responses in a novel rodent model of anterior ischemic optic neuropathy. Invest. Ophthalmol.Vis. Sci 44:4153–62. [DOI] [PubMed] [Google Scholar]
- Bhutto IA, Amemiya T 2001. Microvascular architecture of the rat choroid: corrosion cast study. Anat. Rec 264(1):63–71. [DOI] [PubMed] [Google Scholar]
- Blomley MJ, Cooke JC, Unger EC, et al. 2001. Microbubble contrast agents: a new era in ultrasound. BMJ. 322(7296):1222–1225. [DOI] [PMC free article] [PubMed] [Google Scholar]
- Danylkova NO, Pomeranz HD, Alcalaa SR, McLoon LK 2006. Histological and morphometric evaluation of transient retinal and optic nerve ischemia in rat. Brain Res. 1096:20–9. [DOI] [PubMed] [Google Scholar]
- Demene C, Deffieux T, Pernot M, et al. 2015. Spatiotemporal clutter filtering of ultrafast ultrasound data highly increases Doppler and fUltrasound sensitivity. IEEE Trans. Med. Imaging 34(11):2271–2285. [DOI] [PubMed] [Google Scholar]
- Errico C, Pierre J, Pezet S, et al. 2015. Ultrafast ultrasound localization microscopy for deep super-resolution vascular imaging. Nature 527:499–502. [DOI] [PubMed] [Google Scholar]
- Hariri S, Tam M, Lee D, et al. 2013. Noninvasive imaging of the early effect of sodium iodate toxicity in a rat model of outer retina degeneration with spectral domain optical coherence tomography. J. Biomed. Opt 18(2):026017. [DOI] [PubMed] [Google Scholar]
- Janes RG, Bounds GW 1955. The blood vessels of the rat’s eye. Am. J. Anat 96(3):357–73. [DOI] [PubMed] [Google Scholar]
- Kathpalia A, Karabiyik Y, Simensen B, et al. 2015. A robust Doppler spectral envelope detection technique for automated blood flow measurements. Proc. IEEE Int. Ultrason. Symp 2015, pp. 1–4. [Google Scholar]
- Ketterling JA, Urs R, Silverman RH 2016. In vivo imaging of ocular blood flow using high-speed ultrasound. IEEE Int. Ultrason. Symp 2016. [DOI] [PMC free article] [PubMed] [Google Scholar]
- Ketterling JA, Silverman RH 2019. High-frequency multi-pulse, plane-wave acoustic contrast imaging. IEEE Trans. Ultrason. Ferroelectr. Freq. Control Epub ahead of print. [DOI] [PMC free article] [PubMed] [Google Scholar]
- Koc S, Ozin B, Altin G, et al. 2013. Evaluation of circulation disorder in coronary slow flow by fundus fluorescein angiography. Am. J. Card 111(11):1552–1556. [DOI] [PubMed] [Google Scholar]
- Markovets AM, Saprunova VB, Zhdankina AA, et al. 2011. Alterations of retinal pigment epithelium cause AMD-like retinopathy in senescence-accelerated OXYS rats. Aging (Albany NY). 3(1):44–54. [DOI] [PMC free article] [PubMed] [Google Scholar]
- Mehta KS, Lee JJ, Taha AG, et al. 2017. Vascular applications of contrast-enhanced ultrasound imaging. J. Vasc. Surg 66(1):266–274. [DOI] [PubMed] [Google Scholar]
- Mischi M, Kalker TA, Korsten EH 2014. Contrast echocardiography for pulmonary blood volume quantification. IEEE Trans. Ultrason. Ferroelectr. Freq. Control 51(9):1137–47. [DOI] [PubMed] [Google Scholar]
- Morrison JC, Johnson EC, Cepurna WO, Funk RHW 1999. Microvasculature of the rat optic nerve head. Invest. Ophthalmol. Vis. Sci 40:1702–1709. [PubMed] [Google Scholar]
- Morrison JC, Johnson EC, Cepurna WO 2018. Hypertonic saline injection model of experimental glaucoma in rats In: Jakobs T (eds) Glaucoma. Methods in Molecular Biology, vol 1695 Humana Press, New York, NY. [DOI] [PubMed] [Google Scholar]
- Mosinger JL, Olney JW 1989. Photothrombosis-induced ischemic neuronal degeneration in the rat retina. Exp. Neurol 105:110–3. [DOI] [PubMed] [Google Scholar]
- Podkowa AS, Oelze ML, Ketterling JA 2018. High-frame-rate Doppler ultrasound using a repeated transmit sequence. Appl. Sci 8(2):227. [DOI] [PMC free article] [PubMed] [Google Scholar]
- Rakieten N, Rakieten ML, Nadkarni MV 1963. Studies on the diabetogenic action of streptozotocin (NSC-37917) Cancer chemotherapy reports. 29, 91–8. [PubMed] [Google Scholar]
- Stefanova NA, Kozhevnikova OS, Vitovtov AO, et al. 2014. Senescence-accelerated OXYS rats: a model of age-related cognitive decline with relevance to abnormalities in Alzheimer disease. Cell Cycle. 13(6):898–909. [DOI] [PMC free article] [PubMed] [Google Scholar]
- Sugiyama K, Gu K-B, Kawase C, et al. 1999. Optic nerve and peripapillary choroidal microvasculature of the rat eye. Invest. Ophthalmol. Vis. Sci 40(13):3084–3090. [PubMed] [Google Scholar]
- Taha NM, Asklany HT, Mahmoud AH, et al. 2018. Retinal fluorescein angiography: A sensitive and specific tool to predict coronary slow flow. Egypt. Heart J 70:167–171. [DOI] [PMC free article] [PubMed] [Google Scholar]
- Tanter M, Fink M 2014. Ultrafast imaging in biomedical ultrasound. IEEE Trans. Ultrason. Ferroelectr. Freq. Control 61(1):102–19. [DOI] [PubMed] [Google Scholar]
- Urs R, Ketterling JA, Silverman RH 2016. Ultrafast ultrasound imaging of ocular anatomy and blood flow. Invest. Ophthalmol. Vis. Sci 57(8):3810–6. [DOI] [PMC free article] [PubMed] [Google Scholar]
- Urs R, Ketterling JA, Yu ACH, Lloyd HO, Yiu BYS, Silverman RH 2018. Ultrasound imaging and measurement of choroidal blood flow. Transl. Vis. Sci. Technol 7(5);1–8. [DOI] [PMC free article] [PubMed] [Google Scholar]
Associated Data
This section collects any data citations, data availability statements, or supplementary materials included in this article.


